Market Outlook
July 18, 2016
Market Cues
Domestic Indices
Chg (%)
(Pts)
(Close)
Indian markets are expected to open in green tracking SGX Nifty.
BSE Sensex
(0.4)
(106)
27,837
U.S. markets slipped in light trading, falling for the first time in six days, as investors
Nifty
(0.3)
(24)
8,541
weighed the potential for further gains with shares near records and corporate
Mid Cap
0.1
10
12,125
earnings projected to drop for a fifth quarter.
Small Cap
(0.7)
(89)
11,980
The majority of the European markets ended Friday's session with modest losses.
Bankex
0.3
64
21,721
Travel and leisure stocks were under heavy selling pressure, after an attack drove a
truck into a crowd watching Bastille Day fireworks in the southern French city of
Global Indices
Chg (%)
(Pts)
(Close)
Nice, killing at least 84 people and leaving 100 more injured.
Dow Jones
0.1
10
18,517
Indian markets finished Friday's session slightly lower as TCS and Infosys fell sharply
Nasdaq
(0.1)
(4)
5,030
after unveiling their quarterly earnings.
FTSE
0.2
15
6,669
Nikkei
0.7
112
16,498
News Analysis
Hang Seng
0.5
98
21,659
Review: Infosys, LIC
Shanghai Com
0.0
0
3,054
Prestige Estates
Detailed analysis on Pg2
Advances / Declines
BSE
NSE
Investor’s Ready Reckoner
Advances
985
532
Key Domestic & Global Indicators
Declines
1,717
1,072
Unchanged
191
67
Stock Watch: Latest investment recommendations on 150+ stocks
Refer Pg6 onwards
Volumes (` Cr)
Top Picks
CMP
Target
Upside
BSE
3,914
Company
Sector
Rating
(`)
(`)
(%)
NSE
22,856
Amara Raja
Auto/Auto Ancillary
Buy
873
1,076
23.3
HCL Tech
IT
Buy
717
1,000
39.5
Net Inflows (` Cr)
Net
Mtd
Ytd
LIC Housing
Financials
Buy
525
592
12.7
FII
838
2,982
22,526
Bharat Electronics
Capital Goods
Accumulate
1,253
1,414
12.9
MFs
(42)
(139)
9,205
Navkar Corporation Others
Buy
212
265
25.1
More Top Picks on Pg4
Top Gainers
Price (`)
Chg (%)
Key Upcoming Events
Fortis
170
8.1
Previous
Consensus
Date
Region
Event Description
Reading
Expectations
Tatasteel
373
3.8
July 19 US
Housing Starts
1.164M
1.165M
Cox&Kings
203
3.7
July 19 UK
Jobless claims change
-0.40
3.00
Lichsgfin
525
3.7
July 19 US
Building Permits (Jun)
1.136M
1.150M
Jswsteel
1,630
3.5
July 20 UK
CPI (YoY) (Jun) (%)
0.3
0.4
6.(
More Events on Pg5
Top Losers
Price (`)
Chg (%)
Infy
1,072
(8.8)
Niittech
470
(5.7)
Cyient
472
(4.7)
Dcbbank
100
(4.3)
Jublfood
1,146
(4.0)
As on July 15, 2016
Market Outlook
July 18, 2016
Result Review
Infosys (CMP: `1,072/ TP: `1,374/Upside: 28.2%)
Infosys, posted numbers lower than expected. Company posted a 2.2% sequential
growth in USD revenues to US$2,501mn V/s US$2,548mn expected, mostly
volume lead. In rupee terms, revenues came in at `16,782cr V/s `17,072cr
expected, up 2.2% QoQ. On Constant Currency (CC) terms, the company posted
a 1.7% QoQ growth in the sales front.
In terms of geographies, USA posted a CC QoQ growth of 2.4%, Europe a CC
QoQ growth of 0.3%, ROW a CC QoQ growth of 4.9%, while India dipped CC
QoQ 8.2% during the quarter. In terms of verticals, FSI posted a CC QoQ growth
of 1.7%, MFG & Hi-Tech CC QoQ growth of 2.4%, RCL CC QoQ growth of 0.7%
and ECS CC QoQ growth of 2.4%. On the operating front, EBDITA and EBIT
margins dipped by ~121bp QoQ bps and ~138bps QoQ respectively to end the
period at 26.5% and 24.1% respectively. Consequently, PAT is expected to be at
`3436cr V/s `3,514cr, QoQ de-growth of 4.5%.
In terms of operating matrix, the utilization levels (excluding trainee) were 80.5%
V/s 80.1% in 4QFY2016, while the attrition was 15.8% V/s 12.6% in 4QFY2016
(mainly attributed to seasonality).In client addition 3 clients to US $100mn +
category taking total count to 17. In terms, of guidance the FY2017 revenue
guidance revised to 10.5%-12.0% in constant currency (CC). We maintain our buy
rating on the stock with a target price of `1,374.
Y/E
Sales OPM
PAT
EPS ROE P/E P/BV EV/EBITDA EV/Sales
March
(` cr)
(%)
(` cr)
(`)
(%)
(x)
(x)
(x)
(x)
FY2017E
1,22,770
28.3
27,598
141.0
34.6
16.4
3.6
10.7
2.9
FY2018E
1,38,730
28.3
30,941
158.9
35.5
14.8
3.3
9.3
2.6
LIC Housing (CMP: `525/TP:`592/Upside:12.7%)
LIC Housing has reported a good set of numbers for the quarter. While the
reported PAT grew by only 7%, NII growth was strengthen up by 25%. The
company took additional provisioning to the tune of `90cr due to ageing of some
NPAs in the project loans and hence provisions remained higher at `116.5cr vs
`44.3cr YoY. Loan book grew by 15.4%, backed by strong developer loans which
went up by 39%. Though GNPAs went up to 0.59% from 0.45% it remains under
control and we don’t think this is a cause of concern. We believe loan growth will
pick up in the quarters for LIC housing. At the current market price the stock is
trading at 2.1x its FY18 Adj BV. We maintain BUY rating on the stock and retain
our target price of `592.
Market Outlook
July 18, 2016
Prestige Estates (CMP: `180/ TP: `210/Upside: 16.7%)
Near-completion inventory gives comfort: We expect Prestige’s cash flow strength
(over `5,000cr of receivables) to improve in next 12-18 months, as unsold under-
construction works are nearing completion. This strengthens our view that more
residential units would be delivered in FY2017, than launches witnessed in
FY2016, indicating consolidation in its residential portfolio.
Expansion plans (initial stages) to Pune and Mumbai: With growth in Bangalore
saturating, Prestige as a prudent business move entered areas like Hyderabad,
Chennai and has plans to enter new areas like Pune and Mumbai. For Prestige to
move to next league, we sense entry to Pune and Mumbai to be the right strategy,
as Pune, the second largest market (on volumes front in India) and Mumbai with
the highest realizations would add to its overall growth. We believe meaningful
contribution from these new projects to be seen from FY2018E onwards.
Annuity to double in next 3 years: Prestige earned `447cr from rentals in FY2016
(FY2016 exit rental was at `514cr) and has plans to increase this to nearly `800cr
by FY2018/19E. We anticipate capex of over `3,000cr to complete ongoing and
forthcoming projects, with major funding to be done through debt. In the past,
Prestige has track record where it has brought back areas sold to investors, most
of it at low near-term yields.
Prestige’s plans to grow from the current base by expanding to new cities gives us
comfort that Prestige is expected to report strong growth in FY2018E. Further,
positive Operating Cash Flow cycle and high liquidity comforts us on balance
sheet side. Unsold area in near-completed projects will boost cash flows of the
company. Prestige announced aggressive plans to almost double their rental
income in next 3 years. Accordingly, we expect debt to increase. We recommend
BUY on Prestige Estates with price target of `210.
Y/E
Sales OPM
PAT
EPS ROE P/E P/BV EV/EBITDA EV/Sales
March
(` cr)
(%)
(` cr)
(`)
(%)
(x)
(x)
(x)
(x)
FY2017E
4,707
25.2
387
10.3
10.3
17.4
1.4
10.1
2.6
FY2018E
5,105
26.0
489
13.0
10.2
13.8
1.3
8.9
2.3
*Note: Provisional Estimates
Market Outlook
July 18, 2016
Economic and Political News
RBI allows foreign players to hike stake in Axis, IDFC Bank
WPI rises sharply in June to 1.62%
Ban cash transactions of above `3 lakh to curb black money: SIT
Corporate News
Tata Motors seeks approval to raise `3,000 cr
RJio's launch of 4G services within 2 months
Honda announces 2nd largest recall in India
Quarterly Bloomberg Brokers Consensus Estimate
Exide Industries Ltd. - July 18, 2016
Particulars (` cr)
1QFY17E
1QFY16
y-o-y (%)
4QFY16 q-o-q (%)
Net sales
1,946
1,795
8.4
1,756
10.8
EBITDA
304
266
14.4
267
13.8
EBITDA margin (%)
15.6
14.8
15.2
Net profit
186
155
19.8
178
4.7
Hindustan Unilever Ltd - July 18, 2016
Particulars (` cr)
1QFY17E
1QFY16
y-o-y (%)
4QFY16 q-o-q (%)
Net sales
8,498
7,973
6.6
7,809
8.8
EBITDA
1,658
1,506
10.0
1,467
13.0
EBITDA margin (%)
19.5
18.9
18.8
Net profit
1,157
1,059
9.2
1,090
6.1
Market Outlook
July 18, 2016
Top Picks ★★★★★
Large Cap
Market Cap
CMP
Target
Upside
Company
Rationale
(` Cr)
(`)
(`)
(%)
To outpace battery industry growth due to better technological
Amara Raja Batteries
14,911
873
1,076
23.3
products leading to market share gains in both the automotive
OEM and replacement segments.
Uptick in defense capex by government, coupled with BELs
Bharat Electronics
30,064
1,253
1,414
12.9
strong market positioning, indicate good times ahead for BEL.
HCL Tech
101,151
717
1,000
39.5
Stock is trading at attractive valuations & factors all bad news.
Strong visibility for a robust 20% earnings trajectory, coupled
HDFC Bank
309,784
1,224
1,262
3.2
with high quality of earnings on account of high quality retail
business and strategic focus on highly rated corporates.
Back on the growth trend, expect a long term growth of 14% to
Infosys
246,290
1,072
1,374
28.1
be a US$20bn in FY2020.
Continues to grow its retail loan book at healthy pace with
LIC Housing Fin.
26,497
525
592
12.7
improvement in asset quality. Expect LICHF to post a healthy
loan book which is likely to reflect in a strong earnings growth.
Strong market positioning within the domestic AC markets to
Voltas
10,762
325
407
25.1
continue, EMP business set to revive
Source: Company, Angel Research
Mid Cap
Market Cap
CMP
Target
Upside
Company
Rationale
(` Cr)
(`)
(`)
(%)
Among the top 4 players in the consumer durables segment.
Bajaj Electricals
2,396
237
268
13.0
Improved profitability backed by turn around in E&P segment.
Strong order book lends earnings visibility.
Favourable outlook for AC industry to augur well for Cooling
Blue Star
3,987
443
495
11.7
products business. EMPPAC division's profitability to improve
once operating environment turns around.
With a focus on the low and medium income (LMI) consumer
Dewan Housing
6,282
215
270
25.4
segment, the company has increased its presence in tier-II & III
cities where the growth opportunity is immense.
Strong loan growth backed by diversified loan portfolio and
Equitas Holdings
5,941
177
235
32.7
adequate CAR. ROE & ROA likely to remain decent as risk of
dilution remains low. Attractive valuations considering growth.
Expectations of above average monsoon augurs well for
Goodyear India
1,217
528
631
19.6
Goodyear India as it derives ~50% of its turnover from farm
tyre segment.
Commencement of new projects, downtrend in the interest rate
IL&FS Transport
2,691
82
93
13.7
cycle, to lead to stock re-rating
Economic recovery to have favourable impact on advertising &
Jagran Prakashan
5,875
180
205
14.1
circulation revenue growth. Further, the acquisition of a radio business
(Radio City) would also boost the company's revenue growth.
Speedier execution and speedier sales, strong revenue visibility
Mahindra Lifespace
1,925
469
554
18.1
in short-to-long run, attractive valuations
Massive capacity expansion along with rail advantage at ICD
Navkar Corporation
3,022
212
265
25.1
as well CFS augurs well for the company
Earnings boost on back of stable material prices and
Radico Khaitan
1,207
91
125
37.7
favourable pricing environment. Valuation discount to peers
provides additional comfort
Strong brands and distribution network would boost growth
Siyaram Silk Mills
1,000
1,067
1,347
26.3
going ahead. Stock currently trades at an inexpensive
valuation.
Source: Company, Angel Research
Market Outlook
July 18, 2016
Key Upcoming Events
Result Calendar
Date
Company
July 18, 2016
Exide Industries, HUL
July 19, 2016
UltraTech Cement, Wipro
July 20, 2016
Crompton Greaves
July 21, 2016
HDFC Bank, Cairn India
July 22, 2016
Axis Bank
July 23, 2016
Mphasis, Persistent
July 26, 2016
IDFC, L G Balakrishnan & Bros
July 27, 2016
Asian Paints
July 28, 2016
GSK Pharma
July 29, 2016
Sesa Goa
Source: Bloomberg, Angel Research
Global economic events release calendar
Bloomberg Data
Date
Time
Country Event Description
Unit
Period
Last Reported Estimated
Jul 19, 2016
6:00 PM
US
Housing Starts
Thousands
Jun
1164.00
1165.00
6:00 PM
US
Building permits
Thousands
Jun
1136.00
1150.00
2:00 PM
UK Jobless claims change
% Change
Jun
-0.40
3.00
Jul 20, 2016
2:00 PM
UK CPI (YoY)
% Change
Jun
0.30
0.40
7:30 PM Euro Zone Euro-Zone Consumer Confidence
Value
Jul A
-7.30
(8.00)
Jul 21, 2016
5:15 PM Euro Zone ECB announces interest rates
%
Jul 21
0.00
-
6:00 PM
US
Initial Jobless claims
Thousands
Jul 16
254.00
265.00
7:30 PM
US
Existing home sales
Million
Jun
5.53
5.48
July 22, 2016
1:00 PM Germany PMI Services
Value
Jul P
53.70
53.20
1:00 PM Germany PMI Manufacturing
Value
Jul P
54.50
53.40
2:00 PM
UK PMI Manufacturing
Value
Jul P
52.10
47.50
Jul 26, 2016
7:30 PM
US
Consumer Confidence
S.A./ 1985=100 Jul
98.00
95.25
7:30 PM
US
New home sales
Thousands
Jun
551.00
560.00
Jul 27, 2016
2:00 PM
UK GDP (YoY)
% Change
2Q A
2.00
11:30 PM
US
FOMC rate decision
%
Jul 27
0.50
0.50
Source: Bloomberg, Angel Research
Market Outlook
July 18, 2016
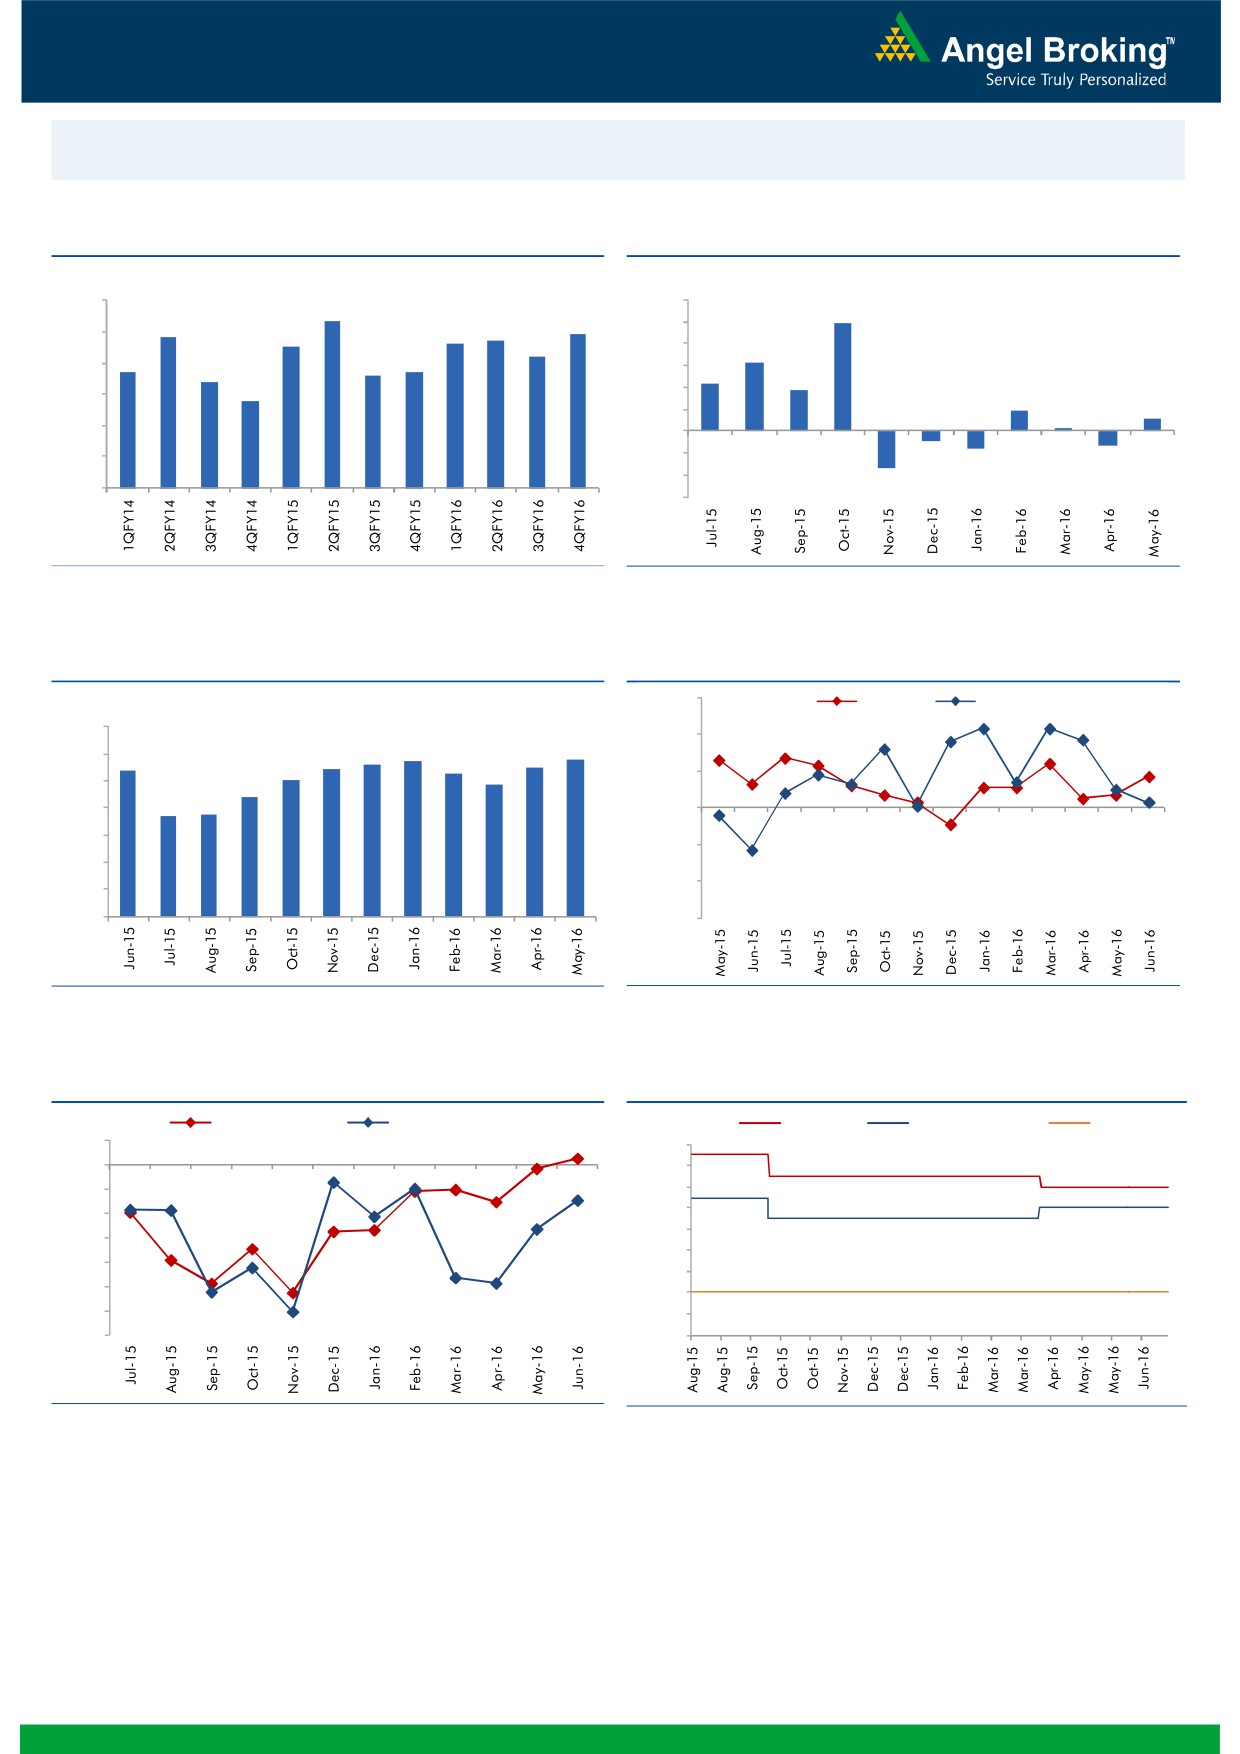
Macro watch
Exhibit 1: Quarterly GDP trends
Exhibit 2: IIP trends
(%)
(%)
9.0
12.0
8.3
9.9
7.8
7.7
7.9
10.0
8.0
7.5
7.6
7.2
8.0
6.3
6.7
6.6
6.7
7.0
6.4
6.0
4.3
3.7
5.8
4.0
6.0
1.9
1.2
2.0
0.3
5.0
-
4.0
(2.0)
(0.9)
(1.3)
(1.6)
(4.0)
3.0
(3.4)
(6.0)
Source: CSO, Angel Research
Source: MOSPI, Angel Research
Exhibit 3: Monthly CPI inflation trends
Exhibit 4: Manufacturing and services PMI
56.0
Mfg. PMI
Services PMI
(%)
7.0
54.0
5.7
5.8
5.4
5.4
5.6
5.5
6.0
5.3
5.0
4.8
52.0
5.0
4.4
3.7
3.7
4.0
50.0
3.0
48.0
2.0
46.0
1.0
-
44.0
Source: MOSPI, Angel Research
Source: Market, Angel Research; Note: Level above 50 indicates expansion
Exhibit 5: Exports and imports growth trends
Exhibit 6: Key policy rates
(%)
Exports yoy growth
Imports yoy growth
(%)
Repo rate
Reverse Repo rate
CRR
5.0
7.50
0.0
7.00
(5.0)
6.50
(10.0)
6.00
5.50
(15.0)
5.00
(20.0)
4.50
(25.0)
4.00
(30.0)
3.50
(35.0)
3.00
Source: Bloomberg, Angel Research
Source: RBI, Angel Research
Market Outlook
July 18, 2016
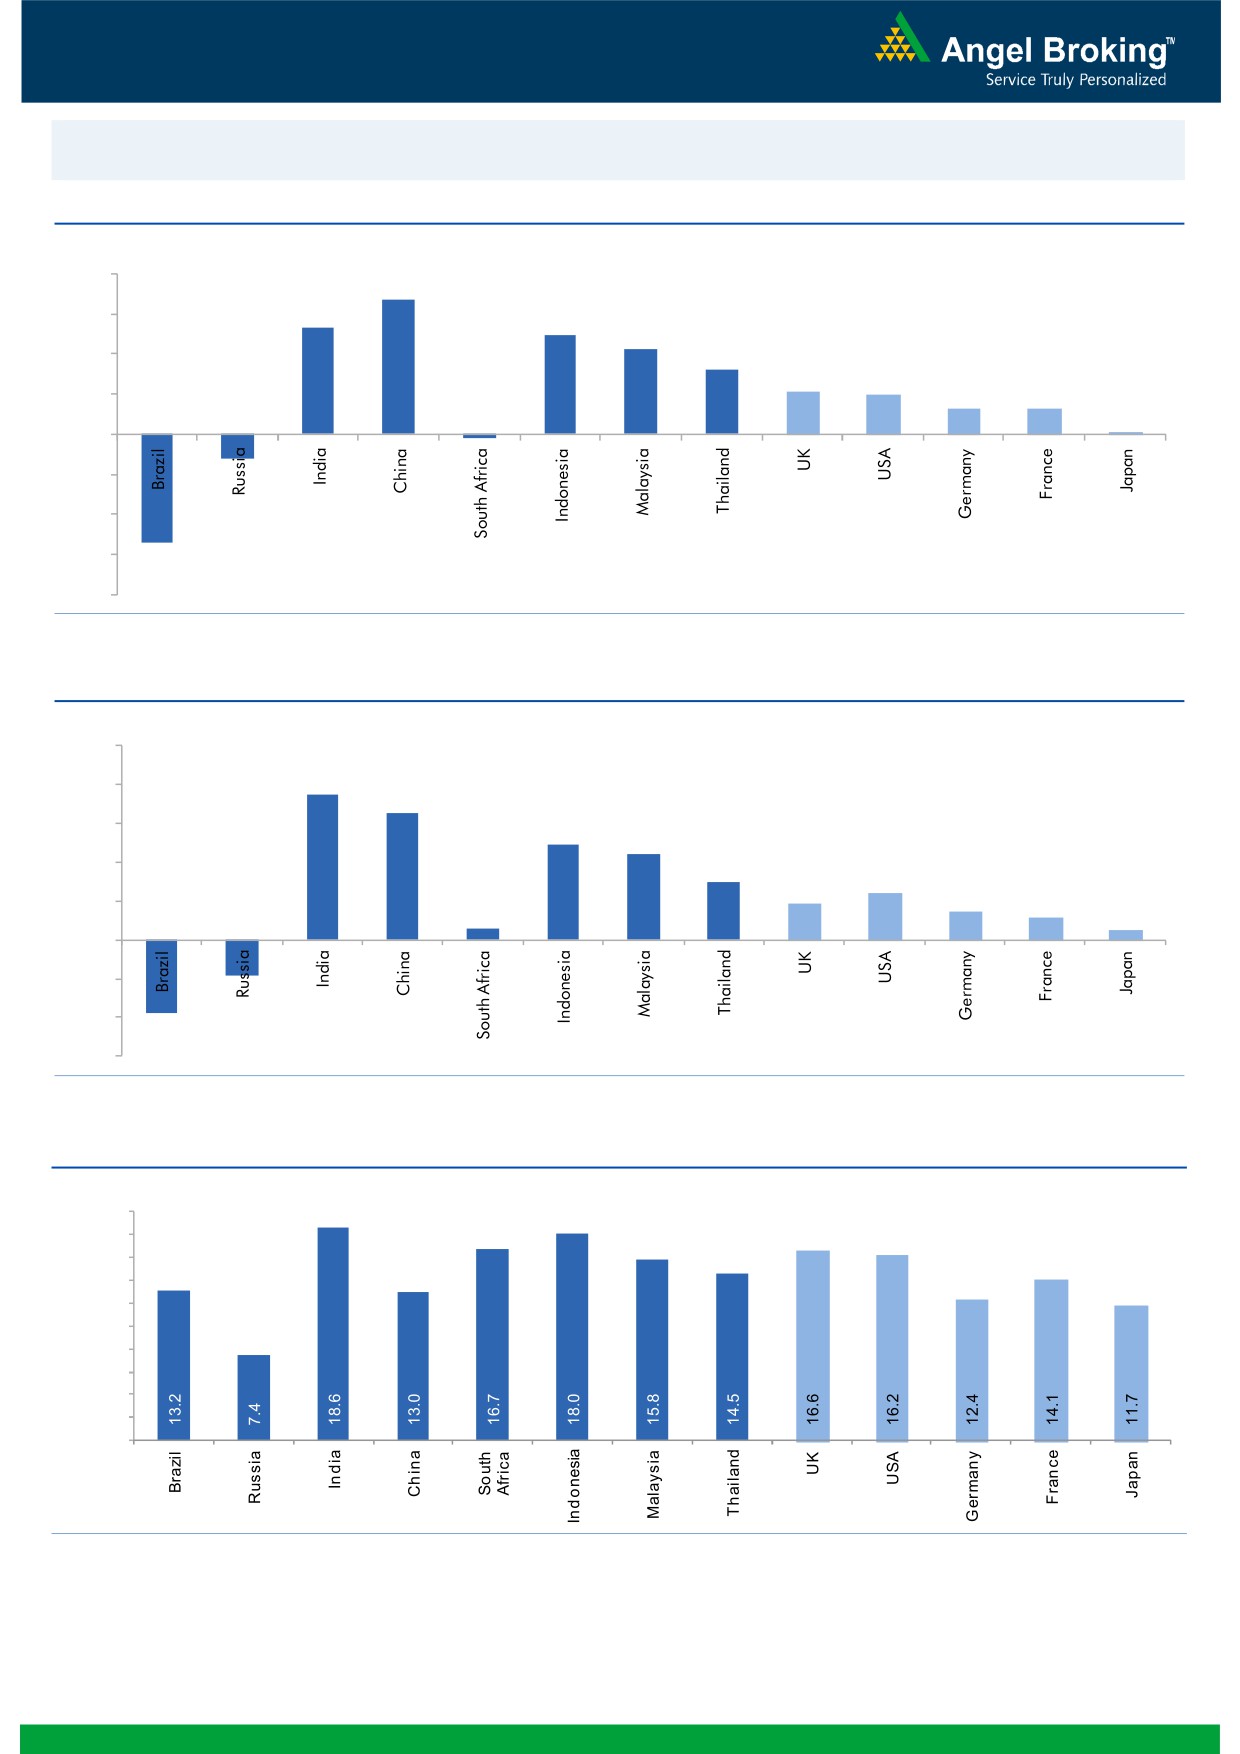
Global watch
Exhibit 1: Latest quarterly GDP Growth (%, yoy) across select developing and developed countries
(%)
8.0
6.7
6.0
5.3
4.9
4.2
4.0
3.2
2.1
2.0
2.0
1.3
1.3
0.1
-
(2.0)
(4.0)
(1.2)
(6.0)
(0.2)
(5.4)
(8.0)
Source: Bloomberg, Angel Research
Exhibit 2: 2016 GDP Growth projection by IMF (%, yoy) across select developing and developed countries
(%)
10.0
7.5
8.0
6.5
6.0
4.9
4.4
4.0
3.0
2.4
1.9
1.5
2.0
1.1
0.6
0.5
(3.8)
(1.8)
-
(2.0)
(4.0)
(6.0)
Source: IMF, Angel Research
Exhibit 3: One year forward P-E ratio across select developing and developed countries
(x)
20.0
18.0
16.0
14.0
12.0
10.0
8.0
6.0
4.0
2.0
-
Source: IMF, Angel Research
Market Outlook
July 18, 2016
Exhibit 4: Relative performance of indices across globe
Returns (%)
Country
Name of index
Closing price
1M
3M
1YR
Brazil
Bovespa
55,578
13.6
6.0
5.7
Russia
Micex
1,941
2.7
2.2
18.3
India
Nifty
8,541
5.3
10.8
2.6
China
Shanghai Composite
3,054
5.8
(0.4)
(18.1)
South Africa
Top 40
46,454
2.3
(0.4)
(1.0)
Mexico
Mexbol
46,713
3.8
3.8
3.1
Indonesia
LQ45
877
3.9
3.8
4.6
Malaysia
KLCI
1,668
1.7
(2.7)
(2.6)
Thailand
SET 50
943
4.0
7.9
(3.3)
USA
Dow Jones
18,517
4.8
3.3
2.4
UK
FTSE
6,669
11.8
4.8
(1.8)
Japan
Nikkei
16,498
3.6
3.6
(19.0)
Germany
DAX
10,067
4.8
0.2
(13.3)
France
CAC
4,373
4.8
(3.0)
(13.5)
Source: Bloomberg, Angel Research
Stock Watch
July 18, 2016
Company Name
Reco
CMP
Target
Mkt Cap
Sales ( Čcr )
OPM(%)
EPS (Č)
PER(x)
P/BV(x)
RoE(%)
EV/Sales(x)
(Č)
Price ( Č)
( Č cr )
FY16E FY17E
FY16E
FY17E
FY16E
FY17E
FY16E
FY17E
FY16E
FY17E
FY16E
FY17E
FY16E
FY17E
Agri / Agri Chemical
Rallis
Neutral
210
-
4,078
1,612
1,911
13.3
13.3
7.4
9.5
28.3
22.1
4.5
4.1
16.7
18.4
2.6
2.2
United Phosphorus
Buy
566
684
24,248
13,083
15,176
18.5
18.5
31.5
37.4
18.0
15.1
3.6
3.0
21.4
21.4
2.0
1.7
Auto & Auto Ancillary
Ashok Leyland
Buy
92
111
26,097
17,995
21,544
11.4
11.6
3.4
4.7
27.0
19.5
4.7
4.4
17.7
22.2
1.4
1.2
Bajaj Auto
Neutral
2,688
-
77,793
22,709
25,860
20.9
20.1
129.0
143.6
20.8
18.7
6.4
5.5
30.7
29.4
2.9
2.5
Bharat Forge
Buy
728
875
16,942
7,351
8,318
19.9
19.7
31.2
36.5
23.3
19.9
4.2
3.5
19.3
19.2
2.5
2.2
Eicher Motors
Neutral
19,781
-
53,728
15,556
16,747
15.5
17.3
464.8
597.5
42.6
33.1
15.5
11.4
36.2
34.3
3.4
3.1
Gabriel India
Neutral
102
-
1,466
1,415
1,544
8.7
9.0
4.6
5.4
22.2
18.9
4.0
3.6
18.1
18.9
1.0
0.9
Hero Motocorp
Neutral
3,238
-
64,653
28,244
30,532
15.5
15.9
156.7
168.5
20.7
19.2
8.3
7.0
39.9
36.4
2.1
1.9
Jamna Auto Industries Neutral
175
-
1,399
1,281
1,473
11.2
11.5
7.6
9.2
23.0
19.0
5.8
4.8
25.4
25.2
1.1
1.0
L G Balakrishnan & Bros Neutral
505
-
793
1,254
1,394
11.6
11.8
35.9
41.7
14.1
12.1
1.9
1.7
13.5
13.8
0.7
0.7
Mahindra and Mahindra Neutral
1,465
-
90,978
38,416
42,904
13.7
13.9
54.8
63.4
26.7
23.1
4.1
3.7
15.4
15.8
2.0
1.8
Maruti
Neutral
4,464
-
134,843
57,865
68,104
16.4
16.7
176.3
225.5
25.3
19.8
4.9
4.2
19.4
21.2
2.1
1.7
Minda Industries
Neutral
1,170
-
1,856
2,523
2,890
8.7
9.0
55.0
65.4
21.3
17.9
4.1
3.3
19.3
18.7
0.8
0.7
Motherson Sumi
Accumulate
303
313
40,139
39,343
45,100
8.8
9.1
10.1
12.5
30.0
24.3
9.5
7.5
35.3
34.4
1.1
0.9
Rane Brake Lining
Buy
453
465
358
454
511
11.5
12.0
25.2
31.0
18.0
14.6
2.7
2.4
14.9
16.6
0.8
0.8
Setco Automotive
Neutral
46
-
613
594
741
12.7
13.7
1.7
3.2
27.0
14.3
2.8
2.5
10.4
16.9
1.5
1.3
Tata Motors
Neutral
493
-
142,310
259,686
273,957
13.0
13.4
25.9
29.5
19.0
16.7
2.5
2.2
8.0
9.0
0.7
0.7
TVS Motor
Accumulate
307
330
14,566
11,263
13,122
6.9
8.5
9.2
15.0
33.3
20.4
7.6
6.1
22.7
29.6
1.3
1.1
Amara Raja Batteries
Buy
873
1,076
14,911
4,690
5,429
17.5
17.5
28.5
35.3
30.7
24.7
7.1
5.8
23.1
25.9
3.1
2.7
Exide Industries
Neutral
180
-
15,283
6,950
7,784
14.4
14.8
6.6
7.3
27.2
24.6
3.4
3.1
12.6
12.8
1.9
1.7
Apollo Tyres
Buy
157
183
7,987
12,056
12,714
17.2
16.4
23.0
20.3
6.8
7.7
1.2
1.1
17.7
13.6
0.7
0.7
Ceat
Buy
860
1,119
3,479
6,041
6,597
14.1
13.7
99.5
111.9
8.6
7.7
1.7
1.4
19.6
18.5
0.7
0.6
JK Tyres
Neutral
90
-
2,036
7,446
7,669
15.2
14.0
19.6
18.4
4.6
4.9
1.2
1.0
25.2
19.5
0.7
0.6
Swaraj Engines
Neutral
1,143
-
1,420
552
630
14.2
14.7
44.6
54.1
25.6
21.1
6.0
5.4
23.2
25.6
2.4
2.1
Subros
Neutral
92
-
553
1,293
1,527
11.8
11.9
4.2
6.7
22.0
13.8
1.7
1.5
7.7
11.5
0.8
0.6
Indag Rubber
Neutral
189
-
495
283
329
17.0
17.2
13.0
15.4
14.6
12.2
3.2
2.6
21.8
21.6
1.5
1.2
Capital Goods
ACE
Neutral
44
-
437
660
839
4.7
8.2
1.0
3.9
44.2
11.3
1.4
1.2
3.2
11.3
0.8
0.7
BEML
Buy
941
1,157
3,919
3,277
4,006
6.0
8.9
36.2
64.3
26.0
14.6
1.8
1.6
5.7
11.7
1.2
0.9
Bharat Electronics
Accumulate
1,253
1,414
30,064
7,295
8,137
20.0
16.8
56.5
58.7
22.2
21.3
3.3
2.9
42.1
44.6
3.4
2.9
Stock Watch
July 18, 2016
Company Name
Reco
CMP
Target
Mkt Cap
Sales ( Čcr )
OPM(%)
EPS (Č)
PER(x)
P/BV(x)
RoE(%)
EV/Sales(x)
(Č)
Price ( Č)
( Č cr )
FY16E
FY17E
FY16E
FY17E
FY16E
FY17E
FY16E
FY17E
FY16E
FY17E
FY16E
FY17E
FY16E
FY17E
Capital Goods
Voltas
Buy
325
407
10,762
5,857
6,511
7.5
7.9
11.7
12.9
27.8
25.2
4.5
4.0
17.1
16.7
1.8
1.6
BGR Energy
Neutral
122
-
881
3,615
3,181
9.5
9.4
16.7
12.4
7.3
9.8
0.7
0.7
10.0
7.0
0.7
0.8
BHEL
Neutral
143
-
34,952
33,722
35,272
10.8
11.7
10.5
14.2
13.6
10.1
1.0
1.0
7.0
9.0
1.1
1.0
Blue Star
Accumulate
443
495
3,987
3,770
4,351
5.7
6.4
11.4
17.2
38.8
25.8
6.0
5.6
18.4
23.1
1.1
1.0
Crompton Greaves
Neutral
70
-
4,400
13,484
14,687
4.9
6.2
4.5
7.1
15.6
9.9
1.1
1.0
7.2
10.8
0.5
0.4
Greaves Cotton
Neutral
141
-
3,441
1,655
1,755
16.6
16.8
7.4
7.8
19.0
18.1
3.8
3.6
21.1
20.6
2.1
2.0
Inox Wind
Buy
231
286
5,121
4,406
5,605
15.5
15.7
20.4
24.8
11.3
9.3
2.6
1.9
27.9
25.9
1.4
1.1
KEC International
Neutral
142
-
3,662
8,791
9,716
6.1
6.8
5.4
8.2
26.4
17.4
2.6
2.4
10.0
14.0
0.6
0.6
Thermax
Neutral
910
-
10,838
6,413
7,525
7.4
8.5
30.5
39.3
29.8
23.1
4.6
4.0
15.0
17.0
1.6
1.3
VATech Wabag
Accumulate
599
681
3,263
2,722
3,336
7.9
8.1
19.5
24.6
30.7
24.3
3.2
2.9
11.1
12.4
1.3
1.1
Cement
ACC
Neutral
1,614
-
30,304
13,151
14,757
16.4
18.3
63.9
83.4
25.3
19.4
3.3
3.0
13.3
16.1
2.2
1.8
Ambuja Cements
Neutral
261
-
40,489
11,564
12,556
19.4
20.7
8.9
10.1
29.3
25.8
3.7
3.5
12.8
13.8
3.1
2.9
HeidelbergCement
Neutral
120
-
2,708
1,772
1,926
13.3
15.4
1.0
3.0
119.5
39.8
3.0
2.8
2.6
7.9
2.1
1.9
India Cements
Neutral
115
-
3,523
4,216
4,840
18.0
19.5
4.0
9.9
28.7
11.6
1.1
1.1
4.0
9.5
1.2
1.0
JK Cement
Neutral
709
-
4,959
3,661
4,742
10.1
15.8
7.5
28.5
94.6
24.9
2.8
2.5
7.5
22.9
1.8
1.4
J K Lakshmi Cement
Neutral
397
-
4,671
2,947
3,616
16.7
19.9
11.5
27.2
34.5
14.6
3.3
2.8
9.8
20.8
2.0
1.6
Mangalam Cements
Neutral
306
-
817
1,053
1,347
10.5
13.3
8.4
26.0
36.5
11.8
1.5
1.4
4.3
12.5
1.1
0.9
Orient Cement
Neutral
177
-
3,626
1,854
2,524
21.2
22.2
7.7
11.1
23.0
16.0
3.3
2.9
13.3
15.7
2.8
1.9
Ramco Cements
Neutral
565
-
13,448
4,036
4,545
20.8
21.3
15.1
18.8
37.4
30.1
4.6
4.1
12.9
14.3
3.9
3.4
Shree Cement^
Neutral
15,715
-
54,746
7,150
8,742
26.7
28.6
228.0
345.5
68.9
45.5
10.2
8.5
15.7
20.3
7.6
6.1
UltraTech Cement
Neutral
3,525
-
96,730
24,669
29,265
18.2
20.6
82.0
120.0
43.0
29.4
4.6
4.1
11.3
14.7
3.9
3.3
Construction
ITNL
Accumulate
82
93
2,691
7,360
8,682
34.0
32.2
7.0
8.6
11.7
9.5
0.4
0.4
3.2
2.5
3.7
3.6
KNR Constructions
Accumulate
567
603
1,596
937
1,470
14.3
14.0
44.2
38.6
12.8
14.7
2.6
2.2
15.4
15.4
1.8
1.2
Larsen & Toubro
Accumulate
1,586
1,700
147,816
58,870
65,708
8.3
10.3
42.0
53.0
37.8
29.9
2.6
2.4
8.8
11.2
2.7
2.4
Gujarat Pipavav Port
Neutral
180
-
8,697
629
684
51.0
52.2
6.4
5.9
28.1
30.5
3.7
3.4
15.9
12.7
13.8
12.5
MBL Infrastructures
Buy
144
285
599
2,313
2,797
12.2
14.6
19.0
20.0
7.6
7.2
0.8
0.7
11.3
10.6
1.0
0.9
Nagarjuna Const.
Neutral
80
-
4,442
7,892
8,842
8.8
9.1
3.0
5.3
26.6
15.1
1.3
1.2
5.0
8.5
0.8
0.7
PNC Infratech
Accumulate
571
647
2,930
1,873
2,288
13.2
13.5
24.0
32.0
23.8
17.8
2.3
2.1
12.1
12.3
1.7
1.4
Simplex Infra
Neutral
304
-
1,504
5,955
6,829
10.3
10.5
16.0
31.0
19.0
9.8
1.0
0.9
5.3
9.9
0.8
0.7
Stock Watch
July 18, 2016
Company Name
Reco
CMP
Target
Mkt Cap
Sales ( Čcr )
OPM(%)
EPS (Č)
PER(x)
P/BV(x)
RoE(%)
EV/Sales(x)
(Č)
Price ( Č)
( Č cr )
FY16E
FY17E
FY16E
FY17E
FY16E
FY17E
FY16E
FY17E
FY16E
FY17E
FY16E
FY17E
FY16E
FY17E
Construction
Power Mech Projects
Neutral
561
-
825
1,539
1,801
12.8
12.7
59.0
72.1
9.5
7.8
1.4
1.2
18.6
16.8
0.5
0.5
Sadbhav Engineering
Neutral
300
-
5,146
3,186
3,598
10.2
10.3
8.0
9.0
37.5
33.3
3.5
3.1
9.4
9.9
1.9
1.7
NBCC
Neutral
245
-
14,724
5,838
7,428
6.0
7.9
5.2
8.2
47.2
29.9
1.5
1.2
21.9
28.2
2.5
1.8
MEP Infra
Neutral
45
-
731
1,956
1,876
28.1
30.5
1.3
3.0
34.6
15.0
7.3
4.9
21.2
32.8
1.8
1.8
SIPL
Neutral
100
-
3,538
675
1,042
62.4
64.7
-
-
3.8
4.3
-
-
17.0
11.4
Engineers India
Neutral
207
-
6,990
1,667
1,725
13.5
16.0
9.7
11.4
21.4
18.2
2.5
2.4
11.7
13.4
3.1
3.1
Financials
Allahabad Bank
Neutral
79
-
5,719
8,569
9,392
2.8
2.9
16.3
27.5
4.9
2.9
0.5
0.4
7.6
11.9
-
-
Axis Bank
Neutral
565
-
134,792
26,204
29,738
3.6
3.5
34.5
35.4
16.4
15.9
2.6
2.3
16.8
14.9
-
-
Bank of Baroda
Neutral
165
-
37,903
18,802
21,088
2.0
2.2
(7.4)
13.0
12.6
1.3
1.0
(4.2)
7.3
-
-
Bank of India
Neutral
115
-
10,718
15,972
17,271
1.9
2.0
15.3
33.4
7.5
3.4
0.3
0.3
3.6
7.6
-
-
Canara Bank
Neutral
257
-
13,947
15,441
16,945
2.0
2.1
46.6
70.4
5.5
3.7
0.5
0.4
8.0
11.2
-
-
Dena Bank
Neutral
41
-
2,738
3,440
3,840
2.1
2.3
7.3
10.0
5.7
4.1
0.4
0.4
6.1
7.9
-
-
Dewan Housing Finance Buy
215
270
6,282
1,828
2,225
2.9
3.0
24.9
29.7
8.7
7.3
1.3
1.2
15.1
16.1
-
-
Equitas Holdings
Buy
177
235
5,941
679
1,076
12.4
11.7
6.2
6.7
28.6
26.4
3.6
2.6
13.3
12.5
-
-
Federal Bank
Neutral
62
-
10,601
3,279
3,787
2.8
2.9
3.9
5.5
15.7
11.2
1.3
1.2
8.4
10.8
-
-
HDFC
Neutral
1,360
-
215,051
10,358
11,852
3.3
3.3
41.1
47.0
33.1
28.9
6.3
5.7
24.7
24.9
-
-
HDFC Bank
Accumulate
1,224
1,262
309,784
38,606
47,696
4.4
4.5
48.8
61.4
25.1
19.9
4.3
3.7
18.7
20.0
-
-
ICICI Bank
Neutral
265
-
154,265
34,279
39,262
3.3
3.3
21.0
24.4
12.6
10.9
2.1
1.8
14.4
14.7
-
-
IDBI Bank
Neutral
75
-
15,379
9,625
10,455
1.8
1.8
8.5
14.2
8.8
5.3
0.5
0.5
5.9
9.3
-
-
Indian Bank
Neutral
157
-
7,536
6,160
6,858
2.5
2.5
24.5
29.8
6.4
5.3
0.5
0.5
7.7
8.6
-
-
LIC Housing Finance
Accumulate
525
592
26,497
3,179
3,758
2.6
2.6
32.9
40.6
16.0
12.9
3.0
2.5
19.6
20.7
-
-
Oriental Bank
Neutral
122
-
4,230
7,643
8,373
2.4
2.4
37.2
45.4
3.3
2.7
0.3
0.3
8.2
9.4
-
-
Punjab Natl.Bank
Neutral
136
-
26,705
23,122
26,022
2.8
2.8
7.0
21.6
19.4
6.3
1.0
0.9
3.4
10.0
-
-
South Ind.Bank
Neutral
22
-
2,977
1,965
2,185
2.5
2.5
2.5
3.3
8.9
6.7
0.9
0.8
9.5
11.7
-
-
St Bk of India
Neutral
232
-
179,708
79,958
86,061
2.6
2.6
13.4
20.7
17.3
11.2
1.4
1.3
11.5
12.8
-
-
Union Bank
Neutral
140
-
9,614
12,646
14,129
2.3
2.4
31.0
39.1
4.5
3.6
0.5
0.4
9.8
11.4
-
-
Vijaya Bank
Neutral
44
-
4,390
3,536
3,827
1.9
1.9
5.5
6.7
8.0
6.6
0.7
0.6
7.8
8.8
-
-
Yes Bank
Neutral
1,179
-
49,634
7,190
9,011
3.2
3.3
58.2
69.7
20.3
16.9
3.6
3.1
19.2
19.6
-
-
FMCG
Asian Paints
Neutral
1,025
-
98,318
15,534
17,445
17.7
16.8
18.4
19.6
55.8
52.3
19.7
18.6
34.6
35.6
6.2
5.5
Stock Watch
July 18, 2016
Company Name
Reco
CMP
Target
Mkt Cap
Sales ( Čcr )
OPM(%)
EPS (Č)
PER(x)
P/BV(x)
RoE(%)
EV/Sales(x)
(Č)
Price ( Č)
( Č cr )
FY16E FY17E
FY16E
FY17E
FY16E
FY17E
FY16E
FY17E
FY16E
FY17E
FY16E
FY17E
FY16E
FY17E
FMCG
Britannia
Neutral
2,819
-
33,821
8,481
9,795
14.0
14.1
65.5
78.3
43.0
36.0
20.4
16.7
38.3
41.2
4.0
3.4
Colgate
Neutral
927
-
25,217
4,136
4,632
22.5
23.3
22.2
25.3
41.8
36.7
25.4
22.6
68.6
67.5
6.0
5.4
Dabur India
Neutral
312
-
54,824
9,370
10,265
17.6
17.3
7.3
8.1
42.5
38.5
11.0
10.1
31.7
30.6
5.7
5.2
GlaxoSmith Con*
Neutral
6,309
-
26,534
4,519
5,142
19.6
19.8
164.3
191.2
38.4
33.0
10.6
9.1
30.8
29.9
5.2
4.5
Godrej Consumer
Neutral
1,598
-
54,409
9,003
10,335
18.1
18.7
34.1
41.8
46.9
38.2
10.1
8.7
23.9
24.8
6.3
5.5
HUL
Neutral
940
-
203,353
33,299
35,497
17.1
17.1
18.9
20.0
49.7
47.0
43.6
38.0
87.6
80.8
5.8
5.4
ITC
Neutral
249
-
300,442
36,837
39,726
38.8
38.7
8.2
9.0
30.5
27.7
8.5
7.5
27.8
26.9
7.6
7.0
Marico
Neutral
278
-
35,899
6,151
6,966
17.2
17.3
5.4
6.4
51.5
43.5
16.2
12.8
33.2
32.4
5.6
5.0
Nestle*
Neutral
6,629
-
63,912
9,393
10,507
22.2
22.3
106.8
121.8
62.1
54.4
21.8
19.6
34.8
36.7
6.4
5.7
Tata Global
Neutral
133
-
8,369
8,635
9,072
9.8
9.9
5.8
7.2
22.9
18.4
2.0
2.0
6.8
7.4
1.0
1.0
Procter & Gamble
Buy
6,293
7,369
20,427
2,588
2,939
23.3
23.2
130.2
146.2
48.3
43.1
96.4
92.4
27.6
25.3
7.4
6.5
Hygiene
IT
HCL Tech^
Buy
717
1,000
101,151
37,061
30,781
21.5
20.5
51.4
40.0
14.0
17.9
3.6
2.6
20.1
20.3
2.5
2.6
Infosys
Buy
1,072
1,374
246,290
62,441
70,558
27.5
27.5
59.0
65.3
18.2
16.4
3.7
3.3
22.2
22.4
3.8
3.2
TCS
Buy
2,442
3,004
481,159
108,646
122,770
28.3
28.3
123.7
141.0
19.7
17.3
6.5
6.0
33.1
34.6
4.0
3.5
Tech Mahindra
Buy
504
700
48,934
26,494
30,347
16.3
17.0
32.2
37.5
15.7
13.4
3.4
2.9
21.7
21.8
1.6
1.4
Wipro
Buy
555
680
137,038
50,808
56,189
23.7
23.8
37.3
40.7
14.9
13.6
2.8
2.6
19.2
17.7
2.2
1.9
Media
D B Corp
Neutral
383
-
7,042
2,025
2,187
27.4
27.4
17.4
18.9
22.0
20.3
5.0
4.5
22.9
23.7
3.4
3.1
HT Media
Neutral
80
-
1,869
2,495
2,673
12.9
13.2
6.8
7.2
11.8
11.2
0.9
0.9
7.5
7.8
0.4
0.3
Jagran Prakashan
Accumulate
180
205
5,875
2,107
2,355
33.5
28.0
10.1
10.8
17.9
16.6
4.2
3.6
23.3
21.7
2.9
2.6
Sun TV Network
Neutral
391
-
15,389
2,510
2,763
71.8
71.5
21.9
24.8
17.8
15.8
4.2
3.8
22.8
24.3
5.4
4.9
Hindustan Media
Neutral
272
-
1,997
914
1,016
21.7
21.5
21.9
23.3
12.4
11.7
2.2
1.9
18.0
16.2
1.6
1.4
Ventures
Metals & Mining
Coal India
Buy
320
380
201,903
76,167
84,130
19.9
22.3
22.4
25.8
14.3
12.4
5.1
5.0
35.5
41.0
2.0
1.7
Hind. Zinc
Neutral
196
-
82,626
14,641
14,026
50.4
50.4
17.7
16.0
11.1
12.2
1.7
1.6
16.2
13.2
3.3
3.2
Hindalco
Neutral
137
-
28,321
104,356
111,186
8.7
9.5
6.7
11.1
20.4
12.4
0.7
0.7
3.5
5.9
0.8
0.7
JSW Steel
Neutral
1,630
-
39,398
42,308
45,147
16.4
20.7
(10.3)
49.5
32.9
1.8
1.8
(1.0)
5.6
1.9
1.8
NMDC
Neutral
96
-
37,863
8,237
10,893
46.6
44.5
10.0
11.7
9.6
8.2
1.1
0.9
12.5
13.0
4.5
3.4
SAIL
Neutral
50
-
20,630
45,915
53,954
7.2
10.5
1.5
4.4
33.2
11.4
0.5
0.5
2.3
4.1
1.1
1.0
Vedanta
Neutral
163
-
48,428
71,445
81,910
26.2
26.3
12.9
19.2
12.7
8.5
0.9
0.8
7.2
8.9
1.1
0.9
Tata Steel
Neutral
373
-
36,212
126,760
137,307
8.9
11.3
6.4
23.1
58.6
16.2
1.2
1.1
2.0
7.1
0.8
0.8
Stock Watch
July 18, 2016
Company Name
Reco
CMP
Target
Mkt Cap
Sales ( Čcr )
OPM(%)
EPS (Č)
PER(x)
P/BV(x)
RoE(%)
EV/Sales(x)
(Č)
Price ( Č)
( Č cr )
FY16E FY17E
FY16E
FY17E
FY16E
FY17E
FY16E
FY17E
FY16E
FY17E
FY16E
FY17E
FY16E
FY17E
Oil & Gas
Cairn India
Neutral
173
-
32,445
11,323
12,490
49.4
51.0
20.7
20.7
8.4
8.4
0.5
0.5
6.4
6.1
1.8
1.1
GAIL
Neutral
392
-
49,731
64,856
70,933
9.1
9.6
24.0
28.9
16.4
13.6
1.4
1.3
8.8
9.6
0.9
0.8
ONGC
Neutral
230
-
197,161
154,564
145,998
36.8
37.4
20.8
22.6
11.1
10.2
1.0
1.0
10.1
9.7
1.5
1.6
Petronet LNG
Neutral
291
-
21,803
29,691
31,188
5.8
6.2
12.8
13.4
22.7
21.7
3.4
3.0
15.8
14.8
0.8
0.8
Indian Oil Corp
Neutral
478
-
116,141
359,607
402,760
5.9
6.1
42.5
48.7
11.3
9.8
1.5
1.3
14.1
14.4
0.4
0.4
Reliance Industries
Neutral
1,013
-
328,314
304,775
344,392
12.6
13.4
91.3
102.6
11.1
9.9
1.3
1.1
11.8
12.0
1.0
0.8
Pharmaceuticals
Alembic Pharma
Neutral
574
-
10,821
3,145
3,483
31.9
16.2
38.2
18.7
15.0
30.7
6.8
5.7
57.9
20.1
3.5
3.2
Aurobindo Pharma
Neutral
761
-
44,517
13,651
15,702
21.7
21.7
33.9
38.4
22.4
19.8
6.3
4.9
32.5
27.7
3.6
3.2
Aventis*
Neutral
4,481
-
10,320
2,049
2,375
15.4
17.3
115.4
153.5
38.8
29.2
6.3
5.0
19.3
25.8
4.9
4.1
Cadila Healthcare
Accumulate
367
400
37,541
9,469
11,246
21.2
22.0
14.9
17.1
24.6
21.4
7.0
5.5
28.8
26.6
4.0
3.3
Cipla
Neutral
516
-
41,476
13,372
15,378
16.4
17.4
18.8
21.6
27.5
23.9
3.5
3.1
13.3
13.7
3.1
3.0
Dr Reddy's
Neutral
3,583
-
61,105
15,471
17,479
24.6
24.6
138.2
152.4
25.9
23.5
4.8
4.1
19.7
18.7
3.9
3.5
Dishman Pharma
Neutral
135
-
2,178
1,733
1,906
21.5
21.5
10.1
10.0
13.4
13.5
1.6
1.4
10.5
11.2
1.8
1.5
GSK Pharma*
Neutral
3,465
-
29,347
2,741
3,528
16.5
18.9
44.2
60.1
78.4
57.7
17.3
17.2
21.2
29.9
10.5
8.2
Indoco Remedies
Neutral
293
-
2,701
977
1,112
14.9
18.2
9.0
13.2
32.6
22.2
4.6
4.0
15.1
19.2
2.8
2.5
Ipca labs
Buy
468
613
5,901
2,844
3,799
10.6
15.3
10.6
17.3
44.1
27.0
2.6
2.4
5.9
9.1
2.2
1.7
Lupin
Accumulate
1,671
1,809
75,313
13,702
15,912
23.7
26.4
50.5
58.1
33.1
28.8
6.8
5.6
22.9
21.4
6.0
4.8
Sun Pharma
Buy
770
944
185,412
27,744
31,129
26.0
30.0
22.0
28.0
35.0
27.5
5.1
4.2
18.3
18.7
6.6
5.7
Power
Tata Power
Neutral
72
-
19,379
35,923
37,402
22.6
22.8
4.1
5.2
17.7
13.9
1.4
1.3
7.5
9.3
1.5
1.4
NTPC
Neutral
156
-
128,918
87,271
99,297
23.5
23.5
11.8
13.3
13.3
11.8
1.5
1.4
11.5
12.2
2.5
2.2
Power Grid
Neutral
164
-
85,955
20,702
23,361
86.7
86.4
12.1
13.2
13.6
12.4
2.0
1.8
15.6
15.1
9.1
8.5
Real Estate
MLIFE
Buy
469
554
1,925
826
1,011
20.1
21.9
22.7
30.7
20.7
15.3
1.2
1.1
6.0
7.4
4.3
3.2
Telecom
Bharti Airtel
Neutral
379
-
151,302
101,748
109,191
32.1
31.7
12.0
12.5
31.5
30.3
2.2
2.0
6.9
6.7
2.1
1.9
Idea Cellular
Neutral
111
-
40,023
34,282
36,941
32.0
31.5
5.9
6.2
18.8
17.9
1.7
1.6
9.9
9.3
1.7
1.6
zOthers
Abbott India
Neutral
4,723
-
10,036
2,715
3,153
14.5
14.1
134.3
152.2
35.2
31.0
8.8
7.2
27.4
25.6
3.4
2.9
Bajaj Electricals
Accumulate
237
268
2,396
4,612
5,351
5.6
5.7
9.5
12.4
25.0
19.2
3.1
2.8
12.5
14.4
0.5
0.5
Finolex Cables
Neutral
376
-
5,757
2,520
2,883
12.2
12.0
12.7
14.2
29.7
26.5
4.1
3.6
13.6
13.5
2.0
1.7
Goodyear India*
Buy
528
631
1,217
1,750
1,598
11.3
10.4
53.7
49.4
9.8
10.7
2.1
1.8
23.0
18.2
0.5
0.4
Hitachi
Neutral
1,382
-
3,758
1,779
2,081
7.8
8.8
21.8
33.4
63.4
41.3
10.2
8.3
17.4
22.1
2.2
1.8
Stock Watch
July 18, 2016
Company Name
Reco
CMP
Target
Mkt Cap
Sales ( Čcr )
OPM(%)
EPS (Č)
PER(x)
P/BV(x)
RoE(%)
EV/Sales(x)
(Č)
Price ( Č)
( Č cr )
FY16E
FY17E
FY16E
FY17E
FY16E
FY17E
FY16E
FY17E
FY16E
FY17E
FY16E
FY17E
FY16E
FY17E
zOthers
Jyothy Laboratories
Neutral
292
-
5,287
1,620
1,847
11.5
11.5
7.3
8.5
40.0
34.5
5.2
4.8
13.3
14.4
3.2
2.7
MRF
Buy
34,233
45,575
14,519
20,316
14,488
21.4
21.1
5,488.0
3,798.0
6.2
9.0
2.1
1.7
41.1
21.2
0.7
0.9
Page Industries
Neutral
13,413
-
14,961
1,929
2,450
19.8
20.1
229.9
299.0
58.4
44.9
25.7
17.9
52.1
47.1
7.7
6.0
Relaxo Footwears
Neutral
483
-
5,799
1,767
2,152
12.3
12.5
19.3
25.1
25.1
19.3
6.2
4.7
27.7
27.8
3.3
2.7
Siyaram Silk Mills
Buy
1,067
1,347
1,000
1,619
1,799
11.6
11.6
93.5
104.9
11.4
10.2
2.0
1.7
17.1
16.4
0.9
0.8
Styrolution ABS India* Neutral
645
-
1,134
1,271
1,440
8.6
9.2
32.0
41.1
20.1
15.7
2.1
1.8
10.7
12.4
0.8
0.7
TVS Srichakra
Buy
2,370
2,932
1,815
2,035
2,252
15.9
15.3
248.6
268.1
9.5
8.8
4.2
3.0
43.6
33.9
0.9
0.8
HSIL
Accumulate
296
310
2,142
2,123
2,384
16.1
16.5
15.0
18.9
19.7
15.7
1.5
1.4
8.0
9.4
1.3
1.1
Kirloskar Engines India
Neutral
265
-
3,831
2,403
2,554
8.6
9.9
9.2
10.5
28.8
25.3
2.8
2.6
9.7
10.7
1.2
1.1
Ltd
M M Forgings
Buy
408
546
493
511
615
21.7
21.6
43.1
55.8
9.5
7.3
1.7
1.4
19.9
21.2
1.2
0.9
Banco Products (India) Neutral
151
-
1,077
1,208
1,353
11.0
12.3
10.8
14.5
14.0
10.4
1.6
1.4
11.9
14.5
0.9
0.8
Competent Automobiles Neutral
145
-
89
1,040
1,137
3.2
3.1
25.7
28.0
5.6
5.2
0.8
0.7
15.0
14.3
0.1
0.1
Nilkamal
Neutral
1,209
-
1,804
1,871
2,031
10.7
10.5
63.2
69.8
19.1
17.3
3.1
2.7
17.6
16.6
1.0
0.9
Visaka Industries
Neutral
155
-
247
1,020
1,120
8.7
9.1
13.9
20.1
11.2
7.7
0.7
0.7
6.4
8.7
0.5
0.4
Transport Corporation of
Neutral
365
-
2,792
2,830
3,350
8.8
9.0
14.4
18.3
25.4
19.9
3.9
3.4
15.4
17.1
1.0
0.9
India
Elecon Engineering
Neutral
64
-
693
1,359
1,482
10.3
13.7
0.8
3.9
79.3
16.4
1.3
1.3
1.6
7.8
0.9
0.8
Surya Roshni
Buy
165
201
721
2,992
3,223
8.1
8.4
14.7
18.3
11.2
9.0
1.0
0.9
9.7
11.0
0.5
0.5
MT Educare
Neutral
160
-
637
286
366
18.3
17.7
7.7
9.4
20.7
17.1
4.4
3.8
20.2
21.1
2.2
1.7
Radico Khaitan
Buy
91
125
1,207
1,543
1,659
12.6
13.0
5.8
6.3
15.7
14.3
1.3
1.2
8.5
8.6
1.3
1.2
Garware Wall Ropes
Accumulate
419
460
916
828
898
11.2
10.3
28.3
29.0
14.8
14.4
2.5
2.2
16.8
14.9
1.1
1.0
Wonderla Holidays
Neutral
395
-
2,230
206
308
44.0
43.6
9.0
12.9
43.9
30.6
6.0
5.4
13.7
17.8
10.8
7.2
Linc Pen & Plastics
Neutral
255
-
377
344
382
9.1
9.1
12.4
13.1
20.6
19.5
3.7
3.3
18.0
16.7
1.2
1.0
The Byke Hospitality
Neutral
162
-
651
222
287
20.5
20.5
5.6
7.6
28.8
21.5
5.4
4.5
18.9
20.8
3.0
2.3
Interglobe Aviation
Neutral
970
-
34,965
17,022
21,122
20.7
14.5
63.9
53.7
15.2
18.1
22.8
18.7
149.9
103.2
2.2
1.7
Coffee Day Enterprises
Neutral
242
-
4,980
2,692
2,964
17.0
18.6
-
4.7
-
51.0
3.0
2.8
0.2
5.5
2.3
2.1
Ltd
Navneet Education
Neutral
98
-
2,333
998
1,062
24.1
24.0
5.8
6.1
17.0
16.1
3.8
3.3
22.0
20.6
2.4
2.3
Navkar Corporation
Buy
212
265
3,022
347
408
43.2
42.9
6.7
6.8
31.8
31.3
2.3
2.2
7.3
6.9
9.1
8.3
UFO Moviez
Neutral
549
-
1,516
558
619
32.0
33.2
22.5
30.0
24.4
18.3
2.9
2.5
12.0
13.8
2.6
2.2
VRL Logistics
Neutral
315
-
2,873
1,725
1,902
16.5
16.7
12.2
14.6
25.9
21.6
5.4
4.7
20.8
21.9
1.8
1.6
Stock Watch
July 18, 2016
Company Name
Reco
CMP
Target Mkt Cap
Sales ( Čcr )
OPM(%)
EPS (Č)
PER(x)
P/BV(x)
RoE(%)
EV/Sales(x)
(Č)
Price ( Č)
( Č cr )
FY16E FY17E FY16E FY17E FY16E FY17E FY16E FY17E FY16E FY17E FY16E FY17E FY16E FY17E
zOthers
Team Lease Serv.
Neutral
1,030
-
1,761
2,565
3,229
1.3
1.5
15.2
22.8
67.9
45.3
5.4
4.9
8.0
10.7
0.6
0.5
S H Kelkar & Co.
Neutral
225
-
3,255
928
1,036
15.3
15.1
4.9
6.1
45.6
36.9
4.3
3.9
9.4
10.7
3.5
3.1
Quick Heal
Neutral
274
-
1,921
339
408
27.8
27.3
7.1
7.7
38.8
35.4
3.3
3.3
8.5
9.3
4.7
4.0
Narayana Hrudaya
Neutral
290
-
5,936
1,603
1,873
10.9
11.5
1.0
2.6
304.9
109.8
7.3
6.7
2.4
6.1
4.1
3.5
Manpasand Bever.
Neutral
674
-
3,376
540
836
19.9
19.6
10.2
16.9
65.9
39.9
5.3
4.8
8.1
12.0
5.5
3.5
Parag Milk Foods
Neutral
324
-
2,722
1,645
1,919
9.0
9.3
6.7
9.5
48.2
34.3
6.3
5.3
13.1
15.5
1.9
1.6
Source: Company, Angel Research; Note: *December year end; #September year end; &October year end; Price as on July 15, 2016
Market Outlook
July 18, 2016
Research Team Tel: 022 - 39357800
DISCLAIMER
Angel Broking Private Limited (hereinafter referred to as “Angel”) is a registered Member of National Stock Exchange of India Limited,
Bombay Stock Exchange Limited and Metropolitan Stock Exchange of India Limited. It is also registered as a Depository Participant with
CDSL and Portfolio Manager with SEBI. It also has registration with AMFI as a Mutual Fund Distributor. Angel Broking Private Limited is
a registered entity with SEBI for Research Analyst in terms of SEBI (Research Analyst) Regulations, 2014 vide registration number
INH000000164. Angel or its associates has not been debarred/ suspended by SEBI or any other regulatory authority for accessing
/dealing in securities Market. Angel or its associates including its relatives/analyst do not hold any financial interest/beneficial
ownership of more than 1% in the company covered by Analyst. Angel or its associates/analyst has not received any compensation /
managed or co-managed public offering of securities of the company covered by Analyst during the past twelve months. Angel/analyst
has not served as an officer, director or employee of company covered by Analyst and has not been engaged in market making activity
of the company covered by Analyst.
This document is solely for the personal information of the recipient, and must not be singularly used as the basis of any investment
decision. Nothing in this document should be construed as investment or financial advice. Each recipient of this document should
make such investigations as they deem necessary to arrive at an independent evaluation of an investment in the securities of the
companies referred to in this document (including the merits and risks involved), and should consult their own advisors to determine
the merits and risks of such an investment.
Reports based on technical and derivative analysis center on studying charts of a stock's price movement, outstanding positions and
trading volume, as opposed to focusing on a company's fundamentals and, as such, may not match with a report on a company's
fundamentals.
The information in this document has been printed on the basis of publicly available information, internal data and other reliable
sources believed to be true, but we do not represent that it is accurate or complete and it should not be relied on as such, as this
document is for general guidance only. Angel Broking Pvt. Limited or any of its affiliates/ group companies shall not be in any way
responsible for any loss or damage that may arise to any person from any inadvertent error in the information contained in this report.
Angel Broking Pvt. Limited has not independently verified all the information contained within this document. Accordingly, we cannot
testify, nor make any representation or warranty, express or implied, to the accuracy, contents or data contained within this document.
While Angel Broking Pvt. Limited endeavors to update on a reasonable basis the information discussed in this material, there may be
regulatory, compliance, or other reasons that prevent us from doing so.
This document is being supplied to you solely for your information, and its contents, information or data may not be reproduced,
redistributed or passed on, directly or indirectly.
Neither Angel Broking Pvt. Limited, nor its directors, employees or affiliates shall be liable for any loss or damage that may arise from
or in connection with the use of this information.