Market Outlook
November 17, 2015
Market Cues
Domestic Indices
Chg (%)
(Pts)
(Close)
Indian markets are expected to open positive tracking the SGX Nifty and global
BSE Sensex
0.6
150
25,760
cues.
Nifty
0.6
44
7,807
US markets opened in the red following concerns about a wider conflict after the
Mid Cap
0.2
24
10,677
Paris attacks. However, markets changed direction and ended firmly in the positive.
Small Cap
0.5
56
11,181
European markets too pulled back in early trade, following the terrorist attacks.
Bankex
1.5
292
19,655
However, the markets recouped most of their losses to close marginally in the red.
Travel and leisure stocks were under pressure, but gains in energy stocks helped to
Global Indices
Chg (%)
(Pts)
(Close)
offset that impact.
Dow Jones
1.4
238
17,483
Indian markets closed in the green after six straight sessions of losses led by value
Nasdaq
1.2
57
4,985
buying at lower levels. Sentiment was also buoyed after the IMF voiced optimism
about India's growth story and listed out various positive developments in a report
FTSE
0.5
28
6,146
published ahead of the G20 Summit.
Nikkei
(1.0)
203
19,394
Hang Seng
(1.7)
(385)
22,011
News & Result Analysis
Shanghai Com
0.7
26
3,607
ICICI Bank sells 6% stake in ICICI Prudential Life Insurance
Apollo Tyres acquires Germany’s Reifencom for €45.6mn
Detailed analysis on Pg2
Advances / Declines
BSE
NSE
Advances
1,363
819
Investor’s Ready Reckoner
Declines
1,276
699
Key Domestic & Global Indicators
Unchanged
164
64
Stock Watch: Latest investment recommendations on 150+ stocks
Refer P4 onwards
Volumes (` Cr)
Top Picks
BSE
2,670
CMP
Target
Upside
Company
Sector
Rating
NSE
15,286
(`)
(`)
(%)
Axis Bank
Financials
Buy
482
630
30.7
HCL Tech
IT
Buy
839
1,132
35.0
Net Inflows (` Cr)
Net
Mtd
Ytd
ICICI Bank
Financials
Buy
267
357
33.5
FII
(837)
(1,980)
(16,800)
Ashok Leyland
Automobiles
Buy
91
111
22.7
MFs
(3.5)
1,883
52,230
Larsen & Toubro
Construction
Buy
1,357
1,646
21.3
More Top Picks on Pg3
Top Gainers
Price (`)
Chg (%)
Key Upcoming Events
Vakrangee
144
16.4
Previous
Consensus
Date
Region
Event Description
Adani Ent
13
13.1
Reading
Expectations
Rattanindia Power
9
12.9
Nov 17
UK
CPI (YoY) (Oct)
-0.1%
-0.1%
Nov 17
US
CPI (MoM) (Oct)
0.2%
0.2%
JP Associates
13
10.2
Nov 18
US
Building Permits (Oct) (mn)
1.105
1.15
Shree Renuka
13
9.8
Nov 18
UK
Retail Sales (Oct)(MoM)
1.9%
(0.5)%
Top Losers
Price (`)
Chg (%)
Kaveri Seed
389
(10.0)
PMC Fincorp
1
(9.8)
Hathway Cable
45
(5.0)
Godrej Cons. Prod.
1,207
(4.1)
Ajanta Pharma
1,335
(4.0)
As on November 16, 2015
Market Outlook
November 17, 2015
ICICI Bank sells 6% stake in ICICI Prudential Life Insurance
ICICI Bank sells
6% stake in life insurance company, ICICI Prudential to
Compassvale Investments Pte Ltd, at a valuation of `32,500cr which was higher
than our estimates. Incorporating the implied value from this stake sale, our SOTP
based value for the non-life business will increase by `9 per share. Our revised
target price now stands at `357 per share.
At CMP, the bank’s core banking business (after adjusting `67/share towards
value of subsidiaries) is trading at 1.4x FY2017E ABV. We maintain our BUY rating
on the stock.
Apollo Tyres acquires Germany’s Reifencom for €45.6mn
Apollo Tyres announced the acquisition of Reifencom GmbH, one of the largest
tyre distributors in Germany for €45.6mn or `324cr. In addition to the 37 stores
and service centres that Reifencom GmbH operates across Germany, it has an
online presence in 6 countries -- Germany, France, Italy, Austria, Switzerland and
Denmark. Reifencom GmbH recorded a top-line of €147mn in CY2014. The
company is known in the industry for its logistics system which ensures a steady
supply of tyres even during peak seasons and its good quality tyres which it
procures from leading tyre manufacturers globally. The acquisition is a strategic fit
for Apollo’s European business (Europe contributes about 30-35% of Apollo’s
turnover) as it will enable to improve its mix of distribution channels in Germany
and Europe and aid in increasing the visibility of Apollo and Vredestein tyres in the
offline and especially in the fast growing online retail space.
The deal prime facie looks to be at a reasonable valuation (EV/Sales of about
0.3x). Further, Apollo Tyres is making this acquisition in all cash terms, which
would not strain the balance sheet, considering that Apollo had about `700cr of
cash as on 30th September 2015. We view the deal to be positive for Apollo Tyres.
We currently have Accumulate rating on the stock.
Economic and Political News
Exports slump 17.53% to $21.35 billion in October
October WPI inflation at -3.81% versus -4.54% in September
MIAL eyes development fee to fund two Metro stations worth `518cr
Corporate News
Reliance Infra to sell 49% in Mumbai power business to Canadian fund
DLF gets CCI approval for `1,990cr deal with GIC
Thomas Cook India inks pact with OYO Rooms
Market Outlook
November 17, 2015
Top Picks ★★★★★
Large Cap
Market Cap
CMP
Target
Upside
Company
Rationale
(` Cr)
(`)
(`)
(%)
To outpace battery industry growth due to better technological
Amara Raja Batteries
15,141
886
1,040
17.3
products leading to market share gains in both the automotive
OEM and replacement segments.
Earnings to grow strongly given the MHCV cyclical upturn.
Ashok Leyland
25,755
91
111
22.7
Focus on exports and LCV's provides additional growth
avenue.
Healthy pace of branch expansion, backed by distribution
Axis Bank
1,14,518
482
630
30.7
network, will be the driving force for the bank’s retail business
and overall earnings.
The stock is trading at attractive valuations and is factoring all
HCL Tech
1,17,918
839
1,132
35.0
the bad news.
Strong visibility for a robust 20% earnings trajectory, coupled
HDFC Bank
2,66,437
1,058
1,262
19.3
with high quality of earnings on account of high quality retail
business and strategic focus on highly rated corporates.
Due to its robust franchise and capital adequacy position, the
bank is well positioned to grow by at least a few percentage
ICICI Bank
1,55,181
267
357
33.5
points higher than the average industry growth rate from a
structural point of view.
Back on the growth trend, expect a long term growth of 14%
Infosys
2,48,116
1,080
1,306
20.9
to be a US$20bn in FY2020.
Well positioned to benefit from such expected gradual
recovery in the overall domestic capex cycle, given its presence
Larsen & Toubro
1,26,309
1,357
1,646
21.3
across various infrastructure segments, its execution
capabilities, and its strong balance sheet.
LICHF continues to grow its retail loan book at a healthy pace
with improvement in asset quality. We expect the company to
LIC Housing Finance
23,772
471
571
21.2
post a healthy loan book which is likely to reflect in a strong
earnings growth.
Source: Company, Angel Research
Mid Cap
Market Cap
CMP
Target
Upside
Company
Rationale
(` Cr)
(`)
(`)
(%)
Government thrust on Renewable sector and strong order
Inox Wind
8,121
366
505
38.0
book would drive future growth.
Change in business focus towards high-margin chronic and
Ipca labs
9,129
724
900
24.4
lifestyle segments and increasing penetration in Europe and
US
Economic recovery to have favourable impact on advertising &
circulation revenue growth. Further, the acquisition of a radio
Jagran Prakashan
4,904
150
169
12.7
business (Radio City) would also boost the company's revenue
growth.
Strong brand & quality teaching with innovative technologies
MT Educare
522
131
169
29.0
& higher government educational spending to boost growth
Earnings boost on back of stable material prices and
Radico Khaitan
1,661
125
156
24.9
favourable pricing environment. Valuation discount to peers
provides additional comfort
Strong brands and distribution network would boost growth
Siyaram Silk Mills
890
949
1,145
20.7
going ahead. Stock currently trades at an inexpensive
valuation.
Structural shift in the Lighting industry towards LED lighting will
Surya Roshni
583
133
183
37.7
drive growth.
Source: Company, Angel Research
Market Outlook
November 17, 2015
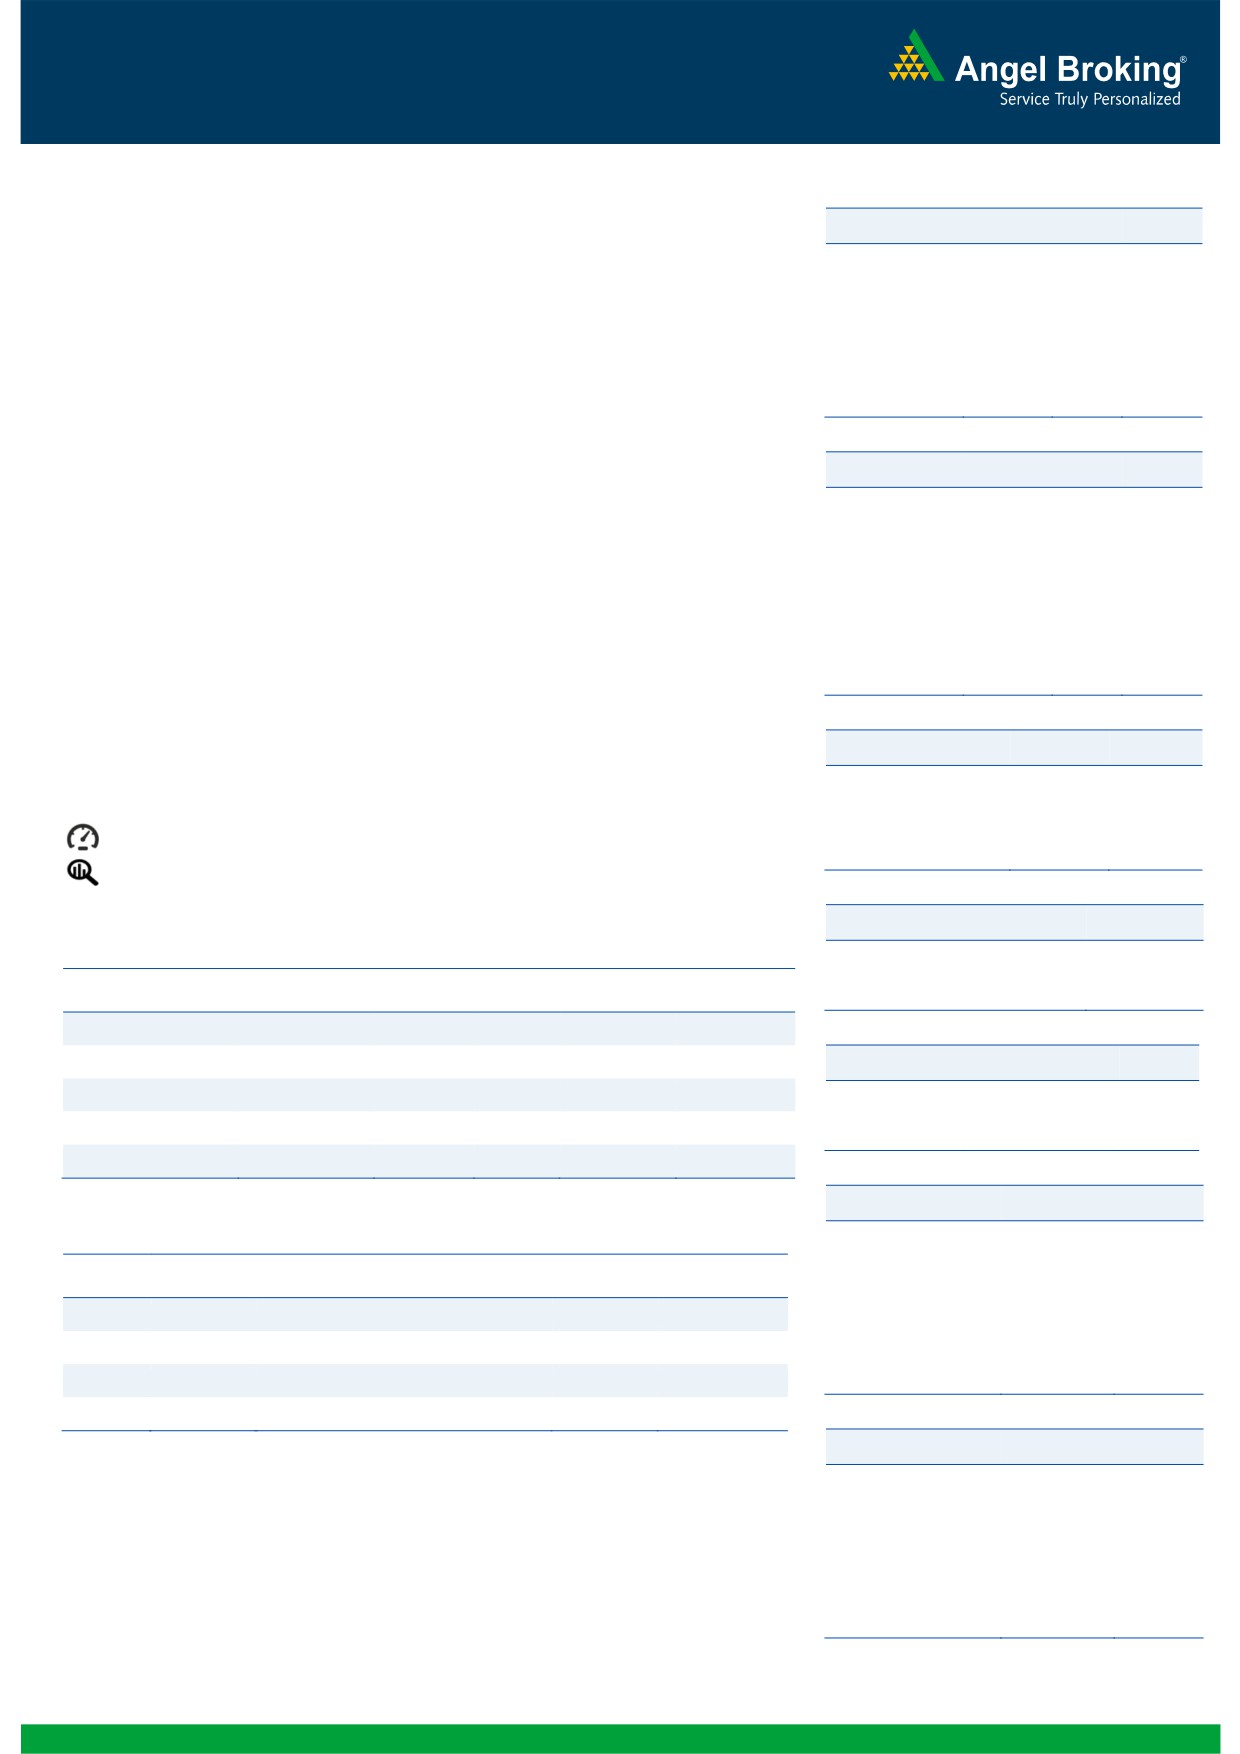
Macro watch
Exhibit 1: Quarterly GDP trends
Exhibit 2: IIP trends
(%)
(%)
9.0
8.4
7.0
6.3
8.0
7.5
7.5
6.0
5.2
7.0
7.0
4.8
6.7
6.7
5.0
7.0
6.4
6.6
4.2
4.1
6.3
3.6
3.6
4.0
6.0
2.8
3.0
2.5
2.5
5.0
3.0
4.7
5.0
2.0
4.0
1.0
3.0
-
Source: CSO, Angel Research
Source: MOSPI, Angel Research
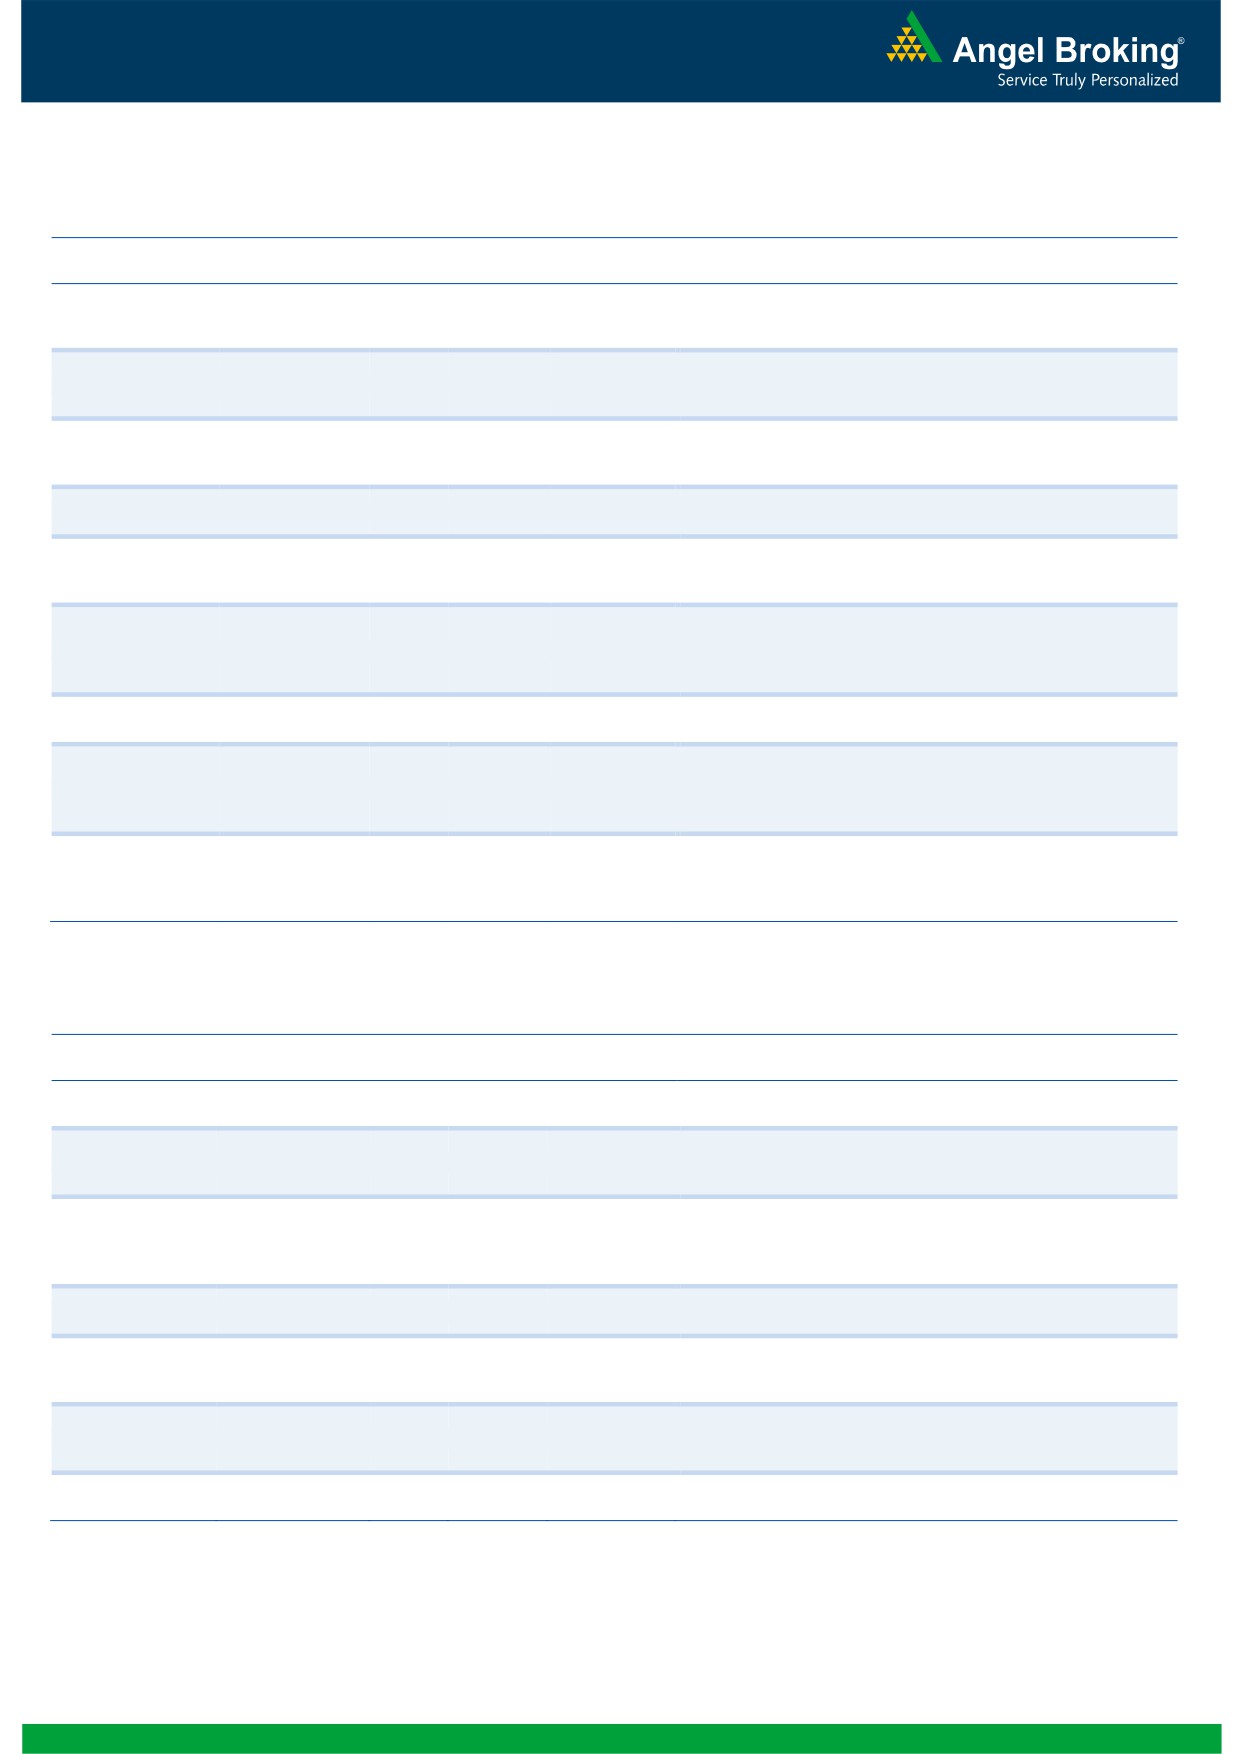
Exhibit 3: Monthly CPI inflation trends
Exhibit 4: Manufacturing and services PMI
(%)
56.0
Mfg. PMI
Services PMI
6.0
5.4
5.3
5.4
5.2
5.0
5.0
54.0
4.9
5.0
4.3
4.4
3.7
3.7
52.0
4.0
3.3
50.0
3.0
2.0
48.0
1.0
46.0
-
44.0
Source: MOSPI, Angel Research
Source: Market, Angel Research; Note: Level above 50 indicates expansion
Exhibit 5: Exports and imports growth trends
Exhibit 6: Key policy rates
(%)
Exports yoy growth
Imports yoy growth
(%)
Repo rate
Reverse Repo rate
CRR
30.0
9.00
20.0
8.00
10.0
7.00
0.0
6.00
(10.0)
5.00
(20.0)
4.00
(30.0)
3.00
Source: Bloomberg, Angel Research
Source: RBI, Angel Research
Market Outlook
November 17, 2015
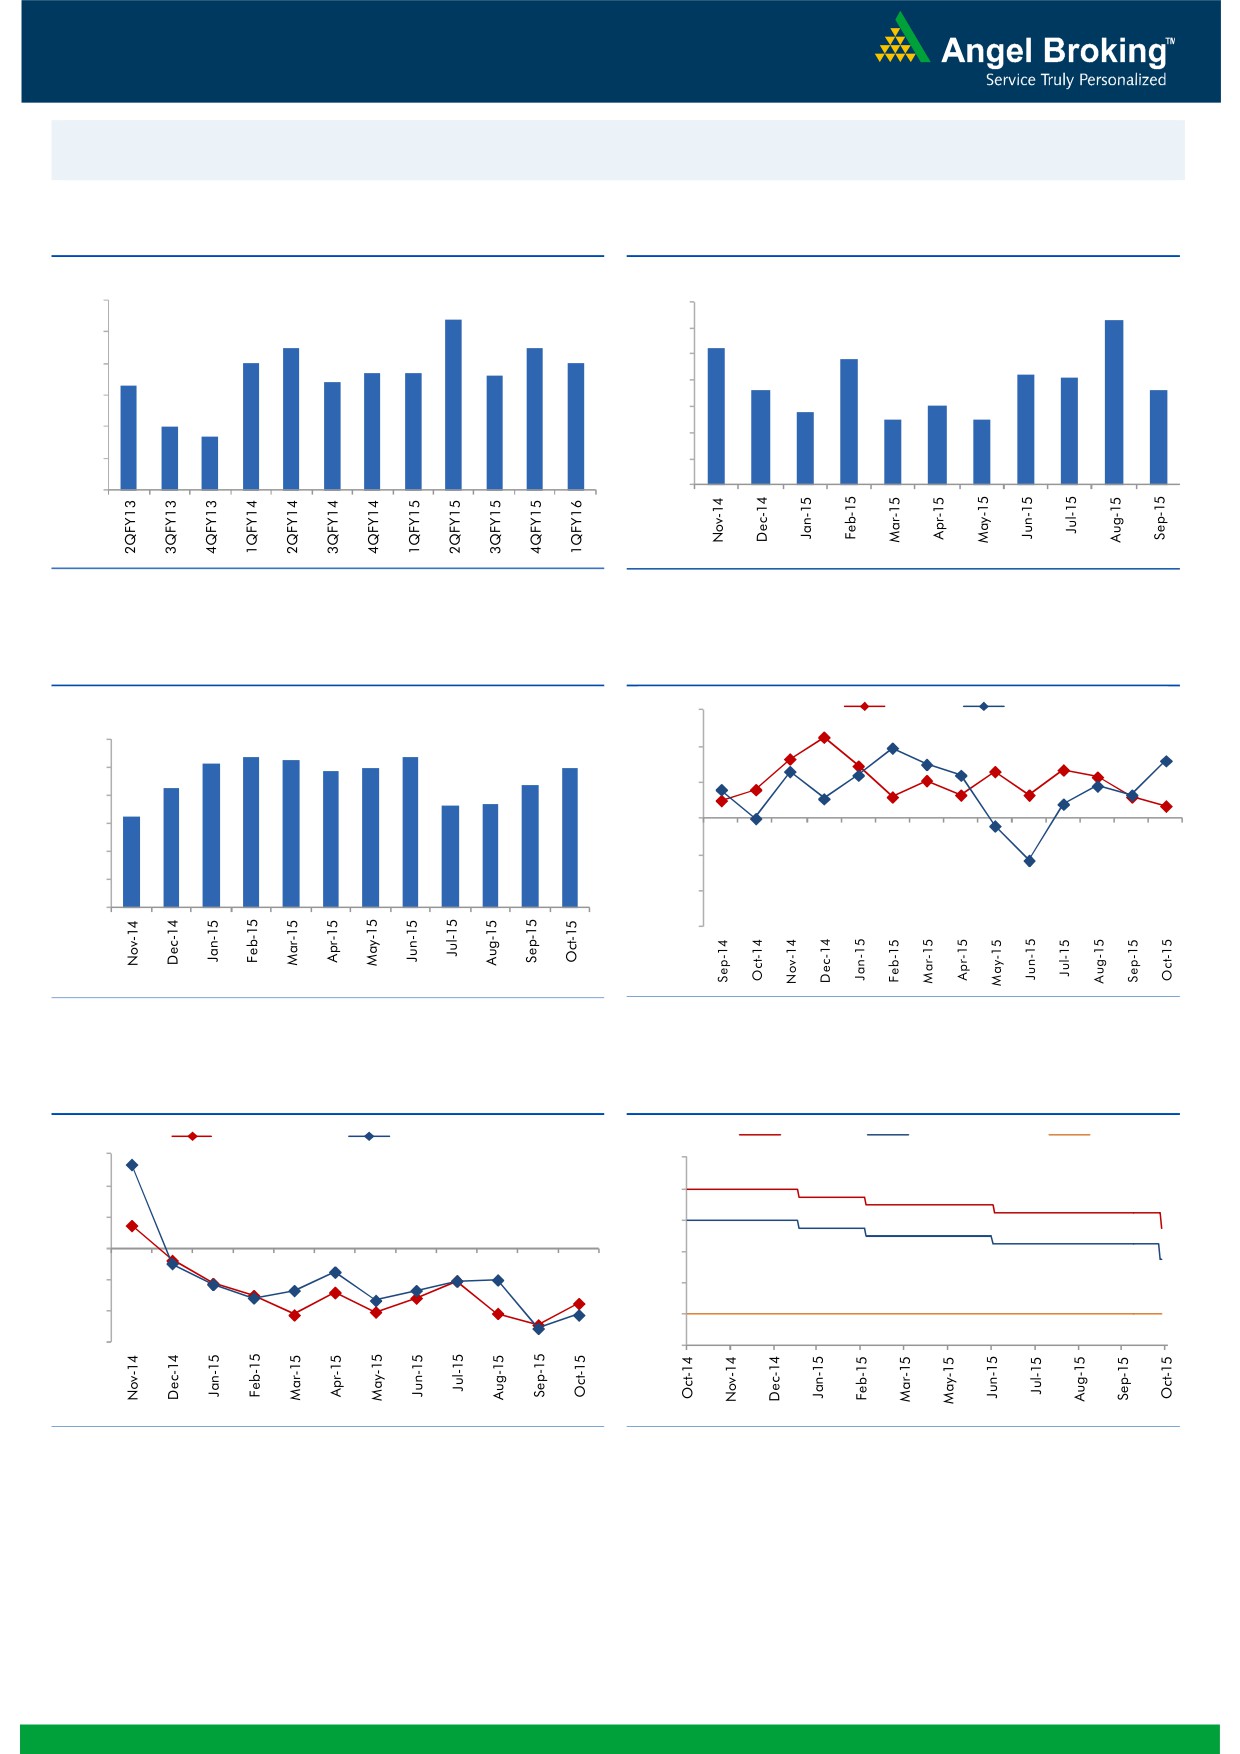
Global watch
Exhibit 1: Latest quarterly GDP Growth (%, yoy) across select developing and developed countries
(%)
8.0
6.9
6.0
5.3
4.9
4.7
4.0
2.8
2.3
2.0
1.6
2.0
1.2
1.1
0.8
(2.6)
-
(2.0)
(4.0)
(4.6)
(6.0)
Source: Bloomberg, Angel Research
Exhibit 2: 2015 GDP Growth projection by IMF (%, yoy) across select developing and developed countries
(%)
10.0
7.5
8.0
6.8
5.2
6.0
4.8
3.7
3.1
4.0
2.7
2.0
1.6
1.2
1.0
2.0
-
(2.0)
(4.0)
(1.0)
(3.8)
(6.0)
Source: IMF, Angel Research
Exhibit 3: One year forward P-E ratio across select developing and developed countries
(x)
20.0
18.0
16.0
14.0
12.0
10.0
8.0
6.0
4.0
2.0
-
Source: IMF, Angel Research
Market Outlook
November 17, 2015
Exhibit 4: Relative performance of indices across globe
Returns (%)
Country
Name of index
Closing price
1M
3M
1YR
Brazil
Bovespa
46,847
(0.8)
(0.8)
(9.5)
Russia
Micex
1,740
1.3
1.9
15.9
India
Nifty
7,807
(5.2)
(8.4)
(7.4)
China
Shanghai Composite
3,607
5.6
(7.2)
44.5
South Africa
Top 40
46,331
(2.4)
2.3
2.9
Mexico
Mexbol
43,618
(1.7)
(0.3)
0.6
Indonesia
LQ45
768
(1.2)
(4.7)
(11.9)
Malaysia
KLCI
1,656
(3.4)
1.9
(8.5)
Thailand
SET 50
893
(3.4)
(2.6)
(15.6)
USA
Dow Jones
17483
1.6
(0.4)
(0.9)
UK
FTSE
6,146
(3.6)
(6.2)
(7.6)
Japan
Nikkei
19,394
7.1
(5.5)
12.0
Germany
DAX
10,713
6.0
(2.1)
17.7
France
CAC
4,804
2.2
(3.6)
14.3
Source: Bloomberg, Angel Research
Stock Watch
November 17, 2015
Company Name
Reco
CMP
Target
Mkt Cap
Sales ( Čcr )
OPM(%)
EPS (Č)
PER(x)
P/BV(x)
RoE(%)
EV/Sales(x)
(Č)
Price ( Č)
( Č cr )
FY16E FY17E
FY16E
FY17E
FY16E
FY17E
FY16E
FY17E
FY16E
FY17E
FY16E
FY17E
FY16E
FY17E
Agri / Agri Chemical
Rallis
Neutral
198
-
3,842
2,075
2,394
14.4
14.4
9.5
11.0
20.8
18.0
4.1
3.6
21.1
21.3
1.9
1.6
United Phosphorus
Buy
440
510
18,846
13,698
15,752
17.6
17.6
32.1
38.5
13.7
11.4
2.7
2.2
21.4
21.3
1.5
1.2
Auto & Auto Ancillary
Ashok Leyland
Buy
91
111
25,755
18,763
22,357
11.1
11.2
3.6
4.8
25.1
18.9
4.6
4.3
18.7
22.6
1.3
1.1
Bajaj Auto
Accumulate
2,384
2,672
68,971
24,115
27,600
21.3
21.0
136.8
157.2
17.4
15.2
5.6
4.8
32.2
31.5
2.4
2.1
Eicher Motors
Buy
15,295
19,036
41,514
15,379
16,498
15.6
16.6
473.2
574.8
32.3
26.6
12.0
8.9
36.7
33.2
2.6
2.4
Hero Motocorp
Neutral
2,611
-
52,147
28,561
31,559
14.7
14.7
151.1
163.2
17.3
16.0
6.7
5.7
38.7
35.6
1.7
1.5
L G Balakrishnan & Bros Neutral
459
-
720
1,254
1,394
11.6
11.8
35.9
41.7
12.8
11.0
1.7
1.5
13.5
13.8
0.7
0.6
Mahindra and Mahindra Accumulate
1,278
1,410
79,385
38,513
43,579
13.6
13.7
56.1
65.1
22.8
19.6
3.6
3.2
15.7
16.2
1.7
1.4
Maruti
Accumulate
4,650
4,960
140,461
57,865
68,104
16.4
16.7
176.3
225.5
26.4
20.6
5.1
4.4
19.4
21.2
2.2
1.8
Minda Industries
Accumulate
747
809
1,184
2,567
2,965
8.0
8.3
46.1
57.8
16.2
12.9
2.7
2.2
16.7
17.3
0.6
0.5
Rane Brake Lining
#N/A
454
511
11.1
11.4
23.8
28.1
14.2
15.3
Setco Automotive
Neutral
202
-
539
594
741
12.7
13.7
8.4
15.8
24.0
12.8
2.5
2.2
10.4
16.9
1.4
1.1
Tata Motors
Neutral
400
-
115,546
255,254
301,772
12.9
13.4
23.7
37.3
16.9
10.7
2.1
1.7
7.4
12.1
0.6
0.6
TVS Motor
Accumulate
296
313
14,074
11,845
14,040
7.2
9.0
10.4
17.4
28.5
17.0
7.1
5.5
25.1
32.0
1.2
1.0
Amara Raja Batteries
Buy
886
1,040
15,141
4,892
5,871
17.4
17.6
28.8
37.1
30.8
23.9
7.2
5.8
23.4
24.1
3.1
2.5
Exide Industries
Accumulate
148
162
12,538
6,950
7,784
14.4
14.8
6.6
7.3
22.4
20.2
2.8
2.6
12.6
12.8
1.5
1.4
Apollo Tyres
Accumulate
158
171
8,027
12,146
12,689
16.8
16.0
21.2
19.0
7.4
8.3
1.2
1.1
16.5
13.0
0.7
0.8
Ceat
Accumulate
982
1,119
3,973
6,041
6,597
14.1
13.7
99.5
111.9
9.9
8.8
1.9
1.6
19.6
18.5
0.8
0.7
JK Tyres
Neutral
97
-
2,196
7,446
7,669
15.2
14.0
19.6
18.4
4.9
5.3
1.2
1.0
25.2
19.5
0.7
0.6
Swaraj Engines
Neutral
935
-
1,161
552
630
14.2
14.7
44.6
54.1
21.0
17.3
4.9
4.4
23.2
25.6
2.0
1.7
Subros
Neutral
85
-
510
1,268
1,488
11.6
11.9
3.7
6.6
23.0
12.9
1.5
1.4
6.8
11.4
0.7
0.6
Indag Rubber
Neutral
198
-
519
283
329
17.0
17.2
13.0
15.4
15.3
12.8
3.3
2.8
21.8
21.6
1.6
1.3
Capital Goods
ACE
Neutral
44
-
438
660
839
4.7
8.2
1.0
3.9
44.3
11.4
1.4
1.2
3.2
11.3
0.8
0.6
BEML
Neutral
1,101
-
4,585
3,277
4,006
6.0
8.9
29.2
64.3
37.7
17.1
2.1
1.9
5.7
11.7
1.5
1.2
BGR Energy
Neutral
108
-
782
3,615
3,181
9.5
9.4
16.7
12.4
6.5
8.7
0.6
0.6
10.0
7.0
0.6
0.8
BHEL
Neutral
178
-
43,641
33,722
35,272
10.8
11.7
10.5
14.2
17.0
12.6
1.3
1.2
7.0
9.0
1.4
1.3
Blue Star
Accumulate
354
382
3,180
3,624
4,157
5.3
6.0
9.6
14.5
36.7
24.4
6.7
5.8
18.6
25.4
1.0
0.8
Crompton Greaves
Buy
172
204
10,789
13,484
14,687
4.9
6.2
4.5
7.1
38.3
24.3
2.7
2.5
7.2
10.8
0.9
0.8
Inox Wind
Buy
366
505
8,121
4,980
5,943
17.0
17.5
26.6
31.6
13.8
11.6
4.1
3.0
35.0
30.0
1.8
1.4
Stock Watch
November 17, 2015
Company Name
Reco
CMP
Target
Mkt Cap
Sales ( Čcr )
OPM(%)
EPS (Č)
PER(x)
P/BV(x)
RoE(%)
EV/Sales(x)
(Č)
Price ( Č)
( Č cr )
FY16E
FY17E
FY16E
FY17E
FY16E
FY17E
FY16E
FY17E
FY16E
FY17E
FY16E
FY17E
FY16E
FY17E
Capital Goods
KEC International
Neutral
144
-
3,692
8,791
9,716
6.1
6.8
5.4
8.2
26.6
17.5
2.7
2.4
10.0
14.0
0.6
0.6
Thermax
Neutral
854
-
10,180
6,413
7,525
7.4
8.5
30.5
39.3
28.0
21.7
4.3
3.8
15.0
17.0
1.6
1.3
Cement
ACC
Buy
1,326
1,630
24,900
13,151
14,757
16.4
18.3
63.9
83.4
20.8
15.9
2.7
2.5
13.3
16.1
1.7
1.5
Ambuja Cements
Buy
194
233
30,169
11,564
12,556
19.4
20.7
8.9
10.1
21.8
19.3
2.7
2.6
12.8
13.8
2.3
2.0
India Cements
Buy
79
112
2,422
4,216
4,840
18.0
19.5
4.0
9.9
19.7
8.0
0.8
0.7
4.0
9.5
0.9
0.7
JK Cement
Buy
643
744
4,493
3,661
4,742
10.1
15.8
18.0
61.0
35.7
10.5
2.6
2.3
7.5
22.9
1.7
1.3
J K Lakshmi Cement
Buy
349
430
4,103
2,947
3,616
16.7
19.9
11.5
27.2
30.3
12.8
2.9
2.5
9.8
20.8
1.8
1.4
Mangalam Cements
Neutral
203
-
541
1,053
1,347
10.5
13.3
8.4
26.0
24.1
7.8
1.0
0.9
4.3
12.5
0.9
0.7
Orient Cement
Accumulate
164
183
3,351
1,854
2,524
21.2
22.2
7.7
11.1
21.2
14.7
3.1
2.6
13.3
15.7
2.5
1.8
Ramco Cements
Neutral
376
-
8,959
4,036
4,545
20.8
21.3
15.1
18.8
24.9
20.0
3.1
2.7
12.9
14.3
2.7
2.4
Shree Cement^
Neutral
10,884
-
37,918
7,150
8,742
26.7
28.6
228.0
345.5
47.7
31.5
7.0
5.9
15.7
20.3
5.1
4.1
UltraTech Cement
Buy
2,732
3,282
74,968
25,021
30,023
19.1
21.6
89.0
132.0
30.7
20.7
3.6
3.1
12.2
15.9
3.1
2.6
Construction
ITNL
Neutral
90
-
2,956
7,360
8,825
34.0
35.9
1.0
5.0
89.9
18.0
0.4
0.4
0.3
1.4
3.8
3.7
KNR Constructions
Accumulate
609
673
1,713
937
1,470
14.3
14.0
33.5
38.6
18.2
15.8
2.8
2.4
15.4
15.4
1.9
1.2
Larsen & Toubro
Buy
1,357
1,646
126,309
64,148
73,241
11.5
11.7
62.0
66.0
21.9
20.6
2.2
2.0
13.4
14.0
2.2
1.9
Gujarat Pipavav Port
Neutral
160
-
7,716
629
684
51.0
52.2
6.4
5.9
24.9
27.1
3.3
3.0
15.9
12.7
11.9
10.8
MBL Infrastructures
Buy
206
285
856
2,313
2,797
12.2
14.6
19.0
20.0
10.9
10.3
1.1
1.0
11.3
10.6
1.1
1.0
Nagarjuna Const.
Neutral
78
-
4,347
7,892
8,842
8.3
9.1
2.4
5.3
32.6
14.8
1.3
1.2
4.2
8.6
0.8
0.7
PNC Infratech
Neutral
528
-
2,710
1,798
2,132
13.2
13.5
22.0
30.0
24.0
17.6
2.2
1.9
11.5
11.4
1.6
1.4
Simplex Infra
Neutral
319
-
1,578
6,241
7,008
10.4
10.7
20.0
36.0
16.0
8.9
1.3
1.2
6.8
11.1
0.8
0.6
Financials
Allahabad Bank
Neutral
76
-
4,546
8,332
9,259
2.8
2.8
21.0
25.6
3.6
3.0
0.4
0.3
9.8
10.9
-
-
Axis Bank
Buy
482
630
114,518
26,473
31,527
3.5
3.6
35.7
43.5
13.5
11.1
2.6
2.3
17.9
18.9
-
-
Bank of Baroda
Neutral
176
-
40,657
19,105
21,474
2.0
2.0
19.1
24.8
9.2
7.1
1.0
0.9
10.2
12.1
-
-
Bank of India
Neutral
133
-
10,536
15,972
17,271
1.9
2.0
15.3
33.4
8.7
4.0
0.4
0.3
3.6
7.6
-
-
Canara Bank
Neutral
282
-
15,312
15,251
16,725
2.0
2.0
59.3
68.6
4.8
4.1
0.5
0.5
10.1
10.7
-
-
Dena Bank
Neutral
41
-
2,326
3,440
3,840
2.1
2.3
7.3
10.0
5.7
4.1
0.4
0.4
6.1
7.9
-
-
Federal Bank
Neutral
57
-
9,749
3,477
3,999
3.0
3.0
5.0
6.2
11.3
9.1
1.1
1.0
10.6
11.9
-
-
HDFC
Neutral
1,179
-
185,985
10,358
11,852
3.3
3.3
41.1
47.0
28.7
25.1
5.5
5.0
24.7
24.9
-
-
HDFC Bank
Buy
1,058
1,262
266,437
38,309
47,302
4.3
4.3
49.3
61.1
21.5
17.3
3.7
3.2
18.5
19.7
-
-
Stock Watch
November 17, 2015
Company Name
Reco
CMP
Target
Mkt Cap
Sales ( Čcr )
OPM(%)
EPS (Č)
PER(x)
P/BV(x)
RoE(%)
EV/Sales(x)
(Č)
Price ( Č)
( Č cr )
FY16E
FY17E
FY16E
FY17E
FY16E
FY17E
FY16E
FY17E
FY16E
FY17E
FY16E
FY17E
FY16E
FY17E
Financials
ICICI Bank
Buy
267
357
155,181
35,168
40,517
3.4
3.4
21.4
25.2
12.5
10.6
2.1
1.8
14.7
15.2
-
-
IDBI Bank
Neutral
88
-
14,123
9,625
10,455
1.8
1.8
8.5
14.2
10.3
6.2
0.6
0.6
5.9
9.3
-
-
Indian Bank
Neutral
126
-
6,040
6,160
6,858
2.5
2.5
24.5
29.8
5.1
4.2
0.4
0.4
7.7
8.6
-
-
LIC Housing Finance
Buy
471
571
23,772
3,101
3,745
2.5
2.5
33.0
40.2
14.3
11.7
2.7
2.3
19.7
20.5
-
-
Oriental Bank
Neutral
152
-
4,547
7,643
8,373
2.4
2.4
37.2
45.4
4.1
3.3
0.4
0.3
8.2
9.4
-
-
Punjab Natl.Bank
Neutral
140
-
27,549
23,638
26,557
2.8
2.8
17.9
27.2
7.9
5.2
0.8
0.6
8.5
12.0
-
-
South Ind.Bank
Neutral
20
-
2,754
1,965
2,185
2.5
2.5
2.5
3.3
8.2
6.2
0.8
0.7
9.5
11.7
-
-
St Bk of India
Accumulate
248
283
192,478
82,520
93,299
2.7
2.8
20.0
24.5
12.4
10.1
1.4
1.2
11.5
12.8
-
-
Union Bank
Neutral
166
-
11,394
12,646
14,129
2.3
2.4
31.0
39.1
5.4
4.2
0.6
0.5
9.8
11.4
-
-
Vijaya Bank
Neutral
34
-
2,908
3,536
3,827
1.9
1.9
5.5
6.7
6.1
5.1
0.5
0.5
7.8
8.8
-
-
Yes Bank
Buy
751
914
31,443
7,228
9,043
3.2
3.3
57.7
69.4
13.0
10.8
2.3
2.0
19.1
19.6
-
-
FMCG
Asian Paints
Neutral
802
-
76,913
16,553
19,160
16.0
16.2
17.7
21.5
45.4
37.3
12.0
10.8
29.4
31.2
4.5
3.9
Britannia
Neutral
2,845
-
34,131
8,065
9,395
9.6
10.2
47.2
65.5
60.3
43.4
20.0
18.9
38.3
41.2
4.1
3.5
Colgate
Neutral
949
-
25,798
4,836
5,490
19.5
19.7
48.5
53.2
19.6
17.8
14.3
12.5
99.8
97.5
5.2
4.6
Dabur India
Neutral
262
-
45,967
9,370
10,265
17.1
17.2
7.3
8.1
35.7
32.3
10.8
8.8
33.7
30.6
4.8
4.4
GlaxoSmith Con*
Accumulate
5,816
6,118
24,461
4,919
5,742
17.2
17.4
168.3
191.2
34.6
30.4
9.8
8.3
28.8
28.9
4.5
3.8
Godrej Consumer
Neutral
1,207
-
41,102
10,168
12,886
16.1
16.1
32.1
38.4
37.6
31.4
7.7
7.1
19.7
21.0
4.1
3.3
HUL
Neutral
785
-
169,810
34,940
38,957
17.5
17.7
20.8
24.7
37.7
31.8
42.0
33.5
110.5
114.2
4.7
4.2
ITC
Buy
338
409
271,536
41,068
45,068
37.8
37.4
13.9
15.9
24.3
21.3
8.2
7.2
34.1
33.8
6.2
5.7
Marico
Neutral
392
-
25,294
6,551
7,766
15.7
16.0
10.4
12.5
37.8
31.4
11.0
9.1
33.2
32.4
3.8
3.2
Nestle*
Accumulate
5,984
6,646
57,694
11,291
12,847
22.2
22.3
158.9
184.6
37.7
32.4
19.7
17.7
55.0
57.3
5.0
4.3
Tata Global
Accumulate
128
144
8,066
8,635
9,072
9.8
9.9
6.5
7.6
19.7
16.8
2.0
1.9
6.8
7.4
0.9
0.8
IT
HCL Tech^
Buy
839
1,132
117,918
42,038
47,503
23.2
23.5
55.8
62.9
15.0
13.3
3.5
2.6
23.0
19.8
2.4
1.9
Infosys
Buy
1,080
1,306
248,116
60,250
66,999
28.0
28.0
58.3
63.7
18.5
17.0
3.9
3.3
20.9
19.7
3.4
2.9
TCS
Buy
2,375
3,165
467,957
111,274
126,852
28.4
28.7
125.4
143.9
18.9
16.5
7.5
6.9
39.9
42.2
3.8
3.3
Tech Mahindra
Buy
516
646
49,607
25,566
28,890
16.0
17.0
26.3
31.9
19.6
16.2
3.5
3.0
17.9
18.6
1.7
1.4
Wipro
Buy
553
719
136,597
52,414
58,704
23.7
23.8
38.4
42.3
14.4
13.1
2.8
2.5
19.5
18.0
2.2
1.8
Media
D B Corp
Accumulate
322
356
5,910
2,241
2,495
27.8
27.9
21.8
25.6
14.8
12.6
3.9
3.4
26.7
28.5
2.6
2.3
HT Media
Neutral
76
-
1,761
2,495
2,603
11.2
11.2
7.3
8.6
10.4
8.8
0.8
0.7
7.4
8.1
0.2
0.2
Stock Watch
November 17, 2015
Company Name
Reco
CMP
Target
Mkt Cap
Sales ( Čcr )
OPM(%)
EPS (Č)
PER(x)
P/BV(x)
RoE(%)
EV/Sales(x)
(Č)
Price ( Č)
( Č cr )
FY16E FY17E
FY16E
FY17E
FY16E
FY17E
FY16E
FY17E
FY16E
FY17E
FY16E
FY17E
FY16E
FY17E
Media
Jagran Prakashan
Accumulate
150
169
4,904
2,170
2,355
27.0
27.6
12.8
10.3
11.7
14.6
3.3
3.1
21.8
19.4
2.0
1.7
Sun TV Network
Neutral
379
-
14,952
2,779
3,196
70.2
70.5
22.8
27.3
16.6
13.9
4.1
3.7
26.7
28.3
5.1
4.4
Hindustan Media
Neutral
274
-
2,012
920
1,031
20.0
20.0
19.2
20.9
14.3
13.1
2.3
2.0
16.4
15.3
1.7
1.5
Ventures
Metals & Mining
Coal India
Accumulate
331
380
209,135
76,167
84,130
19.9
22.3
22.4
25.8
14.8
12.8
5.3
5.2
35.5
41.0
2.1
1.9
Hind. Zinc
Buy
144
175
60,908
14,641
14,026
50.4
50.4
17.7
16.0
8.2
9.0
1.3
1.1
16.2
13.2
1.8
1.6
Hindalco
Neutral
79
-
16,334
104,356
111,186
8.7
9.5
6.7
11.1
11.8
7.2
0.4
0.4
3.5
5.9
0.7
0.6
JSW Steel
Neutral
908
-
21,945
42,308
45,147
16.4
20.7
(10.3)
49.5
18.3
1.0
1.0
(1.0)
5.6
1.6
1.5
NMDC
Neutral
91
-
36,158
8,237
10,893
46.6
44.5
10.0
11.7
9.2
7.8
1.0
0.9
12.5
13.0
4.2
3.2
SAIL
Neutral
45
-
18,647
45,915
53,954
7.2
10.5
1.5
4.4
30.0
10.3
0.4
0.4
2.3
4.1
1.1
0.9
Vedanta
Neutral
90
-
26,578
71,445
81,910
26.2
26.3
12.9
19.2
7.0
4.7
0.5
0.4
7.2
8.9
0.8
0.6
Tata Steel
Neutral
230
-
22,319
126,760
137,307
8.9
11.3
6.4
23.1
36.1
10.0
0.7
0.7
2.0
7.1
0.8
0.7
Oil & Gas
Cairn India
Neutral
132
-
24,682
11,323
12,490
49.4
51.0
20.7
20.7
6.4
6.4
0.4
0.4
6.4
6.1
1.3
0.6
GAIL
Neutral
295
-
37,376
64,856
70,933
9.1
9.6
24.0
28.9
12.3
10.2
1.1
1.0
8.8
9.6
0.8
0.7
ONGC
Neutral
230
-
196,947
154,564
167,321
36.8
37.4
28.6
32.5
8.1
7.1
1.0
0.9
12.7
13.5
1.5
1.4
Petronet LNG
Neutral
205
-
15,345
29,691
31,188
5.8
6.2
12.8
13.4
16.0
15.2
2.4
2.1
15.8
14.8
0.6
0.6
Indian Oil Corp
Accumulate
402
455
97,640
359,607
402,760
5.9
6.1
42.5
48.7
9.5
8.3
1.3
1.1
14.1
14.4
0.4
0.3
Reliance Industries
Accumulate
933
1,050
302,162
304,775
344,392
12.6
13.4
91.3
102.6
10.2
9.1
1.2
1.0
11.8
12.0
0.9
0.8
Pharmaceuticals
Alembic Pharma
Neutral
658
-
12,399
2,658
3,112
24.1
20.2
24.6
23.9
26.7
27.5
9.6
7.3
42.5
30.2
4.7
3.9
Aurobindo Pharma
Accumulate
820
872
47,900
14,923
17,162
23.0
23.0
38.2
43.6
21.5
18.8
6.6
5.0
36.0
30.2
3.6
3.0
Aventis*
Neutral
4,535
-
10,443
2,082
2,371
17.4
20.8
118.2
151.5
38.4
29.9
5.6
4.5
19.9
25.5
4.7
3.9
Cadila Healthcare
Neutral
397
-
40,622
10,224
11,840
21.0
22.0
14.6
17.6
27.2
22.6
7.4
5.8
30.8
29.0
4.0
3.4
Cipla
Neutral
626
-
50,290
14,211
16,611
20.6
19.0
27.0
28.9
23.2
21.7
3.9
3.4
18.4
16.8
3.5
3.0
Dr Reddy's
Accumulate
3,501
3,933
59,689
16,838
19,575
25.0
23.1
167.5
178.8
20.9
19.6
4.4
3.7
23.1
20.4
3.5
2.9
Dishman Pharma
Neutral
378
-
3,052
1,716
1,888
20.2
20.2
16.3
21.6
23.2
17.5
2.2
1.9
9.7
11.7
2.0
1.6
GSK Pharma*
Neutral
3,119
-
26,417
2,870
3,158
20.0
22.1
59.5
68.3
52.4
45.7
15.5
15.9
28.5
34.3
8.7
8.0
Indoco Remedies
Neutral
301
-
2,775
1,033
1,199
15.9
18.2
9.4
13.6
32.0
22.1
4.8
4.0
15.7
19.7
2.8
2.4
Ipca labs
Buy
724
900
9,129
3,363
3,909
12.9
18.6
13.4
28.0
54.0
25.8
7.0
5.6
7.4
14.0
3.0
2.6
Lupin
Neutral
1,807
-
81,372
13,092
16,561
25.0
27.0
50.4
68.3
35.9
26.5
7.4
5.9
22.8
24.7
5.9
4.6
Sun Pharma
Buy
740
950
178,148
28,163
32,610
25.8
30.7
17.4
26.9
42.6
27.5
4.0
3.5
13.0
16.6
5.8
4.8
Stock Watch
November 17, 2015
Company Name
Reco
CMP
Target
Mkt Cap
Sales ( Čcr )
OPM(%)
EPS (Č)
PER(x)
P/BV(x)
RoE(%)
EV/Sales(x)
(Č)
Price ( Č)
( Č cr )
FY16E FY17E
FY16E
FY17E
FY16E
FY17E
FY16E
FY17E
FY16E
FY17E
FY16E
FY17E
FY16E
FY17E
Power
Tata Power
Neutral
67
-
18,189
35,923
37,402
22.6
22.8
4.1
5.2
16.6
13.1
1.3
1.2
7.5
9.3
1.5
1.3
NTPC
Buy
131
157
108,139
87,064
98,846
23.5
23.5
11.7
13.2
11.2
9.9
1.3
1.2
11.4
12.1
2.3
2.0
Power Grid
Buy
129
170
67,409
20,702
23,361
86.7
86.4
12.1
13.2
10.7
9.8
1.6
1.4
15.6
15.1
8.2
7.6
Telecom
Bharti Airtel
Neutral
336
-
134,273
101,748
109,191
32.1
31.7
12.0
12.5
28.0
26.9
1.9
1.8
6.9
6.7
2.0
1.8
Idea Cellular
Neutral
130
-
46,903
34,282
36,941
32.0
31.5
5.9
6.2
22.1
21.0
2.0
1.8
9.9
9.3
1.9
1.8
zOthers
Abbott India
Neutral
5,090
-
10,816
2,715
3,153
14.5
14.1
134.3
152.2
37.9
33.4
9.5
7.8
27.4
25.6
3.7
3.1
Bajaj Electricals
Buy
233
341
2,350
4,719
5,287
5.2
5.8
8.6
12.7
27.2
18.4
3.1
2.7
11.4
14.8
0.5
0.4
Finolex Cables
Neutral
258
-
3,953
2,728
3,036
10.8
11.0
14.4
16.8
17.9
15.4
2.7
2.4
15.2
15.3
1.2
1.0
Goodyear India*
Accumulate
567
622
1,307
1,888
1,680
12.1
11.9
62.2
56.6
9.1
10.0
2.1
1.8
25.9
19.7
0.5
0.5
Hitachi
Neutral
1,353
-
3,678
1,779
2,081
7.8
8.8
21.8
33.4
62.0
40.5
10.0
8.1
17.4
22.1
2.1
1.8
Jyothy Laboratories
Neutral
298
-
5,398
1,620
1,847
11.5
11.5
7.3
8.5
40.9
35.2
5.3
4.9
13.3
14.4
3.2
2.7
MRF
Buy
37,974
45,575
16,105
20,316
14,488
21.4
21.1
5,488.0
3,798.0
6.9
10.0
2.4
1.9
41.1
21.2
0.7
1.0
Page Industries
Neutral
12,261
-
13,676
1,929
2,450
19.8
20.1
229.9
299.0
53.3
41.0
23.5
16.4
52.1
47.1
7.1
5.6
Relaxo Footwears
Neutral
475
-
5,705
1,767
2,152
12.3
12.5
19.3
25.1
24.7
19.0
6.1
4.7
27.7
27.8
3.3
2.7
Siyaram Silk Mills
Buy
949
1,145
890
1,636
1,815
11.5
11.5
89.9
104.1
10.6
9.1
1.8
1.5
17.9
17.8
0.7
0.6
Styrolution ABS India*
Neutral
725
-
1,274
1,271
1,440
8.6
9.2
32.0
41.1
22.6
17.7
2.3
2.1
10.7
12.4
1.0
0.8
Tree House
Buy
252
314
1,066
256
315
57.2
57.5
16.5
21.0
15.3
12.0
1.5
1.3
9.6
10.9
4.3
3.6
TVS Srichakra
Buy
2,707
3,210
2,073
2,127
2,388
15.2
14.9
237.7
267.5
11.4
10.1
4.8
3.4
51.7
39.8
1.0
0.9
HSIL
Accumulate
284
302
2,055
2,123
2,384
16.1
16.5
15.0
18.9
18.9
15.1
1.5
1.4
8.0
9.4
1.3
1.2
Kirloskar Engines India
Neutral
263
-
3,796
2,634
3,252
10.1
12.0
10.9
17.4
24.1
15.1
2.7
2.4
11.4
16.8
1.1
0.8
Ltd
M M Forgings
Buy
517
670
624
541
634
21.7
21.4
47.8
55.9
10.8
9.3
2.1
1.8
21.8
20.9
1.3
1.1
Banco Products (India)
Neutral
128
-
914
1,208
1,353
11.0
12.3
10.8
14.5
11.9
8.8
1.4
1.2
11.9
14.5
0.7
0.6
Competent Automobiles Neutral
144
-
88
1,007
1,114
3.1
3.1
23.7
28.2
6.1
5.1
0.9
0.7
13.9
14.6
0.1
0.1
Nilkamal
Neutral
989
-
1,475
1,910
2,083
10.5
10.3
63.3
69.2
15.6
14.3
2.6
2.2
17.6
16.5
0.8
0.7
Visaka Industries
Buy
120
166
191
1,158
1,272
8.6
9.5
23.7
32.7
5.1
3.7
0.5
0.5
10.1
12.5
0.3
0.3
Transport Corporation of
Neutral
296
-
2,253
2,830
3,350
8.8
9.0
14.4
18.3
20.6
16.2
3.2
2.8
15.4
17.1
0.9
0.8
India
Elecon Engineering
Accumulate
79
85
856
1,369
1,533
13.7
14.9
3.3
6.1
23.7
13.0
1.5
1.4
6.6
11.4
1.0
0.9
Surya Roshni
Buy
133
183
583
2,992
3,223
8.1
8.4
14.7
18.3
9.1
7.3
0.8
0.8
9.7
11.0
0.5
0.4
MT Educare
Buy
131
169
522
286
366
18.3
17.7
7.7
9.4
17.0
14.0
3.6
3.1
20.2
21.1
1.7
1.3
Stock Watch
November 17, 2015
Company Name
Reco
CMP
Target Mkt Cap
Sales ( Čcr )
OPM(%)
EPS (Č)
PER(x)
P/BV(x)
RoE(%)
EV/Sales(x)
(Č)
Price ( Č)
( Č cr )
FY16E FY17E FY16E FY17E FY16E FY17E FY16E FY17E FY16E FY17E FY16E FY17E FY16E FY17E
zOthers
Radico Khaitan
Buy
125
156
1,661
1,565
1,687
12.2
13.0
5.7
7.1
21.9
17.6
1.8
1.7
8.3
9.6
1.5
1.4
Garware Wall Ropes
Buy
347
423
759
861
967
10.9
10.9
24.0
28.2
14.5
12.3
2.1
1.8
14.6
14.9
0.9
0.8
Wonderla Holidays
Neutral
386
-
2,183
206
308
44.0
43.6
9.0
12.9
42.9
30.0
5.9
5.3
13.7
17.8
10.5
7.0
Linc Pen & Plastics
Accumulate
165
185
243
340
371
8.3
8.9
10.8
13.2
15.2
12.5
2.4
2.1
16.0
17.1
0.8
0.7
The Byke Hospitality
Accumulate
165
181
660
222
287
20.5
20.5
5.6
7.6
29.2
21.8
5.5
4.5
18.9
20.8
3.0
2.3
Source: Company, Angel Research; Note: *December year end; #September year end; &October year end; Price as on November 16, 2015
Market Outlook
November 17, 2015
Research Team Tel: 022 - 39357800
DISCLAIMER
Angel Broking Private Limited (hereinafter referred to as “Angel”) is a registered Member of National Stock Exchange of India Limited,
Bombay Stock Exchange Limited and Metropolitian Stock Exchange of India Limited. It is also registered as a Depository Participant with
CDSL and Portfolio Manager with SEBI. It also has registration with AMFI as a Mutual Fund Distributor. Angel Broking Private Limited is a
registered entity with SEBI for Research Analyst in terms of SEBI (Research Analyst) Regulations, 2014 vide registration number
INH000000164. Angel or its associates has not been debarred/ suspended by SEBI or any other regulatory authority for accessing
/dealing in securities Market. Angel or its associates including its relatives/analyst do not hold any financial interest/beneficial ownership
of more than 1% in the company covered by Analyst. Angel or its associates/analyst has not received any compensation / managed or co
-managed public offering of securities of the company covered by Analyst during the past twelve months. Angel/analyst has not served as
an officer, director or employee of company covered by Analyst and has not been engaged in market making activity of the company
covered by Analyst.
This document is solely for the personal information of the recipient, and must not be singularly used as the basis of any investment
decision. Nothing in this document should be construed as investment or financial advice. Each recipient of this document should make
such investigations as they deem necessary to arrive at an independent evaluation of an investment in the securities of the companies
referred to in this document (including the merits and risks involved), and should consult their own advisors to determine the merits and
risks of such an investment.
Reports based on technical and derivative analysis center on studying charts of a stock's price movement, outstanding positions and
trading volume, as opposed to focusing on a company's fundamentals and, as such, may not match with a report on a company's
fundamentals.
The information in this document has been printed on the basis of publicly available information, internal data and other reliable sources
believed to be true, but we do not represent that it is accurate or complete and it should not be relied on as such, as this document is for
general guidance only. Angel Broking Pvt. Limited or any of its affiliates/ group companies shall not be in any way responsible for any
loss or damage that may arise to any person from any inadvertent error in the information contained in this report. Angel Broking Pvt.
Limited has not independently verified all the information contained within this document. Accordingly, we cannot testify, nor make any
representation or warranty, express or implied, to the accuracy, contents or data contained within this document. While Angel Broking
Pvt. Limited endeavors to update on a reasonable basis the information discussed in this material, there may be regulatory, compliance,
or other reasons that prevent us from doing so.
This document is being supplied to you solely for your information, and its contents, information or data may not be reproduced,
redistributed or passed on, directly or indirectly.
Neither Angel Broking Pvt. Limited, nor its directors, employees or affiliates shall be liable for any loss or damage that may arise from or
in connection with the use of this information.
Note: Please refer to the important ‘Stock Holding Disclosure' report on the Angel website (Research Section). Also, please refer to the
latest update on respective stocks for the disclosure status in respect of those stocks. Angel Broking Pvt. Limited and its affiliates may have
investment positions in the stocks recommended in this report.