Market Outlook
February 17, 2016
Market Cues
Domestic Indices
Chg (%)
(Pts)
(Close)
Indian markets are expected to open positively tracking the SGX Nifty and some of
BSE Sensex
(1.5)
(362)
23,192
its Asian peers.
Nifty
(1.6)
(115)
7,048
US markets rallied for the second consecutive day led by buying in the recently
Mid Cap
(2.4)
(242)
9,707
battered sectors such as finance and technology.
Small Cap
(2.2)
(225)
9,782
Bankex
(2.1)
(346)
16,082
European markets closed mostly lower as a decline in commodity prices and mixed
earnings news offset positive sentiment surrounding the latest comments from the
European Central Bank.
Global Indices
Chg (%)
(Pts)
(Close)
Indian markets ended in the red dropping by about 2%. Weak global cues with the
Dow Jones
1.4
223
16,196
European markets reversing intraday gains resulted in weakness in the domestic
Nasdaq
2.3
98
4,436
markets.
FTSE
0.7
38
5,862
Nikkei
0.2
32
16,054
News & Result Analysis
Nissan sends JV termination notice to Ashok Leyland
Hang Seng
1.1
204
19,122
HCL Technologies buys Volvo group's external IT business
Shanghai Com
3.3
90
2,837
Detailed analysis on Pg2
Advances / Declines
BSE
NSE
Investor’s Ready Reckoner
Advances
590
1,331
Key Domestic & Global Indicators
Declines
2,048
237
Stock Watch: Latest investment recommendations on 150+ stocks
Unchanged
100
43
Refer P5 onwards
Top Picks
Volumes (` Cr)
CMP
Target
Upside
Company
Sector
Rating
(`)
(`)
(%)
BSE
2,605
Amara Raja Batteries Auto & Auto Ancillary
Buy
842
1,040
23.4
NSE
14,976
HCL Tech
IT
Buy
822
1,038
26.3
LIC Housing Finance Financials
Buy
411
592
44.0
Net Inflows (` Cr)
Net
Mtd
Ytd
Bharat Electronics
Capital Goods
Buy
1,116
1,414
26.7
FII
(1,123)
(4,181)
(12,554)
Navkar Corporation Others
Buy
161
265
64.2
MFs
894
1,675
79,421
More Top Picks on Pg4
Key Upcoming Events
Top Gainers
Price (`)
Chg (%)
Previous
Consensus
Date
Region
Event Description
Reading
Expectations
Adaniports
200
4.8
Feb 17 US
Housing starts (Thousands)
1,149
1,170
Wockpharma
790
4.3
Feb 17 US
Industrial Production (%)
(0.36)
0.35
Pvr
732
2.6
Feb 18 US
Initial jobless claims (Thousands)
269
275
Pipavavdoc
64
2.3
Feb 18 China
Consumer price index (%)
1.6
1.9
Naukri
749
2.1
6.(
Top Losers
Price (`)
Chg (%)
Piind
573
(3.5)
Star
885
(2.7)
Sadbhav
224
(2.5)
Hdil
59
(2.2)
Syndibank
52
(2.0)
As on February 16, 2016
Market Outlook
February 17, 2016
Nissan sends JV termination notice to Ashok Leyland
Japanese automobile major Nissan Motor Company has sent a notice to Ashok
Leyland Ltd terminating its technology development joint venture Nissan Ashok
Leyland Technologies Pvt. Ltd over non-payment of royalty. The joint venture
company is owned in 50:50 by the two partners.
Curiously, the termination notice comes soon after Ashok Leyland Ltd sent a legal
notice to Nissan for using the equipment owned by another joint venture company
to roll-out cars instead of light commercial vehicles (LCV).
Indian commercial vehicle-maker Ashok Leyland and Nissan Motor Company had
formed three joint ventures. The first joint venture is to make LCV's under the name
Ashok Leyland Nissan Vehicles Pvt. Ltd. in which Ashok Leyland owns 51% while
Nissan owns the rest. The two warring partners have two more joint ventures --
Nissan Ashok Leyland Powertrain Pvt. Ltd., the powertrain manufacturing company
owned 51% by Nissan and 49% by Ashok Leyland; and Nissan Ashok Leyland
Technologies Pvt. Ltd., the technology development company owned 50:50 by the
two partners.
According to a top source, the Japanese group decided to exit the joint venture as
Ashok Leyland has not paid royalty totalling over `200 crore. The Japanese
company has decided to stop supply of parts and other aspects to the joint
venture/Ashok Leyland.
Ashok Leyland had turned out four vehicle models from its partnership with Nissan
-- Dost, Mitr, Partner and Stile -- while for Nissan it was only Evalia. While Nissan
put a halt to Evalia, Ashok Leyland stopped production of Stile later as the vehicle
was not doing well in the market. However, Dost has been doing well for Ashok
Leyland.
Last year, Nissan Ashok Leyland Technologies went to the Board for Industrial and
Financial Reconstruction (BIFR). The company's net worth was eroded and the
accumulated losses were around `172.37 crore.
The termination of the technological agreement effectively puts a stop on the new
LCV product development by the joint venture. Currently, Ashok Leyland-Nissan JV
has just two products Dost and Mitr which contribute about 5% of the topline for
Ashok Leyland. We believe the termination of the technological collaboration of
Nissan with Ashok Leyland is unlikely to have material impact on the Ashok
Leyland financials. We are not clear as to whether Ashok Leyland would be able to
sell the existing products given the termination of the technological agreement and
await clarity on the same. As of now, we are maintaining our earnings
assumptions and Buy rating on Ashok Leyland.
HCL Technologies buys Volvo group's external IT business
HCL Technologies has closed a $1 billion-plus deal with Volvo Group that includes
acquisition of the external IT services arm of the Swedish automobile giant and
end-to-end internal outsourcing of the group. HCL claims that the deal is one of
the largest IT deals signed by any Indian IT company and definitely the largest in
HCL's history so far. Though the company has not disclosed the total value of the
deal that is spread over five years, it is estimated to be in the range of
Market Outlook
February 17, 2016
$1.75 billion, or about Rs 11,900 crore. The letter of intent for this deal was
signed in October last year. In October, HCL had said it is acquiring Volvo's
external IT business for
$130 million and the group derived revenues of
$190 million from this business. The total worth of Volvo's internal IT contract,
spreads across the company's entire global operations, is "much more", the
company said.
Post the deal, 40 clients of Volvo's IT services arm from the Nordics and France
region will move to HCL along with 2,500 Volvo employees across 11 countries.
Ashish Gupta, head — diversified industries and infrastructure services, EMEA, at
HCL Technologies, said the deal is adding two significant capabilities to the
company - deep knowledge of the automobile industry and mainframe capability.
HCL has also announced an automotive centre of excellence in Gothenburg based
on the domain expertise of the Volvo team, to serve the former's global automotive
and manufacturing customers. "Combining the strengths of HCL with those of the
transferred parts of Volvo IT will result in an organisation with formidable
capabilities and an intimate understanding of Volvo Group needs and
opportunities," said Olle Hogblom, CIO of the Volvo Group and president of Volvo
IT.
Post the deal, HCL claims to be the largest IT services provider of Indian origin in
the Nordics. "This addition enables HCL to achieve an even stronger presence in
the Nordics and the wider European region, and accelerates our journey in these
markets," said Anant Gupta, CEO of HCL Technologies. We currently have Buy
rating on HCL Technologies.
Economic and Political News
Cargo traffic at 12 major ports up 3.36% to 499 MT: Official
Centre to consider 1,980 Mw Ghatampur project in Kanpur soon
Will ensure patents are given within 18 months of application: Amitabh Kant
Corporate News
Bombay HC extends 'stay' of FTIL-NSEL merger till end of March
PNB declares UB (Holdings) wilful defaulter
Thomas Cook India seals deal with Airbnb
Market Outlook
February 17, 2016
Top Picks ★★★★★
Large Cap
Market Cap
CMP
Target
Upside
Company
Rationale
(` Cr)
(`)
(`)
(%)
To outpace battery industry growth due to better technological
Amara Raja Batteries
14,390
842
1,040
23.4
products leading to market share gains in both the automotive
OEM and replacement segments.
Earnings to grow strongly given the MHCV cyclical upturn.
Ashok Leyland
24,887
87
111
26.9
Focus on exports and LCV's provides additional growth
avenue.
Uptick in defense capex by government when coupled with
Bharat Electronics
26,791
1,116
1,414
26.7
BELs strong market positioning, indicate that good times are
ahead for BEL.
The stock is trading at attractive valuations and is factoring all
HCL Tech
115,811
822
1,038
26.3
the bad news.
Strong visibility for a robust 20% earnings trajectory, coupled
HDFC Bank
245,903
973
1,262
29.7
with high quality of earnings on account of high quality retail
business and strategic focus on highly rated corporates.
Back on the growth trend, expect a long term growth of 14%
Infosys
248,300
1,081
1,347
24.6
to be a US$20bn in FY2020.
LICHF continues to grow its retail loan book at a healthy pace
with improvement in asset quality. We expect the company to
LIC Housing Finance
20,742
411
592
44.0
post a healthy loan book which is likely to reflect in a strong
earnings growth.
Huge bid pipeline of re-development works at Delhi and other
NBCC
10,252
854
1,089
27.5
State Governments and opportunity from Smart City, positions
NBCC to report strong growth, going forward.
New launches to enable outpace industry growth; margins
TVS Motors
13,146
277
330
19.3
expansion to boost earnings.
Source: Company, Angel Research
Mid Cap
Market Cap
CMP
Target
Upside
Company
Rationale
(` Cr)
(`)
(`)
(%)
Favourable outlook for the AC industry to augur well for
Cooling products business which is out pacing the market
Blue Star
2,995
333
439
31.8
growth. EMPPAC division's profitability to improve once
operating environment turns around.
Economic recovery to have favourable impact on advertising &
circulation revenue growth. Further, the acquisition of a radio
Jagran Prakashan
5,095
156
189
21.3
business (Radio City) would also boost the company's revenue
growth.
Massive capacity expansion along with rail advantage at ICD
Navkar Corporation
2,302
161
265
64.2
as well CFS augurs well for the company
Earnings boost on back of stable material prices and
Radico Khaitan
1,303
98
156
59.3
favourable pricing environment. Valuation discount to peers
provides additional comfort
Strong brands and distribution network would boost growth
Siyaram Silk Mills
934
997
1,354
35.8
going ahead. Stock currently trades at an inexpensive
valuation.
Structural shift in the Lighting industry towards LED lighting will
Surya Roshni
2,995
333
439
31.8
drive growth.
Source: Company, Angel Research
Market Outlook
February 17, 2016
Key Upcoming Events
Global economic events release calendar
Date
Time
Country
Event Description
Unit
Period
Bloomberg Data
Last Reported Estimated
Feb 17, 2016
7:00PM
US
Housing Starts
Thousands
Jan
1,149.00
1,175.00
7:00PM
US
Building permits
Thousands
Jan
1,204.00
1,200.00
3:00PM
UK
Jobless claims change
% Change
Jan
(4.30)
(3.00)
7:45PM
US
Industrial Production
%
Jan
(0.36)
0.35
US
Producer Price Index (mom)
% Change
Jan
(0.80)
--
Feb 18, 2016
7:00PM
US
Initial Jobless claims
Thousands
Feb 13
269.00
275.00
7:00AM
China
Consumer Price Index (YoY)
% Change
Jan
1.60
1.90
Feb 19, 2016
7:00PM
US
Consumer price index (mom)
% Change
Jan
(0.10)
(0.10)
8:30PM
Euro Zone
Euro-Zone Consumer Confidence
Value
Feb A
(6.30)
(6.60)
Feb 22, 2016
2:00PM
Germany
PMI Services
Value
Feb P
55.00
--
2:00PM
Germany
PMI Manufacturing
Value
Feb P
52.30
--
Feb 23, 2016
12:30PM
Germany
GDP nsa (YoY)
% Change
4Q F
2.10
--
8:30PM
US
Existing home sales
Million
Jan
5.46
5.50
8:30PM
US
Consumer Confidence
S.A./ 1985=100
Feb
98.10
97.50
Feb 24, 2016
8:30PM
US
New home sales
Thousands
Jan
544.00
525.00
Feb 25, 2016
3:00PM
UK
GDP (YoY)
% Change
4Q P
1.90
--
3:30PM
Euro Zone
Euro-Zone CPI (YoY)
%
Jan F
0.40
--
Feb 26, 2016
7:00PM
US
GDP Qoq (Annualised)
% Change
4Q S
0.70
0.30
Source: Bloomberg, Angel Research
Market Outlook
February 17, 2016
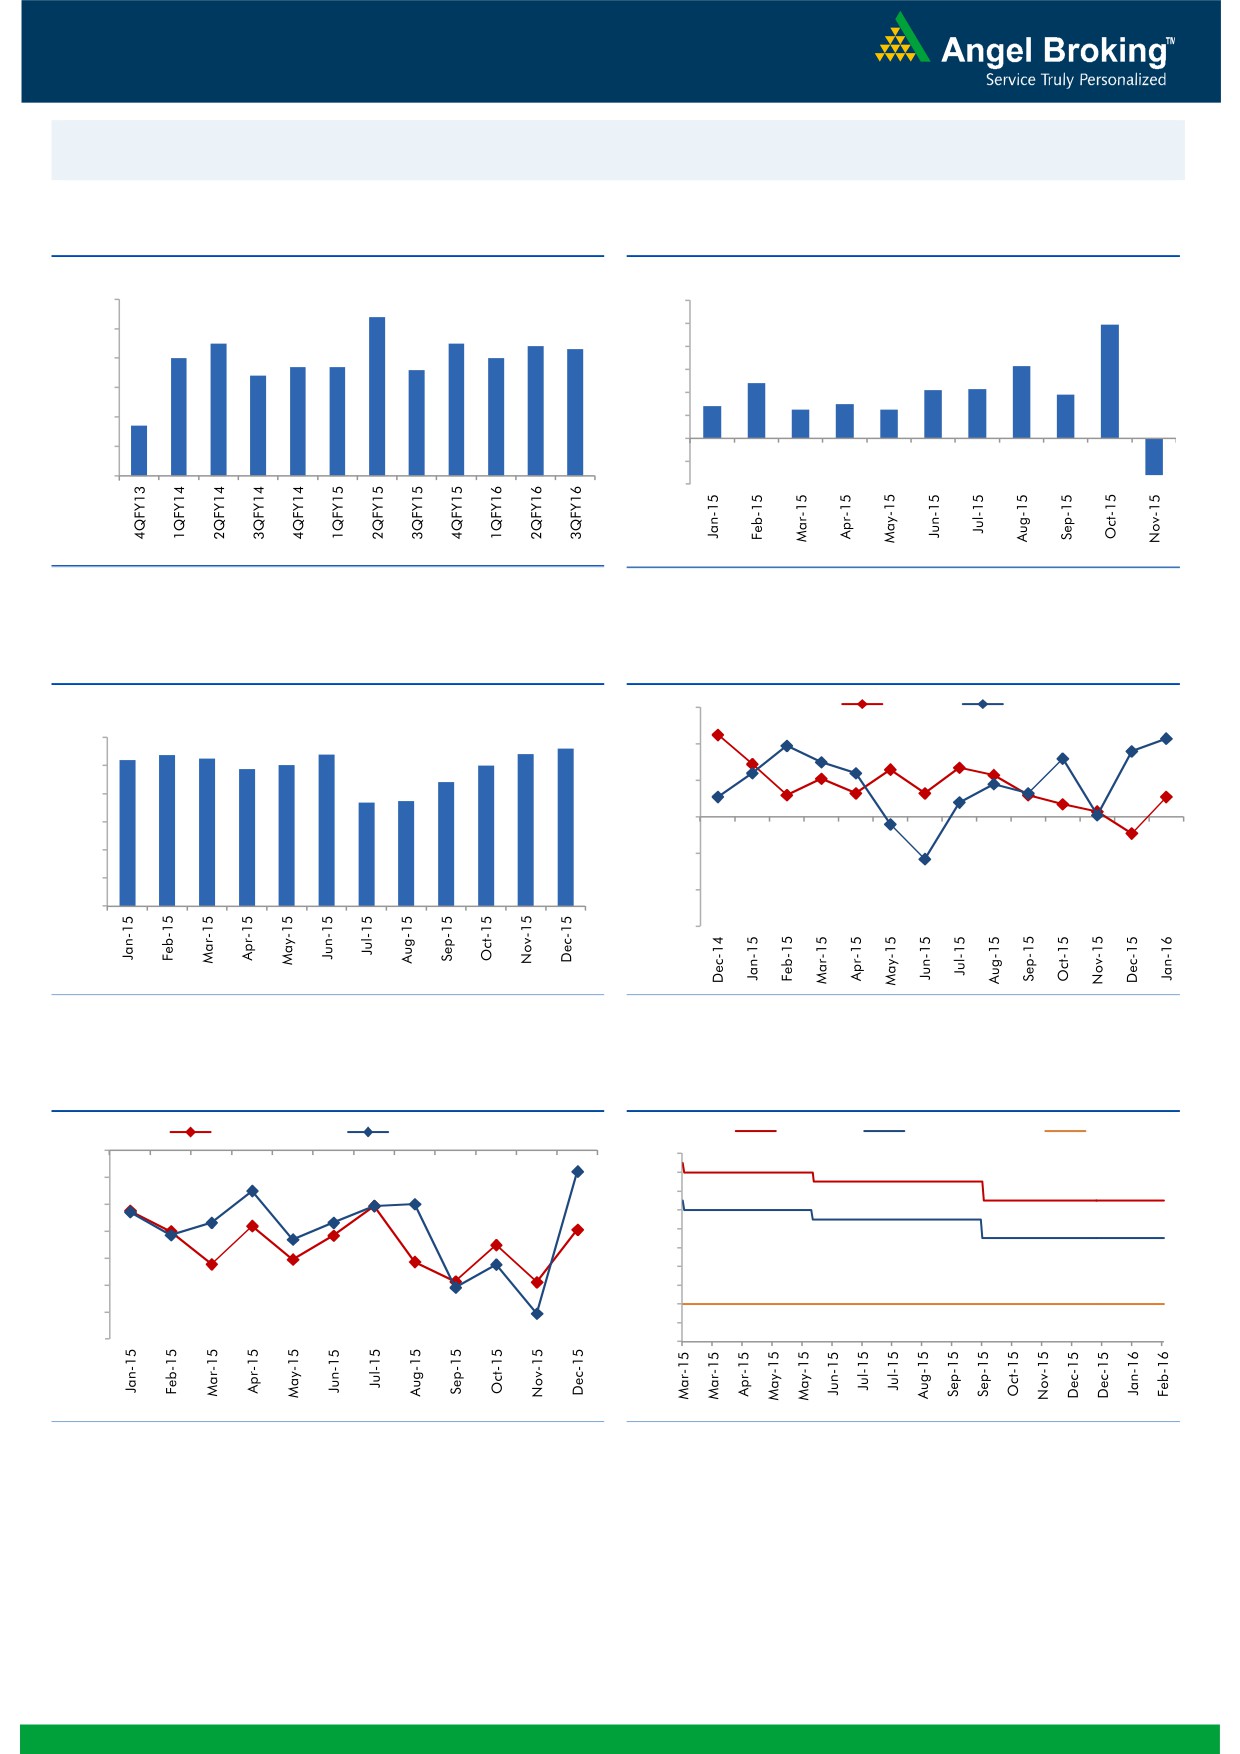
Macro watch
Exhibit 1: Quarterly GDP trends
Exhibit 2: IIP trends
(%)
(%)
9.0
8.4
12.0
9.9
7.5
7.5
10.0
8.0
7.4
7.3
7.0
7.0
6.7
6.7
6.6
8.0
6.3
7.0
6.4
6.0
4.8
4.3
4.2
3.8
6.0
2.8
3.0
4.0
2.5
2.5
4.7
5.0
2.0
(3.2)
-
4.0
(2.0)
3.0
(4.0)
Source: CSO, Angel Research
Source: MOSPI, Angel Research
Exhibit 3: Monthly CPI inflation trends
Exhibit 4: Manufacturing and services PMI
(%)
56.0
Mfg. PMI
Services PMI
6.0
5.4
5.4
5.4
5.6
5.2
5.3
54.0
4.9
5.0
5.0
5.0
4.4
3.7
3.7
52.0
4.0
3.0
50.0
2.0
48.0
1.0
46.0
-
44.0
Source: MOSPI, Angel Research
Source: Market, Angel Research; Note: Level above 50 indicates expansion
Exhibit 5: Exports and imports growth trends
Exhibit 6: Key policy rates
(%)
Exports yoy growth
Imports yoy growth
(%)
Repo rate
Reverse Repo rate
CRR
0.0
8.00
(5.0)
7.50
7.00
(10.0)
6.50
(15.0)
6.00
5.50
(20.0)
5.00
(25.0)
4.50
4.00
(30.0)
3.50
(35.0)
3.00
Source: Bloomberg, Angel Research
Source: RBI, Angel Research
Market Outlook
February 17, 2016
Global watch
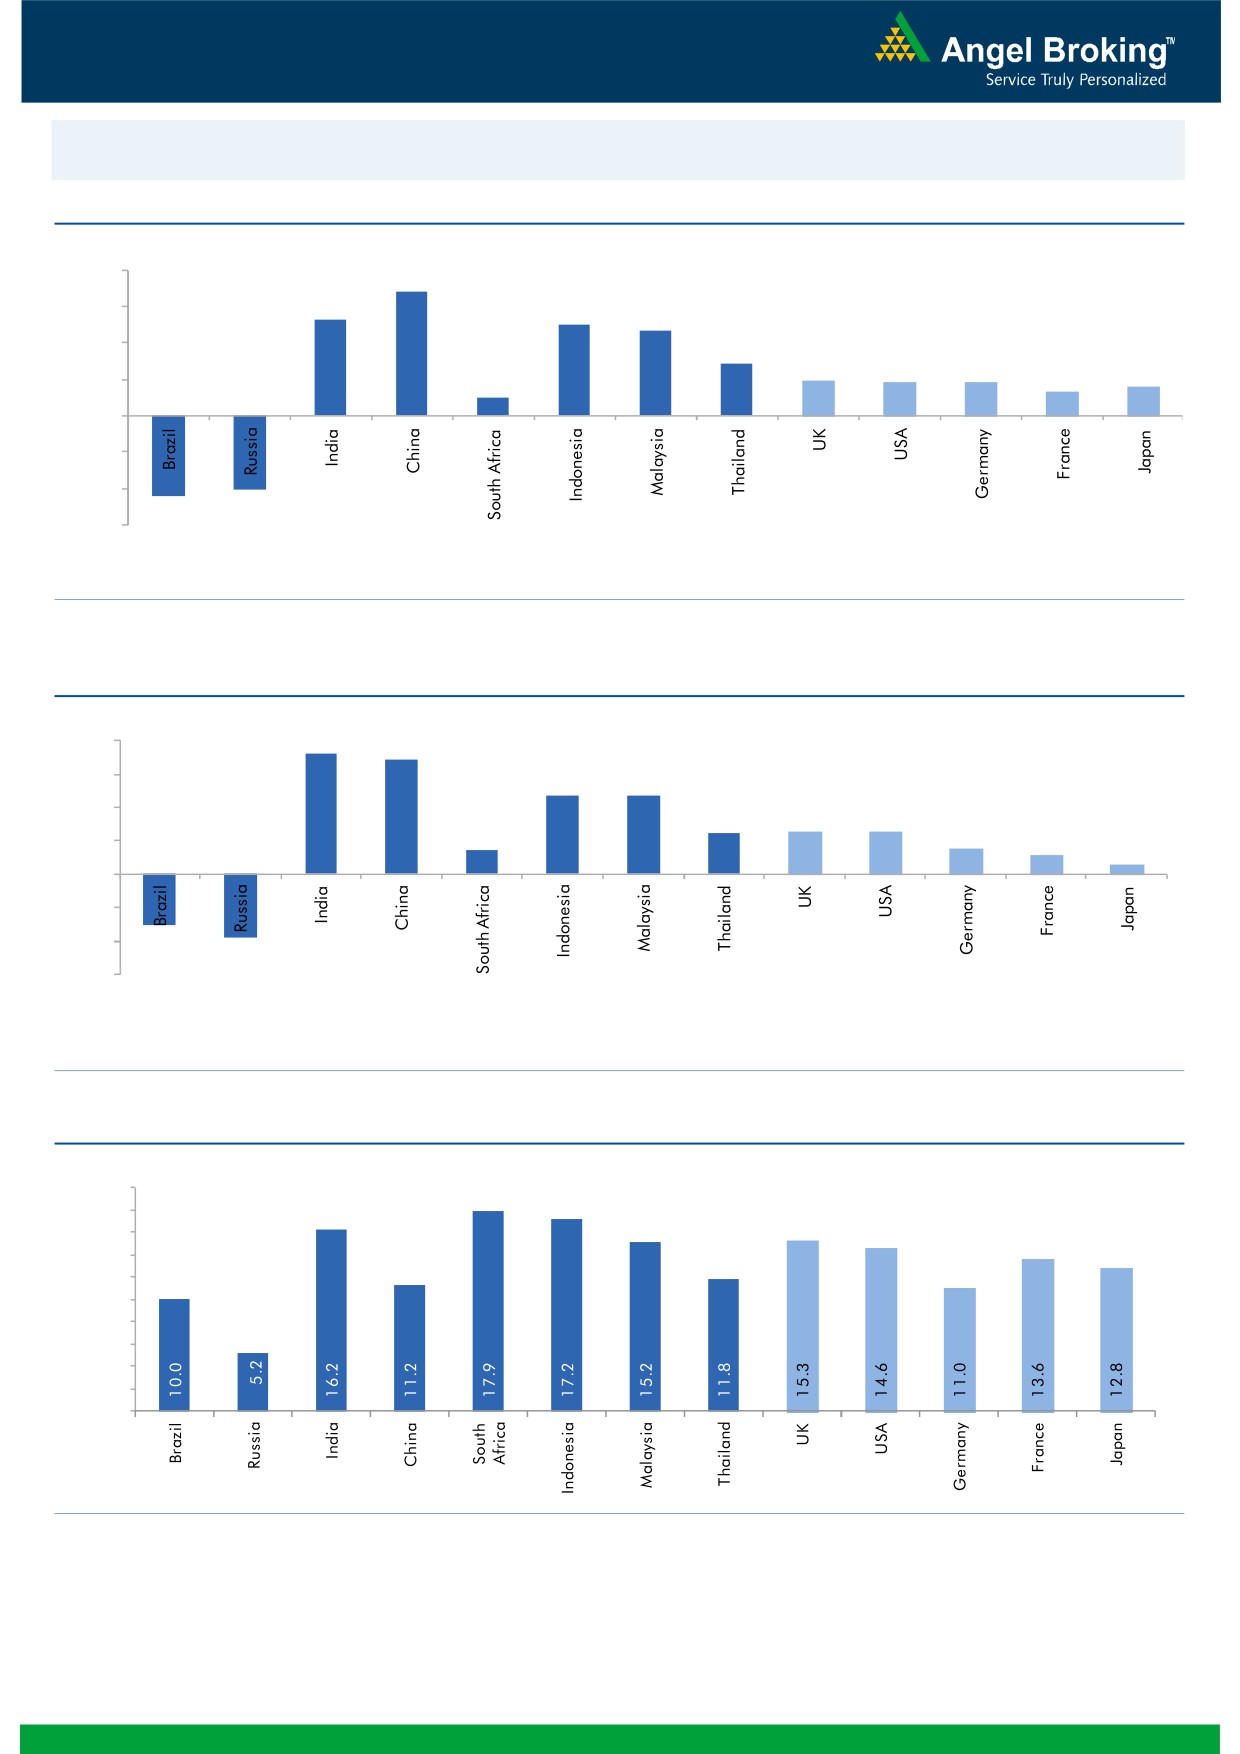
Exhibit 1: Latest quarterly GDP Growth (%, yoy) across select developing and developed countries
(%)
8.0
6.8
5.3
6.0
5.0
4.7
4.0
2.9
1.9
1.8
1.8
1.3
1.6
2.0
1.0
(4.5)
(4.1)
-
(2.0)
(4.0)
(6.0)
Source: Bloomberg, Angel Research
Exhibit 2: 2015 GDP Growth projection by IMF (%, yoy) across select developing and developed countries
(%)
7.3
8.0
6.8
6.0
4.7
4.7
4.0
2.5
2.5
2.6
1.4
1.5
2.0
1.2
0.6
(3.0)
(3.8)
-
(2.0)
(4.0)
(6.0)
Source: IMF, Angel Research
Exhibit 3: One year forward P-E ratio across select developing and developed countries
(x)
20.0
18.0
16.0
14.0
12.0
10.0
8.0
6.0
4.0
2.0
-
Source: IMF, Angel Research
Market Outlook
February 17, 2016
Exhibit 4: Relative performance of indices across globe
Returns (%)
Country
Name of index
Closing price
1M
3M
1YR
Brazil
Bovespa
40,948
3.6
(12.7)
(16.9)
Russia
Micex
1,754
9.0
0.8
(4.6)
India
Nifty
7,048
(6.5)
(9.2)
(18.3)
China
Shanghai Composite
2,837
(5.6)
(22.0)
(8.9)
South Africa
Top 40
43,951
4.4
(4.4)
(6.1)
Mexico
Mexbol
43,100
4.2
(2.3)
0.3
Indonesia
LQ45
831
6.4
10.2
(8.4)
Malaysia
KLCI
1,665
1.7
(1.2)
(7.7)
Thailand
SET 50
814
5.3
(8.5)
(24.0)
USA
Dow Jones
16,196
0.3
(8.5)
(10.3)
UK
FTSE
5,862
1.0
(4.2)
(15.0)
Japan
Nikkei
16,054
(6.9)
(18.4)
(8.3)
Germany
DAX
9,135
(4.3)
(15.3)
(16.7)
France
CAC
4,111
(2.4)
(14.4)
(15.5)
Source: Bloomberg, Angel Research
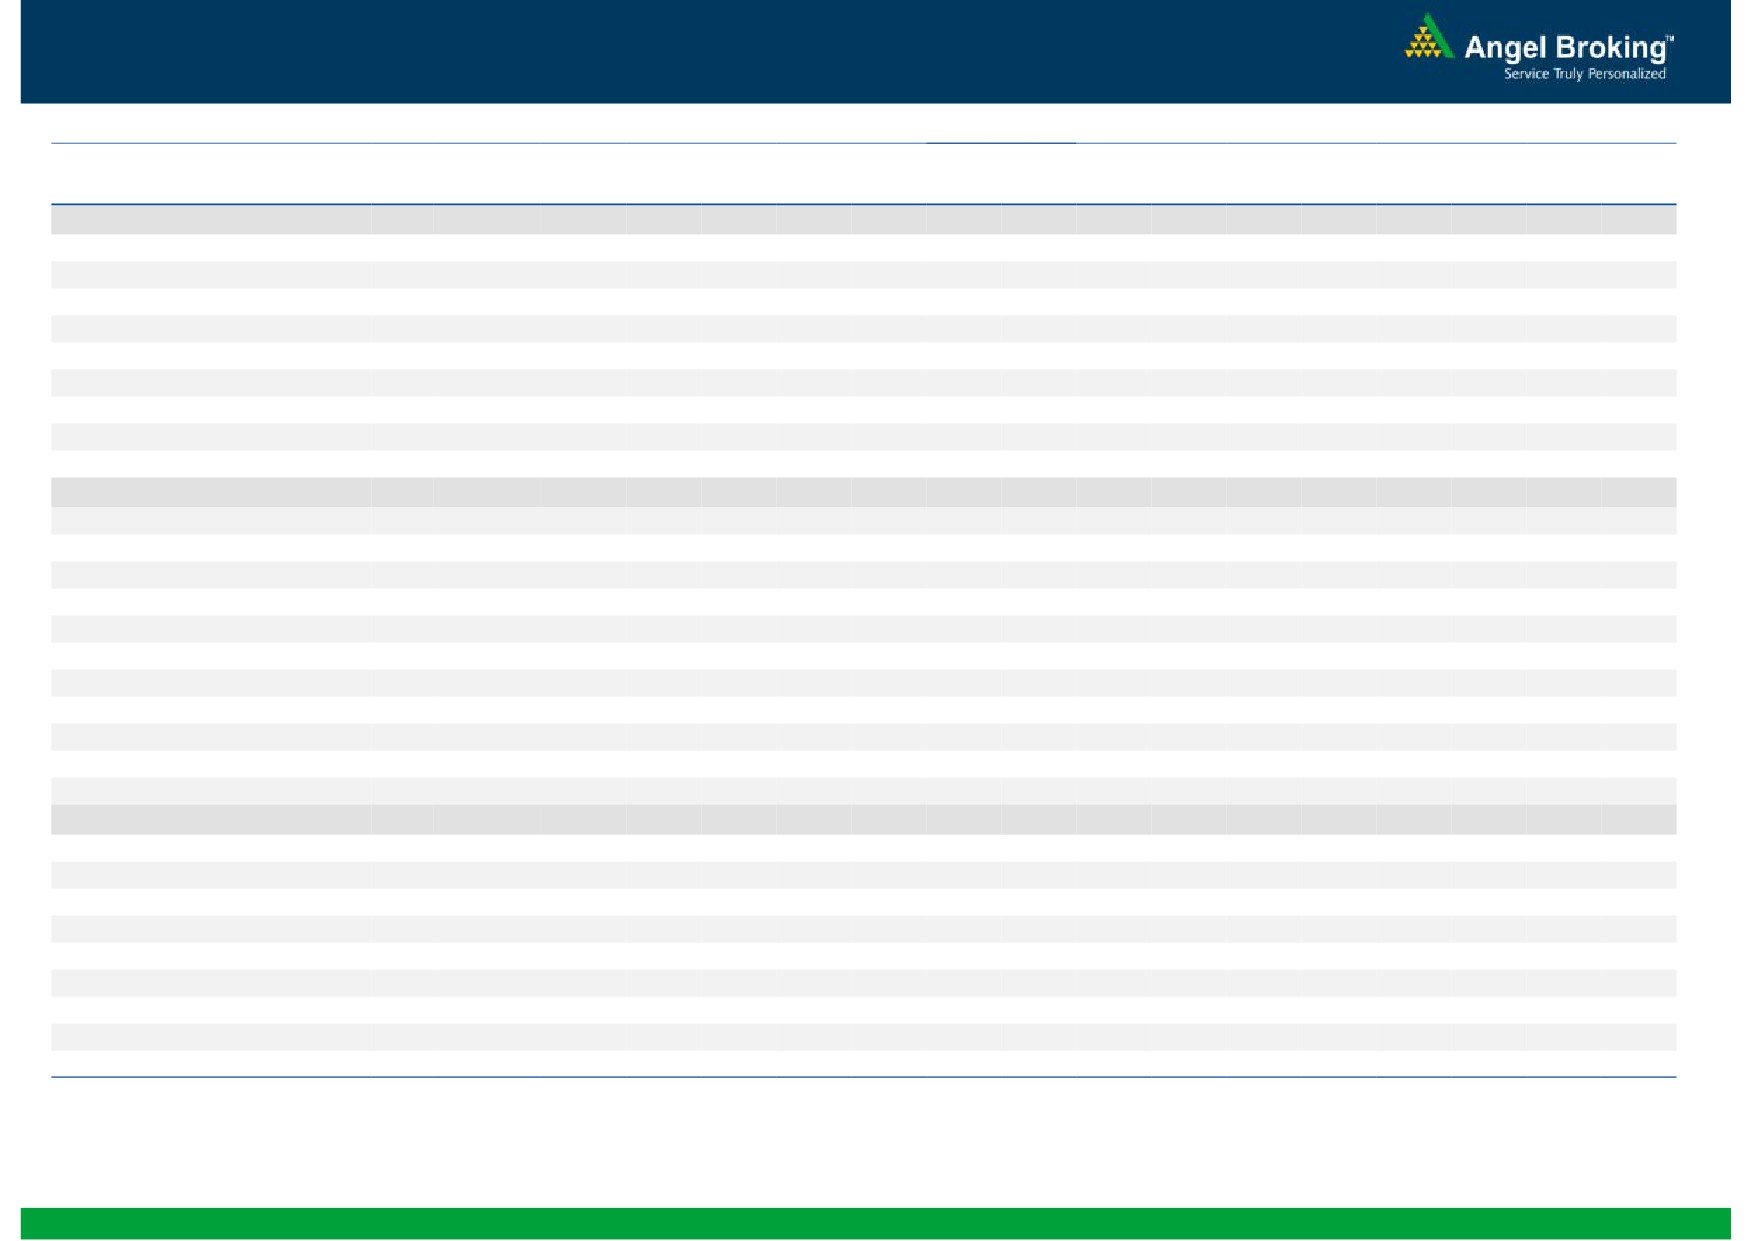
Stock Watch
February 17, 2016
Company Name
Reco
CMP
Target
Mkt Cap
Sales ( Čcr )
OPM(%)
EPS (Č)
PER(x)
P/BV(x)
RoE(%)
EV/Sales(x)
(Č)
Price ( Č)
( Č cr )
FY16E FY17E
FY16E
FY17E
FY16E
FY17E
FY16E
FY17E
FY16E
FY17E
FY16E
FY17E
FY16E
FY17E
Agri / Agri Chemical
Rallis
Neutral
149
-
2,898
2,097
2,415
14.4
14.4
9.5
11.0
15.7
13.6
3.1
2.7
21.1
21.3
1.4
1.2
United Phosphorus
Buy
402
480
17,226
12,500
14,375
18.3
18.3
29.8
35.9
13.5
11.2
2.5
2.1
20.0
20.3
1.5
1.2
Auto & Auto Ancillary
Ashok Leyland
Buy
87
111
24,887
17,995
21,544
11.4
11.6
3.4
4.7
25.7
18.6
4.5
4.1
17.7
22.2
1.3
1.1
Bajaj Auto
Accumulate
2,335
2,585
67,560
22,709
25,860
20.9
20.1
129.0
143.6
18.1
16.3
5.6
4.8
30.7
29.4
2.5
2.2
Bharat Forge
Buy
777
943
18,099
7,867
8,881
20.0
20.3
34.4
41.0
22.6
19.0
4.4
3.6
21.1
20.9
2.4
2.1
Eicher Motors
Accumulate
18,690
20,044
50,765
15,556
16,747
15.5
17.3
464.8
597.5
40.2
31.3
14.7
10.8
36.2
34.3
3.2
2.9
Gabriel India
Buy
78
101
1,118
1,415
1,544
8.7
9.0
4.6
5.4
16.9
14.4
3.1
2.7
18.1
18.9
0.8
0.7
Hero Motocorp
Accumulate
2,508
2,864
50,091
28,244
30,532
15.5
15.9
156.7
168.5
16.0
14.9
6.4
5.4
39.9
36.4
1.6
1.5
Jamna Auto Industries Buy
127
160
1,014
1,281
1,473
11.2
11.5
7.6
9.2
16.7
13.8
4.2
3.5
25.4
25.2
0.9
0.7
L G Balakrishnan & Bros Neutral
429
-
674
1,254
1,394
11.6
11.8
35.9
41.7
12.0
10.3
1.6
1.4
13.5
13.8
0.6
0.6
Mahindra and Mahindra Accumulate
1,204
1,364
74,807
38,416
42,904
13.7
13.9
54.8
63.4
22.0
19.0
3.4
3.0
15.4
15.8
1.6
1.4
Maruti
Neutral
3,706
-
111,954
57,865
68,104
16.4
16.7
176.3
225.5
21.0
16.4
4.1
3.5
19.4
21.2
1.7
1.4
Minda Industries
Buy
757
1,047
1,201
2,523
2,890
8.7
9.0
55.0
65.4
13.8
11.6
2.7
2.2
19.3
18.7
0.6
0.5
Motherson Sumi
Buy
226
313
29,946
39,343
45,100
8.8
9.1
10.1
12.5
22.4
18.1
7.1
5.6
35.3
34.4
0.8
0.7
Rane Brake Lining
Buy
334
465
264
454
511
11.5
12.0
25.2
31.0
13.3
10.8
2.0
1.8
14.9
16.6
0.7
0.7
Setco Automotive
Neutral
30
-
396
594
741
12.7
13.7
1.7
3.2
17.4
9.3
1.8
1.6
10.4
16.9
1.1
0.9
Tata Motors
Buy
301
371
86,905
259,686
273,957
13.0
13.4
25.9
29.5
11.6
10.2
1.5
1.3
8.0
9.0
0.5
0.5
TVS Motor
Buy
277
330
13,146
11,263
13,122
6.9
8.5
9.2
15.0
30.1
18.5
6.9
5.5
22.7
29.6
1.2
1.0
Amara Raja Batteries
Buy
842
1,040
14,390
4,892
5,871
17.4
17.6
28.8
37.1
29.3
22.7
6.8
5.5
23.4
24.1
2.9
2.4
Exide Industries
Buy
126
162
10,740
6,950
7,784
14.4
14.8
6.6
7.3
19.1
17.3
2.4
2.2
12.6
12.8
1.3
1.1
Apollo Tyres
Accumulate
151
171
7,707
12,146
12,689
16.8
16.0
21.2
19.0
7.1
8.0
1.2
1.0
16.5
13.0
0.7
0.8
Ceat
Buy
953
1,119
3,853
6,041
6,597
14.1
13.7
99.5
111.9
9.6
8.5
1.9
1.6
19.6
18.5
0.8
0.7
JK Tyres
Neutral
81
-
1,830
7,446
7,669
15.2
14.0
19.6
18.4
4.1
4.4
1.0
0.9
25.2
19.5
0.6
0.5
Swaraj Engines
Buy
791
919
982
552
630
14.2
14.7
44.6
54.1
17.7
14.6
4.1
3.8
23.2
25.6
1.6
1.4
Subros
Neutral
81
-
487
1,293
1,527
11.8
11.9
4.2
6.7
19.3
12.1
1.5
1.3
7.7
11.5
0.7
0.6
Indag Rubber
Neutral
158
-
414
283
329
17.0
17.2
13.0
15.4
12.2
10.2
2.7
2.2
21.8
21.6
1.2
1.0
Capital Goods
ACE
Neutral
34
-
338
660
839
4.7
8.2
1.0
3.9
34.2
8.8
1.1
1.0
3.2
11.3
0.7
0.5
BEML
Neutral
959
-
3,994
3,277
4,006
6.0
8.9
29.2
64.3
32.8
14.9
1.8
1.7
5.7
11.7
1.3
1.0
Bharat Electronics
Buy
1,116
1,414
26,791
7,737
8,634
16.8
17.2
54.0
61.5
20.7
18.2
3.0
2.6
39.3
45.6
2.6
2.2
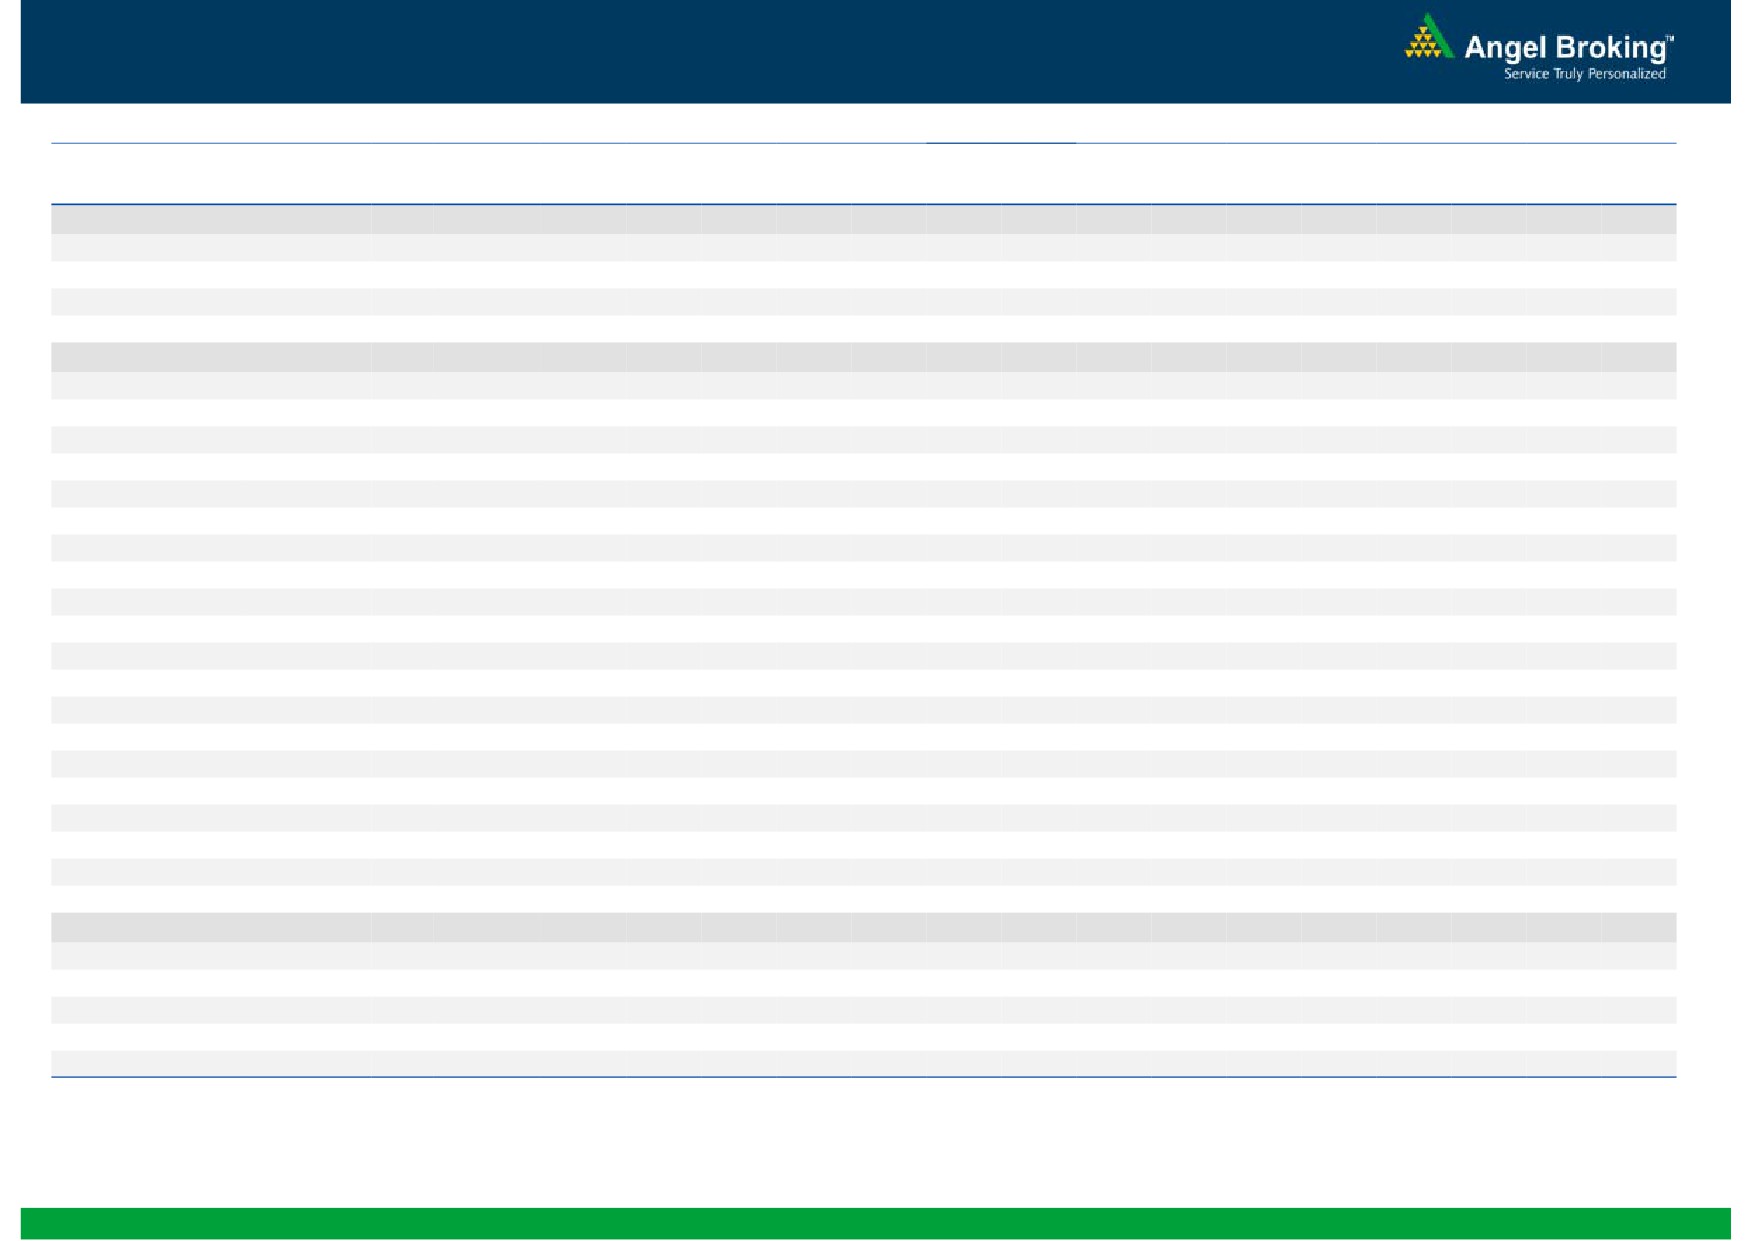
Stock Watch
February 17, 2016
Company Name
Reco
CMP
Target
Mkt Cap
Sales ( Čcr )
OPM(%)
EPS (Č)
PER(x)
P/BV(x)
RoE(%)
EV/Sales(x)
(Č)
Price ( Č)
( Č cr )
FY16E
FY17E
FY16E
FY17E
FY16E
FY17E
FY16E
FY17E
FY16E
FY17E
FY16E
FY17E
FY16E
FY17E
Capital Goods
Voltas
Buy
231
353
7,648
5,363
5,963
8.0
9.1
11.0
13.8
21.0
16.8
3.2
2.8
16.2
17.9
1.4
1.2
BGR Energy
Neutral
97
-
696
3,615
3,181
9.5
9.4
16.7
12.4
5.8
7.8
0.5
0.5
10.0
7.0
0.6
0.8
BHEL
Neutral
103
-
25,271
33,722
35,272
10.8
11.7
10.5
14.2
9.8
7.3
0.7
0.7
7.0
9.0
0.8
0.8
Blue Star
Buy
333
439
2,995
3,548
3,977
6.3
6.9
13.7
17.2
24.3
19.4
6.1
4.0
26.1
25.4
0.9
0.8
Crompton Greaves
Neutral
124
-
7,743
13,484
14,687
4.9
6.2
4.5
7.1
27.5
17.4
1.9
1.8
7.2
10.8
0.7
0.6
Greaves Cotton
Neutral
127
-
3,089
1,655
1,755
16.6
16.8
7.4
7.8
17.1
16.2
3.4
3.2
21.1
20.6
1.8
1.7
Inox Wind
Buy
232
458
5,155
4,980
5,943
17.0
17.5
26.6
31.6
8.7
7.4
2.6
1.9
35.0
30.0
1.2
0.9
KEC International
Neutral
106
-
2,719
8,791
9,716
6.1
6.8
5.4
8.2
19.6
12.9
2.0
1.8
10.0
14.0
0.5
0.5
Thermax
Neutral
755
-
8,999
6,413
7,525
7.4
8.5
30.5
39.3
24.8
19.2
3.8
3.3
15.0
17.0
1.4
1.1
Cement
ACC
Buy
1,228
1,630
23,046
13,151
14,757
16.4
18.3
63.9
83.4
19.2
14.7
2.5
2.3
13.3
16.1
1.6
1.3
Ambuja Cements
Buy
193
233
29,952
11,564
12,556
19.4
20.7
8.9
10.1
21.7
19.1
2.7
2.6
12.8
13.8
2.2
2.0
HeidelbergCement
Neutral
62
-
1,406
1,772
1,926
13.3
15.4
1.0
3.0
62.1
20.7
1.6
1.5
2.6
7.9
1.4
1.2
India Cements
Buy
71
112
2,190
4,216
4,840
18.0
19.5
4.0
9.9
17.8
7.2
0.7
0.7
4.0
9.5
0.8
0.7
JK Cement
Buy
435
744
3,041
3,661
4,742
10.1
15.8
18.0
61.0
24.2
7.1
1.7
1.5
7.5
22.9
1.3
1.0
J K Lakshmi Cement
Buy
259
430
3,048
2,947
3,616
16.7
19.9
11.5
27.2
22.5
9.5
2.1
1.9
9.8
20.8
1.4
1.1
Mangalam Cements
Neutral
160
-
427
1,053
1,347
10.5
13.3
8.4
26.0
19.1
6.2
0.8
0.7
4.3
12.5
0.8
0.6
Orient Cement
Buy
133
183
2,717
1,854
2,524
21.2
22.2
7.7
11.1
17.2
12.0
2.5
2.1
13.3
15.7
2.2
1.5
Ramco Cements
Neutral
370
-
8,805
4,036
4,545
20.8
21.3
15.1
18.8
24.5
19.7
3.0
2.7
12.9
14.3
2.7
2.3
Shree Cement^
Neutral
10,213
-
35,580
7,150
8,742
26.7
28.6
228.0
345.5
44.8
29.6
6.6
5.5
15.7
20.3
4.7
3.8
UltraTech Cement
Buy
2,791
3,282
76,589
25,021
30,023
19.1
21.6
89.0
132.0
31.4
21.1
3.6
3.2
12.2
15.9
3.1
2.6
Construction
ITNL
Neutral
66
-
2,181
7,360
8,825
34.0
35.9
7.0
9.0
9.5
7.4
0.3
0.3
3.2
3.7
3.7
3.6
KNR Constructions
Buy
438
673
1,233
937
1,470
14.3
14.0
33.5
38.6
13.1
11.4
2.0
1.7
15.4
15.4
1.4
0.9
Larsen & Toubro
Buy
1,108
1,310
103,199
58,870
65,708
8.3
10.3
42.0
53.0
26.4
20.9
1.8
1.7
8.8
11.2
2.0
1.8
Gujarat Pipavav Port
Neutral
156
-
7,525
629
684
51.0
52.2
6.4
5.9
24.3
26.4
3.2
2.9
15.9
12.7
11.6
10.5
MBL Infrastructures
Buy
136
285
565
2,313
2,797
12.2
14.6
19.0
20.0
7.2
6.8
0.8
0.7
11.3
10.6
1.0
0.9
Nagarjuna Const.
Neutral
64
-
3,561
7,892
8,842
8.8
9.1
3.0
5.3
21.4
12.1
1.1
1.0
5.0
8.5
0.7
0.6
PNC Infratech
Accumulate
517
558
2,650
1,873
2,288
13.2
13.5
24.0
32.0
21.5
16.1
2.1
1.9
12.1
12.3
1.5
1.3
Simplex Infra
Neutral
229
-
1,134
5,955
6,829
10.3
10.5
16.0
31.0
14.3
7.4
0.8
0.7
5.3
9.9
0.7
0.6
Power Mech Projects
Neutral
552
-
812
1,539
1,801
12.8
12.7
59.0
72.1
9.4
7.7
1.4
1.2
18.6
16.8
0.5
0.5
Stock Watch
February 17, 2016
Company Name
Reco
CMP
Target
Mkt Cap
Sales ( Čcr )
OPM(%)
EPS (Č)
PER(x)
P/BV(x)
RoE(%)
EV/Sales(x)
(Č)
Price ( Č)
( Č cr )
FY16E
FY17E
FY16E
FY17E
FY16E
FY17E
FY16E
FY17E
FY16E
FY17E
FY16E
FY17E
FY16E
FY17E
Construction
Sadbhav Engineering
Neutral
227
-
3,898
3,481
4,219
10.7
10.8
8.0
12.0
28.4
18.9
2.6
2.3
10.3
13.5
1.4
1.2
NBCC
Buy
854
1,089
10,252
5,816
7,382
6.9
7.7
29.6
39.8
28.9
21.5
5.2
4.1
24.1
26.7
1.5
1.1
MEP Infra
Neutral
42
-
687
1,956
1,876
28.1
30.5
1.3
3.0
32.5
14.1
6.8
4.6
21.2
32.8
1.8
1.7
SIPL
Neutral
72
-
2,518
675
1,042
62.4
64.7
-
-
2.7
3.1
-
-
15.4
10.4
Financials
Allahabad Bank
Neutral
42
-
2,546
8,569
9,392
2.8
2.9
16.3
27.5
2.6
1.5
0.2
0.2
7.6
11.9
-
-
Axis Bank
Buy
406
494
96,525
26,473
31,527
3.5
3.6
35.7
43.5
11.4
9.3
1.9
1.6
17.9
18.9
-
-
Bank of Baroda
Neutral
131
-
30,185
18,485
21,025
1.9
2.0
13.5
21.1
9.7
6.2
0.8
0.7
7.3
10.6
-
-
Bank of India
Neutral
86
-
6,958
15,972
17,271
1.9
2.0
15.3
33.4
5.6
2.6
0.3
0.2
3.6
7.6
-
-
Canara Bank
Neutral
171
-
9,272
15,441
16,945
2.0
2.1
46.6
70.4
3.7
2.4
0.3
0.3
8.0
11.2
-
-
Dena Bank
Neutral
28
-
1,807
3,440
3,840
2.1
2.3
7.3
10.0
3.9
2.8
0.3
0.2
6.1
7.9
-
-
Federal Bank
Neutral
45
-
7,670
3,477
3,999
3.0
3.0
5.0
6.2
8.9
7.2
0.9
0.8
10.6
11.9
-
-
HDFC
Neutral
1,077
-
170,061
10,358
11,852
3.3
3.3
41.1
47.0
26.2
22.9
5.0
4.5
24.7
24.9
-
-
HDFC Bank
Buy
973
1,262
245,903
38,309
47,302
4.3
4.3
49.3
61.1
19.7
16.0
3.4
2.9
18.5
19.7
-
-
ICICI Bank
Buy
197
254
114,396
34,279
39,262
3.3
3.3
21.0
24.4
9.4
8.1
1.6
1.3
14.4
14.7
-
-
IDBI Bank
Neutral
52
-
9,928
9,625
10,455
1.8
1.8
8.5
14.2
6.1
3.7
0.4
0.3
5.9
9.3
-
-
Indian Bank
Neutral
86
-
4,126
6,160
6,858
2.5
2.5
24.5
29.8
3.5
2.9
0.3
0.3
7.7
8.6
-
-
LIC Housing Finance
Buy
411
592
20,742
3,101
3,745
2.5
2.5
33.0
40.2
12.5
10.2
2.3
2.0
19.7
20.5
-
-
Oriental Bank
Neutral
82
-
2,445
7,643
8,373
2.4
2.4
37.2
45.4
2.2
1.8
0.2
0.2
8.2
9.4
-
-
Punjab Natl.Bank
Neutral
73
-
14,236
23,638
26,557
2.8
2.8
17.9
27.2
4.1
2.7
0.4
0.3
8.5
12.0
-
-
South Ind.Bank
Neutral
18
-
2,363
1,965
2,185
2.5
2.5
2.5
3.3
7.0
5.3
0.7
0.6
9.5
11.7
-
-
St Bk of India
Buy
156
202
121,410
82,520
93,299
2.7
2.8
20.0
24.5
7.8
6.4
0.9
0.8
11.5
12.8
-
-
Union Bank
Neutral
114
-
7,802
12,646
14,129
2.3
2.4
31.0
39.1
3.7
2.9
0.4
0.3
9.8
11.4
-
-
Vijaya Bank
Neutral
31
-
2,625
3,536
3,827
1.9
1.9
5.5
6.7
5.5
4.6
0.5
0.4
7.8
8.8
-
-
Yes Bank
Neutral
733
-
30,784
7,190
9,011
3.2
3.3
58.2
69.7
12.6
10.5
2.3
1.9
19.2
19.6
-
-
FMCG
Asian Paints
Neutral
841
-
80,669
16,553
19,160
16.0
16.2
17.7
21.5
47.6
39.1
12.6
11.4
29.4
31.2
4.7
4.1
Britannia
Neutral
2,623
-
31,473
8,065
9,395
9.6
10.2
47.2
65.5
55.6
40.1
18.5
17.5
38.3
41.2
3.8
3.2
Colgate
Neutral
840
-
22,837
4,836
5,490
19.5
19.7
48.5
53.2
17.3
15.8
12.7
11.1
99.8
97.5
4.6
4.1
Dabur India
Accumulate
245
267
43,011
9,370
10,265
17.1
17.2
7.3
8.1
33.3
30.2
10.1
8.2
33.7
30.6
4.5
4.1
GlaxoSmith Con*
Accumulate
5,624
6,118
23,650
4,919
5,742
17.2
17.4
168.3
191.2
33.4
29.4
9.5
8.1
28.8
28.9
4.4
3.7
Stock Watch
February 17, 2016
Company Name
Reco
CMP
Target
Mkt Cap
Sales ( Čcr )
OPM(%)
EPS (Č)
PER(x)
P/BV(x)
RoE(%)
EV/Sales(x)
(Č)
Price ( Č)
( Č cr )
FY16E FY17E
FY16E
FY17E
FY16E
FY17E
FY16E
FY17E
FY16E
FY17E
FY16E
FY17E
FY16E
FY17E
FMCG
Godrej Consumer
Neutral
1,198
-
40,799
10,168
12,886
16.1
16.1
32.1
38.4
37.3
31.2
7.6
7.0
19.7
21.0
4.1
3.2
HUL
Neutral
804
-
174,040
34,940
38,957
17.5
17.7
20.8
24.7
38.7
32.6
43.0
34.4
110.5
114.2
4.8
4.3
ITC
Buy
295
359
237,490
41,068
45,068
37.8
37.4
13.9
15.9
21.2
18.6
7.1
6.3
34.1
33.8
5.4
4.9
Marico
Neutral
222
-
28,597
6,551
7,766
15.7
16.0
10.4
12.5
21.4
17.7
6.2
5.2
33.2
32.4
4.3
3.6
Nestle*
Buy
5,063
6,646
48,820
11,291
12,847
22.2
22.3
158.9
184.6
31.9
27.4
16.7
15.0
55.0
57.3
4.2
3.6
Tata Global
Buy
103
144
6,479
8,635
9,072
9.8
9.9
6.5
7.6
15.8
13.5
1.6
1.5
6.8
7.4
0.7
0.7
IT
HCL Tech^
Buy
822
1,038
115,811
42,038
47,503
21.2
21.5
51.5
57.7
16.0
14.2
3.5
2.7
21.5
18.8
2.4
1.9
Infosys
Buy
1,081
1,347
248,300
61,850
69,981
27.5
27.5
59.4
65.7
18.2
16.5
3.9
3.3
21.2
20.1
3.3
2.8
TCS
Buy
2,268
2,854
446,844
108,487
122,590
28.3
28.5
122.8
138.4
18.5
16.4
7.0
6.4
38.0
38.9
3.7
3.2
Tech Mahindra
Buy
423
646
40,951
25,566
28,890
16.0
17.0
26.3
31.9
16.1
13.3
2.9
2.5
17.9
18.6
1.4
1.1
Wipro
Buy
527
680
130,098
50,808
56,189
23.7
23.8
37.3
40.7
14.1
12.9
2.7
2.5
19.2
17.7
2.0
1.7
Media
D B Corp
Accumulate
311
356
5,720
2,241
2,495
27.8
27.9
21.8
25.6
14.3
12.2
3.7
3.3
26.7
28.5
2.5
2.2
HT Media
Neutral
79
-
1,834
2,495
2,603
11.2
11.2
7.3
8.6
10.8
9.2
0.9
0.8
7.4
8.1
0.2
0.2
Jagran Prakashan
Buy
156
189
5,095
2,170
2,355
27.2
26.2
8.9
9.9
17.5
15.7
3.7
3.2
20.9
20.5
2.2
2.1
Sun TV Network
Neutral
338
-
13,326
2,779
3,196
70.2
70.5
22.8
27.3
14.8
12.4
3.7
3.3
26.7
28.3
4.5
3.9
Hindustan Media
Neutral
273
-
2,004
920
1,031
20.0
20.0
19.2
20.9
14.2
13.1
2.3
2.0
16.4
15.3
1.7
1.5
Ventures
Metals & Mining
Coal India
Buy
318
380
201,113
76,167
84,130
19.9
22.3
22.4
25.8
14.2
12.3
5.1
5.0
35.5
41.0
2.0
1.8
Hind. Zinc
Accumulate
165
175
69,908
14,641
14,026
50.4
50.4
17.7
16.0
9.4
10.3
1.4
1.3
16.2
13.2
2.4
2.3
Hindalco
Neutral
65
-
13,402
104,356
111,186
8.7
9.5
6.7
11.1
9.7
5.9
0.3
0.3
3.5
5.9
0.7
0.6
JSW Steel
Neutral
1,034
-
24,993
42,308
45,147
16.4
20.7
(10.3)
49.5
20.9
1.2
1.1
(1.0)
5.6
1.6
1.5
NMDC
Neutral
89
-
35,425
8,237
10,893
46.6
44.5
10.0
11.7
9.0
7.7
1.0
0.9
12.5
13.0
4.1
3.1
SAIL
Neutral
35
-
14,600
45,915
53,954
7.2
10.5
1.5
4.4
23.5
8.1
0.3
0.3
2.3
4.1
1.0
0.9
Vedanta
Neutral
71
-
21,153
71,445
81,910
26.2
26.3
12.9
19.2
5.5
3.7
0.4
0.3
7.2
8.9
0.7
0.6
Tata Steel
Neutral
245
-
23,780
126,760
137,307
8.9
11.3
6.4
23.1
38.5
10.6
0.8
0.7
2.0
7.1
0.8
0.7
Oil & Gas
Cairn India
Neutral
125
-
23,455
11,323
12,490
49.4
51.0
20.7
20.7
6.0
6.1
0.4
0.4
6.4
6.1
1.1
0.5
GAIL
Neutral
322
-
40,883
64,856
70,933
9.1
9.6
24.0
28.9
13.5
11.2
1.2
1.1
8.8
9.6
0.8
0.7
ONGC
Neutral
199
-
170,596
154,564
167,321
36.8
37.4
28.6
32.5
7.0
6.1
0.9
0.8
12.7
13.5
1.3
1.2
Petronet LNG
Neutral
248
-
18,563
29,691
31,188
5.8
6.2
12.8
13.4
19.4
18.4
2.9
2.6
15.8
14.8
0.7
0.7
Indian Oil Corp
Buy
378
455
91,667
359,607
402,760
5.9
6.1
42.5
48.7
8.9
7.8
1.2
1.1
14.1
14.4
0.4
0.3
Stock Watch
February 17, 2016
Company Name
Reco
CMP
Target
Mkt Cap
Sales ( Čcr )
OPM(%)
EPS (Č)
PER(x)
P/BV(x)
RoE(%)
EV/Sales(x)
(Č)
Price ( Č)
( Č cr )
FY16E FY17E
FY16E
FY17E
FY16E
FY17E
FY16E
FY17E
FY16E
FY17E
FY16E
FY17E
FY16E
FY17E
Oil & Gas
Reliance Industries
Buy
930
1,150
301,151
304,775
344,392
12.6
13.4
91.3
102.6
10.2
9.1
1.1
1.0
11.8
12.0
0.9
0.8
Pharmaceuticals
Alembic Pharma
Neutral
598
-
11,282
3,274
3,802
26.9
19.4
35.0
28.7
17.1
20.9
7.6
5.7
55.6
31.2
3.4
2.9
Aurobindo Pharma
Buy
629
856
36,782
14,923
17,162
22.0
23.0
35.7
42.8
17.6
14.7
5.2
3.9
34.0
30.2
2.8
2.4
Aventis*
Neutral
4,254
-
9,796
2,082
2,371
17.4
20.8
118.2
151.5
36.0
28.1
5.3
4.2
19.9
25.5
4.4
3.6
Cadila Healthcare
Accumulate
311
352
31,874
10,224
11,840
21.0
22.0
14.6
17.6
21.3
17.7
5.8
4.6
30.8
29.0
3.2
2.7
Cipla
Buy
524
636
42,098
14,211
16,611
20.6
19.0
27.0
28.9
19.4
18.1
3.3
2.8
18.4
16.8
3.0
2.5
Dr Reddy's
Buy
2,860
3,933
48,779
16,838
19,575
25.0
23.1
167.5
178.8
17.1
16.0
3.6
3.0
23.1
20.4
2.8
2.4
Dishman Pharma
Neutral
303
-
2,441
1,733
1,906
21.5
21.5
17.0
19.9
17.8
15.2
1.8
1.6
10.5
11.2
1.9
1.6
GSK Pharma*
Neutral
3,161
-
26,773
2,870
3,158
20.0
22.1
59.5
68.3
53.1
46.3
15.7
16.1
28.5
34.3
8.8
8.1
Indoco Remedies
Neutral
266
-
2,447
1,033
1,199
15.9
18.2
9.4
13.6
28.3
19.5
4.2
3.6
15.7
19.7
2.5
2.1
Ipca labs
Buy
603
900
7,614
3,363
3,909
12.9
18.6
13.4
28.0
45.0
21.6
3.2
2.8
7.4
14.0
2.6
2.2
Lupin
Neutral
1,755
-
79,078
13,092
16,561
25.0
27.0
50.4
68.3
34.8
25.7
7.2
5.7
22.8
24.7
5.8
4.4
Sun Pharma
Accumulate
827
950
199,111
28,163
32,610
25.8
30.7
17.4
26.9
47.6
30.8
4.5
3.9
13.0
16.6
6.5
5.4
Power
Tata Power
Neutral
59
-
15,836
35,923
37,402
22.6
22.8
4.1
5.2
14.4
11.4
1.1
1.0
7.5
9.3
1.4
1.3
NTPC
Buy
128
157
105,336
87,064
98,846
23.5
23.5
11.7
13.2
10.9
9.7
1.2
1.1
11.4
12.1
2.2
2.0
Power Grid
Buy
139
170
72,928
20,702
23,361
86.7
86.4
12.1
13.2
11.5
10.6
1.7
1.5
15.6
15.1
8.4
7.9
Telecom
Bharti Airtel
Neutral
315
-
125,958
101,748
109,191
32.1
31.7
12.0
12.5
26.3
25.2
1.8
1.7
6.9
6.7
1.9
1.7
Idea Cellular
Neutral
105
-
37,912
34,282
36,941
32.0
31.5
5.9
6.2
17.9
17.0
1.6
1.5
9.9
9.3
1.7
1.6
zOthers
Abbott India
Neutral
4,747
-
10,087
2,715
3,153
14.5
14.1
134.3
152.2
35.4
31.2
8.8
7.3
27.4
25.6
3.4
2.9
Bajaj Electricals
Buy
169
290
1,702
4,719
5,287
5.2
5.8
8.6
12.7
19.7
13.3
2.3
2.0
11.4
14.8
0.4
0.3
Finolex Cables
Neutral
228
-
3,480
2,520
2,883
12.2
12.0
12.7
14.2
18.0
16.0
2.5
2.2
13.6
13.5
1.1
0.9
Goodyear India*
Buy
473
582
1,090
1,800
1,600
11.7
11.5
58.7
52.9
8.1
8.9
1.8
1.6
24.6
18.7
0.4
0.4
Hitachi
Neutral
1,036
-
2,817
1,779
2,081
7.8
8.8
21.8
33.4
47.5
31.0
7.7
6.2
17.4
22.1
1.7
1.4
Jyothy Laboratories
Neutral
271
-
4,908
1,620
1,847
11.5
11.5
7.3
8.5
37.2
32.0
4.8
4.5
13.3
14.4
2.9
2.5
MRF
Buy
33,199
45,575
14,080
20,316
14,488
21.4
21.1
5,488.0
3,798.0
6.1
8.7
2.1
1.7
41.1
21.2
0.6
0.9
Page Industries
Neutral
10,744
-
11,983
1,929
2,450
19.8
20.1
229.9
299.0
46.7
35.9
20.6
14.3
52.1
47.1
6.2
4.9
Relaxo Footwears
Neutral
403
-
4,840
1,767
2,152
12.3
12.5
19.3
25.1
21.0
16.1
5.1
4.0
27.7
27.8
2.8
2.3
Siyaram Silk Mills
Buy
997
1,354
934
1,636
1,815
11.5
11.5
89.9
104.1
11.1
9.6
1.8
1.6
17.9
17.8
0.7
0.7
Styrolution ABS India*
Neutral
508
-
894
1,271
1,440
8.6
9.2
32.0
41.1
15.9
12.4
1.6
1.5
10.7
12.4
0.7
0.6
Stock Watch
February 17, 2016
Company Name
Reco
CMP
Target
Mkt Cap
Sales ( Čcr )
OPM(%)
EPS (Č)
PER(x)
P/BV(x)
RoE(%)
EV/Sales(x)
(Č)
Price ( Č)
( Č cr )
FY16E
FY17E
FY16E
FY17E
FY16E
FY17E
FY16E
FY17E
FY16E
FY17E
FY16E
FY17E
FY16E
FY17E
zOthers
TVS Srichakra
Buy
2,293
3,217
1,756
2,035
2,252
15.9
15.3
248.6
268.1
9.2
8.6
4.0
2.9
43.6
33.9
0.9
0.8
HSIL
Buy
240
302
1,733
2,123
2,384
16.1
16.5
15.0
18.9
15.9
12.7
1.2
1.2
8.0
9.4
1.2
1.0
Kirloskar Engines India
Neutral
214
-
3,095
2,403
2,554
8.6
9.9
9.2
10.5
23.3
20.4
2.2
2.1
9.7
10.7
0.9
0.9
Ltd
M M Forgings
Buy
410
614
495
511
615
21.7
21.6
43.1
55.8
9.5
7.3
1.7
1.4
19.9
21.2
1.2
0.9
Banco Products (India) Neutral
100
-
712
1,208
1,353
11.0
12.3
10.8
14.5
9.2
6.9
1.1
0.9
11.9
14.5
0.6
0.5
Competent Automobiles Neutral
132
-
81
1,040
1,137
3.2
3.1
25.7
28.0
5.1
4.7
0.8
0.7
15.0
14.3
0.1
0.1
Nilkamal
Neutral
1,053
-
1,571
1,871
2,031
10.7
10.5
63.2
69.8
16.7
15.1
2.7
2.3
17.6
16.6
0.9
0.8
Visaka Industries
Buy
94
144
150
1,086
1,197
9.9
10.3
21.5
28.8
4.4
3.3
0.4
0.4
9.6
11.6
0.4
0.3
Transport Corporation of
Neutral
223
-
1,696
2,830
3,350
8.8
9.0
14.4
18.3
15.5
12.2
2.4
2.1
15.4
17.1
0.7
0.6
India
Elecon Engineering
Neutral
49
-
535
1,359
1,482
10.3
13.7
0.8
3.9
61.1
12.6
1.0
1.0
1.6
7.8
0.7
0.7
Surya Roshni
Buy
131
201
575
2,992
3,223
8.1
8.4
14.7
18.3
8.9
7.2
0.8
0.8
9.7
11.0
0.5
0.4
MT Educare
Neutral
144
-
575
286
366
18.3
17.7
7.7
9.4
18.7
15.4
3.9
3.5
20.2
21.1
1.9
1.4
Radico Khaitan
Buy
98
156
1,303
1,517
1,635
12.7
13.4
5.8
7.1
16.8
13.8
1.4
1.3
8.6
9.6
1.3
1.2
Garware Wall Ropes
Buy
294
473
644
862
974
11.2
11.2
24.9
29.6
11.8
10.0
1.8
1.5
15.1
15.4
0.7
0.6
Wonderla Holidays
Neutral
345
-
1,950
206
308
44.0
43.6
9.0
12.9
38.4
26.8
5.2
4.8
13.7
17.8
9.4
6.2
Linc Pen & Plastics
Accumulate
174
185
257
340
371
8.3
8.9
10.8
13.2
16.1
13.1
2.6
2.2
16.0
17.1
0.8
0.7
The Byke Hospitality
Neutral
153
-
614
222
287
20.5
20.5
5.6
7.6
27.1
20.3
5.1
4.2
18.9
20.8
2.8
2.2
Interglobe Aviation
Neutral
841
-
30,301
17,022
21,122
20.7
14.5
63.9
53.7
13.2
15.7
19.7
16.2
149.9
103.2
1.8
1.4
Coffee Day Enterprises
Neutral
225
-
4,638
2,692
2,964
17.0
18.6
-
4.7
-
47.5
2.8
2.6
0.2
5.5
2.1
2.0
Ltd
Navneet Education
Neutral
84
-
2,001
998
1,062
24.1
24.0
5.8
6.1
14.6
13.8
3.2
2.8
22.0
20.6
2.1
2.0
Navkar Corporation
Buy
161
265
2,302
365
436
38.3
37.5
5.6
5.9
28.6
27.5
1.8
1.7
6.3
6.1
7.1
6.1
Source: Company, Angel Research; Note: *December year end; #September year end; &October year end; Price as on February 16, 2016
Market Outlook
February 17, 2016
Research Team Tel: 022 - 39357800
DISCLAIMER
Angel Broking Private Limited (hereinafter referred to as “Angel”) is a registered Member of National Stock Exchange of India Limited,
Bombay Stock Exchange Limited and Metropolitian Stock Exchange of India Limited. It is also registered as a Depository Participant with
CDSL and Portfolio Manager with SEBI. It also has registration with AMFI as a Mutual Fund Distributor. Angel Broking Private Limited is a
registered entity with SEBI for Research Analyst in terms of SEBI (Research Analyst) Regulations, 2014 vide registration number
INH000000164. Angel or its associates has not been debarred/ suspended by SEBI or any other regulatory authority for accessing
/dealing in securities Market. Angel or its associates including its relatives/analyst do not hold any financial interest/beneficial ownership
of more than 1% in the company covered by Analyst. Angel or its associates/analyst has not received any compensation / managed or co
-managed public offering of securities of the company covered by Analyst during the past twelve months. Angel/analyst has not served as
an officer, director or employee of company covered by Analyst and has not been engaged in market making activity of the company
covered by Analyst.
This document is solely for the personal information of the recipient, and must not be singularly used as the basis of any investment
decision. Nothing in this document should be construed as investment or financial advice. Each recipient of this document should make
such investigations as they deem necessary to arrive at an independent evaluation of an investment in the securities of the companies
referred to in this document (including the merits and risks involved), and should consult their own advisors to determine the merits and
risks of such an investment.
Reports based on technical and derivative analysis center on studying charts of a stock's price movement, outstanding positions and
trading volume, as opposed to focusing on a company's fundamentals and, as such, may not match with a report on a company's
fundamentals.
The information in this document has been printed on the basis of publicly available information, internal data and other reliable sources
believed to be true, but we do not represent that it is accurate or complete and it should not be relied on as such, as this document is for
general guidance only. Angel Broking Pvt. Limited or any of its affiliates/ group companies shall not be in any way responsible for any
loss or damage that may arise to any person from any inadvertent error in the information contained in this report. Angel Broking Pvt.
Limited has not independently verified all the information contained within this document. Accordingly, we cannot testify, nor make any
representation or warranty, express or implied, to the accuracy, contents or data contained within this document. While Angel Broking
Pvt. Limited endeavors to update on a reasonable basis the information discussed in this material, there may be regulatory, compliance,
or other reasons that prevent us from doing so.
This document is being supplied to you solely for your information, and its contents, information or data may not be reproduced,
redistributed or passed on, directly or indirectly.
Neither Angel Broking Pvt. Limited, nor its directors, employees or affiliates shall be liable for any loss or damage that may arise from or
in connection with the use of this information.
Note: Please refer to the important ‘Stock Holding Disclosure' report on the Angel website (Research Section). Also, please refer to the
latest update on respective stocks for the disclosure status in respect of those stocks. Angel Broking Pvt. Limited and its affiliates may have
investment positions in the stocks recommended in this report.