Market Outlook
September 16, 2015
Dealer’s Diary
Domestic Indices
Chg (%)
(Pts)
(Close)
Indian markets are expected to open on a Positive note tracking the SGX Nifty and
BSE Sensex
0.3
61
18,026
global markets.
Nifty
(0.5)
(107)
21,455
MID CAP
(1.0)
(30)
2,842
The US markets traded in the positive territory throughout the day and closed higher
SMALL CAP
(3.5)
(110)
3,005
as some weaker than expected economic data provided support for the view that the
BSE HC
0.3
61
18,026
Federal Reserve will leave interest rates unchanged. Earlier in the session, the
Commerce Department released retail sales data which increased by 0.2% in August
BSE PSU
(0.5)
(107)
21,455
against estimates of 0.3%. Additionally Industrial Production fell by 0.4% in August
BANKEX
(1.0)
(30)
2,842
against estimated decline of 0.2%.
AUTO
(3.5)
(110)
3,005
METAL
0.3
61
18,026
After fluctuating earlier in the day, the European markets ended Tuesday's session in
OIL & GAS
(0.5)
(107)
21,455
the green, mainly led by positive opening in the US markets which opened on
positive note.
BSE IT
(1.0)
(30)
2,842
Global Indices
Chg (%)
(Pts)
(Close)
Indian shares gradually traded lower on Tuesday as nervousness ahead of the
Dow Jones
1.4
229
16,600
FOMC announcement on Thursday prompted traders to book profits. Weak global
NASDAQ
1.1
55
4,861
cues also weighed on investor sentiment.
FTSE
0.9
53
6,138
News & Result Analysis
Nikkei
0.3
61
18,026
Tata Motors (JLR) enters SUV market with launch of F-Pace model
Hang Seng
(0.5)
(107)
21,455
ABB India Bags Orders Worth `119cr
Straits Times
(1.0)
(30)
2,842
Wonderla Holidays to set up amusement park in Andhra Pradesh
Shanghai Com
(3.5)
(110)
3,005
Exports dip for ninth straight month; fall 20.6% in Aug
Refer detailed news analysis on the following page
Indian ADR
Chg (%)
(Pts)
(Close)
Markets Today
INFY
0.5
0.1
$17.8
The trend deciding level for the day is 25,755 / 7,836 levels. If NIFTY trades above
WIT
1.1
0.1
$11.8
this level during the first half-an-hour of trade then we may witness a further rally up
IBN
0.8
0.1
$8.5
to 25,861 - 26,016 / 7,873 - 7,917 levels. However, if NIFTY trades below
HDB
(1.0)
(0.6)
$57.1
25,755 / 7,836 levels for the first half-an-hour of trade then it may correct towards
25,600 - 25,495 / 7,793 - 7,756 levels.
Advances / Declines
BSE
NSE
Indices
S2
S1
PIVOT
R1
R2
Advances
1,115
534
SENSEX
25,495
25,600
25,755
25,861
26,016
Declines
1,535
969
NIFTY
7,756
7,793
7,836
7,873
7,917
Unchanged
86
68
Net Inflows (September 14, 2015)
Volumes (` cr)
` cr
Purch
Sales
Net
MTD
YTD
BSE
2,243
FII
2,648
2,512
136
(5,914)
117,847
NSE
13,469
MFs
696
325
371
4,498
75,146
FII Derivatives (September 15, 2015)
` cr
Purch
Sales
Net
Open Interest
Index Futures
1,747
1,491
257
23,114
Stock Futures
2,314
1,965
349
46,414
Gainers / Losers
Gainer
Loser
Company
Price (`)
chg (%)
Company
Price (`)
chg (%)
MANAPPURAM
24
7.7
BHARATFORG
962
(6.0)
OBEROIRLTY
315
6.8
RAJESHEXPO
429
(5.4)
JUBILANT
338
5.8
TATASTEEL
229
(5.1)
ALOKTEXT
6
5.2
SUNASIAN
127
(4.9)
DELTACORP
78
5.2
JSWSTEEL
945
(4.8)
Market Outlook
September 16, 2015
Tata Motors (JLR) enters SUV market with launch of F-Pace
model
Tata Motors-owned Jaguar Land Rover (JLR) entered the SUV market with the
launch of F-Pace model at the Frankfurt Motor Show. F-Pace has been dubbed the
"ultimate practical sports car", which embodies the spirit of the iconic British luxury
car brand with modern technology. It is expected to hit the roads in Europe and
the US in a phased rollout by early next year, with an Indian launch expected in
the latter half of 2016. The starting prices for the US are USD 40,990, the UK as
34,170 pounds and Germany 42,390 Euro. The cars will be produced at JLR's
500-million pounds Solihull factory in the UK using new architecture which is more
aluminium based, giving it a revolutionary light weight appeal. The launch of the
new F-Pace marks the first time the 80-year-old car manufacturer has entered the
SUV market. New products such as the Jguar XE and F-Pace are likely to rake up
volumes for JLR as these are new segments which the car marker has tapped. We
currently have Buy rating on Tata Motors.
Wonderla Holidays to set up amusement park in Andhra
Pradesh
Wonderla Holidays Ltd has signed Memorandum of Understanding (MOU) with
the Government of Andhra Pradesh to set up an Amusement park in Andhra
Pradesh over a period of next four to five years. This follows the MOU signed by
the company with the Tamil Nadu government at the Global Investors Meet (GIM)
held on September 10, 2015. The company is yet to finalize on the land for the
said project. We maintain our Positive view on Wonderla Holidays.
ABB India Bags Orders worth `119cr
ABB, the leading power and automation technology group, has won orders worth
around `119cr to provide plant electrification, automation and substation solutions
for solar power plants being built as part of India’s strong push for solar energy
and renewables. Spread across the southern Indian states of Karnataka, Tamil
Nadu and Andhra Pradesh, these projects will connect more than 850 megawatts
(MW) of solar energy to the grid and will be among the biggest solar projects
worldwide. The most significant of these projects, placed by the Adani Group, is
the 648 MW solar plant in Kamuthi, Tamil Nadu. Solar, which accounts for ~5%
of total order book of `8,000cr (at the end of 1QFY2016), is considered an
important growth driver in an environment where large order finalizations are
delayed and sluggishness persist in Industrial capex recovery.
Exports dip for ninth straight month; fall 20.6% in Aug
Contracting for the ninth month in a row, India's exports plunged by 20.6% in
August to $21.26 billion, widening the trade deficit. The significant slump in
country's exports is attributed to global slowdown and declining commodity prices
worldwide. In August 2014, the exports had amounted to $26.8 billion. The last
time exports registered a positive growth was in November 2014, when exports
had expanded at a rate of 7.27%. Imports fell by 9.95% to $33.74 billion in
Market Outlook
September 16, 2015
August this year due to sharp decrease in oil prices, widening the trade deficit to
$12.47 billion, according to the data released by the Commerce Ministry.
Economic and Political News
August trade deficit flat at $12.48 bn, exports fall
Corporate News
Orchid Pharma to convert rupee term loans to foreign currency loans
Govt allots Utkal-D & E coal blocks to NALCO
Biocon launches pen like device to administer insulin
Market Outlook
September 16, 2015
Top Picks
Large Cap
Market Cap
CMP
Target
Upside
Company
Sector
Rating
(` Cr)
(`)
(`)
(%)
Aurobindo
Pharma
40,880
Buy
700
872
24.6
Axis Bank
Financials
1,14,769
Buy
483
701
45.2
ICICI Bank
Financials
1,56,177
Buy
269
370
37.5
Infosys
IT
2,52,296
Buy
1,098
1,306
18.9
Capital
Inox Wind
8,288
Buy
373
505
35.2
Goods
LIC HFL
Financials
21,996
Buy
436
570
30.8
Power Grid
Power
67,147
Buy
128
170
32.5
TCS
IT
4,98,134
Buy
2,543
3,168
24.6
Tech Mahindra IT
52,070
Buy
541
646
19.4
Yes Bank
Financials
30,534
Buy
729
953
30.7
Sun Pharma
Pharma
2,08,566 Accumulate
867
950
9.6
Source: Angel Research, Bloomberg
Mid Cap
Market Cap (`
CMP
Target
Upside
Company
Sector
Rating
Cr)
(`)
(`)
(%)
Bajaj Electricals
Others
2,532
Buy
251
341
35.9
Garware Wall RopesOthers
632 Buy
289
390
35.0
MBL Infrastructures Construction
999 Buy
241
360
49.3
Minda Industries
Auto Ancillary
797 Buy
503
652
29.7
MT Educare
Others
507 Buy
127
169
32.9
Radico Khaitan
Others
1,120
Buy
84
112
33.1
Surya Roshni
Others
514 Buy
117
183
56.0
Tree House
Others
1,519
Buy
359
449
25.1
Source: Angel Research, Bloomberg
Market Outlook
September 16, 2015
Global economic events release calendar
Date
Time
Country Event Description
Unit
Period
Bloomberg Data
Last Reported Estimated
September 16, 2015
2:00PM
UK
Jobless claims change
% Change
Aug
(4.90)
(5.00)
2:30PM
Euro Zone Euro-Zone CPI (YoY)
%
Aug F
0.20
0.20
6:00PM
US
Consumer price index (mom)
% Change
Aug
0.10
(0.10)
September 17, 2015
6:00PM
US
Initial Jobless claims
Thousands
Sep 12
275.00
275.00
6:00PM
US
Building permits
Thousands
Aug
1,130.00
1,158.00
6:00PM
US
Housing Starts
Thousands
Aug
1,206.00
1,163.00
11:30PM
US
FOMC rate decision
%
Sep 17
0.25
0.38
September 21, 2015
7:30PM
US
Existing home sales
Million
Aug
5.59
5.50
September 22, 2015
7:30PM
Euro Zone Euro-Zone Consumer Confidence
Value
Sep A
(6.90)
--
September 23, 2015
1:00PM
Germany PMI Services
Value
Sep P
54.90
--
1:00PM
Germany PMI Manufacturing
Value
Sep P
53.30
--
September 24, 2015
7:30PM
US
New home sales
Thousands
Aug
507.00
515.00
September 25, 2015
6:00PM
US
GDP Qoq (Annualised)
% Change
2Q T
3.70
3.70
September 29, 2015
7:30PM
US
Consumer Confidence
S.A./ 1985=100
Sep
101.54
--
11:00AM
India
RBI Reverse Repo rate
%
Sep 29
6.25
--
11:00AM
India
RBI Repo rate
%
Sep 29
7.25
--
11:00AM
India
RBI Cash Reserve ratio
%
Sep 29
4.00
--
September 30, 2015
1:25PM
Germany Unemployment change (000's)
Thousands
Sep
(7.00)
--
2:00PM
UK
GDP (YoY)
% Change
2Q F
2.60
--
October 1, 2015
6:30AM
China
PMI Manufacturing
Value
Sep
49.70
--
2:00PM
UK
PMI Manufacturing
Value
Sep
51.50
--
October 2, 2015
6:00PM
US
Change in Nonfarm payrolls
Thousands
Sep
173.00
--
6:00PM
US
Unnemployment rate
%
Sep
5.10
--
October 7, 2015
2:00PM
UK
Industrial Production (YoY)
% Change
Aug
0.80
--
October 8, 2015
4:30PM
UK
BOE Announces rates
% Ratio
Oct 8
0.50
0.50
October 12, 2015
5:30PM
India
Industrial Production YoY
% Change
Aug
4.20
--
October 13, 2015
China
Exports YoY%
% Change
Sep
(5.50)
--
October 14, 2015
12:00PM
India
Monthly Wholesale Prices YoY%
% Change
Sep
(4.95)
--
7:00AM
China
Consumer Price Index (YoY)
% Change
Sep
2.00
--
October 19, 2015
7:30AM
China
Industrial Production (YoY)
% Change
Sep
6.10
--
7:30AM
China
Real GDP (YoY)
% Change
3Q
7.00
--
October 22, 2015
5:15PM
Euro Zone ECB announces interest rates
%
Oct 22
0.05
--
Source: Bloomberg, Angel Research
Market Outlook
September 16, 2015
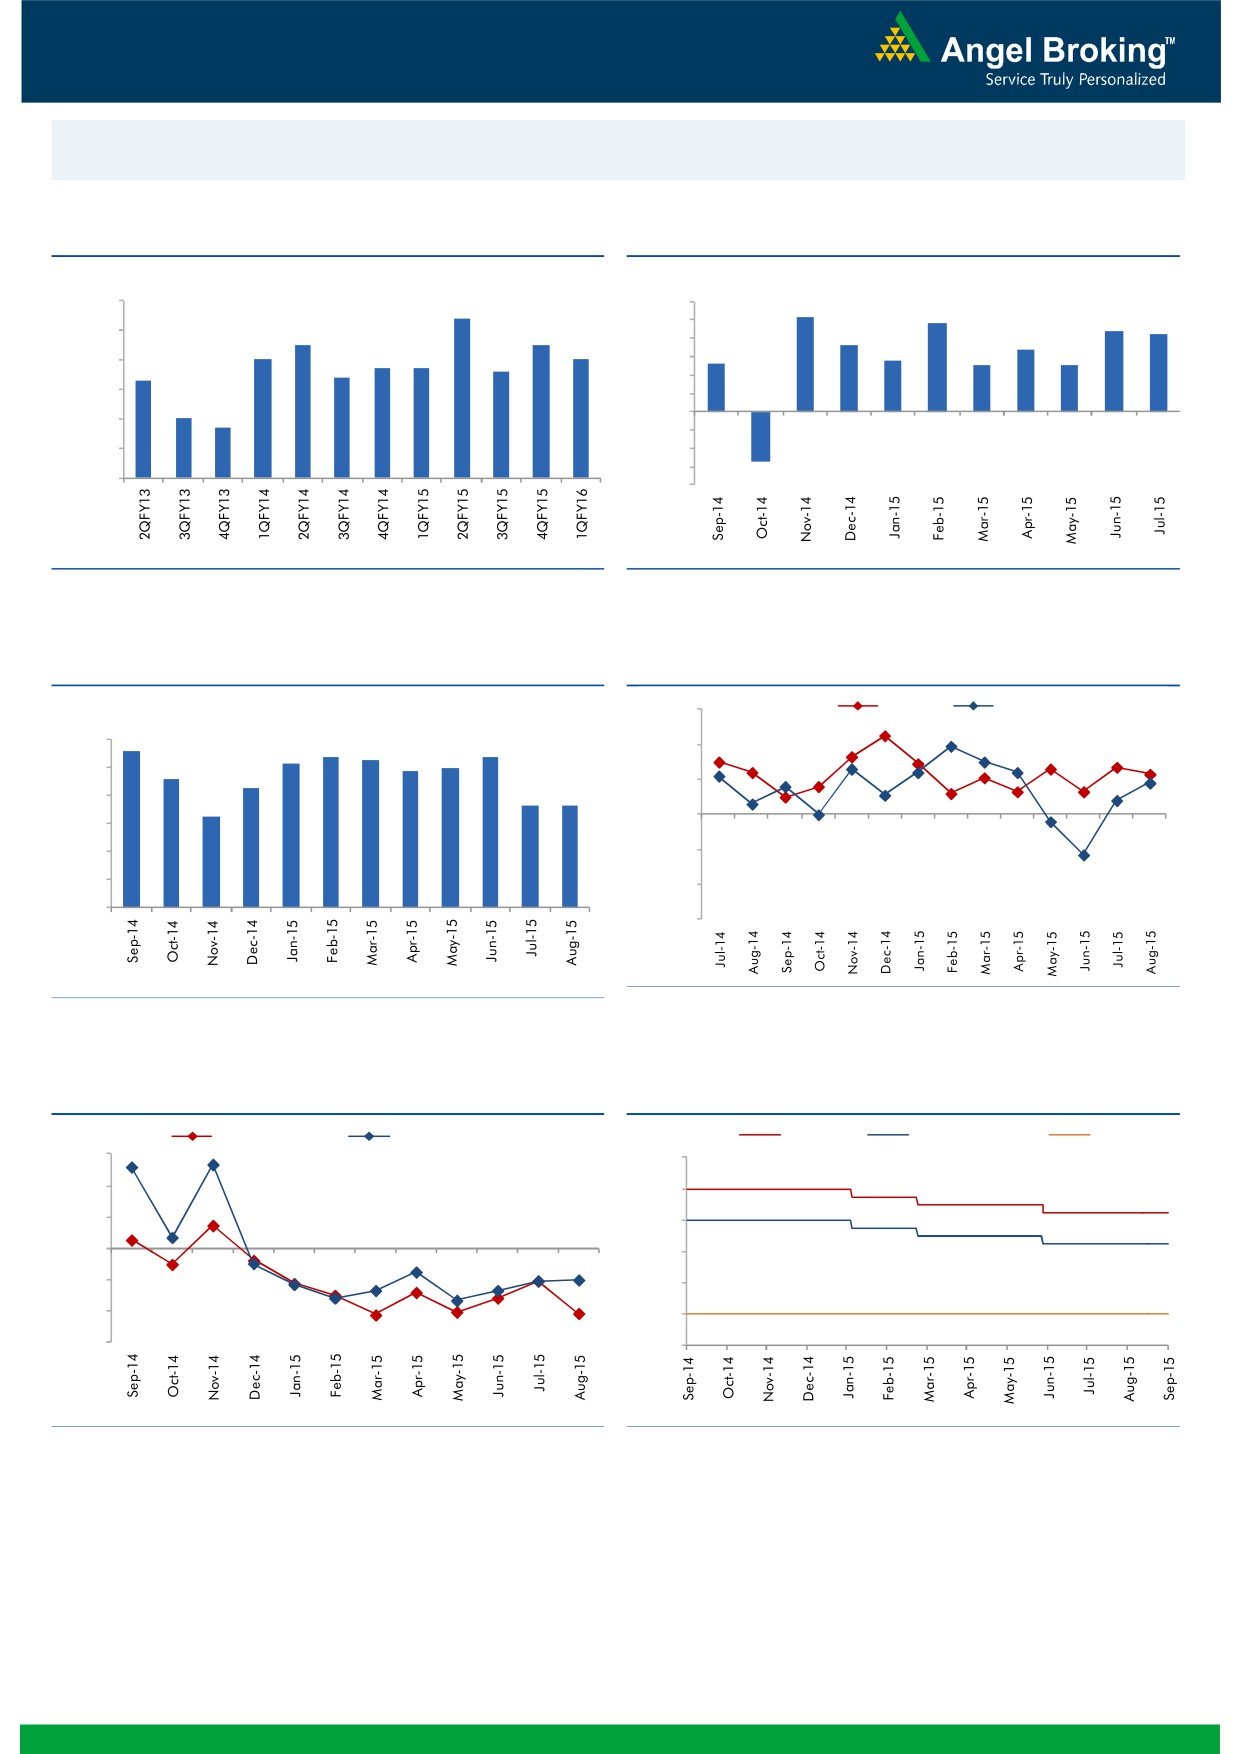
Macro watch
Exhibit 1: Quarterly GDP trends
Exhibit 2: IIP trends
(%)
(%)
9.0
8.4
6.0
5.2
4.8
4.4
4.2
5.0
8.0
7.5
7.5
3.6
4.0
3.4
7.0
7.0
2.8
2.6
2.5
2.5
6.7
6.7
6.6
3.0
7.0
6.3
6.4
2.0
6.0
1.0
5.0
4.7
-
5.0
(1.0)
4.0
(2.0)
(3.0)
3.0
(2.7)
(4.0)
Source: CSO, Angel Research
Source: MOSPI, Angel Research
Exhibit 3: Monthly CPI inflation trends
Exhibit 4: Manufacturing and services PMI
(%)
56.0
Mfg. PMI
Services PMI
5.6
6.0
5.4
5.3
5.4
54.0
5.2
5.0
4.9
4.6
5.0
4.3
52.0
3.7
3.7
4.0
3.3
50.0
3.0
2.0
48.0
1.0
46.0
-
44.0
Source: Market, Angel Research; Note: Level above 50 indicates expansion
Source: MOSPI, Angel Research
Exhibit 5: Exports and imports growth trends
Exhibit 6: Key policy rates
(%)
Exports yoy growth
Imports yoy growth
(%)
Repo rate
Reverse Repo rate
CRR
30.0
9.00
20.0
8.00
10.0
7.00
0.0
6.00
(10.0)
5.00
(20.0)
4.00
(30.0)
3.00
Source: Bloomberg, Angel Research
Source: RBI, Angel Research
Market Outlook
September 16, 2015
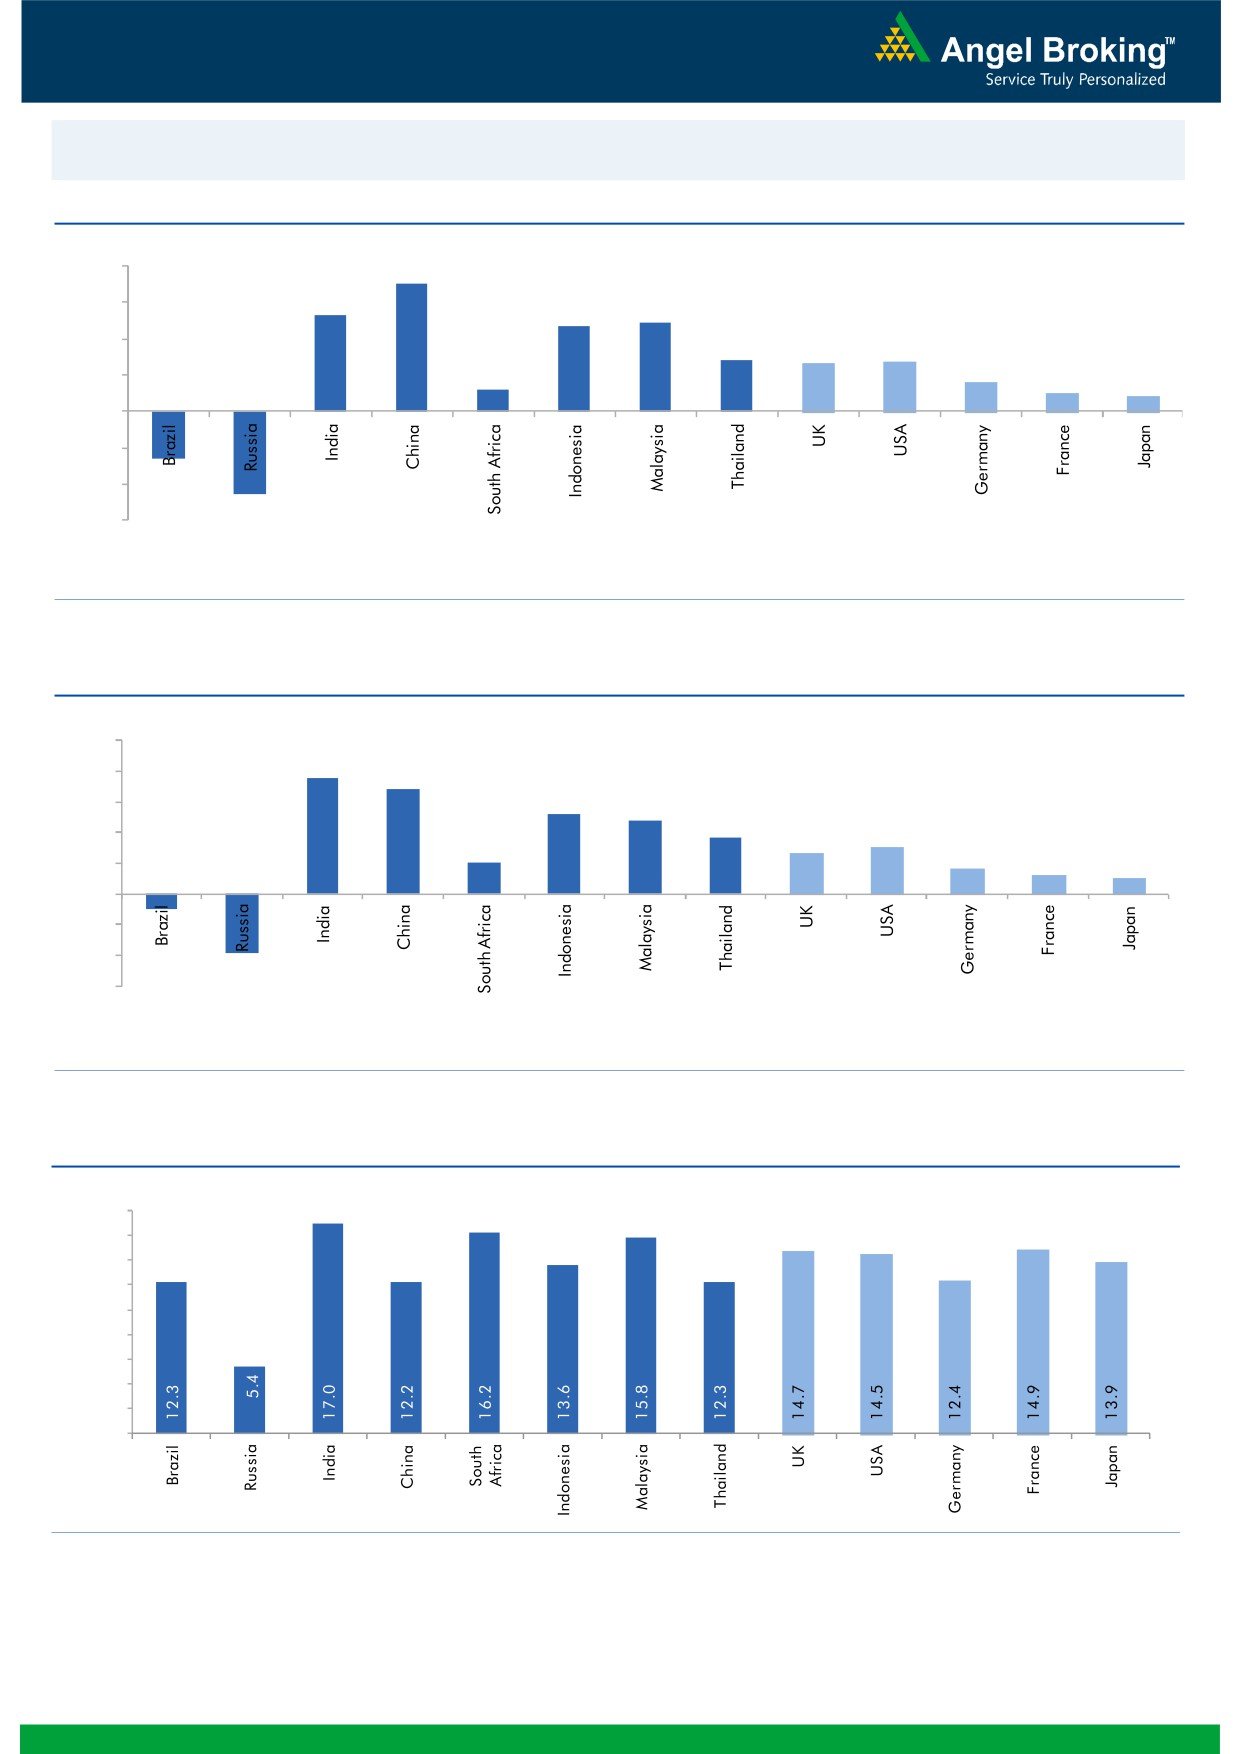
Global watch
Exhibit 1: Latest quarterly GDP Growth (%, yoy) across select developing and developed countries
(%)
8.0
7.0
6.0
5.3
4.9
4.7
4.0
2.8
2.6
2.7
1.6
2.0
1.2
1.0
0.8
(4.6)
(2.6)
-
(2.0)
(4.0)
(6.0)
Source: Bloomberg, Angel Research
Exhibit 2: 2015 GDP Growth projection by IMF (%, yoy) across select developing and developed countries
(%)
10.0
7.5
8.0
6.8
5.2
6.0
4.8
3.7
4.0
2.7
3.1
2.0
1.6
1.2
1.0
2.0
(3.8)
(1.0)
-
(2.0)
(4.0)
(6.0)
Source: IMF, Angel Research
Exhibit 3: One year forward P-E ratio across select developing and developed countries
(x)
18.0
16.0
14.0
12.0
10.0
8.0
6.0
4.0
2.0
-
Source: Bloomberg, Angel Research
Market Outlook
September 16, 2015
Exhibit 4: Relative performance of indices across globe
Returns (%)
Country
Name of index
Closing price
1M
3M
1YR
Brazil
Bovespa
47,364
(1.3)
(10.9)
(18.6)
Russia
Micex
1,716
0.2
3.1
17.7
India
Nifty
7,829
(8.1)
(3.2)
(4.0)
China
Shanghai Composite
3,005
(24.2)
(40.8)
29.9
South Africa
Top 40
43,985
(3.0)
(3.6)
(4.1)
Mexico
Mexbol
43,270
(1.1)
(3.4)
(5.7)
Indonesia
LQ45
733
(5.7)
(13.3)
(16.2)
Malaysia
KLCI
1,647
1.6
(4.4)
(12.0)
Thailand
SET 50
890
(3.8)
(10.3)
(15.9)
USA
Dow Jones
16,600
(4.6)
(6.7)
(3.1)
UK
FTSE
6,138
(6.6)
(8.5)
(9.5)
Japan
Nikkei
18,026
(12.1)
(11.0)
15.0
Germany
DAX
10,188
(7.3)
(7.2)
5.5
France
CAC
4,569
(7.8)
(4.6)
2.4
Source: Bloomberg, Angel Research
Market Outlook
September 16, 2015
Stock Watch
Company Name
Reco
CMP
Target
Mkt Cap
Sales ( Čcr )
OPM(%)
EPS (Č)
PER(x)
P/BV(x)
RoE(%)
EV/Sales(x)
(Č)
Price ( Č)
( Č cr )
FY16E FY17E
FY16E
FY17E
FY16E
FY17E
FY16E
FY17E
FY16E
FY17E
FY16E
FY17E
FY16E
FY17E
Agri / Agri Chemical
Rallis
Neutral
216
-
4,195
2,075
2,394
14.4
14.4
9.5
11.0
22.7
19.6
4.5
3.9
21.1
21.3
2.1
1.8
United Phosphorus
Neutral
492
-
21,079
13,698
15,752
17.6
17.6
32.1
38.5
15.3
12.8
3.0
2.5
21.4
21.3
1.6
1.4
Auto & Auto Ancillary
Ashok Leyland
Accumulate
87
97
24,845
18,186
21,529
10.8
11.2
3.3
4.5
26.5
19.4
4.5
4.2
17.3
21.6
1.3
1.1
Bajaj Auto
Accumulate
2,295
2,438
66,416
23,544
27,245
19.8
19.8
127.0
143.4
18.1
16.0
5.5
4.7
30.3
29.4
2.4
2.0
Eicher Motors
Buy
18,576
22,859
50,421
11,681
15,550
15.3
16.9
358.5
564.3
51.8
32.9
15.6
11.6
29.8
34.9
4.2
3.1
Hero Motocorp
Buy
2,311
2,672
46,140
28,500
32,764
14.1
14.3
146.9
167.0
15.7
13.8
6.0
5.1
37.8
36.5
1.5
1.2
L G Balakrishnan & Bros Neutral
443
-
695
1,254
1,394
11.6
11.8
35.9
41.7
12.4
10.6
1.7
1.5
13.5
13.8
0.7
0.6
Mahindra and Mahindra Buy
1,152
1,383
71,522
38,337
43,069
13.0
13.4
52.9
63.5
21.8
18.1
3.3
2.9
15.0
15.9
1.5
1.3
Maruti
Accumulate
4,331
4,735
130,829
58,102
68,587
16.7
16.9
182.0
225.5
23.8
19.2
4.7
4.0
19.9
21.0
2.0
1.7
Minda Industries
Buy
503
652
797
2,567
2,965
7.3
8.0
38.8
54.3
13.0
9.3
1.9
1.6
14.4
16.8
0.4
0.3
Rane Brake Lining
Buy
280
366
222
454
511
11.1
11.4
23.8
28.1
11.8
10.0
1.7
1.5
14.2
15.3
0.6
0.6
Setco Automotive
Neutral
229
-
612
594
741
12.7
13.7
8.4
15.8
27.3
14.5
2.8
2.5
10.4
16.9
1.5
1.2
Tata Motors
Buy
334
391
96,418
264,038
297,882
13.8
13.9
34.5
38.9
9.7
8.6
1.6
1.4
17.6
16.8
0.5
0.5
TVS Motor
Neutral
231
-
10,975
11,702
13,713
6.8
7.7
10.1
14.5
22.9
15.9
5.6
4.5
24.5
28.3
0.9
0.8
Amara Raja Batteries
Neutral
962
-
16,427
5,101
6,224
17.8
17.6
31.1
39.2
30.9
24.5
7.7
6.1
24.8
24.8
3.2
2.5
Exide Industries
Accumulate
149
159
12,699
7,363
8,247
13.7
14.5
6.6
7.7
22.6
19.4
2.9
2.6
12.6
13.3
1.5
1.3
Apollo Tyres
Neutral
187
-
9,501
12,576
12,978
16.8
16.1
22.3
19.9
8.4
9.4
1.4
1.3
17.2
13.4
0.8
0.9
Ceat
Neutral
1,213
-
4,908
6,041
6,597
14.3
14.2
101.5
116.6
12.0
10.4
2.4
2.0
20.0
19.1
1.0
0.8
JK Tyres
Neutral
103
-
2,329
7,446
7,669
15.2
14.0
19.6
18.4
5.2
5.6
1.3
1.1
25.2
19.5
0.7
0.6
Swaraj Engines
Accumulate
865
912
1,074
593
677
14.5
14.8
51.2
60.8
16.9
14.2
3.9
3.5
23.3
24.8
1.7
1.4
Subros
Neutral
79
-
472
1,268
1,488
11.6
11.9
3.7
6.6
21.3
11.9
1.4
1.3
6.8
11.4
0.7
0.6
Indag Rubber
Neutral
172
-
451
283
329
17.0
17.2
13.0
15.4
13.3
11.1
2.9
2.4
21.8
21.6
1.3
1.1
Capital Goods
ACE
Neutral
38
-
376
660
839
4.7
8.2
1.0
3.9
38.0
9.7
1.2
1.1
3.2
11.3
0.7
0.6
BEML
Neutral
1,146
-
4,774
3,277
4,006
6.0
8.9
29.2
64.3
39.3
17.8
2.2
2.0
5.7
11.7
1.5
1.2
BGR Energy
Neutral
107
-
769
3,615
3,181
9.5
9.4
16.7
12.4
6.4
8.6
0.6
0.6
10.0
7.0
0.6
0.8
BHEL
Neutral
212
-
51,816
33,722
35,272
10.8
11.7
10.5
14.2
20.2
14.9
1.5
1.4
7.0
9.0
1.6
1.5
Blue Star
Accumulate
340
387
3,057
3,649
4,209
5.0
5.9
9.2
14.7
37.2
23.1
6.7
6.3
9.1
17.5
0.9
0.8
Crompton Greaves
Buy
174
204
10,877
13,484
14,687
4.9
6.2
4.5
7.1
38.6
24.4
2.7
2.5
7.2
10.8
0.9
0.9
Inox Wind
Buy
373
505
8,288
4,980
5,943
17.0
17.5
26.6
31.6
14.0
11.8
4.2
3.1
35.0
30.0
1.8
1.5
Market Outlook
September 16, 2015
Stock Watch
Company Name
Reco
CMP
Target
Mkt Cap
Sales ( Čcr )
OPM(%)
EPS (Č)
PER(x)
P/BV(x)
RoE(%)
EV/Sales(x)
(Č)
Price ( Č)
( Č cr )
FY16E
FY17E
FY16E
FY17E
FY16E
FY17E
FY16E
FY17E
FY16E
FY17E
FY16E
FY17E
FY16E
FY17E
Capital Goods
KEC International
Neutral
141
-
3,629
8,791
9,716
6.1
6.8
5.4
8.2
26.1
17.2
2.6
2.4
10.0
14.0
0.6
0.6
Thermax
Neutral
928
-
11,057
6,413
7,525
7.4
8.5
30.5
39.3
30.4
23.6
4.7
4.1
15.0
17.0
1.7
1.4
Cement
ACC
Accumulate
1,378
1,548
25,874
11,856
14,092
14.5
17.8
47.6
76.1
29.0
18.1
3.0
2.7
10.6
15.7
2.0
1.7
Ambuja Cements
Accumulate
205
233
31,829
10,569
12,022
20.7
22.2
8.7
10.7
23.6
19.2
3.0
2.8
13.0
15.2
2.6
2.3
India Cements
Buy
72
112
2,202
4,716
5,133
15.9
16.9
3.7
7.5
19.4
9.6
0.7
0.7
3.8
7.3
0.8
0.7
JK Cement
Buy
629
767
4,399
4,056
4,748
14.5
17.0
22.6
41.1
27.8
15.3
2.5
2.2
9.3
15.3
1.5
1.3
J K Lakshmi Cement
Buy
371
430
4,360
2,947
3,616
16.7
19.9
11.5
27.2
32.2
13.6
3.1
2.6
9.8
20.8
1.9
1.5
Mangalam Cements
Neutral
213
-
569
1,053
1,347
10.5
13.3
8.4
26.0
25.4
8.2
1.1
1.0
4.3
12.5
0.9
0.7
Orient Cement
Buy
158
183
3,233
1,854
2,524
21.2
22.2
7.7
11.1
20.5
14.2
2.9
2.5
13.3
15.7
2.5
1.7
Ramco Cements
Accumulate
317
350
7,555
4,036
4,545
20.8
21.3
15.1
18.8
21.0
16.9
2.6
2.3
12.9
14.3
2.4
2.0
Shree Cement^
Neutral
11,459
-
39,918
7,150
8,742
26.7
28.6
228.0
345.5
50.3
33.2
7.4
6.2
15.7
20.3
5.3
4.3
UltraTech Cement
Accumulate
2,923
3,282
80,201
27,562
31,548
20.4
22.3
111.9
143.3
26.1
20.4
3.7
3.2
15.2
16.8
3.0
2.6
Construction
ITNL
Neutral
97
-
2,394
7,360
8,825
34.0
35.9
1.0
5.0
97.1
19.4
0.4
0.4
0.3
1.4
3.8
3.7
KNR Constructions
Neutral
515
-
1,447
915
1,479
14.3
13.9
20.3
37.2
25.3
13.8
2.3
2.0
9.6
15.6
1.7
1.1
Larsen & Toubro
Buy
1,557
2,013
144,899
68,920
82,446
10.9
11.5
57.0
73.0
27.3
21.3
2.5
2.3
13.6
15.5
2.3
1.9
Gujarat Pipavav Port
Neutral
175
-
8,465
721
784
53.1
53.6
8.2
9.1
21.3
19.2
3.4
2.8
20.0
18.3
11.3
10.0
MBL Infrastructures
Buy
241
360
999
2,313
2,797
12.2
14.6
19.0
20.0
12.7
12.1
1.3
1.2
11.3
10.6
1.1
1.0
Nagarjuna Const.
Neutral
63
-
3,475
7,892
8,842
8.3
9.1
2.4
5.3
26.0
11.8
1.0
1.0
4.2
8.6
0.7
0.6
PNC Infratech
Neutral
455
-
2,335
1,798
2,132
13.2
13.5
22.0
30.0
20.7
15.2
1.9
1.7
11.5
11.4
1.4
1.2
Simplex Infra
Neutral
276
-
1,365
6,241
7,008
10.4
10.7
20.0
36.0
13.8
7.7
1.1
1.0
6.8
11.1
0.7
0.6
Financials
Allahabad Bank
Neutral
76
-
4,314
8,438
9,521
2.8
2.8
21.9
27.0
3.5
2.8
0.4
0.3
10.2
11.5
-
-
Axis Bank
Buy
483
701
114,769
26,941
32,298
3.5
3.6
37.4
46.4
12.9
10.4
2.6
2.3
18.7
20.0
-
-
Bank of Baroda
Neutral
182
-
40,194
19,027
21,737
1.9
2.0
16.9
24.5
10.8
7.4
1.0
0.9
9.1
12.1
-
-
Bank of India
Neutral
137
-
9,133
16,438
18,706
1.9
2.0
19.2
40.9
7.2
3.4
0.4
0.3
4.5
9.1
-
-
Canara Bank
Neutral
262
-
13,488
15,491
17,269
2.0
2.0
61.6
70.9
4.3
3.7
0.5
0.4
10.5
11.1
-
-
Dena Bank
Neutral
39
-
2,194
3,498
3,977
2.1
2.3
7.8
10.7
5.0
3.7
0.4
0.3
6.5
8.4
-
-
Federal Bank
Neutral
60
-
10,292
3,527
4,135
3.0
3.1
5.2
6.7
11.5
9.0
1.2
1.1
10.8
12.7
-
-
HDFC
Neutral
1,178
-
185,627
10,883
12,799
3.5
3.4
43.0
50.6
27.4
23.3
5.4
4.9
25.9
26.7
-
-
HDFC Bank
Buy
1,012
1,255
254,613
38,059
46,851
4.4
4.5
50.0
62.7
20.2
16.1
3.5
3.0
18.8
20.2
-
-
Market Outlook
September 16, 2015
Stock Watch
Company Name
Reco
CMP
Target
Mkt Cap
Sales ( Čcr )
OPM(%)
EPS (Č)
PER(x)
P/BV(x)
RoE(%)
EV/Sales(x)
(Č)
Price ( Č)
( Č cr )
FY16E
FY17E
FY16E
FY17E
FY16E
FY17E
FY16E
FY17E
FY16E
FY17E
FY16E
FY17E
FY16E
FY17E
Financials
ICICI Bank
Buy
269
370
156,177
35,810
41,871
3.4
3.5
22.0
26.2
12.2
10.3
2.1
1.8
15.0
15.6
-
-
IDBI Bank
Neutral
57
-
9,102
9,860
10,978
1.8
1.9
9.3
15.6
6.1
3.7
0.4
0.4
6.4
10.1
-
-
Indian Bank
Neutral
126
-
6,042
6,267
7,171
2.4
2.5
25.4
32.1
5.0
3.9
0.4
0.4
8.0
9.3
-
-
LIC Housing Finance
Buy
436
570
21,996
2,934
3,511
2.3
2.3
30.9
36.8
14.1
11.8
2.3
2.0
16.8
17.5
-
-
Oriental Bank
Neutral
129
-
3,859
7,730
8,595
2.4
2.5
38.8
47.4
3.3
2.7
0.3
0.3
8.6
9.8
-
-
Punjab Natl.Bank
Neutral
135
-
25,092
23,446
26,624
2.8
2.9
17.8
27.5
7.6
4.9
0.8
0.6
8.5
12.1
-
-
South Ind.Bank
Neutral
20
-
2,707
1,930
2,215
2.4
2.4
2.6
3.6
7.7
5.6
0.8
0.7
9.9
12.5
-
-
St Bk of India
Buy
234
307
176,898
83,847
96,307
2.8
2.8
20.1
25.1
11.6
9.3
1.3
1.1
11.5
13.1
-
-
Union Bank
Neutral
170
-
10,805
12,755
14,439
2.3
2.4
31.5
39.9
5.4
4.3
0.6
0.5
9.9
11.6
-
-
Vijaya Bank
Neutral
36
-
3,071
3,594
3,969
1.8
1.9
5.8
7.1
6.1
5.1
0.5
0.5
8.2
9.3
-
-
Yes Bank
Buy
729
953
30,534
7,204
9,078
3.2
3.2
57.8
69.5
12.6
10.5
2.2
1.9
19.6
22.6
-
-
FMCG
Asian Paints
Neutral
829
-
79,561
16,553
19,160
16.0
16.2
17.7
21.5
46.9
38.6
12.5
11.2
29.4
31.2
4.6
4.0
Britannia
Neutral
3,077
-
36,911
8,065
9,395
9.6
10.2
47.2
65.5
65.2
47.0
21.7
20.5
38.3
41.2
4.4
3.8
Colgate
Neutral
1,946
-
26,459
4,836
5,490
19.5
19.7
48.5
53.2
40.1
36.6
29.4
25.6
99.8
97.5
5.4
4.7
Dabur India
Neutral
282
-
49,569
9,370
10,265
17.1
17.2
7.3
8.1
38.5
34.8
11.6
9.4
33.7
30.6
5.2
4.7
GlaxoSmith Con*
Neutral
6,159
-
25,903
4,919
5,742
17.2
17.4
168.3
191.2
36.6
32.2
10.4
8.8
28.8
28.9
4.8
4.1
Godrej Consumer
Neutral
1,272
-
43,328
10,168
12,886
16.1
16.1
32.1
38.4
39.6
33.1
8.1
7.4
19.7
21.0
4.4
3.4
HUL
Neutral
805
-
174,136
34,940
38,957
17.5
17.7
20.8
24.7
38.7
32.6
43.0
34.4
110.5
114.2
4.8
4.3
ITC
Buy
317
409
254,142
41,068
45,068
37.8
37.4
13.9
15.9
22.8
19.9
7.6
6.7
34.1
33.8
5.8
5.3
Marico
Neutral
404
-
26,084
6,551
7,766
15.7
16.0
10.4
12.5
39.0
32.4
11.3
9.4
33.2
32.4
3.9
3.3
Nestle*
Accumulate
6,013
6,646
57,975
11,291
12,847
22.2
22.3
158.9
184.6
37.8
32.6
19.8
17.8
55.0
57.3
5.0
4.3
Tata Global
Buy
125
152
7,908
8,635
9,072
9.8
9.9
6.5
7.6
19.3
16.5
1.9
1.8
6.8
7.4
0.9
0.8
IT
HCL Tech^
Buy
929
1,132
130,637
42,038
47,503
23.5
23.5
56.4
62.9
16.5
14.8
3.8
2.9
23.2
19.8
2.7
2.2
Infosys
Buy
1,098
1,306
252,296
60,250
66,999
28.0
28.0
58.3
63.7
18.8
17.2
4.0
3.4
20.9
19.7
3.5
3.0
TCS
Buy
2,543
3,168
498,134
108,420
123,559
28.8
28.7
127.2
143.9
20.0
17.7
8.0
7.4
39.9
41.8
4.2
3.6
Tech Mahindra
Buy
541
646
52,070
25,566
28,890
16.0
17.0
26.3
31.9
20.6
17.0
3.7
3.2
17.9
18.6
1.8
1.5
Wipro
Buy
570
719
140,739
52,414
58,704
23.7
23.8
38.4
42.3
14.8
13.5
2.9
2.6
19.5
18.0
2.3
1.9
Media
D B Corp
Accumulate
312
356
5,732
2,241
2,495
27.8
27.9
21.8
25.6
14.3
12.2
3.7
3.3
26.7
28.5
2.5
2.2
HT Media
Neutral
83
-
1,932
2,495
2,603
11.2
11.2
7.3
8.6
11.4
9.7
0.9
0.8
7.4
8.1
0.3
0.3
Market Outlook
September 16, 2015
Stock Watch
Company Name
Reco
CMP
Target
Mkt Cap
Sales ( Čcr )
OPM(%)
EPS (Č)
PER(x)
P/BV(x)
RoE(%)
EV/Sales(x)
(Č)
Price ( Č)
( Č cr )
FY16E FY17E
FY16E
FY17E
FY16E
FY17E
FY16E
FY17E
FY16E
FY17E
FY16E
FY17E
FY16E
FY17E
Media
Jagran Prakashan
Buy
133
156
4,346
1,939
2,122
26.0
26.0
8.3
9.2
16.0
14.5
2.7
2.5
17.5
17.1
2.2
2.0
Sun TV Network
Neutral
342
-
13,460
2,779
3,196
70.2
70.5
22.8
27.3
15.0
12.5
3.7
3.3
26.7
28.3
4.6
4.0
Hindustan Media
Buy
218
292
1,601
920
1,031
20.0
20.0
19.2
20.9
11.4
10.5
1.9
1.6
16.4
15.3
1.3
1.1
Ventures
Metals & Mining
Coal India
Buy
337
400
213,114
72,015
78,415
21.2
21.5
21.7
25.3
15.5
13.4
5.3
5.2
33.1
39.1
2.2
2.0
Hind. Zinc
Neutral
136
-
57,359
15,258
16,495
44.2
45.6
17.6
19.2
7.7
7.1
1.2
1.1
15.9
15.3
1.5
1.0
Hindalco
Neutral
76
-
15,756
104,356
111,186
8.7
9.5
6.7
11.1
11.4
6.9
0.4
0.4
3.5
5.9
0.7
0.6
JSW Steel
Neutral
945
-
22,839
48,125
53,595
18.8
21.0
46.9
97.5
20.2
9.7
1.0
0.9
4.4
9.5
1.3
1.1
NMDC
Neutral
102
-
40,519
8,237
10,893
46.6
44.5
10.0
11.7
10.3
8.8
1.1
1.0
12.5
13.0
4.7
3.6
SAIL
Neutral
50
-
20,795
45,915
53,954
7.2
10.5
1.5
4.4
33.4
11.5
0.5
0.5
2.3
4.1
1.1
1.0
Vedanta
Neutral
97
-
28,669
71,445
81,910
26.2
26.3
12.9
19.2
7.5
5.0
0.5
0.5
7.2
8.9
0.9
0.6
Tata Steel
Neutral
229
-
22,246
136,805
149,228
11.3
11.9
26.4
36.8
8.7
6.2
0.7
0.6
6.0
8.0
0.7
0.6
Oil & Gas
Cairn India
Neutral
145
-
27,185
11,323
12,490
49.4
51.0
20.7
20.7
7.0
7.0
0.5
0.4
6.4
6.1
1.5
0.8
GAIL
Neutral
290
-
36,792
64,856
70,933
9.1
9.6
24.0
28.9
12.1
10.1
1.0
1.0
8.8
9.6
0.8
0.7
ONGC
Neutral
229
-
196,177
154,564
167,321
36.8
37.4
28.6
32.5
8.0
7.1
1.0
0.9
12.7
13.5
1.5
1.4
Petronet LNG
Buy
173
210
13,005
39,007
40,785
3.8
4.2
9.2
11.0
19.0
15.8
2.1
1.9
11.6
12.7
0.4
0.4
Indian Oil Corp
Accumulate
399
455
96,851
359,607
402,760
5.9
6.1
42.5
48.7
9.4
8.2
1.3
1.1
14.1
14.4
0.4
0.3
Reliance Industries
Accumulate
868
930
280,950
313,085
362,904
13.1
13.8
78.4
92.9
11.1
9.3
1.2
1.1
10.8
11.6
1.4
1.2
Pharmaceuticals
Alembic Pharma
Neutral
659
-
12,416
2,601
3,115
21.2
20.2
20.8
23.9
31.7
27.6
10.2
7.7
37.2
31.8
4.8
3.9
Aurobindo Pharma
Buy
700
872
40,880
14,923
17,162
23.0
23.0
38.2
43.6
18.3
16.1
5.6
4.3
36.0
30.2
3.1
2.6
Aventis*
Neutral
3,928
-
9,047
2,156
2,455
15.1
16.8
109.7
133.9
35.8
29.3
4.9
4.0
18.4
22.5
3.9
3.2
Cadila Healthcare
Neutral
1,791
-
36,669
10,224
11,840
20.0
21.0
71.0
85.6
25.2
20.9
6.8
5.3
30.1
28.5
3.7
3.1
Cipla
Neutral
657
-
52,752
14,359
16,884
21.3
19.7
28.4
30.5
23.1
21.5
4.1
3.5
19.3
17.5
3.7
3.0
Dr Reddy's
Neutral
4,011
-
68,386
17,903
20,842
22.7
22.8
160.5
189.5
25.0
21.2
5.1
4.2
22.2
21.7
3.8
3.2
Dishman Pharma
Accumulate
253
290
2,045
1,716
1,888
20.2
20.2
16.3
21.6
15.6
11.7
1.5
1.3
9.7
11.7
1.4
1.1
GSK Pharma*
Neutral
3,325
-
28,164
2,870
3,158
20.0
22.1
59.5
68.3
55.9
48.7
16.5
16.9
28.5
34.3
9.3
8.5
Indoco Remedies
Neutral
339
-
3,120
1,088
1,262
18.2
18.2
13.1
15.5
25.8
21.8
5.1
4.2
21.2
21.1
2.9
2.5
Ipca labs
Accumulate
752
800
9,484
3,507
4,078
17.6
18.6
25.8
32.0
29.1
23.5
3.8
3.3
13.8
14.9
3.0
2.5
Lupin
Neutral
1,832
-
82,455
14,864
17,244
26.9
26.9
62.1
71.1
29.5
25.8
7.2
5.7
27.4
24.6
5.3
4.4
Sun Pharma
Accumulate
867
950
208,566
28,163
32,610
25.8
30.7
17.4
26.9
49.8
32.2
4.7
4.1
13.0
16.6
6.9
5.7
Market Outlook
September 16, 2015
Stock Watch
Company Name
Reco
CMP
Target
Mkt Cap
Sales ( Čcr )
OPM(%)
EPS (Č)
PER(x)
P/BV(x)
RoE(%)
EV/Sales(x)
(Č)
Price ( Č)
( Č cr )
FY16E FY17E
FY16E
FY17E
FY16E
FY17E
FY16E
FY17E
FY16E
FY17E
FY16E
FY17E
FY16E
FY17E
Power
Tata Power
Neutral
62
-
16,633
35,923
37,402
22.6
22.8
4.1
5.2
15.2
11.9
1.2
1.1
7.5
9.3
1.4
1.3
NTPC
Buy
126
157
104,223
87,064
98,846
23.5
23.5
11.7
13.2
10.8
9.6
1.2
1.1
11.4
12.1
2.2
2.0
Power Grid
Buy
128
170
67,147
20,702
23,361
86.7
86.4
12.1
13.2
10.6
9.7
1.6
1.4
15.6
15.1
8.2
7.6
Telecom
Bharti Airtel
Neutral
350
-
140,069
101,748
109,191
32.1
31.7
12.0
12.5
29.2
28.0
2.0
1.9
6.9
6.7
2.0
1.8
Idea Cellular
Neutral
144
-
51,939
34,282
36,941
32.0
31.5
5.9
6.2
24.5
23.3
2.2
2.0
9.9
9.3
2.1
2.0
zOthers
Abbott India
Neutral
5,364
-
11,398
2,715
3,153
14.5
14.1
134.3
152.2
40.0
35.2
10.0
8.2
27.4
25.6
3.9
3.3
Bajaj Electricals
Buy
251
341
2,532
4,719
5,287
5.2
5.8
8.6
12.7
29.3
19.8
3.4
2.9
11.4
14.8
0.5
0.5
Finolex Cables
Neutral
235
-
3,588
2,728
3,036
10.8
11.0
14.4
16.8
16.3
14.0
2.5
2.2
15.2
15.3
1.1
0.9
Goodyear India*
Buy
562
655
1,297
1,953
1,766
12.4
12.0
67.4
59.6
8.3
9.4
2.1
1.8
27.7
20.2
0.4
0.4
Hitachi
Neutral
1,335
-
3,629
1,806
2,112
9.0
9.2
28.6
29.1
46.7
45.9
11.6
9.4
28.1
22.6
2.1
1.8
Jyothy Laboratories
Neutral
310
-
5,617
1,620
1,847
11.5
11.5
7.3
8.5
42.6
36.6
5.5
5.1
13.3
14.4
3.3
2.8
MRF
Accumulate
39,955
43,575
16,946
20,727
14,841
19.3
18.6
4,905.8
3,351.9
8.1
11.9
2.6
2.1
37.6
19.6
0.8
1.0
Page Industries
Neutral
13,021
-
14,524
1,929
2,450
19.8
20.1
229.9
299.0
56.6
43.6
25.0
17.4
52.1
47.1
7.6
5.9
Relaxo Footwears
Neutral
538
-
6,450
1,767
2,152
12.3
12.5
19.3
25.1
27.9
21.5
6.9
5.3
27.7
27.8
3.7
3.0
Siyaram Silk Mills
Buy
959
1,221
899
1,653
1,873
11.7
12.2
99.3
122.1
9.7
7.9
1.7
1.5
19.5
20.2
0.7
0.6
Styrolution ABS India*
Neutral
742
-
1,304
1,271
1,440
8.6
9.2
32.0
41.1
23.2
18.1
2.4
2.1
10.7
12.4
1.0
0.9
Tree House
Buy
359
449
1,519
259
324
56.8
56.8
17.0
21.7
21.1
16.6
2.1
1.9
10.1
11.5
5.8
4.8
TVS Srichakra
Buy
2,647
3,210
2,026
2,127
2,388
15.2
14.9
237.7
267.5
11.1
9.9
4.7
3.4
51.7
39.8
1.0
0.9
HSIL
Buy
260
434
1,878
2,085
2,436
18.5
18.6
21.7
28.9
12.0
9.0
1.2
1.1
10.0
12.1
1.0
0.8
Kirloskar Engines India
Neutral
300
-
4,331
2,634
3,252
10.1
12.0
10.9
17.4
27.5
17.2
3.1
2.7
11.4
16.8
1.3
1.0
Ltd
M M Forgings
Buy
527
797
636
563
671
22.1
22.9
51.0
66.5
10.3
7.9
2.2
1.7
23.1
24.1
1.3
1.0
Banco Products (India)
Neutral
117
-
838
1,208
1,353
11.0
12.3
10.8
14.5
10.9
8.1
1.2
1.1
11.9
14.5
0.7
0.6
Competent Automobiles Neutral
143
-
88
1,007
1,114
3.1
3.1
23.7
28.2
6.1
5.1
0.8
0.7
13.9
14.6
0.1
0.1
Nilkamal
Accumulate
905
1,005
1,350
1,948
2,147
10.6
10.3
60.0
67.0
15.1
13.5
2.4
2.0
16.8
16.1
0.8
0.6
Visaka Industries
Buy
131
166
209
1,158
1,272
8.6
9.5
23.7
32.7
5.5
4.0
0.6
0.5
10.1
12.5
0.4
0.3
Transport Corporation of
Buy
236
293
1,796
2,830
3,350
8.8
9.0
14.4
18.3
16.4
12.9
2.5
2.2
15.4
17.1
0.8
0.7
India
Elecon Engineering
Buy
71
87
776
1,452
1,596
14.0
14.7
4.4
6.2
16.1
11.4
1.3
1.2
8.6
11.2
0.8
0.7
Surya Roshni
Buy
117
183
514
2,992
3,223
8.3
8.5
14.7
18.3
8.0
6.4
0.7
0.7
9.8
11.0
0.5
0.4
MT Educare
Buy
127
169
507
286
366
18.3
17.7
7.7
9.4
16.5
13.6
3.5
3.0
20.2
21.1
1.7
1.3
Market Outlook
September 16, 2015
Stock Watch
Company Name
Reco
CMP
Target Mkt Cap
Sales ( Čcr )
OPM(%)
EPS (Č)
PER(x)
P/BV(x)
RoE(%)
EV/Sales(x)
(Č)
Price ( Č)
( Č cr )
FY16E FY17E FY16E FY17E FY16E FY17E FY16E FY17E FY16E FY17E FY16E FY17E FY16E FY17E
zOthers
Radico Khaitan
Buy
84
112
1,120
1,565
1,687
11.9
12.4
5.4
6.6
15.6
12.8
1.2
1.2
8.0
9.0
1.2
1.2
Garware Wall Ropes
Buy
289
390
632
875
983
10.4
10.6
23.1
27.8
12.5
10.4
1.8
1.5
14.1
14.8
0.7
0.6
Wonderla Holidays
Buy
277
322
1,565
206
308
44.0
43.6
9.0
12.9
30.8
21.5
4.2
3.8
13.7
17.8
7.5
5.0
Linc Pen & Plastics
Buy
152
185
225
340
371
8.3
8.9
10.8
13.2
14.1
11.5
2.3
2.0
16.0
17.1
0.7
0.6
The Byke Hospitality
Accumulate
159
181
638
222
287
20.5
20.5
5.6
7.6
28.2
21.1
5.3
4.4
18.9
20.8
2.9
2.2
Source: Company, Angel Research; Note: *December year end; #September year end; &October year end; Price as on September 15, 2015
Market Outlook
September 16, 2015
Research Team Tel: 022 - 39357800
DISCLAIMER
Angel Broking Private Limited (hereinafter referred to as “Angel”) is a registered Member of National Stock Exchange of India Limited,
Bombay Stock Exchange Limited and MCX Stock Exchange Limited. It is also registered as a Depository Participant with CDSL and
Portfolio Manager with SEBI. It also has registration with AMFI as a Mutual Fund Distributor. Angel Broking Private Limited is a registered
entity with SEBI for Research Analyst in terms of SEBI (Research Analyst) Regulations, 2014 vide registration number INH000000164.
Angel or its associates has not been debarred/ suspended by SEBI or any other regulatory authority for accessing /dealing in securities
Market. Angel or its associates including its relatives/analyst do not hold any financial interest/beneficial ownership of more than 1% in
the company covered by Analyst. Angel or its associates/analyst has not received any compensation / managed or co-managed public
offering of securities of the company covered by Analyst during the past twelve months. Angel/analyst has not served as an officer,
director or employee of company covered by Analyst and has not been engaged in market making activity of the company covered by
Analyst.
This document is solely for the personal information of the recipient, and must not be singularly used as the basis of any investment
decision. Nothing in this document should be construed as investment or financial advice. Each recipient of this document should make
such investigations as they deem necessary to arrive at an independent evaluation of an investment in the securities of the companies
referred to in this document (including the merits and risks involved), and should consult their own advisors to determine the merits and
risks of such an investment.
Reports based on technical and derivative analysis center on studying charts of a stock's price movement, outstanding positions and
trading volume, as opposed to focusing on a company's fundamentals and, as such, may not match with a report on a company's
fundamentals.
The information in this document has been printed on the basis of publicly available information, internal data and other reliable sources
believed to be true, but we do not represent that it is accurate or complete and it should not be relied on as such, as this document is for
general guidance only. Angel Broking Pvt. Limited or any of its affiliates/ group companies shall not be in any way responsible for any
loss or damage that may arise to any person from any inadvertent error in the information contained in this report. Angel Broking Pvt.
Limited has not independently verified all the information contained within this document. Accordingly, we cannot testify, nor make any
representation or warranty, express or implied, to the accuracy, contents or data contained within this document. While Angel Broking
Pvt. Limited endeavors to update on a reasonable basis the information discussed in this material, there may be regulatory, compliance,
or other reasons that prevent us from doing so.
This document is being supplied to you solely for your information, and its contents, information or data may not be reproduced,
redistributed or passed on, directly or indirectly.
Neither Angel Broking Pvt. Limited, nor its directors, employees or affiliates shall be liable for any loss or damage that may arise from or
in connection with the use of this information.
Note: Please refer to the important ‘Stock Holding Disclosure' report on the Angel website (Research Section). Also, please refer to the
latest update on respective stocks for the disclosure status in respect of those stocks. Angel Broking Pvt. Limited and its affiliates may have
investment positions in the stocks recommended in this report.