Market Outlook
June 16, 2016
Market Cues
Domestic Indices
Chg (%)
(Pts)
(Close)
Indian markets are expected to open in red tracking SGX Nifty.
BSE Sensex
1.3
331
26,726
Nifty
1.2
98
8,207
U.S. stocks gave up their gains as the close neared to end lower Wednesday, after
the conclusion of Janet Yellen's press conference and Fed meeting. Dow industrial
Mid Cap
0.6
66
11,407
average and S&P 500 posted their first 5-day losing streak since the one ending Feb
Small Cap
0.8
92
11,464
11. Nasdaq had its first 5-day losing streak since late April. Fed kept rates
Bankex
1.4
280
20,525
unchanged at its June meeting. 6 members projected only 1 hike this year, although
median expectation remained 2 hikes this year.
Global Indices
Chg (%)
(Pts)
(Close)
FTSE 100 in London ended in red, amidst concerns over Brexit vote. Recent opinion
Dow Jones
(0.2)
(35)
17,640
polls suggest there may be growing support for Brexit vote in 23 June referendum.
Nasdaq
(0.2)
(9)
4,835
Equity indices snapped 4-day fall on Wednesday with Sensex rallying over 300
FTSE
0.7
43
5,967
points after the cabinet cleared aviation policy & SBI merger, and ahead of the
Nikkei
0.4
61
15,920
outcome of Fed's 2-day policy meeting. Banking shares led the rally followed by
Hang Seng
0.4
80
20,468
Infra, FMCG and IT stocks.
Shanghai Com
1.6
45
2,887
News Analysis
Exports fall for 18th consecutive month in May
Advances / Declines
BSE
NSE
Crompton to sell automation arm for `754cr
Advances
1,678
1,056
Detailed analysis on Pg2
Declines
965
494
Investor’s Ready Reckoner
Unchanged
175
81
Key Domestic & Global Indicators
Stock Watch: Latest investment recommendations on 150+ stocks
Volumes (` Cr)
Refer Pg5 onwards
BSE
2,948
NSE
16,594
Top Picks
CMP
Target
Upside
Company
Sector
Rating
(`)
(`)
(%)
Net Inflows (` Cr)
Net
Mtd
Ytd
Amara Raja
Auto/Auto Ancillary
Buy
874
1,076
23.1
FII
(92)
4,455
18,824
HCL Tech
IT
Buy
755
1,000
32.4
MFs
(84)
(573)
8,857
LIC Housing
Financials
Buy
477
592
24.0
Bharat Electronics
Capital Goods
Accumulate
1,260
1,414
12.3
Top Gainers
Price (`)
Chg (%)
Navkar Corporation Others
Buy
199
265
33.2
More Top Picks on Pg4
Indianb
119
11.1
Monsanto
2,653
9.1
Key Upcoming Events
Sintex
80
6.0
Previous
Consensus
Date
Region
Event Description
Reading
Expectations
Indiacem
103
4.8
June 16 US
Initial Jobeless claims
264.0
270.0
Il&Fstrans
77
4.7
June 16 US
FOMC rate decision
0.5
0.5
June 16 UK
BOE Annouces rates
0.5
0.5
Top Losers
Price (`)
Chg (%)
June 17 US
Housing Starts
1172.0
1150.0
6.(
Unitech
5
(4.5)
More Events on Pg5
Jpassociat
8
(4.4)
Infratel
365
(3.9)
Cholafin
920
(2.8)
Aloktext
4
(2.8)
As on June 15, 2016
Market Outlook
June 16, 2016
Exports fall for 18th consecutive month in May
India’s merchandise exports fall for 18th consecutive month in May-2016. This is in
comparison to the 9 months of successive fall in the exports seen during FY2009.
Exports contracted 0.79 % to $22.17bn in May-2016, against $22.34bn in May-
2015. In addition to the global slowdown, this sharp fall in exports is attributable
to global factors like decline in commodity prices, sluggishness in Chinese
economy amongst others. Notably, several non-oil sectors such as engineering
and gems and Jewellery saw rise in outward shipments. Exports of engineering
goods entered positive zone and recorded 2.2% growth. Gems and jewellery
exports too grew 24.34% to $3.71bn.
Exports last time recorded 7.27% year-over-year growth in November-2014.
Cumulative exports for FY2017 (April-May) stood at $42.73bn as compared to
$44.40bn for comparable period in last financial year.
Total exports for FY2016 stood at $261bn. This was 15.85% lower than previous
years over $310bn worth of trade. While government at the beginning of the year
targeted $300bn exports, this figure had to be revised downwards to $260-270bn
after merchandise trade remained negative through-out the financial year.
Imports too declined 13.16% to $28.44bn in May as compared to $32.75bn in
the year ago period. Cumulative imports in current financial year reached
$53.85bn as compared to $65.80bn in previous year.
Oil imports in May dipped by 30.45% to $5.93bn. Non-oil imports too fell by
7.06% to $22.5bn.
The trade deficit narrowed to $6.27bn in May, from $10.4bn in the same month
last year.
Post such announcement, Commerce Minister said that Exports are all set to take
off from here onwards and we can look for double digit growth from October
onwards, which may pave way for reaching $300bn in the current fiscal. Reacting
to the announcement, Exporters body FIEO said decline in exports has largely
been arrested and non-oil exports have turned positive after a long gap.
Crompton to sell automation arm for `754cr
Media reports suggest that Crompton Greaves (CG) is selling its global
automation business, ZIV, at valuation of $112mn (`754cr) by September, which
would leave it to focus on its India businesses. In addition to this, CG has invested
`200cr in the ZIV business, since acquisition. CG has already appointed bankers
to sell this business, which reported sales of `754cr (Euro100mn) in FY2016. CG
had acquired ZIV in Jul-2012 at an Enterprise Value of Euro150mn, indicating loss
on sale of business.
Sale of its automation business comes in the backdrop of company selling its
transmission and distribution business abroad to US-based private equity firm First
Reserve International at Enterprise value of Euro115mn (~`866cr) on a debt-free,
cash-free basis. Sales will include the T&D business in Indonesia, US, Hungary,
France, Belgium and Ireland. Crompton expects sale to be completed by October.
Market Outlook
June 16, 2016
CG in April last year sold its consumer electronics business for `2,000cr to a clutch
of private equity firms and listed it on the Indian stock exchanges. The group's
promoter company had sold its power business to Adani group in 2015.
ZIV in FY2016 reported EBITDA of `60cr, and was expected to report net profits in
FY2017.
We see this development to be positive, as it would now allow the company to
focus on domestic power & industrial business, which has strong growth potential.
Further, the domestic industrial business would benefit from healthy replacement
demand, continued spend on water and irrigation and improved traction from
railways and better outlook in the cement sector. Despite expected recovery in the
domestic business, we expect the margin recovery to be gradual and slower given
the ongoing execution of few legacy projects and losses from the systems business.
We continue to maintain our NEUTRAL rating on the stock.
Economic and Political News
Chennai Metro Rail Project Phase-II planned at cost of `44,000cr
Govt. approves `2,070cr highway project in Punjab
Cabinet okays 10% stake sale in Hudco
Corporate News
Tata Power network rollout plan for Mumbai hits regulatory hurdle
Jaguar Land Rover opens Brazil facility
Reliance Games to play in Indian market again
Market Outlook
June 16, 2016
Top Picks
Large Cap
M
arket Cap
CM
P
T
arget
Upsid
e
Company
Rationale
(` Cr)
(`)
(`)
(%)
To outpace battery industry growth due to better technological
Amara Raja Batteries
14,927
874
1,076
23.1
products leading to market share gains in both the automotive
OEM and replacement segments.
Uptick in defense capex by government, coupled with BELs
Bharat Electronics
30,229
1,260
1,414
12.3
strong market positioning, indicate good times ahead for BEL.
HCL Tech
1,06,518
755
1,000
32.4
Stock is trading at attractive valuations & factors all bad news.
Strong visibility for a robust 20% earnings trajectory, coupled
HDFC Bank
2,96,036
1,169
1,262
7.9
with high quality of earnings on account of high quality retail
business and strategic focus on highly rated corporates.
Back on the growth trend, expect a long term growth of 14% to
Infosys
2,73,153
1,189
1,374
15.5
be a US$20bn in FY2020.
Continues to grow its retail loan book at healthy pace with
LIC Housing Finance
24,088
477
592
24.0
improvement in asset quality. Expect LICHF to post a healthy
loan book which is likely to reflect in a strong earnings growth.
Huge bid pipeline of re-development works at Delhi and other
NBCC
11,031
184
220
19.7
State Governments and opportunity from Smart City, positions
NBCC to report strong growth, going forward.
Strong market positioning within the domestic AC markets to
Voltas
10,923
330
407
23.3
continue, EMP business set to revive
Source: Company, Angel Research
Mid Cap
M
arket Cap
CM
P
T
arget
Upsid
e
Company
Rationale
(` Cr)
(`)
(`)
(%)
Among the top 4 players in the consumer durables segment.
Bajaj Electricals
2,328
230
268
16.3
Improved profitability backed by turn around in E&P segment.
Strong order book lends earnings visibility.
Favourable outlook for AC industry to augur well for Cooling
Blue Star
3,894
433
495
14.3
products business. EMPPAC division's profitability to improve
once operating environment turns around.
With a focus on the low and medium income (LMI) consumer
Dewan Housing
6,020
206
270
30.9
segment, the company has increased its presence in tier-II & III
cities where the growth opportunity is immense.
Strong loan growth backed by diversified loan portfolio and
Equitas Holdings
5,772
172
235
36.5
adequate CAR. ROE & ROA likely to remain decent as risk of
dilution remains low. Attractive valuations considering growth.
Commencement of new projects, downtrend in the interest rate
IL&FS Transport
2,545
77
93
20.2
cycle, to lead to stock re-rating
Economic recovery to have favourable impact on advertising &
circulation revenue growth. Further, the acquisition of a radio
Jagran Prakashan
5,593
171
205
19.8
business (Radio City) would also boost the company's revenue
growth.
Speedier execution and speedier sales, strong revenue visibility
Mahindra Lifespace
1,874
457
554
21.3
in short-to-long run, attractive valuations
Massive capacity expansion along with rail advantage at ICD
Navkar Corporation
2,838
199
265
33.2
as well CFS augurs well for the company
Earnings boost on back of stable material prices and
Radico Khaitan
1,212
91
125
37.2
favourable pricing environment. Valuation discount to peers
provides additional comfort
Strong brands and distribution network would boost growth
Siyaram Silk Mills
955
1,018
1,347
32.3
going ahead. Stock currently trades at an inexpensive
valuation.
Source: Company, Angel Research
Market Outlook
June 16, 2016
Key Upcoming Events
Global economic events release calendar
Bloomberg Data
Date
Time
Country Event Description
Unit
Period
Last Reported Estimated
Jun 16, 2016
11:30 PM
US
FOMC rate decision
% Jun 15
0.50
0.50
6:00 PM
US
Initial Jobless claims
Thousands Jun 11
264.00
270.00
6:00 PM
US Consumer price index (mom)
% Change
May
0.40
0.30
4:30 PM
UK
BOE Announces rates
% Ratio Jun 16
0.50
0.50
Jun 17, 2016
6:00 PM
US
Housing Starts
Thousands
May
1172.00
1,150.00
6:00 PM
US
Building permits
Thousands
May
1130.00
1,145.00
June 22, 2016
7:30 PM Euro Zone Euro-Zone Consumer Confidence Value
Jun A
-7.00
7:30 PM US
Existing home sales
Million
May
5.45
5.50
June 23, 2016
1:00 PM Germany PMI Services
Value
Jun P
55.20
1:00 PM Germany
PMI Manufacturing
Value
Jun P
52.10
7:30 PM
US
New home sales
Thousands
May
619.00
565.00
Jun 28, 2016
6:00 PM
US
GDP Qoq (Annualised)
% Change 1Q T
0.80
7:30 PM
US
Consumer ConfidenceS.A./ 1985=100
Jun
92.60
Jun 30, 2016
1:25 PM Germany Unemployment change (000's)
Thousands
Jun
(11.00)
2:00 PM
UK
GDP (YoY)
% Change 1Q F
2.10
Jul 01, 2016
2:00 PM
UK
PMI Manufacturing
Value
Jun
50.10
6:30 AM
China
PMI Manufacturing
Value
Jun
50.10
Source: Bloomberg, Angel Research
Market Outlook
June 16, 2016
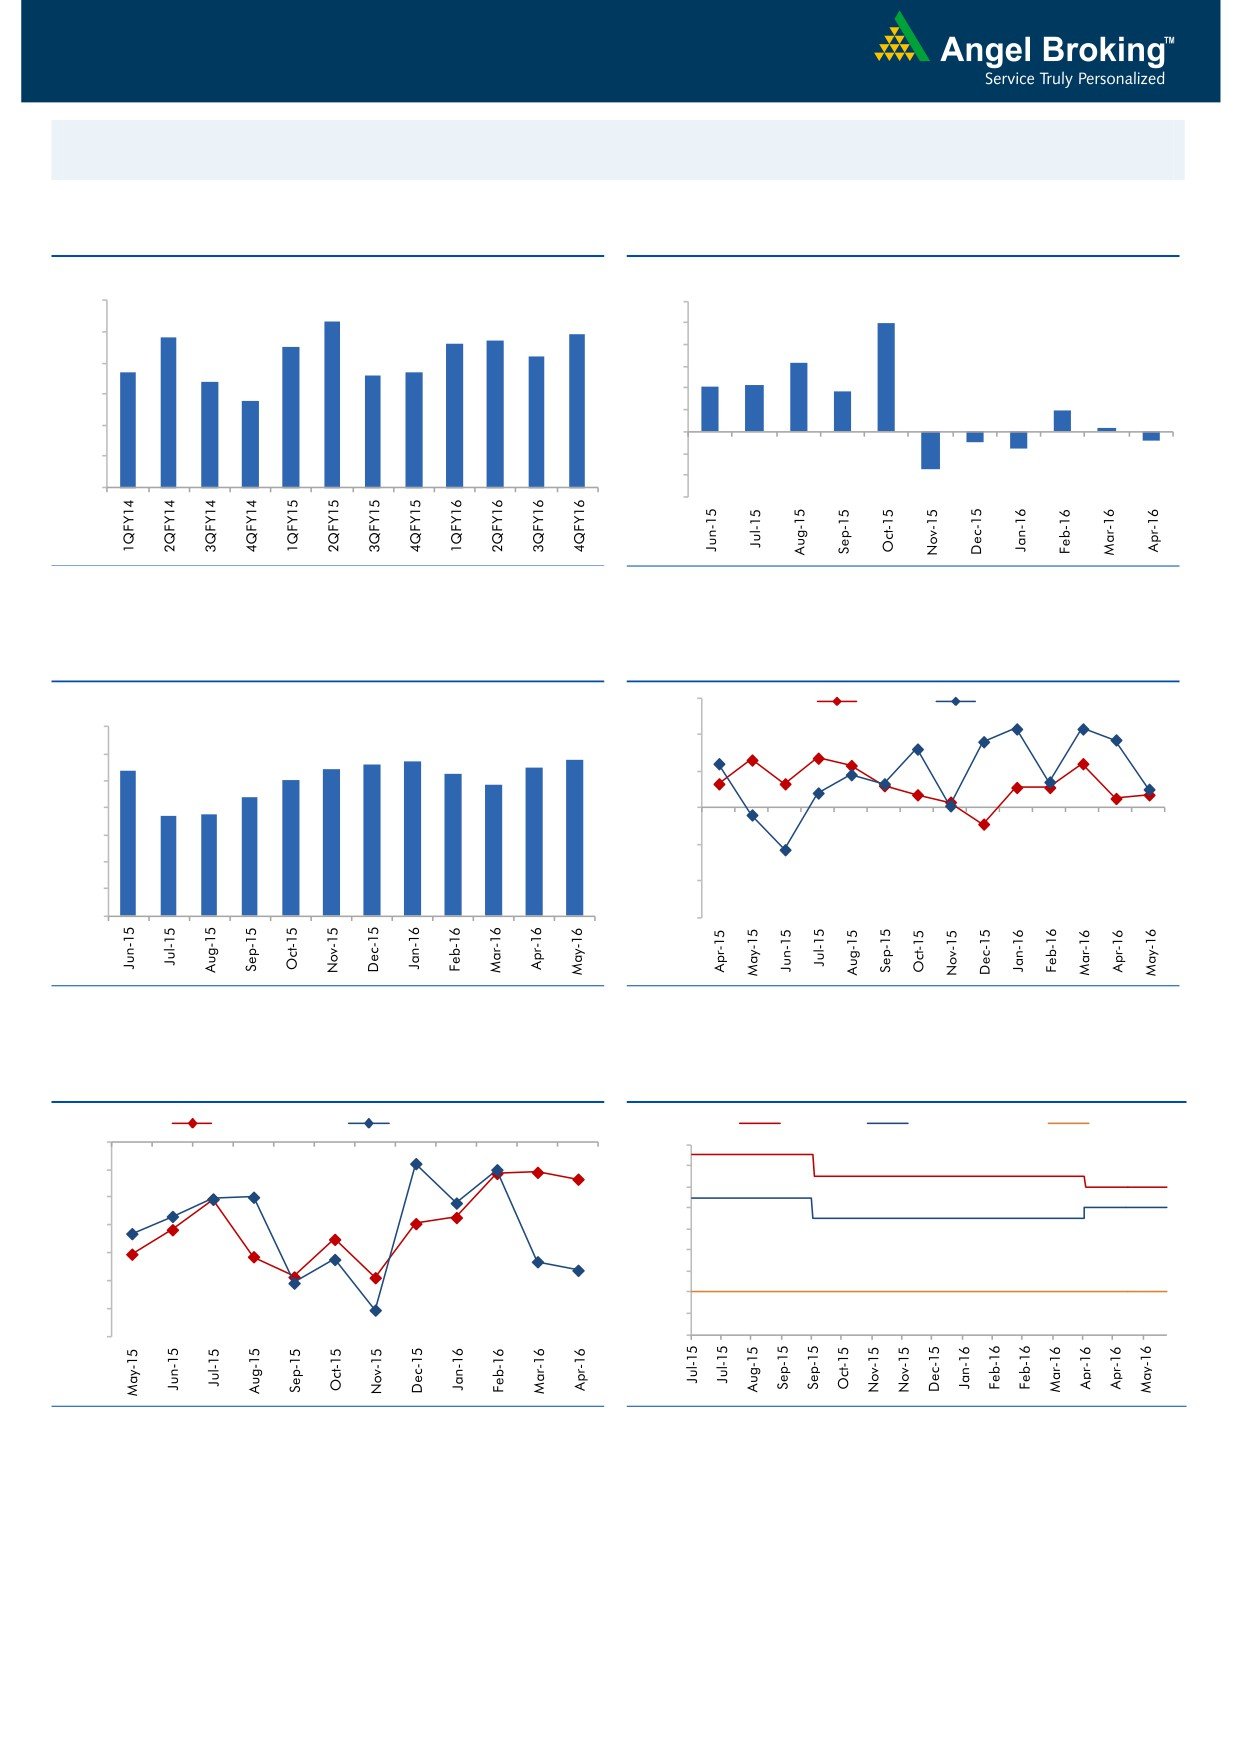
Macro watch
Exhibit 1: Quarterly GDP trends
Exhibit 2: IIP trends
(%)
(%)
9.0
12.0
8.3
9.9
7.8
7.7
7.9
10.0
8.0
7.5
7.6
7.2
8.0
6.3
6.7
6.6
6.7
7.0
6.4
6.0
4.2
4.3
3.7
5.8
4.0
6.0
2.0
2.0
0.3
5.0
-
4.0
(2.0)
(0.9)
(0.8)
(1.6)
(4.0)
3.0
(3.4)
(6.0)
Source: CSO, Angel Research
Source: MOSPI, Angel Research
Exhibit 3: Monthly CPI inflation trends
Exhibit 4: Manufacturing and services PMI
56.0
Mfg. PMI
Services PMI
(%)
7.0
54.0
5.6
5.7
5.8
5.4
5.4
5.5
6.0
5.3
5.0
4.8
52.0
5.0
4.4
3.7
3.7
4.0
50.0
3.0
48.0
2.0
46.0
1.0
-
44.0
Source: MOSPI, Angel Research
Source: Market, Angel Research; Note: Level above 50 indicates expansion
Exhibit 5: Exports and imports growth trends
Exhibit 6: Key policy rates
(%)
Exports yoy growth
Imports yoy growth
(%)
Repo rate
Reverse Repo rate
CRR
0.0
7.50
(5.0)
7.00
6.50
(10.0)
6.00
(15.0)
5.50
(20.0)
5.00
4.50
(25.0)
4.00
(30.0)
3.50
(35.0)
3.00
Source: Bloomberg, Angel Research
Source: RBI, Angel Research
Market Outlook
June 16, 2016
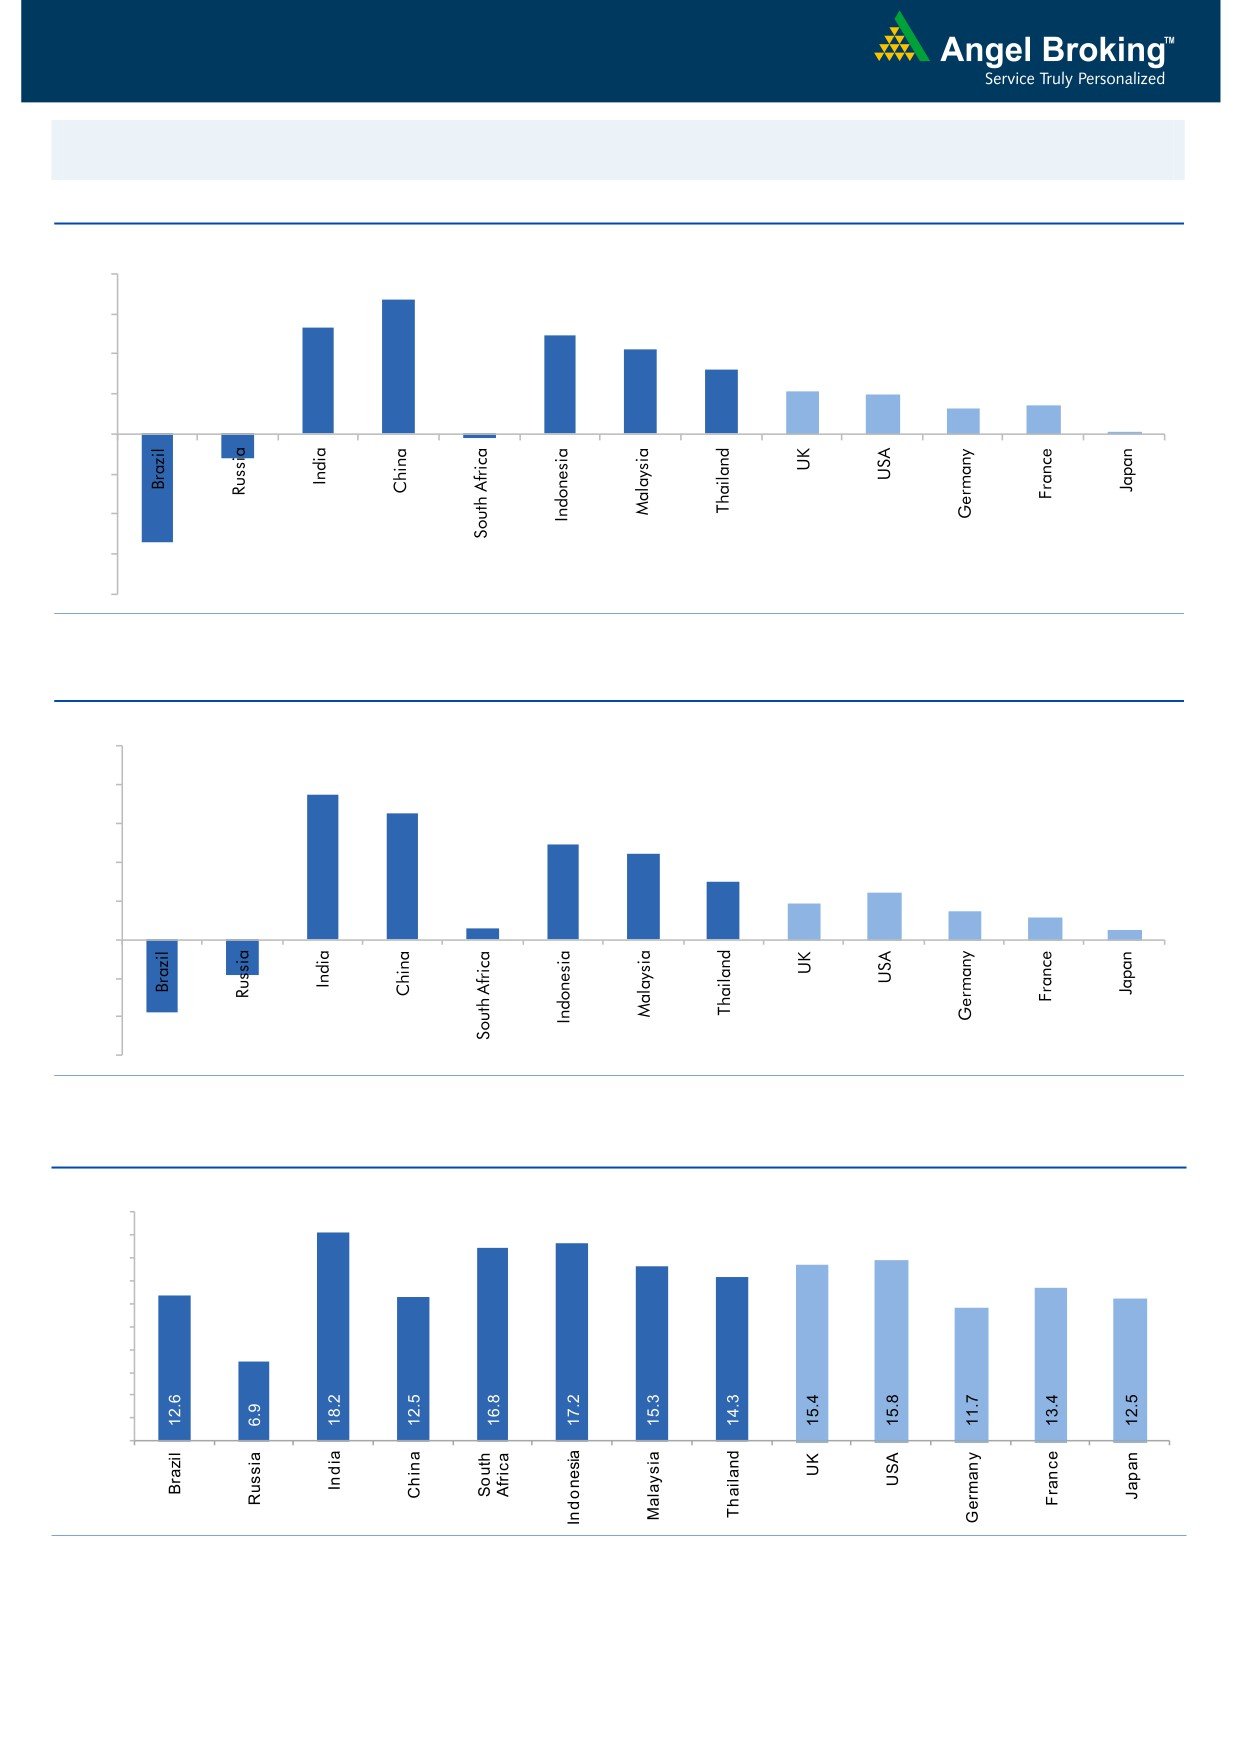
Global watch
Exhibit 1: Latest quarterly GDP Growth (%, yoy) across select developing and developed countries
(%)
8.0
6.7
6.0
5.3
4.9
4.2
4.0
3.2
2.1
2.0
1.3
1.4
2.0
0.1
-
(0.2)
(2.0)
(4.0)
(1.2)
(6.0)
(5.4)
(8.0)
Source: Bloomberg, Angel Research
Exhibit 2: 2016 GDP Growth projection by IMF (%, yoy) across select developing and developed countries
(%)
10.0
7.5
8.0
6.5
6.0
4.9
4.4
4.0
3.0
2.4
1.9
1.5
2.0
1.1
0.6
0.5
(3.8)
(1.8)
-
(2.0)
(4.0)
(6.0)
Source: IMF, Angel Research
Exhibit 3: One year forward P-E ratio across select developing and developed countries
(x)
20.0
18.0
16.0
14.0
12.0
10.0
8.0
6.0
4.0
2.0
-
Source: IMF, Angel Research
Market Outlook
June 16, 2016
Exhibit 4: Relative performance of indices across globe
Returns (%)
Country
Name of index
Closing price
1M
3M
1YR
Brazil
Bovespa
48,915
(5.9)
0.2
(6.3)
Russia
Micex
1,890
(1.3)
(0.4)
13.6
India
Nifty
8,207
3.8
7.7
1.1
China
Shanghai Composite
2,887
0.2
1.3
(42.1)
South Africa
Top 40
46,050
0.9
0.4
(0.7)
Mexico
Mexbol
45,011
(1.7)
1.3
1.2
Indonesia
LQ45
820
0.7
(1.9)
(6.4)
Malaysia
KLCI
1,628
0.4
(3.9)
(6.2)
Thailand
SET 50
911
1.8
1.9
(7.6)
USA
Dow Jones
17,640
0.1
3.0
(0.3)
UK
FTSE
5,967
(2.8)
(2.8)
(11.0)
Japan
Nikkei
15,920
(3.3)
(5.5)
(22.2)
Germany
DAX
9,607
(2.8)
(2.5)
(13.6)
France
CAC
4,172
(3.5)
(7.5)
(17.6)
Source: Bloomberg, Angel Research
Stock Watch
June 16, 2016
Company Name
Reco
CMP
Target
Mkt Cap
Sales ( Čcr )
OPM(%)
EPS (Č)
PER(x)
P/BV(x)
RoE(%)
EV/Sales(x)
(Č)
Price ( Č)
( Č cr )
FY16E FY17E
FY16E
FY17E
FY16E
FY17E
FY16E
FY17E
FY16E
FY17E
FY16E
FY17E
FY16E
FY17E
Agri / Agri Chemical
Rallis
Neutral
209
-
4,057
1,612
1,911
13.3
13.3
7.4
9.5
28.2
22.0
4.5
4.0
16.7
18.4
2.7
2.2
United Phosphorus
Buy
585
684
25,052
13,083
15,176
18.5
18.5
31.5
37.4
18.6
15.6
3.7
3.1
21.4
21.4
2.1
1.8
Auto & Auto Ancillary
Ashok Leyland
Accumulate
103
111
29,327
17,995
21,544
11.4
11.6
3.4
4.7
30.3
21.9
5.3
4.9
17.7
22.2
1.6
1.3
Bajaj Auto
Neutral
2,602
-
75,296
22,709
25,860
20.9
20.1
129.0
143.6
20.2
18.1
6.2
5.3
30.7
29.4
2.8
2.5
Bharat Forge
Buy
744
875
17,311
7,351
8,318
19.9
19.7
31.2
36.5
23.8
20.4
4.3
3.6
19.3
19.2
2.5
2.2
Eicher Motors
Accumulate
18,637
20,044
50,621
15,556
16,747
15.5
17.3
464.8
597.5
40.1
31.2
14.6
10.8
36.2
34.3
3.2
2.9
Gabriel India
Accumulate
90
101
1,287
1,415
1,544
8.7
9.0
4.6
5.4
19.5
16.6
3.5
3.1
18.1
18.9
0.9
0.8
Hero Motocorp
Neutral
3,067
-
61,238
28,244
30,532
15.5
15.9
156.7
168.5
19.6
18.2
7.8
6.6
39.9
36.4
2.0
1.8
Jamna Auto Industries Neutral
170
-
1,360
1,281
1,473
11.2
11.5
7.6
9.2
22.4
18.5
5.7
4.6
25.4
25.2
1.0
0.9
L G Balakrishnan & Bros Neutral
473
-
743
1,254
1,394
11.6
11.8
35.9
41.7
13.2
11.4
1.8
1.6
13.5
13.8
0.7
0.6
Mahindra and Mahindra Neutral
1,355
-
84,133
38,416
42,904
13.7
13.9
54.8
63.4
24.7
21.4
3.8
3.4
15.4
15.8
1.9
1.6
Maruti
Neutral
4,207
-
127,088
57,865
68,104
16.4
16.7
176.3
225.5
23.9
18.7
4.6
4.0
19.4
21.2
1.9
1.6
Minda Industries
Neutral
1,146
-
1,817
2,523
2,890
8.7
9.0
55.0
65.4
20.8
17.5
4.0
3.3
19.3
18.7
0.8
0.7
Motherson Sumi
Accumulate
294
313
38,836
39,343
45,100
8.8
9.1
10.1
12.5
29.1
23.5
9.2
7.2
35.3
34.4
1.0
0.9
Rane Brake Lining
Buy
378
465
299
454
511
11.5
12.0
25.2
31.0
15.0
12.2
2.2
2.0
14.9
16.6
0.8
0.7
Setco Automotive
Neutral
44
-
589
594
741
12.7
13.7
1.7
3.2
25.9
13.8
2.7
2.4
10.4
16.9
1.4
1.2
Tata Motors
Neutral
452
-
130,559
259,686
273,957
13.0
13.4
25.9
29.5
17.5
15.3
2.3
2.0
8.0
9.0
0.7
0.7
TVS Motor
Accumulate
292
330
13,861
11,263
13,122
6.9
8.5
9.2
15.0
31.7
19.5
7.2
5.8
22.7
29.6
1.2
1.0
Amara Raja Batteries
Buy
874
1,076
14,927
4,690
5,429
17.5
17.5
28.5
35.3
30.7
24.7
7.1
5.8
23.1
25.9
3.1
2.6
Exide Industries
Neutral
160
-
13,626
6,950
7,784
14.4
14.8
6.6
7.3
24.3
22.0
3.1
2.8
12.6
12.8
1.6
1.5
Apollo Tyres
Buy
152
183
7,740
12,056
12,714
17.2
16.4
23.0
20.3
6.6
7.5
1.2
1.0
17.7
13.6
0.7
0.7
Ceat
Buy
868
1,119
3,513
6,041
6,597
14.1
13.7
99.5
111.9
8.7
7.8
1.7
1.4
19.6
18.5
0.7
0.6
JK Tyres
Neutral
91
-
2,063
7,446
7,669
15.2
14.0
19.6
18.4
4.6
4.9
1.2
1.0
25.2
19.5
0.7
0.6
Swaraj Engines
Neutral
1,138
-
1,414
552
630
14.2
14.7
44.6
54.1
25.5
21.0
5.9
5.4
23.2
25.6
2.3
2.0
Subros
Neutral
92
-
550
1,293
1,527
11.8
11.9
4.2
6.7
21.8
13.7
1.6
1.5
7.7
11.5
0.8
0.6
Indag Rubber
Neutral
190
-
499
283
329
17.0
17.2
13.0
15.4
14.7
12.3
3.2
2.7
21.8
21.6
1.5
1.2
Capital Goods
ACE
Neutral
41
-
403
660
839
4.7
8.2
1.0
3.9
40.8
10.5
1.3
1.1
3.2
11.3
0.8
0.6
BEML
Buy
848
1,157
3,532
3,277
4,006
6.0
8.9
36.2
64.3
23.4
13.2
1.6
1.5
5.7
11.7
1.2
0.9
Bharat Electronics
Accumulate
1,260
1,414
30,229
7,295
8,137
20.0
16.8
56.5
58.7
22.3
21.5
3.3
3.0
42.1
44.6
3.4
2.9
Stock Watch
June 16, 2016
Company Name
Reco
CMP
Target
Mkt Cap
Sales ( Čcr )
OPM(%)
EPS (Č)
PER(x)
P/BV(x)
RoE(%)
EV/Sales(x)
(Č)
Price ( Č)
( Č cr )
FY16E
FY17E
FY16E
FY17E
FY16E
FY17E
FY16E
FY17E
FY16E
FY17E
FY16E
FY17E
FY16E
FY17E
Capital Goods
Voltas
Buy
330
407
10,923
5,857
6,511
7.5
7.9
11.7
12.9
28.2
25.6
4.6
4.0
17.1
16.7
1.9
1.7
BGR Energy
Neutral
117
-
844
3,615
3,181
9.5
9.4
16.7
12.4
7.0
9.4
0.7
0.7
10.0
7.0
0.6
0.8
BHEL
Neutral
123
-
29,995
33,722
35,272
10.8
11.7
10.5
14.2
11.7
8.6
0.9
0.8
7.0
9.0
1.0
0.9
Blue Star
Accumulate
433
495
3,894
3,770
4,351
5.7
6.4
11.4
17.2
37.9
25.2
5.9
5.5
18.4
23.1
1.1
1.0
Crompton Greaves
Neutral
74
-
4,666
13,484
14,687
4.9
6.2
4.5
7.1
16.5
10.5
1.2
1.1
7.2
10.8
0.5
0.4
Greaves Cotton
Neutral
139
-
3,390
1,655
1,755
16.6
16.8
7.4
7.8
18.8
17.8
3.8
3.6
21.1
20.6
2.0
1.9
Inox Wind
Buy
245
286
5,431
4,406
5,605
15.5
15.7
20.4
24.8
12.0
9.9
2.8
2.0
27.9
25.9
1.4
1.1
KEC International
Neutral
136
-
3,491
8,791
9,716
6.1
6.8
5.4
8.2
25.2
16.6
2.5
2.3
10.0
14.0
0.6
0.6
Thermax
Neutral
801
-
9,547
6,413
7,525
7.4
8.5
30.5
39.3
26.3
20.4
4.1
3.5
15.0
17.0
1.5
1.2
VATech Wabag
Neutral
607
-
3,306
2,722
3,336
7.9
8.1
19.5
24.6
31.1
24.7
3.3
2.9
11.1
12.4
1.3
1.1
Cement
ACC
Neutral
1,559
-
29,262
13,151
14,757
16.4
18.3
63.9
83.4
24.4
18.7
3.1
2.9
13.3
16.1
2.1
1.8
Ambuja Cements
Neutral
238
-
36,912
11,564
12,556
19.4
20.7
8.9
10.1
26.7
23.6
3.4
3.2
12.8
13.8
2.8
2.5
HeidelbergCement
Neutral
109
-
2,468
1,772
1,926
13.3
15.4
1.0
3.0
108.9
36.3
2.8
2.6
2.6
7.9
2.0
1.7
India Cements
Neutral
103
-
3,170
4,216
4,840
18.0
19.5
4.0
9.9
25.8
10.4
1.0
1.0
4.0
9.5
1.0
0.8
JK Cement
Neutral
631
-
4,413
3,661
4,742
10.1
15.8
7.5
28.5
84.2
22.1
2.5
2.2
7.5
22.9
1.7
1.2
J K Lakshmi Cement
Neutral
374
-
4,405
2,947
3,616
16.7
19.9
11.5
27.2
32.6
13.8
3.1
2.7
9.8
20.8
1.8
1.5
Mangalam Cements
Neutral
288
-
768
1,053
1,347
10.5
13.3
8.4
26.0
34.3
11.1
1.4
1.3
4.3
12.5
1.1
0.8
Orient Cement
Neutral
166
-
3,394
1,854
2,524
21.2
22.2
7.7
11.1
21.5
14.9
3.1
2.7
13.3
15.7
2.6
1.8
Ramco Cements
Neutral
542
-
12,901
4,036
4,545
20.8
21.3
15.1
18.8
35.9
28.8
4.4
3.9
12.9
14.3
3.6
3.1
Shree Cement^
Neutral
13,450
-
46,857
7,150
8,742
26.7
28.6
228.0
345.5
59.0
38.9
8.7
7.3
15.7
20.3
6.4
5.1
UltraTech Cement
Neutral
3,361
-
92,232
24,669
29,265
18.2
20.6
82.0
120.0
41.0
28.0
4.4
3.9
11.3
14.7
3.8
3.2
Construction
ITNL
Buy
77
93
2,545
7,360
8,682
34.0
32.2
7.0
8.6
11.1
9.0
0.4
0.4
3.2
2.5
3.7
3.5
KNR Constructions
Accumulate
562
603
1,581
937
1,470
14.3
14.0
44.2
38.6
12.7
14.6
2.5
2.2
15.4
15.4
1.8
1.2
Larsen & Toubro
Accumulate
1,510
1,700
140,729
58,870
65,708
8.3
10.3
42.0
53.0
36.0
28.5
2.5
2.3
8.8
11.2
2.6
2.3
Gujarat Pipavav Port
Neutral
156
-
7,525
629
684
51.0
52.2
6.4
5.9
24.3
26.4
3.2
2.9
15.9
12.7
11.8
10.6
MBL Infrastructures
Buy
118
285
487
2,313
2,797
12.2
14.6
19.0
20.0
6.2
5.9
0.6
0.6
11.3
10.6
0.9
0.8
Nagarjuna Const.
Neutral
75
-
4,181
7,892
8,842
8.8
9.1
3.0
5.3
25.1
14.2
1.3
1.2
5.0
8.5
0.8
0.6
PNC Infratech
Buy
551
647
2,826
1,873
2,288
13.2
13.5
24.0
32.0
23.0
17.2
2.2
2.0
12.1
12.3
1.6
1.4
Simplex Infra
Neutral
273
-
1,350
5,955
6,829
10.3
10.5
16.0
31.0
17.1
8.8
0.9
0.8
5.3
9.9
0.7
0.6
Stock Watch
June 16, 2016
Company Name
Reco
CMP
Target
Mkt Cap
Sales ( Čcr )
OPM(%)
EPS (Č)
PER(x)
P/BV(x)
RoE(%)
EV/Sales(x)
(Č)
Price ( Č)
( Č cr )
FY16E
FY17E
FY16E
FY17E
FY16E
FY17E
FY16E
FY17E
FY16E
FY17E
FY16E
FY17E
FY16E
FY17E
Construction
Power Mech Projects
Neutral
567
-
835
1,539
1,801
12.8
12.7
59.0
72.1
9.6
7.9
1.5
1.2
18.6
16.8
0.6
0.5
Sadbhav Engineering
Neutral
291
-
4,991
3,186
3,598
10.2
10.3
8.0
9.0
36.4
32.3
3.4
3.0
9.4
9.9
1.9
1.7
NBCC
Buy
184
220
11,031
5,838
7,428
6.0
7.9
5.2
8.2
35.4
22.4
1.1
0.9
21.9
28.2
1.7
1.2
MEP Infra
Neutral
38
-
611
1,956
1,876
28.1
30.5
1.3
3.0
28.9
12.5
6.1
4.1
21.2
32.8
1.7
1.7
SIPL
Neutral
101
-
3,566
675
1,042
62.4
64.7
-
-
3.8
4.3
-
-
17.0
11.5
Engineers India
Neutral
197
-
6,633
1,667
1,725
13.5
16.0
9.7
11.4
20.3
17.3
2.4
2.3
11.7
13.4
2.7
2.7
Financials
Allahabad Bank
Neutral
54
-
3,912
8,569
9,392
2.8
2.9
16.3
27.5
3.3
2.0
0.3
0.2
7.6
11.9
-
-
Axis Bank
Neutral
529
-
126,109
26,204
29,738
3.6
3.5
34.5
35.4
15.3
14.9
2.4
2.1
16.8
14.9
-
-
Bank of Baroda
Neutral
152
-
34,966
18,802
21,088
2.0
2.2
(7.4)
13.0
11.7
1.2
1.0
(4.2)
7.3
-
-
Bank of India
Neutral
91
-
8,532
15,972
17,271
1.9
2.0
15.3
33.4
6.0
2.7
0.3
0.2
3.6
7.6
-
-
Canara Bank
Neutral
199
-
10,816
15,441
16,945
2.0
2.1
46.6
70.4
4.3
2.8
0.4
0.3
8.0
11.2
-
-
Dena Bank
Neutral
31
-
2,088
3,440
3,840
2.1
2.3
7.3
10.0
4.3
3.1
0.3
0.3
6.1
7.9
-
-
Dewan Housing Finance Buy
206
270
6,020
1,828
2,225
2.9
3.0
24.9
29.7
8.3
7.0
1.3
1.1
15.1
16.1
-
-
Equitas Holdings
Buy
172
235
5,772
679
1,076
12.4
11.7
6.2
6.7
27.8
25.7
3.5
2.5
13.3
12.5
-
-
Federal Bank
Neutral
59
-
10,163
3,279
3,787
2.8
2.9
3.9
5.5
15.0
10.7
1.2
1.1
8.4
10.8
-
-
HDFC
Neutral
1,206
-
190,573
10,358
11,852
3.3
3.3
41.1
47.0
29.4
25.6
5.6
5.1
24.7
24.9
-
-
HDFC Bank
Accumulate
1,169
1,262
296,036
38,606
47,696
4.4
4.5
48.8
61.4
24.0
19.1
4.1
3.5
18.7
20.0
-
-
ICICI Bank
Neutral
248
-
144,447
34,279
39,262
3.3
3.3
21.0
24.4
11.8
10.2
2.0
1.7
14.4
14.7
-
-
IDBI Bank
Neutral
71
-
14,566
9,625
10,455
1.8
1.8
8.5
14.2
8.3
5.0
0.5
0.5
5.9
9.3
-
-
Indian Bank
Neutral
119
-
5,691
6,160
6,858
2.5
2.5
24.5
29.8
4.8
4.0
0.4
0.3
7.7
8.6
-
-
LIC Housing Finance
Buy
477
592
24,088
3,179
3,758
2.6
2.6
32.9
40.6
14.5
11.8
2.7
2.3
19.6
20.7
-
-
Oriental Bank
Neutral
93
-
3,216
7,643
8,373
2.4
2.4
37.2
45.4
2.5
2.1
0.2
0.2
8.2
9.4
-
-
Punjab Natl.Bank
Neutral
90
-
17,751
23,122
26,022
2.8
2.8
7.0
21.6
12.9
4.2
0.7
0.6
3.4
10.0
-
-
South Ind.Bank
Neutral
21
-
2,775
1,965
2,185
2.5
2.5
2.5
3.3
8.3
6.2
0.8
0.7
9.5
11.7
-
-
St Bk of India
Neutral
216
-
167,404
79,958
86,061
2.6
2.6
13.4
20.7
16.1
10.4
1.3
1.2
11.5
12.8
-
-
Union Bank
Neutral
124
-
8,545
12,646
14,129
2.3
2.4
31.0
39.1
4.0
3.2
0.4
0.4
9.8
11.4
-
-
Vijaya Bank
Neutral
33
-
3,316
3,536
3,827
1.9
1.9
5.5
6.7
6.0
5.0
0.5
0.4
7.8
8.8
-
-
Yes Bank
Neutral
1,071
-
45,066
7,190
9,011
3.2
3.3
58.2
69.7
18.4
15.4
3.3
2.8
19.2
19.6
-
-
FMCG
Asian Paints
Neutral
998
-
95,762
15,534
17,445
17.7
16.8
18.4
19.6
54.4
50.9
19.2
18.1
34.6
35.6
6.0
5.3
Stock Watch
June 16, 2016
Company Name
Reco
CMP
Target
Mkt Cap
Sales ( Čcr )
OPM(%)
EPS (Č)
PER(x)
P/BV(x)
RoE(%)
EV/Sales(x)
(Č)
Price ( Č)
( Č cr )
FY16E FY17E
FY16E
FY17E
FY16E
FY17E
FY16E
FY17E
FY16E
FY17E
FY16E
FY17E
FY16E
FY17E
FMCG
Britannia
Neutral
2,683
-
32,188
8,481
9,795
14.0
14.1
65.5
78.3
41.0
34.3
19.4
15.9
38.3
41.2
3.8
3.3
Colgate
Neutral
859
-
23,370
4,136
4,632
22.5
23.3
22.2
25.3
38.7
34.0
23.5
21.0
68.6
67.5
5.6
5.0
Dabur India
Neutral
312
-
54,797
9,370
10,265
17.6
17.3
7.3
8.1
42.5
38.5
11.0
10.1
31.7
30.6
5.5
5.0
GlaxoSmith Con*
Accumulate
5,588
6,118
23,499
4,519
5,142
19.6
19.8
164.3
191.2
34.0
29.2
9.4
8.0
30.8
29.9
4.7
4.1
Godrej Consumer
Neutral
1,482
-
50,477
9,003
10,335
18.1
18.7
34.1
41.8
43.5
35.5
9.4
8.1
23.9
24.8
5.9
5.1
HUL
Neutral
875
-
189,337
33,299
35,497
17.1
17.1
18.9
20.0
46.3
43.7
40.6
35.3
87.6
80.8
5.5
5.1
ITC
Accumulate
360
380
289,418
36,837
39,726
38.8
38.7
12.2
13.5
29.4
26.7
8.2
7.2
27.8
26.9
7.2
6.6
Marico
Neutral
252
-
32,545
6,151
6,966
17.2
17.3
5.4
6.4
46.7
39.4
14.7
11.6
33.2
32.4
5.2
4.6
Nestle*
Neutral
6,483
-
62,504
9,393
10,507
22.2
22.3
106.8
121.8
60.7
53.2
21.3
19.2
34.8
36.7
6.5
5.8
Tata Global
Accumulate
127
137
8,015
8,635
9,072
9.8
9.9
5.8
7.2
21.9
17.6
1.9
1.9
6.8
7.4
0.9
0.9
Procter & Gamble
Buy
6,177
7,369
20,050
2,588
2,939
23.3
23.2
130.2
146.2
47.4
42.3
94.6
90.7
27.6
25.3
7.4
6.5
Hygiene
IT
HCL Tech^
Buy
755
1,000
106,518
37,061
30,781
21.5
20.5
51.4
40.0
14.7
18.9
3.8
2.8
20.1
20.3
2.6
2.8
Infosys
Buy
1,189
1,374
273,153
62,441
70,558
27.5
27.5
59.0
65.3
20.2
18.2
4.0
3.7
22.2
22.4
3.8
3.3
TCS
Buy
2,556
3,004
503,582
108,646
122,770
28.3
28.3
123.7
141.0
20.7
18.1
6.8
6.3
33.1
34.6
4.2
3.6
Tech Mahindra
Buy
540
700
52,364
26,494
30,347
16.3
17.0
32.2
37.5
16.8
14.4
3.6
3.1
21.7
21.8
1.7
1.5
Wipro
Buy
547
680
135,049
50,808
56,189
23.7
23.8
37.3
40.7
14.7
13.4
2.8
2.6
19.2
17.7
2.1
1.8
Media
D B Corp
Neutral
374
-
6,873
2,025
2,187
27.4
27.4
17.4
18.9
21.5
19.8
4.8
4.4
22.9
23.7
3.4
3.1
HT Media
Neutral
80
-
1,859
2,495
2,673
12.9
13.2
6.8
7.2
11.7
11.1
0.9
0.9
7.5
7.8
0.3
0.3
Jagran Prakashan
Buy
171
205
5,593
2,107
2,355
33.5
28.0
10.1
10.8
17.0
15.8
4.0
3.4
23.3
21.7
2.7
2.4
Sun TV Network
Neutral
381
-
15,007
2,510
2,763
71.8
71.5
21.9
24.8
17.4
15.4
4.1
3.7
22.8
24.3
5.3
4.8
Hindustan Media
Neutral
275
-
2,018
914
1,016
21.7
21.5
21.9
23.3
12.6
11.8
2.3
1.9
18.0
16.2
1.6
1.4
Ventures
Metals & Mining
Coal India
Buy
310
380
195,523
76,167
84,130
19.9
22.3
22.4
25.8
13.8
12.0
5.0
4.9
35.5
41.0
1.9
1.7
Hind. Zinc
Neutral
175
-
73,774
14,641
14,026
50.4
50.4
17.7
16.0
9.9
10.9
1.5
1.4
16.2
13.2
2.6
2.5
Hindalco
Neutral
116
-
23,892
104,356
111,186
8.7
9.5
6.7
11.1
17.2
10.5
0.6
0.6
3.5
5.9
0.8
0.7
JSW Steel
Neutral
1,400
-
33,847
42,308
45,147
16.4
20.7
(10.3)
49.5
28.3
1.6
1.5
(1.0)
5.6
1.9
1.7
NMDC
Neutral
92
-
36,356
8,237
10,893
46.6
44.5
10.0
11.7
9.2
7.9
1.0
0.9
12.5
13.0
4.2
3.2
SAIL
Neutral
45
-
18,462
45,915
53,954
7.2
10.5
1.5
4.4
29.7
10.2
0.4
0.4
2.3
4.1
1.1
0.9
Vedanta
Neutral
120
-
35,487
71,445
81,910
26.2
26.3
12.9
19.2
9.3
6.2
0.6
0.6
7.2
8.9
0.9
0.7
Tata Steel
Neutral
330
-
32,040
126,760
137,307
8.9
11.3
6.4
23.1
51.9
14.3
1.0
1.0
2.0
7.1
0.8
0.8
Stock Watch
June 16, 2016
Company Name
Reco
CMP
Target
Mkt Cap
Sales ( Čcr )
OPM(%)
EPS (Č)
PER(x)
P/BV(x)
RoE(%)
EV/Sales(x)
(Č)
Price ( Č)
( Č cr )
FY16E FY17E
FY16E
FY17E
FY16E
FY17E
FY16E
FY17E
FY16E
FY17E
FY16E
FY17E
FY16E
FY17E
Oil & Gas
Cairn India
Neutral
140
-
26,304
11,323
12,490
49.4
51.0
20.7
20.7
6.8
6.8
0.4
0.4
6.4
6.1
1.5
0.8
GAIL
Neutral
378
-
47,980
64,856
70,933
9.1
9.6
24.0
28.9
15.8
13.1
1.4
1.3
8.8
9.6
0.9
0.8
ONGC
Neutral
214
-
182,831
154,564
145,998
36.8
37.4
20.8
22.6
10.3
9.5
1.0
0.9
10.1
9.7
1.4
1.6
Petronet LNG
Neutral
279
-
20,948
29,691
31,188
5.8
6.2
12.8
13.4
21.9
20.8
3.3
2.9
15.8
14.8
0.8
0.7
Indian Oil Corp
Accumulate
417
455
101,343
359,607
402,760
5.9
6.1
42.5
48.7
9.8
8.6
1.3
1.2
14.1
14.4
0.4
0.3
Reliance Industries
Buy
982
1,150
318,538
304,775
344,392
12.6
13.4
91.3
102.6
10.8
9.6
1.2
1.1
11.8
12.0
1.0
0.8
Pharmaceuticals
Alembic Pharma
Neutral
545
-
10,265
3,145
3,483
31.9
16.2
38.2
18.7
14.3
29.1
6.4
5.4
57.9
20.1
3.3
3.0
Aurobindo Pharma
Neutral
742
-
43,443
13,651
15,702
21.7
21.7
33.9
38.4
21.9
19.3
6.2
4.8
32.5
27.7
3.4
3.0
Aventis*
Accumulate
4,212
4,738
9,701
2,049
2,375
15.4
17.3
115.4
153.5
36.5
27.4
6.0
4.7
19.3
25.8
4.5
3.8
Cadila Healthcare
Buy
319
400
32,647
9,469
11,246
21.2
22.0
14.9
17.1
21.4
18.7
6.1
4.8
28.8
26.6
3.4
2.8
Cipla
Neutral
489
-
39,314
13,372
15,378
16.4
17.4
19.6
18.8
25.0
26.0
3.3
2.9
13.1
13.8
2.9
2.8
Dr Reddy's
Accumulate
3,085
3,476
52,613
15,471
17,479
24.6
24.6
138.2
152.4
22.3
20.2
4.1
3.5
19.7
18.7
3.3
2.9
Dishman Pharma
Neutral
141
-
2,272
1,733
1,906
21.5
21.5
10.1
10.0
13.9
14.1
1.6
1.5
10.5
11.2
1.9
1.6
GSK Pharma*
Neutral
3,483
-
29,502
2,870
3,158
20.0
22.1
59.5
68.3
58.5
51.0
17.3
17.7
28.5
34.3
9.8
8.9
Indoco Remedies
Neutral
281
-
2,585
1,033
1,199
15.9
18.2
9.4
13.6
29.8
20.6
4.4
3.8
15.7
19.7
2.6
2.3
Ipca labs
Buy
469
750
5,921
3,363
3,909
12.9
18.6
13.4
28.0
35.0
16.8
2.5
2.2
7.4
14.0
2.0
1.7
Lupin
Buy
1,463
1,809
65,930
13,702
15,912
23.7
26.4
50.5
58.1
29.0
25.2
6.0
4.9
22.9
21.4
5.2
4.1
Sun Pharma
Buy
752
950
180,899
28,163
32,610
25.8
30.7
17.4
26.9
43.2
27.9
4.1
3.6
13.0
16.6
5.8
4.8
Power
Tata Power
Neutral
77
-
20,704
35,923
37,402
22.6
22.8
4.1
5.2
18.9
14.9
1.5
1.4
7.5
9.3
1.5
1.4
NTPC
Neutral
154
-
126,939
87,271
99,297
23.5
23.5
11.8
13.3
13.1
11.6
1.5
1.4
11.5
12.2
2.5
2.2
Power Grid
Accumulate
155
170
80,854
20,702
23,361
86.7
86.4
12.1
13.2
12.8
11.7
1.9
1.7
15.6
15.1
8.8
8.2
Real Estate
MLIFE
Buy
457
554
1,874
826
1,011
20.1
21.9
22.7
30.7
20.1
14.9
1.2
1.1
6.0
7.4
4.1
3.1
Telecom
Bharti Airtel
Neutral
352
-
140,629
101,748
109,191
32.1
31.7
12.0
12.5
29.3
28.1
2.0
1.9
6.9
6.7
2.0
1.8
Idea Cellular
Neutral
101
-
36,186
34,282
36,941
32.0
31.5
5.9
6.2
17.0
16.2
1.6
1.4
9.9
9.3
1.7
1.6
zOthers
Abbott India
Neutral
4,462
-
9,481
2,715
3,153
14.5
14.1
134.3
152.2
33.2
29.3
8.3
6.8
27.4
25.6
3.2
2.7
Bajaj Electricals
Buy
230
268
2,328
4,612
5,351
5.6
5.7
23.4
18.0
9.8
12.8
3.0
2.7
12.5
14.4
0.5
0.4
Finolex Cables
Neutral
351
-
5,374
2,520
2,883
12.2
12.0
12.7
14.2
27.7
24.7
3.8
3.4
13.6
13.5
1.9
1.6
Goodyear India*
Buy
512
631
1,182
1,800
1,600
11.7
11.5
58.7
52.9
8.7
9.7
2.0
1.7
24.6
18.7
0.4
0.4
Hitachi
Neutral
1,273
-
3,461
1,779
2,081
7.8
8.8
21.8
33.4
58.4
38.1
9.4
7.6
17.4
22.1
2.0
1.7
Stock Watch
June 16, 2016
Company Name
Reco
CMP
Target
Mkt Cap
Sales ( Čcr )
OPM(%)
EPS (Č)
PER(x)
P/BV(x)
RoE(%)
EV/Sales(x)
(Č)
Price ( Č)
( Č cr )
FY16E
FY17E
FY16E
FY17E
FY16E
FY17E
FY16E
FY17E
FY16E
FY17E
FY16E
FY17E
FY16E
FY17E
zOthers
Jyothy Laboratories
Neutral
292
-
5,296
1,620
1,847
11.5
11.5
7.3
8.5
40.1
34.5
5.2
4.8
13.3
14.4
3.1
2.6
MRF
Buy
31,659
45,575
13,427
20,316
14,488
21.4
21.1
5,488.0
3,798.0
5.8
8.3
2.0
1.6
41.1
21.2
0.6
0.8
Page Industries
Neutral
13,441
-
14,992
1,929
2,450
19.8
20.1
229.9
299.0
58.5
45.0
25.8
17.9
52.1
47.1
7.9
6.2
Relaxo Footwears
Neutral
469
-
5,628
1,767
2,152
12.3
12.5
19.3
25.1
24.4
18.7
6.0
4.6
27.7
27.8
3.2
2.6
Siyaram Silk Mills
Buy
1,018
1,347
955
1,619
1,799
11.6
11.6
93.5
104.9
10.9
9.7
1.9
1.6
17.1
16.4
0.8
0.8
Styrolution ABS India* Neutral
629
-
1,106
1,271
1,440
8.6
9.2
32.0
41.1
19.6
15.3
2.0
1.8
10.7
12.4
0.8
0.7
TVS Srichakra
Buy
2,344
2,932
1,795
2,035
2,252
15.9
15.3
248.6
268.1
9.4
8.7
4.1
3.0
43.6
33.9
0.9
0.8
HSIL
Buy
261
310
1,884
2,123
2,384
16.1
16.5
15.0
18.9
17.3
13.8
1.3
1.3
8.0
9.4
1.2
1.1
Kirloskar Engines India
Neutral
260
-
3,764
2,403
2,554
8.6
9.9
9.2
10.5
28.3
24.8
2.7
2.6
9.7
10.7
1.2
1.1
Ltd
M M Forgings
Buy
434
546
524
511
615
21.7
21.6
43.1
55.8
10.1
7.8
1.8
1.5
19.9
21.2
1.3
0.9
Banco Products (India) Neutral
144
-
1,031
1,208
1,353
11.0
12.3
10.8
14.5
13.4
10.0
1.5
1.4
11.9
14.5
0.8
0.7
Competent Automobiles Neutral
141
-
86
1,040
1,137
3.2
3.1
25.7
28.0
5.5
5.0
0.8
0.7
15.0
14.3
0.1
0.1
Nilkamal
Neutral
1,177
-
1,757
1,871
2,031
10.7
10.5
63.2
69.8
18.6
16.9
3.0
2.6
17.6
16.6
1.0
0.9
Visaka Industries
Neutral
154
-
245
1,020
1,120
8.7
9.1
13.9
20.1
11.1
7.7
0.7
0.7
6.4
8.7
0.5
0.4
Transport Corporation of
Neutral
309
-
2,366
2,830
3,350
8.8
9.0
14.4
18.3
21.5
16.9
3.3
2.9
15.4
17.1
0.9
0.8
India
Elecon Engineering
Neutral
63
-
685
1,359
1,482
10.3
13.7
0.8
3.9
78.3
16.2
1.3
1.2
1.6
7.8
0.8
0.8
Surya Roshni
Buy
164
201
718
2,992
3,223
8.1
8.4
14.7
18.3
11.2
8.9
1.0
0.9
9.7
11.0
0.5
0.5
MT Educare
Neutral
171
-
680
286
366
18.3
17.7
7.7
9.4
22.1
18.2
4.7
4.1
20.2
21.1
2.4
1.8
Radico Khaitan
Buy
91
125
1,212
1,543
1,659
12.6
13.0
5.8
6.3
15.8
14.4
1.3
1.2
8.5
8.6
1.3
1.2
Garware Wall Ropes
Buy
340
460
744
828
898
11.2
10.3
28.3
29.0
12.0
11.7
2.0
1.7
16.8
14.9
0.8
0.8
Wonderla Holidays
Neutral
398
-
2,247
206
308
44.0
43.6
9.0
12.9
44.2
30.8
6.0
5.5
13.7
17.8
10.7
7.1
Linc Pen & Plastics
Accumulate
212
235
313
344
382
9.1
9.1
12.4
13.1
17.1
16.2
3.1
2.7
18.0
16.7
1.0
0.9
The Byke Hospitality
Neutral
165
-
662
222
287
20.5
20.5
5.6
7.6
29.3
21.9
5.5
4.5
18.9
20.8
3.1
2.4
Interglobe Aviation
Neutral
1,011
-
36,446
17,022
21,122
20.7
14.5
63.9
53.7
15.8
18.8
23.7
19.4
149.9
103.2
2.1
1.7
Coffee Day Enterprises
Neutral
253
-
5,212
2,692
2,964
17.0
18.6
-
4.7
-
53.4
3.1
2.9
0.2
5.5
2.4
2.2
Ltd
Navneet Education
Neutral
91
-
2,157
998
1,062
24.1
24.0
5.8
6.1
15.7
14.9
3.5
3.1
22.0
20.6
2.2
2.1
Navkar Corporation
Buy
199
265
2,838
347
408
43.2
42.9
6.7
6.8
29.8
29.4
2.2
2.0
7.3
6.9
8.6
7.9
UFO Moviez
Neutral
526
-
1,452
558
619
32.0
33.2
22.5
30.0
23.4
17.6
2.8
2.4
12.0
13.8
2.5
2.1
VRL Logistics
Neutral
301
-
2,742
1,725
1,902
16.5
16.7
12.2
14.6
24.7
20.6
5.1
4.5
20.8
21.9
1.8
1.6
Stock Watch
June 16, 2016
Company Name
Reco
CMP
Target Mkt Cap
Sales ( Čcr )
OPM(%)
EPS (Č)
PER(x)
P/BV(x)
RoE(%)
EV/Sales(x)
(Č)
Price ( Č)
( Č cr )
FY16E FY17E FY16E FY17E FY16E FY17E FY16E FY17E FY16E FY17E FY16E FY17E FY16E FY17E
zOthers
Team Lease Serv.
Neutral
908
-
1,552
2,565
3,229
1.3
1.5
15.2
22.8
59.8
39.9
4.8
4.3
8.0
10.7
0.5
0.4
S H Kelkar & Co.
Neutral
213
-
3,075
928
1,036
15.3
15.1
4.9
6.1
43.1
34.8
4.0
3.7
9.4
10.7
3.4
3.0
Quick Heal
Neutral
261
-
1,831
339
408
27.8
27.3
7.1
7.7
37.0
33.8
3.1
3.1
8.5
9.3
4.0
3.4
Narayana Hrudaya
Neutral
319
-
6,514
1,603
1,873
10.9
11.5
1.0
2.6
334.6
120.5
8.1
7.4
2.4
6.1
4.2
3.6
Manpasand Bever.
Neutral
540
-
2,703
540
836
19.9
19.6
10.2
16.9
52.7
32.0
4.3
3.8
8.1
12.0
4.7
3.0
Source: Company, Angel Research; Note: *December year end; #September year end; &October year end; Price as on June 15, 2016
Market Outlook
June 16, 2016
Research Team Tel: 022 - 39357800
DISCLAIMER
Angel Broking Private Limited (hereinafter referred to as “Angel”) is a registered Member of National Stock Exchange of India Limited,
Bombay Stock Exchange Limited and Metropolitian Stock Exchange of India Limited. It is also registered as a Depository Participant with
CDSL and Portfolio Manager with SEBI. It also has registration with AMFI as a Mutual Fund Distributor. Angel Broking Private Limited is a
registered entity with SEBI for Research Analyst in terms of SEBI (Research Analyst) Regulations, 2014 vide registration number
INH000000164. Angel or its associates has not been debarred/ suspended by SEBI or any other regulatory authority for accessing
/dealing in securities Market. Angel or its associates including its relatives/analyst do not hold any financial interest/beneficial ownership
of more than 1% in the company covered by Analyst. Angel or its associates/analyst has not received any compensation / managed or co
-managed public offering of securities of the company covered by Analyst during the past twelve months. Angel/analyst has not served as
an officer, director or employee of company covered by Analyst and has not been engaged in market making activity of the company
covered by Analyst.
This document is solely for the personal information of the recipient, and must not be singularly used as the basis of any investment
decision. Nothing in this document should be construed as investment or financial advice. Each recipient of this document should make
such investigations as they deem necessary to arrive at an independent evaluation of an investment in the securities of the companies
referred to in this document (including the merits and risks involved), and should consult their own advisors to determine the merits and
risks of such an investment.
Reports based on technical and derivative analysis center on studying charts of a stock's price movement, outstanding positions and
trading volume, as opposed to focusing on a company's fundamentals and, as such, may not match with a report on a company's
fundamentals.
The information in this document has been printed on the basis of publicly available information, internal data and other reliable sources
believed to be true, but we do not represent that it is accurate or complete and it should not be relied on as such, as this document is for
general guidance only. Angel Broking Pvt. Limited or any of its affiliates/ group companies shall not be in any way responsible for any
loss or damage that may arise to any person from any inadvertent error in the information contained in this report. Angel Broking Pvt.
Limited has not independently verified all the information contained within this document. Accordingly, we cannot testify, nor make any
representation or warranty, express or implied, to the accuracy, contents or data contained within this document. While Angel Broking
Pvt. Limited endeavors to update on a reasonable basis the information discussed in this material, there may be regulatory, compliance,
or other reasons that prevent us from doing so.
This document is being supplied to you solely for your information, and its contents, information or data may not be reproduced,
redistributed or passed on, directly or indirectly.
Neither Angel Broking Pvt. Limited, nor its directors, employees or affiliates shall be liable for any loss or damage that may arise from or
in connection with the use of this information.
Note: Please refer to the important ‘Stock Holding Disclosure' report on the Angel website (Research Section). Also, please refer to the
latest update on respective stocks for the disclosure status in respect of those stocks. Angel Broking Pvt. Limited and its affiliates may have
investment positions in the stocks recommended in this report.