Market Outlook
March 16, 2016
Market Cues
Domestic Indices
Chg (%)
(Pts)
(Close)
Indian markets are expected to open flat tracking SGX Nifty.
BSE Sensex
(1.0)
(253)
24,551
Nifty
(1.0)
(78)
7,461
U.S. stocks closed mostly lower on Tuesday, weighed by fall in the oil prices and a
Mid Cap
(0.8)
(81)
10,222
string of lackluster economic data released, ahead of the Fed’s important decision
Small Cap
(0.6)
(64)
10,257
on interest rates. Dow was up 0.13%, buoyed by healthy advance in Applce Inc.
Bankex
0.4
63
17,450
Key European indices closed down between half and one % point as investors played
it safe ahead of Fed meeting. FTSE 100 dropped 0.5% on Tuesday after gains made
Global Indices
Chg (%)
(Pts)
(Close)
at the beginning of the week, as markets are anticipating George Osborne's budget,
to be presented in the House of Commons on Wednesday to raise taxes (especially
Dow Jones
0.1
22
17,252
expectations are strong that insurance premium tax would be increased). Despite the
Nasdaq
(0.5)
(22)
4,729
recent in-line full year results, Legal & General stock corrected by 6% on such
FTSE
(0.6)
(35)
6,140
concerns.
Nikkei
(0.7)
(117)
17,117
Fall in the global indices and oil prices, dragged the Indian equity benchmarks 1%
Hang Seng
(0.7)
(147)
20,289
on Tuesday ahead of the crucial Fed’s 2-day meeting. Pharma, FMCG and HDFC
Shanghai Com
0.2
5
2,864
group stocks were under pressure. Lupin topped selling list on Sensex, down 7.6%
after it said US health regulator cited 9 observations in Goa inspection last week.
Advances / Declines
BSE
NSE
News & Result Analysis
Advances
964
822
NCC signs definitive agreement to sell stake in NCCPL
Declines
1,699
735
Detailed analysis on Pg2
Unchanged
151
71
Investor’s Ready Reckoner
Volumes (` Cr)
Key Domestic & Global Indicators
BSE
2,369
Stock Watch: Latest investment recommendations on 150+ stocks
NSE
15,239
Refer Pg4 onwards
Top Picks
Net Inflows (` Cr)
Net
Mtd
Ytd
CMP
Target
Upside
Company
Sector
Rating
(`)
(`)
(%)
FII
1,260
11,265
(22,250)
Amara Raja Batteries Auto & Auto Ancillary
Buy
910
1,040
14.3
MFs
(527)
(3,089)
77,235
HCL Tech
IT
Buy
812
1,038
27.9
LIC Housing Finance Financials
Buy
454
592
30.3
Top Gainers
Price (`)
Chg (%)
Bharat Electronics
Capital Goods
Buy
1,063
1,414
33.0
Renuka
15
8.3
Navkar Corporation Others
Buy
166
265
59.4
Eidparry
202
6.3
More Top Picks on Pg3
Jklakshmi
306
5.0
Key Upcoming Events
Kec
122
4.4
Previous
Consensus
Date
Region
Event Description
Nationalum
41
4.4
Reading
Expectations
Mar 16 US
Housing Stats
1.099M
1.150M
Mar 16 GBP
Unemployment Rate (Jan)
5.1%
5.1%
Top Losers
Price (`)
Chg (%)
Mar 16 USD
Crude Oil Inventories
3.880M
Crompgreav
44
(71.7)
6.(
Lupin
1,727
(7.6)
Divislab
960
(5.1)
Jubilant
367
(4.6)
Torntpower
235
(4.4)
As on March 15, 2016
Market Outlook
March 16, 2016
NCC signs definitive agreement to sell stake in NCCPL
NCC Infrastructure Holdings (NCCIHL, subsidiary of NCC Ltd.) entered in to share
sale agreement with Sembcorp Utilities Pte Ltd (SCU), for 16% stake sale to
Sembcorp Gayatri Power Ltd. (formerly NCCPPL, NCC Power Projects Ltd.).
GEPVL and NCCIHL (subsidiaries of Gayatri Projects and NCC, respectively) jointly
own NPPL, which is implementing the `7,047cr 1,320MW coal fired power
project, at Krishnapatnam, A.P.
NCC is the EPC contractor for this power project, where 76% of the total project
work at site is finished (as of 3QFY2016) and by Jun-2016, entire project would
get finished. NCC has indicated a total investment of `472cr (for its share in the
power project) towards this power project. This transaction has been done at gross
consideration of ~`352cr (inc. interest), which translates the deal to be at 1x
Capital employed.
Given that NCC as a strategy has decided to exit Asset developer role and focus
on de-leveraging its balance sheet, this stake sale in the power project was
expected. Earlier as part of the strategy, NCC has signed definitive agreements to
sell its 38% stake in Bangalore Elevated Tollway Limited (BETL) and 100% stake in
Western UP Tollway Limited (WUTL).
As part of this transaction, NCC would receive the pending `200cr as the
transaction nears completion. Further, the company’s BS would see an increase in
liquidity of `200cr by 1Q-2QFY2016. On the back of these recent asset sales, we
expect the D/E ratio of the company to slightly decline from
1.0x (as of
2QFY2016) to 0.6x by 2QFY2017.
We maintain our Neutral rating on the stock.
Economic and Political News
Over Rs 1 lakh cr disbursed under MUDRA Yojana
Trade deficit narrows again; exports shrink
FPI allowed in Reits, AIFs, bad corporate bonds
Corporate News
Cairn Energy gets over `29,000cr tax demand
Tata Motors gets Pune workers to run Sanand plant
Bajaj may plan bike series on 'V'
Market Outlook
March 16, 2016
Top Picks ★★★★★
Large Cap
Market Cap
CMP
Target
Upside
Company
Rationale
(` Cr)
(`)
(`)
(%)
To outpace battery industry growth due to better technological
Amara Raja Batteries
15,541
910
1,040
14.3
products leading to market share gains in both the automotive
OEM and replacement segments.
Earnings to grow strongly given the MHCV cyclical upturn.
Ashok Leyland
27,264
96
111
15.9
Focus on exports and LCV's provides additional growth
avenue.
Uptick in defense capex by government when coupled with
Bharat Electronics
25,523
1,063
1,414
33.0
BELs strong market positioning, indicate that good times are
ahead for BEL.
The stock is trading at attractive valuations and is factoring all
HCL Tech
114,460
812
1,038
27.9
the bad news.
Strong visibility for a robust 20% earnings trajectory, coupled
HDFC Bank
259,518
1,027
1,262
22.9
with high quality of earnings on account of high quality retail
business and strategic focus on highly rated corporates.
Back on the growth trend, expect a long term growth of 14%
Infosys
261,405
1,134
1,347
18.7
to be a US$20bn in FY2020.
LICHF continues to grow its retail loan book at a healthy pace
with improvement in asset quality. We expect the company to
LIC Housing Finance
22,917
454
592
30.3
post a healthy loan book which is likely to reflect in a strong
earnings growth.
Huge bid pipeline of re-development works at Delhi and other
NBCC
11,015
918
1,089
18.6
State Governments and opportunity from Smart City, positions
NBCC to report strong growth, going forward.
New launches to enable outpace industry growth; margins
TVS Motors
13,585
286
330
15.4
expansion to boost earnings.
Source: Company, Angel Research
Mid Cap
Market Cap
CMP
Target
Upside
Company
Rationale
(` Cr)
(`)
(`)
(%)
Favourable outlook for the AC industry to augur well for
Cooling products business which is out pacing the market
Blue Star
3,104
345
439
27.2
growth. EMPPAC division's profitability to improve once
operating environment turns around.
Commencement of new projects, downtrend in the interest rate
IL&FS Transport
2,345
71
93
30.4
cycle, to lead to stock re-rating
Economic recovery to have favourable impact on advertising &
circulation revenue growth. Further, the acquisition of a radio
Jagran Prakashan
4,861
149
189
27.1
business (Radio City) would also boost the company's revenue
growth.
Speedier execution and speedier sales, strong revenue visibilty
Mahindra Lifespace
1,755
428
554
29.5
in short-to-long run, attractive valuations
Massive capacity expansion along with rail advantage at ICD
Navkar Corporation
2,371
166
265
59.4
as well CFS augurs well for the company
Earnings boost on back of stable material prices and
Radico Khaitan
1,293
97
156
60.5
favourable pricing environment. Valuation discount to peers
provides additional comfort
Strong brands and distribution network would boost growth
Siyaram Silk Mills
925
987
1,354
37.2
going ahead. Stock currently trades at an inexpensive
valuation.
Source: Company, Angel Research
Market Outlook
March 16, 2016
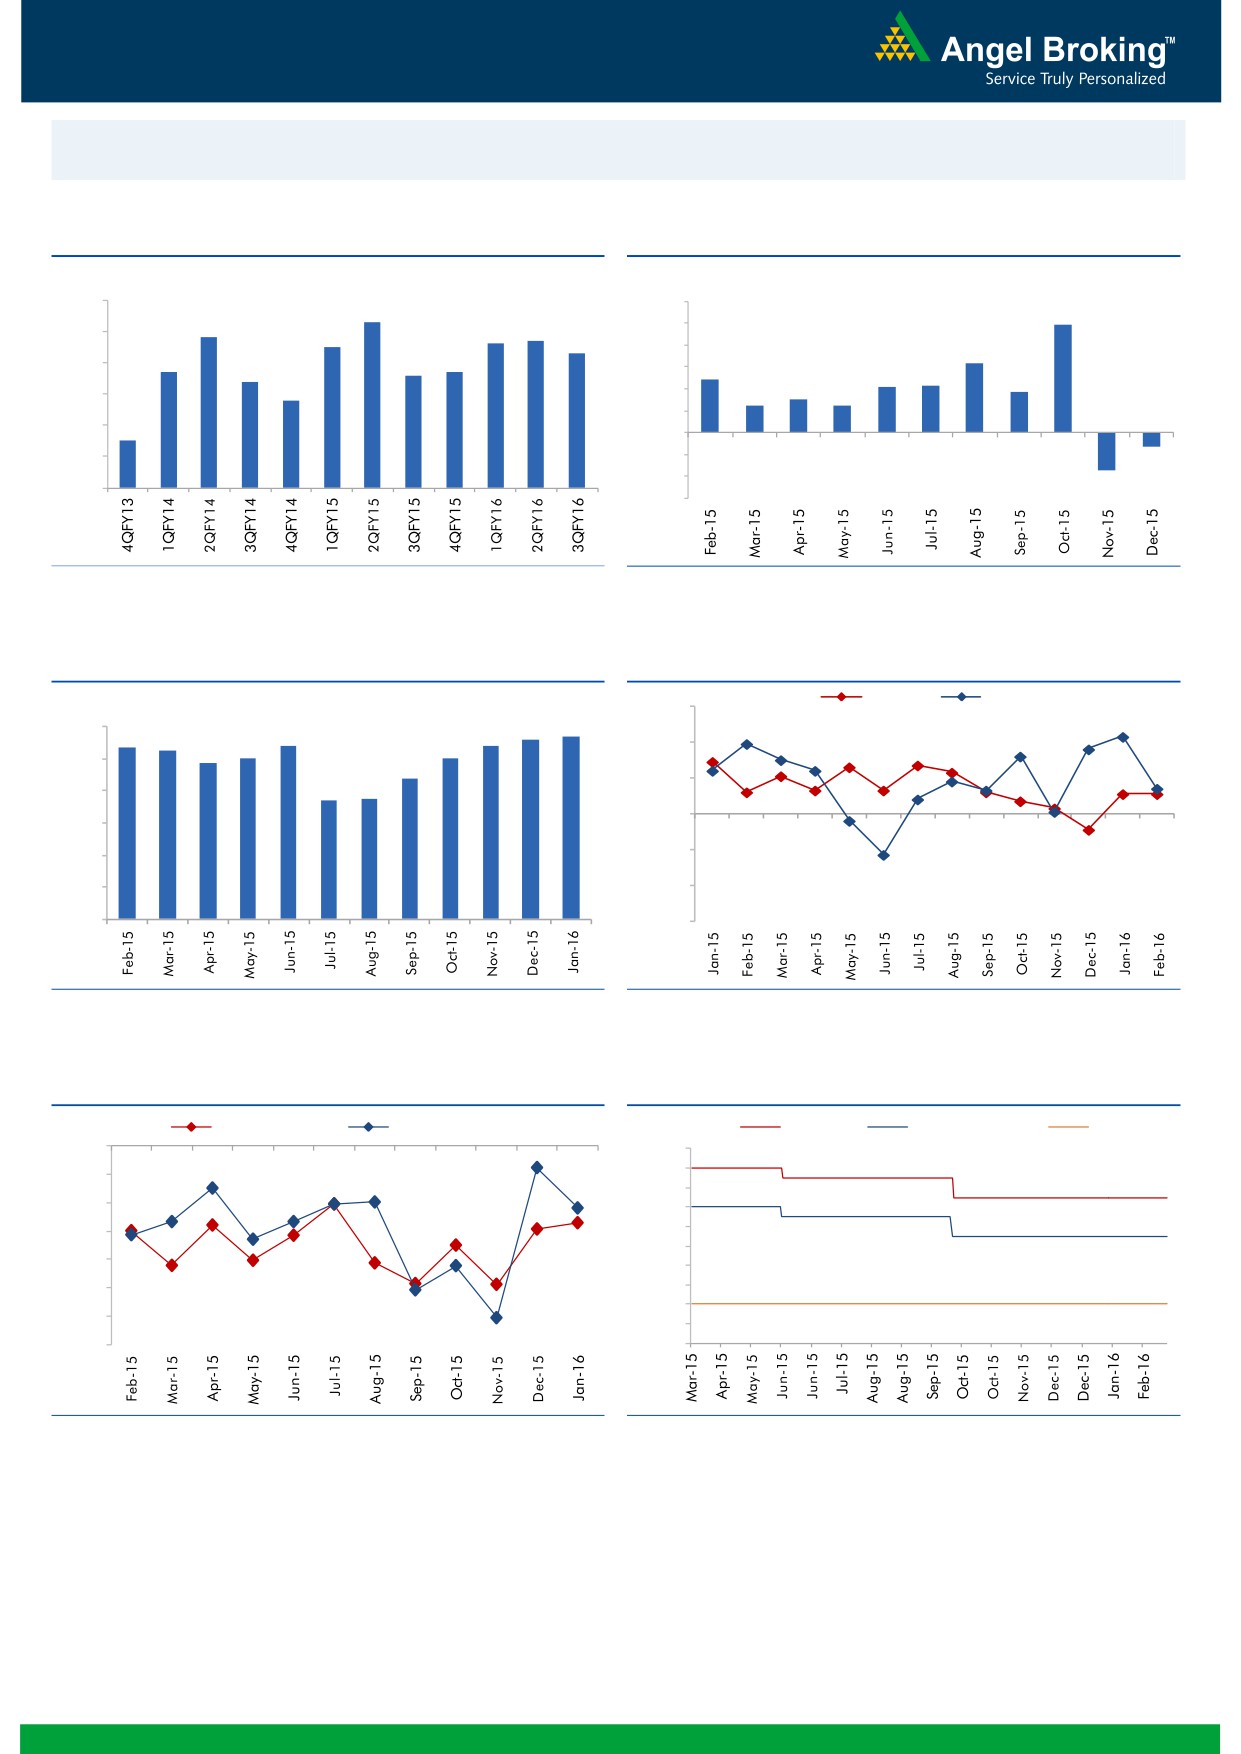
Macro watch
Exhibit 1: Quarterly GDP trends
Exhibit 2: IIP trends
(%)
(%)
9.0
12.0
8.3
9.9
7.8
7.6
7.7
10.0
8.0
7.5
7.3
8.0
6.3
6.7
6.6
6.7
7.0
6.4
4.8
6.0
4.2
4.3
3.7
5.8
3.0
4.0
2.5
2.5
6.0
2.0
5.0
4.5
-
4.0
(2.0)
(1.3)
(4.0)
3.0
(3.4)
(6.0)
Source: CSO, Angel Research
Source: MOSPI, Angel Research
Exhibit 3: Monthly CPI inflation trends
Exhibit 4: Manufacturing and services PMI
Mfg. PMI
Services PMI
(%)
56.0
5.6
5.7
6.0
5.4
5.4
5.4
5.3
4.9
5.0
5.0
54.0
5.0
4.4
3.7
3.7
52.0
4.0
50.0
3.0
48.0
2.0
1.0
46.0
-
44.0
Source: MOSPI, Angel Research
Source: Market, Angel Research; Note: Level above 50 indicates expansion
Exhibit 5: Exports and imports growth trends
Exhibit 6: Key policy rates
(%)
Exports yoy growth
Imports yoy growth
(%)
Repo rate
Reverse Repo rate
CRR
0.0
8.00
7.50
(5.0)
7.00
(10.0)
6.50
6.00
(15.0)
5.50
(20.0)
5.00
(25.0)
4.50
4.00
(30.0)
3.50
(35.0)
3.00
Source: Bloomberg, Angel Research
Source: RBI, Angel Research
Market Outlook
March 16, 2016
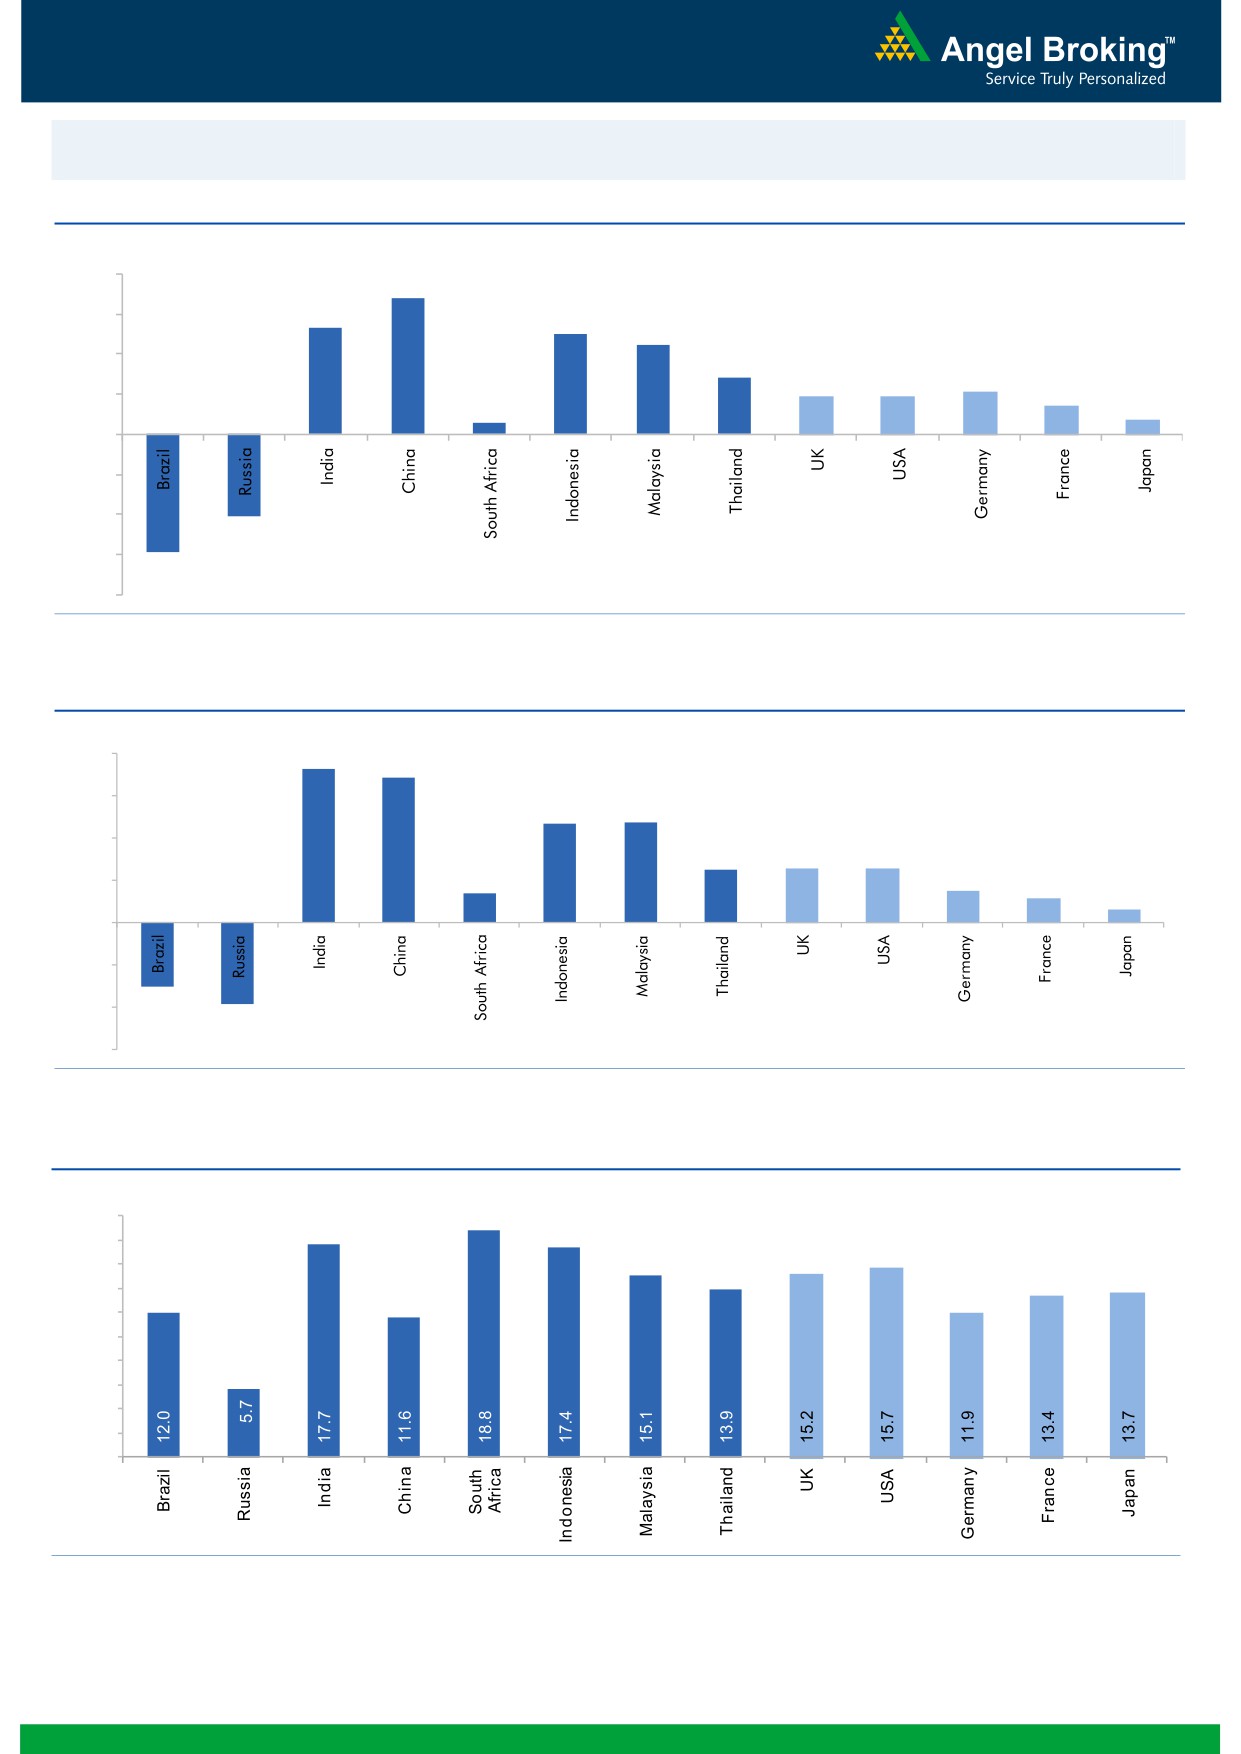
Global watch
Exhibit 1: Latest quarterly GDP Growth (%, yoy) across select developing and developed countries
(%)
8.0
6.8
6.0
5.3
5.0
4.5
4.0
2.8
1.9
1.9
2.1
1.4
2.0
0.6
0.7
-
(2.0)
(4.0)
(4.1)
(6.0)
(5.9)
(8.0)
Source: Bloomberg, Angel Research
Exhibit 2: 2015 GDP Growth projection by IMF (%, yoy) across select developing and developed countries
(%)
8.0
7.3
6.8
6.0
4.7
4.7
4.0
2.5
2.5
2.6
1.4
1.5
2.0
1.2
0.6
-
(2.0)
(3.0)
(4.0)
(3.8)
(6.0)
Source: IMF, Angel Research
Exhibit 3: One year forward P-E ratio across select developing and developed countries
(x)
20.0
18.0
16.0
14.0
12.0
10.0
8.0
6.0
4.0
2.0
-
Source: IMF, Angel Research
Market Outlook
March 16, 2016
Exhibit 4: Relative performance of indices across globe
Returns (%)
Country
Name of index
Closing price
1M
3M
1YR
Brazil
Bovespa
47,130
18.4
4.2
(5.7)
Russia
Micex
1,855
7.2
7.9
14.0
India
Nifty
7,461
6.9
(2.0)
(14.2)
China
Shanghai Composite
2,864
4.5
(17.4)
(13.1)
South Africa
Top 40
46,394
7.6
6.5
0.4
Mexico
Mexbol
44,210
4.2
5.3
1.0
Indonesia
LQ45
846
2.3
9.9
(10.8)
Malaysia
KLCI
1,691
2.9
1.1
(5.6)
Thailand
SET 50
889
10.5
8.6
(13.0)
USA
Dow Jones
17,252
10.2
(1.8)
(3.3)
UK
FTSE
6,140
7.6
3.1
(11.6)
Japan
Nikkei
17,117
14.5
(11.3)
(9.8)
Germany
DAX
9,934
10.8
(6.3)
(16.7)
France
CAC
4,473
12.0
(0.0)
(11.5)
Source: Bloomberg, Angel Research
Stock Watch
March 16, 2016
Company Name
Reco
CMP
Target
Mkt Cap
Sales ( Čcr )
OPM(%)
EPS (Č)
PER(x)
P/BV(x)
RoE(%)
EV/Sales(x)
(Č)
Price ( Č)
( Č cr )
FY16E FY17E
FY16E
FY17E
FY16E
FY17E
FY16E
FY17E
FY16E
FY17E
FY16E
FY17E
FY16E
FY17E
Agri / Agri Chemical
Rallis
Neutral
164
-
3,183
2,097
2,415
14.4
14.4
9.5
11.0
17.2
14.9
3.4
3.0
21.1
21.3
1.5
1.3
United Phosphorus
Accumulate
435
480
18,636
12,500
14,375
18.3
18.3
29.8
35.9
14.6
12.1
2.7
2.3
20.0
20.3
1.6
1.3
Auto & Auto Ancillary
Ashok Leyland
Accumulate
96
111
27,264
17,995
21,544
11.4
11.6
3.4
4.7
28.2
20.4
4.9
4.5
17.7
22.2
1.5
1.2
Bajaj Auto
Accumulate
2,278
2,585
65,931
22,709
25,860
20.9
20.1
129.0
143.6
17.7
15.9
5.4
4.7
30.7
29.4
2.5
2.2
Bharat Forge
Accumulate
806
875
18,762
7,351
8,318
19.9
19.7
31.2
36.5
25.8
22.1
4.6
3.9
19.3
19.2
2.7
2.4
Eicher Motors
Neutral
19,548
-
53,095
15,556
16,747
15.5
17.3
464.8
597.5
42.1
32.7
15.4
11.3
36.2
34.3
3.4
3.1
Gabriel India
Buy
85
101
1,222
1,415
1,544
8.7
9.0
4.6
5.4
18.5
15.8
3.4
3.0
18.1
18.9
0.9
0.8
Hero Motocorp
Neutral
2,813
-
56,171
28,244
30,532
15.5
15.9
156.7
168.5
18.0
16.7
7.2
6.1
39.9
36.4
1.8
1.7
Jamna Auto Industries Buy
131
160
1,050
1,281
1,473
11.2
11.5
7.6
9.2
17.3
14.3
4.4
3.6
25.4
25.2
0.9
0.8
L G Balakrishnan & Bros Neutral
426
-
668
1,254
1,394
11.6
11.8
35.9
41.7
11.9
10.2
1.6
1.4
13.5
13.8
0.6
0.6
Mahindra and Mahindra Accumulate
1,207
1,364
74,963
38,416
42,904
13.7
13.9
54.8
63.4
22.0
19.0
3.4
3.0
15.4
15.8
1.6
1.4
Maruti
Neutral
3,654
-
110,377
57,865
68,104
16.4
16.7
176.3
225.5
20.7
16.2
4.0
3.4
19.4
21.2
1.7
1.4
Minda Industries
Accumulate
911
1,047
1,446
2,523
2,890
8.7
9.0
55.0
65.4
16.6
13.9
3.2
2.6
19.3
18.7
0.7
0.6
Motherson Sumi
Buy
245
313
32,446
39,343
45,100
8.8
9.1
10.1
12.5
24.3
19.6
7.7
6.0
35.3
34.4
0.9
0.8
Rane Brake Lining
Buy
375
465
297
454
511
11.5
12.0
25.2
31.0
14.9
12.1
2.2
2.0
14.9
16.6
0.8
0.7
Setco Automotive
Neutral
33
-
436
594
741
12.7
13.7
1.7
3.2
19.2
10.2
2.0
1.7
10.4
16.9
1.1
0.9
Tata Motors
Neutral
361
-
104,127
259,686
273,957
13.0
13.4
25.9
29.5
13.9
12.2
1.8
1.6
8.0
9.0
0.6
0.6
TVS Motor
Accumulate
286
330
13,585
11,263
13,122
6.9
8.5
9.2
15.0
31.1
19.1
7.1
5.6
22.7
29.6
1.2
1.0
Amara Raja Batteries
Buy
910
1,040
15,541
4,892
5,871
17.4
17.6
28.8
37.1
31.6
24.5
7.4
5.9
23.4
24.1
3.1
2.5
Exide Industries
Buy
135
162
11,492
6,950
7,784
14.4
14.8
6.6
7.3
20.5
18.5
2.6
2.4
12.6
12.8
1.3
1.2
Apollo Tyres
Accumulate
169
183
8,597
12,056
12,714
17.2
16.4
23.0
20.3
7.3
8.3
1.3
1.1
17.7
13.6
0.8
0.8
Ceat
Accumulate
1,088
1,119
4,401
6,041
6,597
14.1
13.7
99.5
111.9
10.9
9.7
2.2
1.8
19.6
18.5
0.9
0.7
JK Tyres
Neutral
80
-
1,822
7,446
7,669
15.2
14.0
19.6
18.4
4.1
4.4
1.0
0.9
25.2
19.5
0.6
0.6
Swaraj Engines
Accumulate
856
919
1,063
552
630
14.2
14.7
44.6
54.1
19.2
15.8
4.5
4.1
23.2
25.6
1.8
1.5
Subros
Neutral
84
-
504
1,293
1,527
11.8
11.9
4.2
6.7
20.0
12.5
1.5
1.4
7.7
11.5
0.7
0.6
Indag Rubber
Neutral
164
-
431
283
329
17.0
17.2
13.0
15.4
12.7
10.7
2.8
2.3
21.8
21.6
1.3
1.1
Capital Goods
ACE
Neutral
37
-
367
660
839
4.7
8.2
1.0
3.9
37.1
9.5
1.2
1.0
3.2
11.3
0.7
0.6
BEML
Accumulate
1,031
1,157
4,294
3,277
4,006
6.0
8.9
36.2
64.3
28.5
16.0
2.0
1.8
5.7
11.7
1.4
1.1
Bharat Electronics
Buy
1,063
1,414
25,523
7,737
8,634
16.8
17.2
54.0
61.5
19.7
17.3
2.8
2.5
39.3
45.6
2.5
2.1
Stock Watch
March 16, 2016
Company Name
Reco
CMP
Target
Mkt Cap
Sales ( Čcr )
OPM(%)
EPS (Č)
PER(x)
P/BV(x)
RoE(%)
EV/Sales(x)
(Č)
Price ( Č)
( Č cr )
FY16E
FY17E
FY16E
FY17E
FY16E
FY17E
FY16E
FY17E
FY16E
FY17E
FY16E
FY17E
FY16E
FY17E
Capital Goods
Voltas
Buy
248
353
8,221
5,363
5,963
8.0
9.1
11.0
13.8
22.6
18.0
3.5
3.0
16.2
17.9
1.5
1.3
BGR Energy
Neutral
103
-
741
3,615
3,181
9.5
9.4
16.7
12.4
6.2
8.3
0.6
0.6
10.0
7.0
0.6
0.8
BHEL
Neutral
106
-
25,981
33,722
35,272
10.8
11.7
10.5
14.2
10.1
7.5
0.8
0.7
7.0
9.0
0.8
0.8
Blue Star
Buy
345
439
3,104
3,548
3,977
6.3
6.9
13.7
17.2
25.2
20.1
6.3
4.1
26.1
25.4
0.9
0.8
Crompton Greaves
Neutral
44
-
2,751
13,484
14,687
4.9
6.2
4.5
7.1
9.8
6.2
0.7
0.6
7.2
10.8
0.8
0.7
Greaves Cotton
Neutral
125
-
3,043
1,655
1,755
16.6
16.8
7.4
7.8
16.8
16.0
3.4
3.2
21.1
20.6
1.8
1.7
Inox Wind
Buy
253
458
5,606
4,980
5,943
17.0
17.5
26.6
31.6
9.5
8.0
2.8
2.1
35.0
30.0
1.3
1.0
KEC International
Neutral
122
-
3,126
8,791
9,716
6.1
6.8
5.4
8.2
22.5
14.8
2.3
2.1
10.0
14.0
0.6
0.5
Thermax
Neutral
757
-
9,018
6,413
7,525
7.4
8.5
30.5
39.3
24.8
19.3
3.8
3.3
15.0
17.0
1.4
1.1
Cement
ACC
Neutral
1,241
-
23,305
13,151
14,757
16.4
18.3
63.9
83.4
19.4
14.9
2.5
2.3
13.3
16.1
1.6
1.3
Ambuja Cements
Neutral
205
-
31,806
11,564
12,556
19.4
20.7
8.9
10.1
23.0
20.3
2.9
2.7
12.8
13.8
2.3
2.1
HeidelbergCement
Neutral
74
-
1,675
1,772
1,926
13.3
15.4
1.0
3.0
73.9
24.6
1.9
1.7
2.6
7.9
1.5
1.3
India Cements
Neutral
77
-
2,359
4,216
4,840
18.0
19.5
4.0
9.9
19.2
7.8
0.8
0.7
4.0
9.5
0.9
0.7
JK Cement
Neutral
576
-
4,026
3,661
4,742
10.1
15.8
7.5
28.5
76.8
20.2
2.3
2.0
7.5
22.9
1.6
1.2
J K Lakshmi Cement
Neutral
306
-
3,602
2,947
3,616
16.7
19.9
11.5
27.2
26.6
11.3
2.5
2.2
9.8
20.8
1.6
1.3
Mangalam Cements
Neutral
190
-
507
1,053
1,347
10.5
13.3
8.4
26.0
22.6
7.3
1.0
0.9
4.3
12.5
0.8
0.6
Orient Cement
Neutral
136
-
2,778
1,854
2,524
21.2
22.2
7.7
11.1
17.6
12.2
2.5
2.2
13.3
15.7
2.3
1.6
Ramco Cements
Neutral
391
-
9,309
4,036
4,545
20.8
21.3
15.1
18.8
25.9
20.8
3.2
2.8
12.9
14.3
2.8
2.4
Shree Cement^
Neutral
11,337
-
39,494
7,150
8,742
26.7
28.6
228.0
345.5
49.7
32.8
7.3
6.1
15.7
20.3
5.2
4.2
UltraTech Cement
Neutral
2,988
-
82,004
24,669
29,265
18.2
20.6
82.0
120.0
36.4
24.9
3.9
3.4
11.3
14.7
3.4
2.9
Construction
ITNL
Buy
71
93
2,345
7,360
8,825
34.0
35.9
7.0
9.0
10.2
7.9
0.4
0.3
3.2
3.7
3.7
3.6
KNR Constructions
Buy
505
603
1,421
937
1,470
14.3
14.0
44.2
38.6
11.4
13.1
2.3
2.0
15.4
15.4
1.6
1.1
Larsen & Toubro
Accumulate
1,181
1,310
110,017
58,870
65,708
8.3
10.3
42.0
53.0
28.1
22.3
2.0
1.8
8.8
11.2
2.1
1.9
Gujarat Pipavav Port
Neutral
159
-
7,677
629
684
51.0
52.2
6.4
5.9
24.8
26.9
3.3
3.0
15.9
12.7
11.8
10.7
MBL Infrastructures
Buy
135
285
558
2,313
2,797
12.2
14.6
19.0
20.0
7.1
6.7
0.7
0.7
11.3
10.6
1.0
0.9
Nagarjuna Const.
Neutral
69
-
3,858
7,892
8,842
8.8
9.1
3.0
5.3
23.1
13.1
1.2
1.1
5.0
8.5
0.7
0.6
PNC Infratech
Accumulate
484
558
2,484
1,873
2,288
13.2
13.5
24.0
32.0
20.2
15.1
2.0
1.7
12.1
12.3
1.5
1.2
Simplex Infra
Neutral
225
-
1,111
5,955
6,829
10.3
10.5
16.0
31.0
14.0
7.2
0.7
0.7
5.3
9.9
0.7
0.6
Power Mech Projects
Neutral
564
-
830
1,539
1,801
12.8
12.7
59.0
72.1
9.6
7.8
1.4
1.2
18.6
16.8
0.6
0.5
Stock Watch
March 16, 2016
Company Name
Reco
CMP
Target
Mkt Cap
Sales ( Čcr )
OPM(%)
EPS (Č)
PER(x)
P/BV(x)
RoE(%)
EV/Sales(x)
(Č)
Price ( Č)
( Č cr )
FY16E
FY17E
FY16E
FY17E
FY16E
FY17E
FY16E
FY17E
FY16E
FY17E
FY16E
FY17E
FY16E
FY17E
Construction
Sadbhav Engineering
Buy
262
289
4,498
3,481
4,219
10.7
10.8
8.2
11.7
32.0
22.4
3.1
2.7
10.3
13.5
1.5
1.2
NBCC
Buy
918
1,089
11,015
5,816
7,382
6.9
7.7
29.6
39.8
31.0
23.1
5.6
4.4
24.1
26.7
1.7
1.3
MEP Infra
Neutral
39
-
633
1,956
1,876
28.1
30.5
1.3
3.0
30.0
13.0
6.3
4.2
21.2
32.8
1.7
1.7
SIPL
Neutral
87
-
3,064
675
1,042
62.4
64.7
-
-
3.3
3.7
-
-
16.4
11.0
Financials
Allahabad Bank
Neutral
52
-
3,111
8,569
9,392
2.8
2.9
16.3
27.5
3.2
1.9
0.3
0.2
7.6
11.9
-
-
Axis Bank
Buy
419
494
99,810
26,473
31,527
3.5
3.6
35.7
43.5
11.7
9.6
2.0
1.7
17.9
18.9
-
-
Bank of Baroda
Neutral
143
-
33,007
18,485
21,025
1.9
2.0
13.5
21.1
10.7
6.8
0.8
0.8
7.3
10.6
-
-
Bank of India
Neutral
95
-
7,717
15,972
17,271
1.9
2.0
15.3
33.4
6.2
2.9
0.3
0.2
3.6
7.6
-
-
Canara Bank
Neutral
187
-
10,135
15,441
16,945
2.0
2.1
46.6
70.4
4.0
2.7
0.4
0.3
8.0
11.2
-
-
Dena Bank
Neutral
29
-
1,839
3,440
3,840
2.1
2.3
7.3
10.0
3.9
2.8
0.3
0.2
6.1
7.9
-
-
Federal Bank
Neutral
48
-
8,177
3,477
3,999
3.0
3.0
5.0
6.2
9.5
7.6
1.0
0.9
10.6
11.9
-
-
HDFC
Neutral
1,114
-
175,953
10,358
11,852
3.3
3.3
41.1
47.0
27.1
23.7
5.2
4.7
24.7
24.9
-
-
HDFC Bank
Buy
1,027
1,262
259,518
38,309
47,302
4.3
4.3
49.3
61.1
20.8
16.8
3.6
3.1
18.5
19.7
-
-
ICICI Bank
Buy
221
254
128,685
34,279
39,262
3.3
3.3
21.0
24.4
10.6
9.1
1.8
1.5
14.4
14.7
-
-
IDBI Bank
Neutral
65
-
12,369
9,625
10,455
1.8
1.8
8.5
14.2
7.6
4.6
0.5
0.4
5.9
9.3
-
-
Indian Bank
Neutral
100
-
4,801
6,160
6,858
2.5
2.5
24.5
29.8
4.1
3.4
0.3
0.3
7.7
8.6
-
-
LIC Housing Finance
Buy
454
592
22,917
3,101
3,745
2.5
2.5
33.0
40.2
13.8
11.3
2.6
2.2
19.7
20.5
-
-
Oriental Bank
Neutral
90
-
2,694
7,643
8,373
2.4
2.4
37.2
45.4
2.4
2.0
0.2
0.2
8.2
9.4
-
-
Punjab Natl.Bank
Neutral
83
-
16,376
23,638
26,557
2.8
2.8
17.9
27.2
4.7
3.1
0.5
0.4
8.5
12.0
-
-
South Ind.Bank
Neutral
17
-
2,350
1,965
2,185
2.5
2.5
2.5
3.3
7.0
5.3
0.7
0.6
9.5
11.7
-
-
St Bk of India
Neutral
185
-
143,805
79,958
86,061
2.6
2.6
13.4
20.7
13.8
9.0
1.1
1.1
11.5
12.8
-
-
Union Bank
Neutral
125
-
8,624
12,646
14,129
2.3
2.4
31.0
39.1
4.1
3.2
0.4
0.4
9.8
11.4
-
-
Vijaya Bank
Neutral
32
-
2,732
3,536
3,827
1.9
1.9
5.5
6.7
5.8
4.8
0.5
0.4
7.8
8.8
-
-
Yes Bank
Neutral
811
-
34,096
7,190
9,011
3.2
3.3
58.2
69.7
13.9
11.7
2.5
2.1
19.2
19.6
-
-
FMCG
Asian Paints
Neutral
886
-
84,995
16,553
19,160
16.0
16.2
17.7
21.5
50.1
41.2
13.3
12.0
29.4
31.2
5.0
4.3
Britannia
Neutral
2,761
-
33,130
8,481
9,795
14.0
14.1
65.5
78.3
42.2
35.3
20.0
16.4
38.3
41.2
3.9
3.3
Colgate
Neutral
841
-
22,867
4,836
5,490
19.5
19.7
48.5
53.2
17.3
15.8
12.7
11.1
99.8
97.5
4.5
3.9
Dabur India
Accumulate
247
267
43,521
9,370
10,265
17.1
17.2
7.3
8.1
33.7
30.5
10.2
8.3
33.7
30.6
4.6
4.2
GlaxoSmith Con*
Accumulate
5,650
6,118
23,761
4,919
5,742
17.2
17.4
168.3
191.2
33.6
29.6
9.5
8.1
28.8
28.9
4.4
3.8
Stock Watch
March 16, 2016
Company Name
Reco
CMP
Target
Mkt Cap
Sales ( Čcr )
OPM(%)
EPS (Č)
PER(x)
P/BV(x)
RoE(%)
EV/Sales(x)
(Č)
Price ( Č)
( Č cr )
FY16E FY17E
FY16E
FY17E
FY16E
FY17E
FY16E
FY17E
FY16E
FY17E
FY16E
FY17E
FY16E
FY17E
FMCG
Godrej Consumer
Neutral
1,265
-
43,064
10,168
12,886
16.1
16.1
32.1
38.4
39.4
32.9
8.0
7.4
19.7
21.0
4.5
3.5
HUL
Neutral
842
-
182,198
34,940
38,957
17.5
17.7
20.8
24.7
40.5
34.1
45.0
36.0
110.5
114.2
5.1
4.5
ITC
Accumulate
317
359
254,692
36,804
38,776
37.9
37.9
12.2
12.9
26.0
24.6
7.2
6.4
27.7
25.8
6.6
6.2
Marico
Neutral
243
-
31,319
6,551
7,766
15.7
16.0
10.4
12.5
23.4
19.4
6.8
5.7
33.2
32.4
4.8
4.0
Nestle*
Buy
5,054
6,646
48,727
11,291
12,847
22.2
22.3
158.9
184.6
31.8
27.4
16.6
15.0
55.0
57.3
4.3
3.7
Tata Global
Buy
115
144
7,286
8,635
9,072
9.8
9.9
6.5
7.6
17.8
15.2
1.8
1.7
6.8
7.4
0.8
0.7
IT
HCL Tech^
Buy
812
1,038
114,460
42,038
47,503
21.2
21.5
51.5
57.7
15.8
14.1
3.4
2.6
21.5
18.8
2.4
1.9
Infosys
Buy
1,134
1,347
261,405
61,850
69,981
27.5
27.5
59.4
65.7
19.1
17.3
4.1
3.5
21.2
20.1
3.5
3.0
TCS
Buy
2,330
2,854
459,041
108,487
122,590
28.3
28.5
122.8
138.4
19.0
16.8
7.2
6.5
38.0
38.9
3.9
3.4
Tech Mahindra
Buy
460
530
44,538
26,524
29,177
16.2
17.0
28.8
33.6
16.0
13.7
3.1
2.6
19.3
19.1
1.4
1.2
Wipro
Buy
535
680
132,154
50,808
56,189
23.7
23.8
37.3
40.7
14.3
13.1
2.7
2.5
19.2
17.7
2.1
1.7
Media
D B Corp
Accumulate
315
356
5,786
2,241
2,495
27.8
27.9
21.8
25.6
14.5
12.3
3.8
3.3
26.7
28.5
2.6
2.3
HT Media
Neutral
80
-
1,854
2,495
2,603
11.2
11.2
7.3
8.6
10.9
9.3
0.9
0.8
7.4
8.1
0.3
0.2
Jagran Prakashan
Buy
149
189
4,861
2,170
2,355
27.2
26.2
8.9
9.9
16.7
15.0
3.5
3.1
20.9
20.5
2.2
2.0
Sun TV Network
Neutral
363
-
14,319
2,779
3,196
70.2
70.5
22.8
27.3
15.9
13.3
3.9
3.6
26.7
28.3
4.6
4.0
Hindustan Media
Neutral
254
-
1,865
920
1,031
20.0
20.0
19.2
20.9
13.2
12.2
2.2
1.9
16.4
15.3
1.6
1.4
Ventures
Metals & Mining
Coal India
Buy
296
380
186,743
76,167
84,130
19.9
22.3
22.4
25.8
13.2
11.5
4.8
4.6
35.5
41.0
2.0
1.8
Hind. Zinc
Neutral
171
-
72,443
14,641
14,026
50.4
50.4
17.7
16.0
9.7
10.7
1.5
1.4
16.2
13.2
2.5
2.4
Hindalco
Neutral
84
-
17,325
104,356
111,186
8.7
9.5
6.7
11.1
12.5
7.6
0.5
0.4
3.5
5.9
0.7
0.6
JSW Steel
Neutral
1,194
-
28,868
42,308
45,147
16.4
20.7
(10.3)
49.5
24.1
1.3
1.3
(1.0)
5.6
1.7
1.6
NMDC
Neutral
94
-
37,308
8,237
10,893
46.6
44.5
10.0
11.7
9.5
8.1
1.1
0.9
12.5
13.0
4.3
3.3
SAIL
Neutral
43
-
17,883
45,915
53,954
7.2
10.5
1.5
4.4
28.8
9.9
0.4
0.4
2.3
4.1
1.0
0.9
Vedanta
Neutral
88
-
26,119
71,445
81,910
26.2
26.3
12.9
19.2
6.8
4.6
0.5
0.4
7.2
8.9
0.8
0.6
Tata Steel
Neutral
300
-
29,117
126,760
137,307
8.9
11.3
6.4
23.1
47.1
13.0
0.9
0.9
2.0
7.1
0.8
0.8
Oil & Gas
Cairn India
Neutral
150
-
28,067
11,323
12,490
49.4
51.0
20.7
20.7
7.2
7.3
0.5
0.4
6.4
6.1
1.5
0.9
GAIL
Neutral
340
-
43,160
64,856
70,933
9.1
9.6
24.0
28.9
14.2
11.8
1.2
1.1
8.8
9.6
0.9
0.8
ONGC
Neutral
207
-
177,398
154,564
167,321
36.8
37.4
28.6
32.5
7.3
6.4
0.9
0.9
12.7
13.5
1.3
1.3
Petronet LNG
Neutral
248
-
18,585
29,691
31,188
5.8
6.2
12.8
13.4
19.4
18.5
2.9
2.6
15.8
14.8
0.7
0.7
Indian Oil Corp
Buy
392
455
95,224
359,607
402,760
5.9
6.1
42.5
48.7
9.2
8.1
1.2
1.1
14.1
14.4
0.4
0.3
Stock Watch
March 16, 2016
Company Name
Reco
CMP
Target
Mkt Cap
Sales ( Čcr )
OPM(%)
EPS (Č)
PER(x)
P/BV(x)
RoE(%)
EV/Sales(x)
(Č)
Price ( Č)
( Č cr )
FY16E FY17E
FY16E
FY17E
FY16E
FY17E
FY16E
FY17E
FY16E
FY17E
FY16E
FY17E
FY16E
FY17E
Oil & Gas
Reliance Industries
Accumulate
1,020
1,150
330,621
304,775
344,392
12.6
13.4
91.3
102.6
11.2
10.0
1.3
1.1
11.8
12.0
1.0
0.8
Pharmaceuticals
Alembic Pharma
Neutral
613
-
11,548
3,274
3,802
26.9
19.4
35.0
28.7
17.5
21.3
7.8
5.9
55.6
31.2
3.5
3.0
Aurobindo Pharma
Buy
710
856
41,522
14,923
17,162
22.0
23.0
35.7
42.8
19.9
16.6
5.8
4.4
34.0
30.2
3.2
2.8
Aventis*
Neutral
4,409
-
10,154
2,082
2,371
17.4
20.8
118.2
151.5
37.3
29.1
5.5
4.4
19.9
25.5
4.5
3.8
Cadila Healthcare
Neutral
339
-
34,669
10,224
11,840
21.0
22.0
14.6
17.6
23.2
19.2
6.4
5.0
30.8
29.0
3.5
2.9
Cipla
Accumulate
525
605
42,153
13,979
16,447
20.2
18.6
25.7
27.5
20.4
19.1
3.3
2.9
17.6
16.1
3.1
2.5
Dr Reddy's
Buy
3,139
3,933
53,525
16,838
19,575
25.0
23.1
167.5
178.8
18.7
17.6
3.9
3.3
23.1
20.4
3.2
2.7
Dishman Pharma
Neutral
349
-
2,816
1,733
1,906
21.5
21.5
17.0
19.9
20.5
17.5
2.1
1.9
10.5
11.2
2.2
1.9
GSK Pharma*
Neutral
3,266
-
27,660
2,870
3,158
20.0
22.1
59.5
68.3
54.9
47.8
16.2
16.6
28.5
34.3
9.1
8.3
Indoco Remedies
Neutral
278
-
2,559
1,033
1,199
15.9
18.2
9.4
13.6
29.6
20.4
4.4
3.7
15.7
19.7
2.6
2.2
Ipca labs
Buy
535
900
6,750
3,363
3,909
12.9
18.6
13.4
28.0
39.9
19.1
2.9
2.5
7.4
14.0
2.3
2.0
Lupin
Neutral
1,727
-
77,793
13,092
16,561
25.0
27.0
50.4
68.3
34.3
25.3
7.1
5.6
22.8
24.7
6.1
4.7
Sun Pharma
Accumulate
844
950
203,099
28,163
32,610
25.8
30.7
17.4
26.9
48.5
31.4
4.6
4.0
13.0
16.6
6.9
5.7
Power
Tata Power
Neutral
59
-
15,890
35,923
37,402
22.6
22.8
4.1
5.2
14.5
11.4
1.1
1.0
7.5
9.3
1.4
1.3
NTPC
Buy
127
146
105,047
87,271
99,297
23.5
23.5
11.8
13.3
10.8
9.6
1.2
1.1
11.5
12.2
2.2
2.0
Power Grid
Buy
139
170
72,562
20,702
23,361
86.7
86.4
12.1
13.2
11.5
10.5
1.7
1.5
15.6
15.1
8.4
7.8
Real Estate
MLIFE
Buy
428
554
1,755
697
1,011
14.9
19.3
13.8
20.1
31.0
21.3
1.2
1.1
3.8
5.3
3.8
2.6
Telecom
Bharti Airtel
Neutral
344
-
137,371
101,748
109,191
32.1
31.7
12.0
12.5
28.6
27.5
2.0
1.9
6.9
6.7
2.0
1.8
Idea Cellular
Neutral
99
-
35,717
34,282
36,941
32.0
31.5
5.9
6.2
16.8
16.0
1.5
1.4
9.9
9.3
1.6
1.6
zOthers
Abbott India
Neutral
4,879
-
10,368
2,715
3,153
14.5
14.1
134.3
152.2
36.3
32.1
9.1
7.5
27.4
25.6
3.5
3.0
Bajaj Electricals
Buy
193
237
1,946
4,719
5,287
5.2
5.8
8.6
12.7
22.5
15.2
2.6
2.3
11.4
14.8
0.4
0.4
Finolex Cables
Neutral
239
-
3,660
2,520
2,883
12.2
12.0
12.7
14.2
18.9
16.9
2.6
2.3
13.6
13.5
1.1
1.0
Goodyear India*
Buy
467
582
1,078
1,800
1,600
11.7
11.5
58.7
52.9
8.0
8.8
1.8
1.5
24.6
18.7
0.4
0.4
Hitachi
Neutral
1,142
-
3,105
1,779
2,081
7.8
8.8
21.8
33.4
52.4
34.2
8.5
6.8
17.4
22.1
1.8
1.5
Jyothy Laboratories
Neutral
283
-
5,128
1,620
1,847
11.5
11.5
7.3
8.5
38.8
33.4
5.0
4.7
13.3
14.4
3.1
2.6
MRF
Buy
34,314
45,575
14,553
20,316
14,488
21.4
21.1
5,488.0
3,798.0
6.3
9.0
2.1
1.7
41.1
21.2
0.7
0.9
Page Industries
Neutral
11,307
-
12,612
1,929
2,450
19.8
20.1
229.9
299.0
49.2
37.8
21.7
15.1
52.1
47.1
6.6
5.2
Relaxo Footwears
Neutral
381
-
4,573
1,767
2,152
12.3
12.5
19.3
25.1
19.8
15.2
4.9
3.7
27.7
27.8
2.7
2.2
Siyaram Silk Mills
Buy
987
1,354
925
1,636
1,815
11.5
11.5
89.9
104.1
11.0
9.5
1.8
1.6
17.9
17.8
0.7
0.7
Stock Watch
March 16, 2016
Company Name
Reco
CMP
Target
Mkt Cap
Sales ( Čcr )
OPM(%)
EPS (Č)
PER(x)
P/BV(x)
RoE(%)
EV/Sales(x)
(Č)
Price ( Č)
( Č cr )
FY16E
FY17E
FY16E
FY17E
FY16E
FY17E
FY16E
FY17E
FY16E
FY17E
FY16E
FY17E
FY16E
FY17E
zOthers
Styrolution ABS India* Neutral
539
-
948
1,271
1,440
8.6
9.2
32.0
41.1
16.8
13.1
1.7
1.5
10.7
12.4
0.7
0.6
TVS Srichakra
Buy
2,358
3,217
1,805
2,035
2,252
15.9
15.3
248.6
268.1
9.5
8.8
4.1
3.0
43.6
33.9
0.9
0.8
HSIL
Accumulate
288
302
2,080
2,123
2,384
16.1
16.5
15.0
18.9
19.1
15.2
1.5
1.4
8.0
9.4
1.3
1.1
Kirloskar Engines India
Neutral
211
-
3,053
2,403
2,554
8.6
9.9
9.2
10.5
23.0
20.1
2.2
2.1
9.7
10.7
0.9
0.8
Ltd
M M Forgings
Buy
428
614
517
511
615
21.7
21.6
43.1
55.8
9.9
7.7
1.8
1.5
19.9
21.2
1.2
0.9
Banco Products (India) Neutral
99
-
709
1,208
1,353
11.0
12.3
10.8
14.5
9.2
6.8
1.1
0.9
11.9
14.5
0.6
0.5
Competent Automobiles Neutral
127
-
78
1,040
1,137
3.2
3.1
25.7
28.0
4.9
4.5
0.7
0.7
15.0
14.3
0.1
0.1
Nilkamal
Neutral
1,092
-
1,629
1,871
2,031
10.7
10.5
63.2
69.8
17.3
15.7
2.8
2.4
17.6
16.6
0.9
0.8
Visaka Industries
Buy
108
144
171
1,086
1,197
9.9
10.3
21.5
28.8
5.0
3.8
0.5
0.4
9.6
11.6
0.4
0.3
Transport Corporation of
Neutral
274
-
2,083
2,830
3,350
8.8
9.0
14.4
18.3
19.1
15.0
2.9
2.6
15.4
17.1
0.9
0.7
India
Elecon Engineering
Neutral
58
-
632
1,359
1,482
10.3
13.7
0.8
3.9
72.2
14.9
1.2
1.1
1.6
7.8
0.8
0.8
Surya Roshni
Buy
134
201
585
2,992
3,223
8.1
8.4
14.7
18.3
9.1
7.3
0.9
0.8
9.7
11.0
0.5
0.4
MT Educare
Neutral
155
-
619
286
366
18.3
17.7
7.7
9.4
20.1
16.6
4.2
3.7
20.2
21.1
2.1
1.6
Radico Khaitan
Buy
97
156
1,293
1,517
1,635
12.7
13.4
5.8
7.1
16.7
13.7
1.4
1.3
8.6
9.6
1.4
1.2
Garware Wall Ropes
Buy
323
473
707
862
974
11.2
11.2
24.9
29.6
13.0
10.9
2.0
1.7
15.1
15.4
0.8
0.6
Wonderla Holidays
Neutral
359
-
2,026
206
308
44.0
43.6
9.0
12.9
39.8
27.8
5.4
4.9
13.7
17.8
10.0
6.6
Linc Pen & Plastics
Neutral
183
-
270
340
371
8.3
8.9
10.8
13.2
16.9
13.8
2.7
2.4
16.0
17.1
0.8
0.8
The Byke Hospitality
Neutral
151
-
607
222
287
20.5
20.5
5.6
7.6
26.9
20.0
5.1
4.2
18.9
20.8
2.8
2.2
Interglobe Aviation
Neutral
800
-
28,832
17,022
21,122
20.7
14.5
63.9
53.7
12.5
14.9
18.8
15.4
149.9
103.2
1.8
1.4
Coffee Day Enterprises
Neutral
225
-
4,632
2,692
2,964
17.0
18.6
-
4.7
-
47.5
2.8
2.6
0.2
5.5
2.1
2.0
Ltd
Navneet Education
Neutral
85
-
2,024
998
1,062
24.1
24.0
5.8
6.1
14.8
14.0
3.3
2.9
22.0
20.6
2.0
1.9
Navkar Corporation
Buy
166
265
2,371
365
436
38.3
37.5
5.6
5.9
29.5
28.3
1.9
1.7
6.3
6.1
7.2
6.2
Source: Company, Angel Research; Note: *December year end; #September year end; &October year end; Price as on March 15, 2016
Market Outlook
March 16, 2016
Research Team Tel: 022 - 39357800
DISCLAIMER
Angel Broking Private Limited (hereinafter referred to as “Angel”) is a registered Member of National Stock Exchange of India Limited,
Bombay Stock Exchange Limited and Metropolitian Stock Exchange of India Limited. It is also registered as a Depository Participant with
CDSL and Portfolio Manager with SEBI. It also has registration with AMFI as a Mutual Fund Distributor. Angel Broking Private Limited is a
registered entity with SEBI for Research Analyst in terms of SEBI (Research Analyst) Regulations, 2014 vide registration number
INH000000164. Angel or its associates has not been debarred/ suspended by SEBI or any other regulatory authority for accessing
/dealing in securities Market. Angel or its associates including its relatives/analyst do not hold any financial interest/beneficial ownership
of more than 1% in the company covered by Analyst. Angel or its associates/analyst has not received any compensation / managed or co
-managed public offering of securities of the company covered by Analyst during the past twelve months. Angel/analyst has not served as
an officer, director or employee of company covered by Analyst and has not been engaged in market making activity of the company
covered by Analyst.
This document is solely for the personal information of the recipient, and must not be singularly used as the basis of any investment
decision. Nothing in this document should be construed as investment or financial advice. Each recipient of this document should make
such investigations as they deem necessary to arrive at an independent evaluation of an investment in the securities of the companies
referred to in this document (including the merits and risks involved), and should consult their own advisors to determine the merits and
risks of such an investment.
Reports based on technical and derivative analysis center on studying charts of a stock's price movement, outstanding positions and
trading volume, as opposed to focusing on a company's fundamentals and, as such, may not match with a report on a company's
fundamentals.
The information in this document has been printed on the basis of publicly available information, internal data and other reliable sources
believed to be true, but we do not represent that it is accurate or complete and it should not be relied on as such, as this document is for
general guidance only. Angel Broking Pvt. Limited or any of its affiliates/ group companies shall not be in any way responsible for any
loss or damage that may arise to any person from any inadvertent error in the information contained in this report. Angel Broking Pvt.
Limited has not independently verified all the information contained within this document. Accordingly, we cannot testify, nor make any
representation or warranty, express or implied, to the accuracy, contents or data contained within this document. While Angel Broking
Pvt. Limited endeavors to update on a reasonable basis the information discussed in this material, there may be regulatory, compliance,
or other reasons that prevent us from doing so.
This document is being supplied to you solely for your information, and its contents, information or data may not be reproduced,
redistributed or passed on, directly or indirectly.
Neither Angel Broking Pvt. Limited, nor its directors, employees or affiliates shall be liable for any loss or damage that may arise from or
in connection with the use of this information.
Note: Please refer to the important ‘Stock Holding Disclosure' report on the Angel website (Research Section). Also, please refer to the
latest update on respective stocks for the disclosure status in respect of those stocks. Angel Broking Pvt. Limited and its affiliates may have
investment positions in the stocks recommended in this report.