Market Outlook
December 15, 2015
Market Cues
Domestic Indices
Chg (%)
(Pts)
(Close)
Indian markets are expected to open negatively tracking the SGX Nifty and most of
BSE Sensex
0.4
106
25,150
its Asian peers.
Nifty
0.5
40
7,650
U.S. markets closed in the green helped by a rebound in the crude oil prices. Crude
Mid Cap
0.7
69
10,645
oil prices fell below $35 a barrel but settled higher for the first time in seven
Small Cap
0.4
45
11,258
sessions.
Bankex
(0.0)
(2)
18,649
European shares slid sharply led by a renewed dip in energy stocks as oil prices
gyrated.
Global Indices
Chg (%)
(Pts)
(Close)
Indian shares closed in the green as the sharp surge in industrial production in
Dow Jones
0.6
103
17,369
October 2015 lended support to indices amid weak global sentiments.
Nasdaq
0.4
19
4,952
News & Result Analysis
FTSE
(1.3)
(79)
5,874
WPI inflation further contracts to -1.99% in November 2015
Nikkei
(1.8)
(347)
18,883
Sun Pharma to divest US subsidiary in Nostrum
Hang Seng
(0.7)
(154)
21,310
M&M and Tech Mahindra to buy Italian car designer Pininfarina
Shanghai Com
2.5
86
3,521
Detailed analysis on Pg2
Investor’s Ready Reckoner
Advances / Declines
BSE
NSE
Key Domestic & Global Indicators
Advances
1,488
456
Stock Watch: Latest investment recommendations on 150+ stocks
Declines
1,171
1,082
Refer P5 onwards
Unchanged
204
70
Top Picks
CMP
Target
Upside
Volumes (` Cr)
Company
Sector
Rating
(`)
(`)
(%)
BSE
3,853
Axis Bank
Financials
Buy
431
630
46.1
NSE
15,571
HCL Tech
IT
Buy
841
1,132
34.6
ICICI Bank
Financials
Buy
249
354
42.2
Net Inflows (` Cr)
Net
Mtd
Ytd
Ashok Leyland
Automobiles
Buy
86
111
29.0
Larsen & Toubro
Construction
Buy
1,274
1,646
29.2
FII
(452)
(3,185)
(25,634)
More Top Picks on Pg4
MFs
148
1,271
58,166
Key Upcoming Events
Previous
Consensus
Top Gainers
Price (`)
Chg (%)
Date
Region
Event Description
Reading
Expectations
Manappuram
29
8.2
Dec 15
US
Consumer price index (mom)
0.20
-
Tataelxsi
2,121
6.7
Dec 16
US
Housing starts
1,060k
1,140k
Gvkpil
8
6.6
Dec 16
Germany
PMI Services
55.6
55.5
Rcom
81
6.2
Dec 16
Euro
CPI
0.1%
0.1%
Den
100
5.9
Top Losers
Price (`)
Chg (%)
Pmcfin
1
(8.7)
Kailash
2
(4.7)
Star
1,278
(4.7)
Bhusanstl
43
(4.7)
Bajajhldng
1,611
(3.4)
As on December 14, 2015
Market Outlook
December 15, 2015
WPI inflation further contracts to (-) 1.99% in November
Wholesale price index for November came in at (-) 1.99%. This is against WPI of
(-) 3.81% recorded in the previous month. In November last year, the WPI-based
inflation was (-) 0.17%. Manufactured products, which have weightage of 65 per
cent, inflation for November 2015 stood at (-) 1.42%. Food articles, which have
weightage of 14.33%, inflation for the month under review stood at 5.20%, much
higher than 0.66% in same month last fiscal.
Sun Pharma to divest US subsidiary in Nostrum
Sun Pharmaceutical Industries Ltd, the world's fifth largest specialty generic
pharmaceutical company, on Monday has announced that one of its wholly owned
subsidiaries has entered into an agreement with Nostrum Laboratories Inc.
(Nostrum) for the divestment of the Bryan (Ohio) unit in the US. This is a part of its
manufacturing consolidation in the US. According to the deal, this subsidiary of
Sun Pharma has divested its unit as a going concern along with the employees and
related products to Nostrum. While the other related details of this transaction are
confidential, the financial impact of this development on Sun Pharma is negligible.
M&M and Tech Mahindra to buy Italian car designer Pininfarina
Mahindra & Mahindra and Tech Mahindra agreed to buy Italian car designer
Pininfarina SpA in a deal worth about euro
168 million
($185 million),
underscoring the Indian vehicle maker’s international ambitions. M&M, together
with its affiliate Tech Mahindra, would form a special purpose vehicle (SPV) to
acquire 76% stake in the indebted Italian firm. While Tech Mahindra will own 60%
in the SPV, M&M will own the remaining share. Both companies would pay euro
25.3 million (`186 crore) to buy Pininfarina’s promoter Pincar’s stake. Further, the
SPV would make an open offer of euro 20 million (`147 crore) to the public
shareholders of Pininfarina to acquire the remaining stake in the Italian firm.
As per M&M, the legendary high-end design credentials of Pininfarina will
significantly enhance the design capabilities of the entire Mahindra group. The
takeover of Pininfarina, the creator of numerous Ferraris including the 458 Spider
roadster, marks the latest international expansion by Mahindra following its
acquisitions of South Korean carmaker Ssangyong and the motorcycle unit of
French auto manufacturer PSA Peugeot Citroen. The designer already cooperates
with Mumbai-based Mahindra on sports utility vehicle (SUV) development and
worked with it on the Halo electric sports-car concept unveiled last year.
Pininfarina, which has been unprofitable for 10 of the past 11 years while
struggling with debt, shut a floundering division that built cars for other
manufacturers three years ago. The deal is expected to close in the first half of
2016.
The buy-out of the 85-year-old firm will help Tech Mahindra, India’s fifth largest
information technology firm, strengthen its engineering services business. Tech
Mahindra will also benefit from the designer’s focused presence in Italy and
Germany, hotbeds of European automotive manufacturing, as well as in the US
and an emerging automotive market, China. It also augments Tech Mahindra’s
transportation, aerospace and industrial design offerings. For Pininfarina, the
Market Outlook
December 15, 2015
acquisition will mean an ability to leverage Tech Mahindra’s presence across 90
countries and access to about 780 customers.
In September this year, Tech mahindra had joined hands with Ericsson, EBS and
TomTom, and came up with a connected car solutions for the automobile makers.
The solution features built-in analytics capabilities to manage recorded information
from a vehicle and its sensors. It also enables service providers and manufacturers
to deliver a range of services such as remote diagnostics, roadside assistance and
emergency calls. It also delivers infotainment, news and location-based
information inside a car.
We believe the deal is unlikely to impact M&M financially given the small size and
cash rich balance sheet of M&M (M&M has cash in excess of `2,000 crores).
However, we believe the deal would help M&M in long run as it would enhance
the designing capabilities of the firm. We currently have Accumulate rating on
M&M.
Economic and Political News
Maintaining growth momentum in 2016 'challenging': HSBC
Wholesale prices drop for 13th straight month in November
Centre reserves Pottangi mines for Nalco's new mn-tonne refinery
Corporate News
Tata Power earmarks four key regions for international play
Infosys invests $3 million in US sports tech startup WHOOP
Natco settles patent suit with Gilead, others over Tamiflu
Market Outlook
December 15, 2015
Top Picks ★★★★★
Large Cap
Market Cap
CMP
Target
Upside
Company
Rationale
(` Cr)
(`)
(`)
(%)
To outpace battery industry growth due to better technological
Amara Raja Batteries
14,403
843
1,040
23.3
products leading to market share gains in both the automotive
OEM and replacement segments.
Earnings to grow strongly given the MHCV cyclical upturn.
Ashok Leyland
24,489
86
111
29.0
Focus on exports and LCV's provides additional growth
avenue.
Healthy pace of branch expansion, backed by distribution
Axis Bank
102,490
431
630
46.1
network, will be the driving force for the bank’s retail business
and overall earnings.
The stock is trading at attractive valuations and is factoring all
HCL Tech
118,536
841
1,132
34.6
the bad news.
Strong visibility for a robust 20% earnings trajectory, coupled
HDFC Bank
266,251
1,055
1,262
19.6
with high quality of earnings on account of high quality retail
business and strategic focus on highly rated corporates.
Due to its robust franchise and capital adequacy position, the
bank is well positioned to grow by at least a few percentage
ICICI Bank
144,688
249
354
42.2
points higher than the average industry growth rate from a
structural point of view.
Back on the growth trend, expect a long term growth of 14%
Infosys
245,658
1,070
1,306
22.1
to be a US$20bn in FY2020.
Well positioned to benefit from such expected gradual
recovery in the overall domestic capex cycle, given its presence
Larsen & Toubro
118,679
1,274
1,646
29.2
across various infrastructure segments, its execution
capabilities, and its strong balance sheet.
LICHF continues to grow its retail loan book at a healthy pace
with improvement in asset quality. We expect the company to
LIC Housing Finance
23,871
473
571
20.7
post a healthy loan book which is likely to reflect in a strong
earnings growth.
Source: Company, Angel Research
Mid Cap
Market Cap
CMP
Target
Upside
Company
Rationale
(` Cr)
(`)
(`)
(%)
Favourable outlook for the AC industry to augur well for
Cooling products business which is out pacing the market
Blue Star
3,190
355
429
20.9
growth. EMPPAC division's profitability to improve once
operating environment turns around.
Change in business focus towards high-margin chronic &
Ipca labs
9,516
754
900
19.3
lifestyle segments and increasing penetration in Europe and
US
Economic recovery to have favourable impact on advertising &
circulation revenue growth. Further, the acquisition of a radio
Jagran Prakashan
4,992
153
169
10.7
business (Radio City) would also boost the company's revenue
growth.
Strong brand & quality teaching with innovative technologies &
MT Educare
547
137
169
23.1
higher government educational spending to boost growth
Earnings boost on back of stable material prices and
Radico Khaitan
1,461
110
156
42.0
favourable pricing environment. Valuation discount to peers
provides additional comfort
Strong brands and distribution network would boost growth
Siyaram Silk Mills
1,033
1,102
1,354
22.9
going ahead. Stock currently trades at an inexpensive
valuation.
Structural shift in the Lighting industry towards LED lighting will
Surya Roshni
585
133
183
37.1
drive growth.
Source: Company, Angel Research
Market Outlook
December 15, 2015
Key Upcoming Events
Global economic events release calendar
Date
Time
Country
Event Description
Unit
Period
Bloomberg Data
Last Reported Estimated
Dec 15, 2015
7:00PM
US
Consumer price index (mom)
% Change
Nov
0.20
--
3:00PM
UK
CPI (YoY)
% Change
Nov
(0.10)
0.10
Dec 16, 2015
7:00PM
US
Housing Starts
Thousands
Nov
1,060.00
1,135.00
7:00PM
US
Building permits
Thousands
Nov
1,161.00
1,150.00
2:00PM
Germany
PMI Services
Value
Dec P
55.60
55.50
2:00PM
Germany
PMI Manufacturing
Value
Dec P
52.90
52.80
3:00PM
UK
Jobless claims change
% Change
Nov
3.30
0.75
3:30PM
Euro Zone
Euro-Zone CPI (YoY)
%
Nov F
0.10
0.10
7:45PM
US
Industrial Production
%
Nov
(0.15)
(0.10)
Dec 17, 2015
7:00PM
US
Initial Jobless claims
Thousands
Dec 12
282.00
274.00
12:30AM
US
FOMC rate decision
%
Dec 16
0.25
0.50
Dec 21, 2015
8:30PM
Euro Zone
Euro-Zone Consumer Confidence
Value
Dec A
(5.90)
--
Dec 22, 2015
8:30PM
US
Existing home sales
Million
Nov
5.36
5.35
7:00PM
US
GDP Qoq (Annualised)
% Change
3Q T
2.10
1.90
Dec 23, 2015
8:30PM
US
New home sales
Thousands
Nov
495.00
505.00
3:00PM
UK
GDP (YoY)
% Change
3Q F
2.30
--
Dec 29, 2015
8:30PM
US
Consumer Confidence
S.A./ 1985=100
Dec
90.40
--
Source: Bloomberg, Angel Research
Market Outlook
December 15, 2015
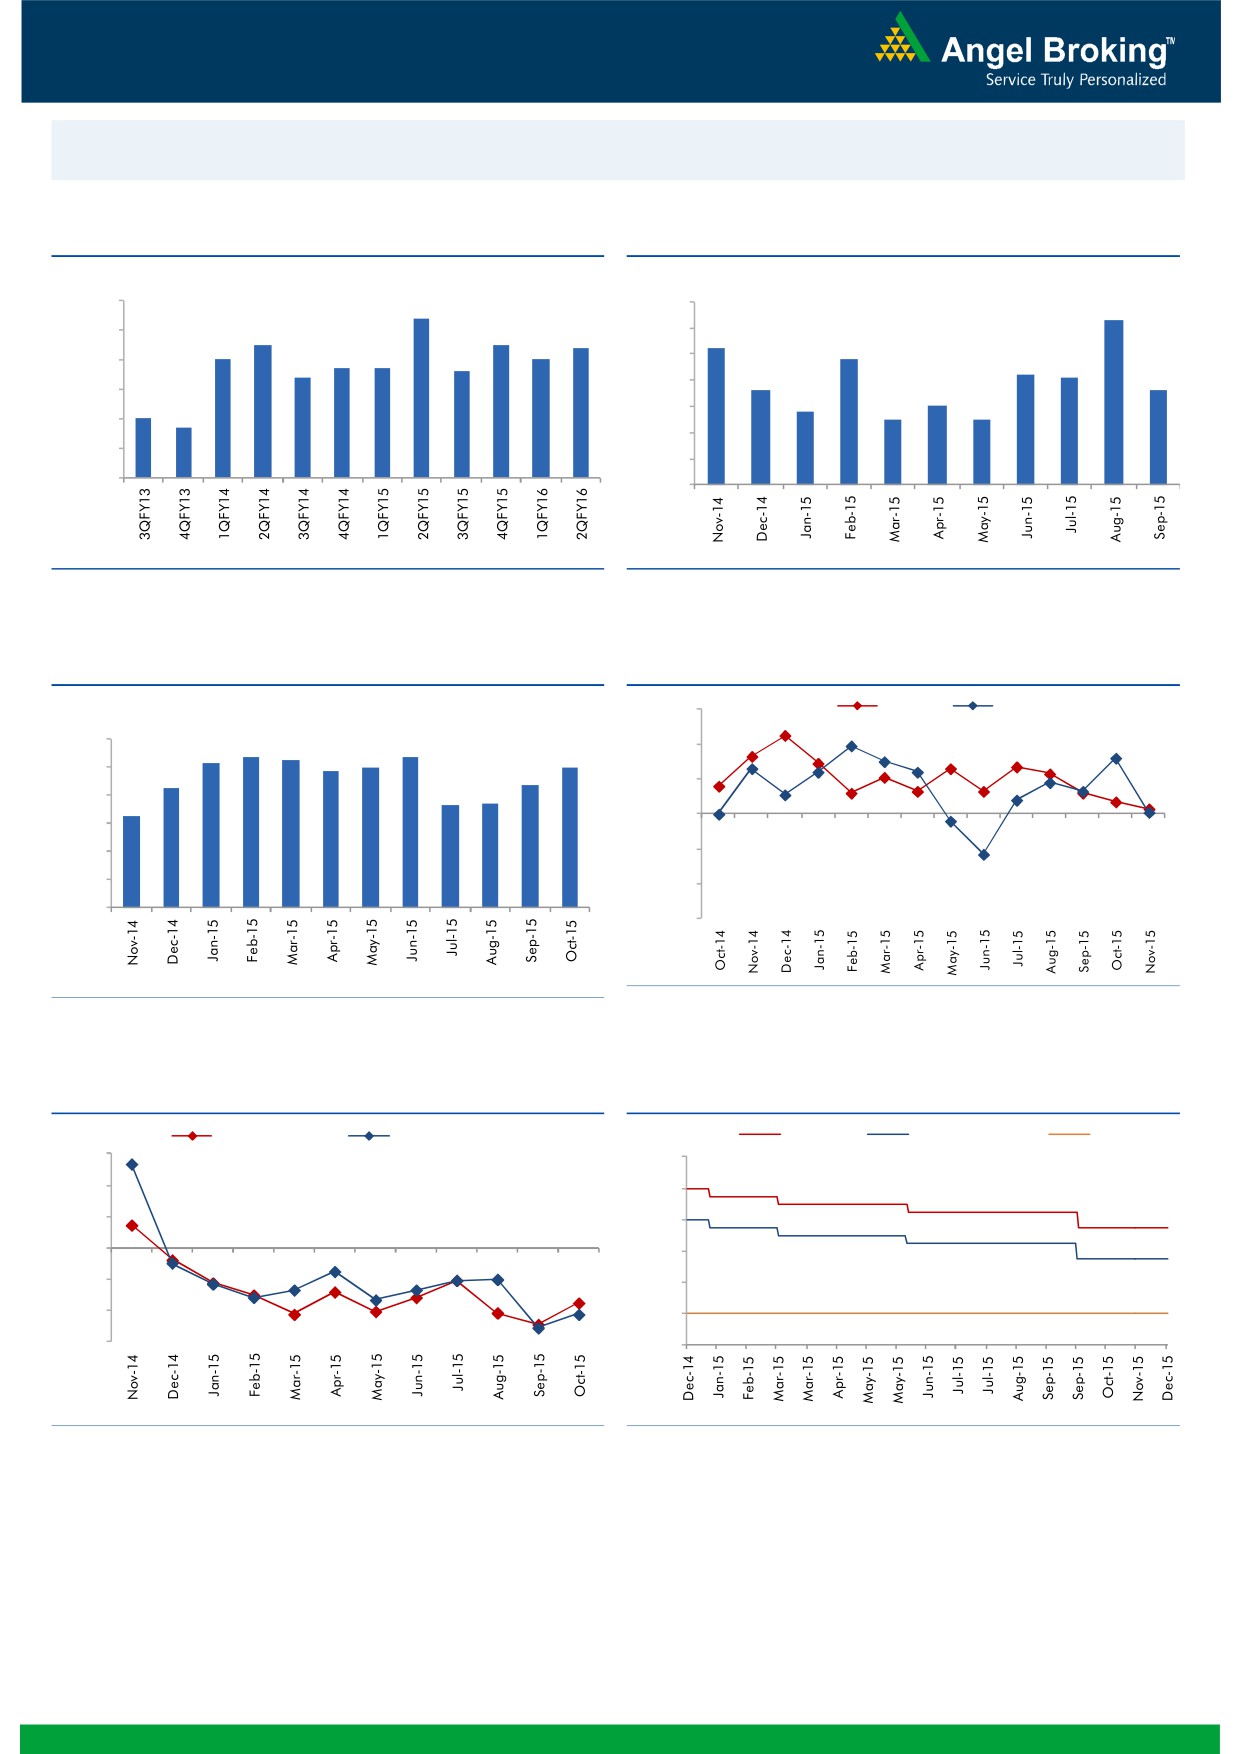
Macro watch
Exhibit 1: Quarterly GDP trends
Exhibit 2: IIP trends
(%)
(%)
9.0
8.4
7.0
6.3
8.0
7.5
7.5
7.4
6.0
5.2
7.0
7.0
4.8
6.7
6.7
6.6
5.0
7.0
6.4
4.2
4.1
3.6
3.6
4.0
6.0
2.8
3.0
5.0
3.0
2.5
2.5
4.7
5.0
2.0
4.0
1.0
3.0
-
Source: CSO, Angel Research
Source: MOSPI, Angel Research
Exhibit 3: Monthly CPI inflation trends
Exhibit 4: Manufacturing and services PMI
(%)
56.0
Mfg. PMI
Services PMI
6.0
5.4
5.3
5.4
54.0
5.2
5.0
5.0
4.9
5.0
4.3
4.4
52.0
3.7
3.7
4.0
3.3
50.0
3.0
2.0
48.0
1.0
46.0
-
44.0
Source: Market, Angel Research; Note: Level above 50 indicates expansion
Source: MOSPI, Angel Research
Exhibit 5: Exports and imports growth trends
Exhibit 6: Key policy rates
(%)
Exports yoy growth
Imports yoy growth
(%)
Repo rate
Reverse Repo rate
CRR
30.0
9.00
20.0
8.00
10.0
7.00
0.0
6.00
(10.0)
5.00
(20.0)
4.00
(30.0)
3.00
Source: Bloomberg, Angel Research
Source: RBI, Angel Research
Market Outlook
December 15, 2015
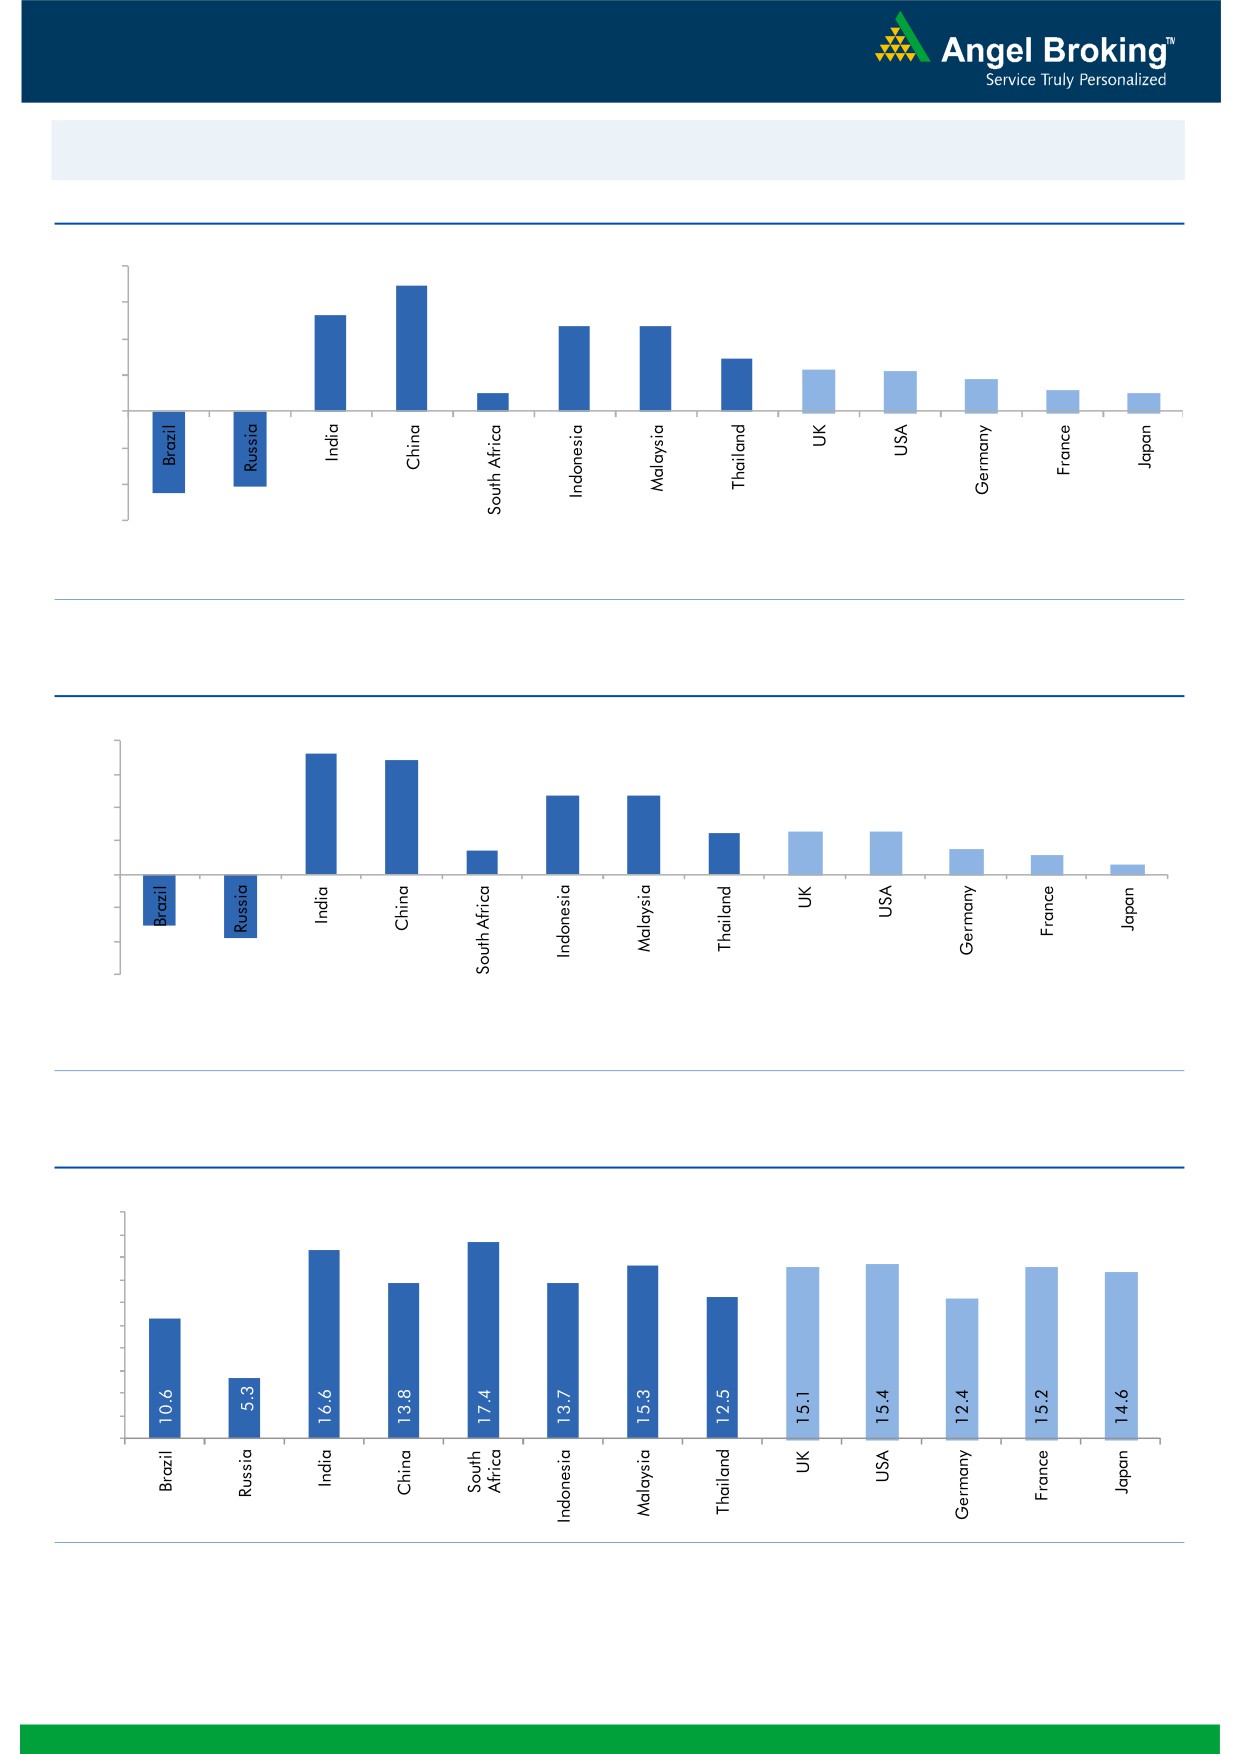
Global watch
Exhibit 1: Latest quarterly GDP Growth (%, yoy) across select developing and developed countries
(%)
8.0
6.9
6.0
5.3
4.7
4.7
4.0
2.9
2.3
2.2
1.8
2.0
1.0
1.2
1.0
-
(2.0)
(4.0)
(4.1)
(4.5)
(6.0)
Source: Bloomberg, Angel Research
Exhibit 2: 2015 GDP Growth projection by IMF (%, yoy) across select developing and developed countries
(%)
7.3
8.0
6.8
6.0
4.7
4.7
4.0
2.5
2.5
2.6
1.4
1.5
2.0
1.2
0.6
-
(2.0)
(4.0)
(3.0)
(3.8)
(6.0)
Source: IMF, Angel Research
Exhibit 3: One year forward P-E ratio across select developing and developed countries
(x)
20.0
18.0
16.0
14.0
12.0
10.0
8.0
6.0
4.0
2.0
-
Source: IMF, Angel Research
Market Outlook
December 15, 2015
Exhibit 4: Relative performance of indices across globe
Returns (%)
Country
Name of index
Closing price
1M
1YR
Brazil
Bovespa
44,747
(3.8)
(4.2)
Russia
Micex
1,709
(0.7)
19.9
India
Nifty
7,650
(1.5)
(6.9)
China
Shanghai Composite
3,520
(1.7)
19.2
South Africa
Top 40
43,415
(5.6)
4.0
Mexico
Mexbol
41,902
(3.9)
3.9
Indonesia
LQ45
748
(2.0)
(15.0)
Malaysia
KLCI
1,629
(1.8)
(4.1)
Thailand
SET 50
811
(8.7)
(18.1)
USA
Dow Jones
17,369
0.7
1.1
UK
FTSE
5,874
(4.0)
(5.0)
Japan
Nikkei
18,726
(4.5)
9.5
Germany
DAX
10,139
(5.3)
8.6
France
CAC
4,473
(7.0)
11.7
Source: Bloomberg, Angel Research
Stock Watch
December 15, 2015
Company Name
Reco
CMP
Target
Mkt Cap
Sales ( Čcr )
OPM(%)
EPS (Č)
PER(x)
P/BV(x)
RoE(%)
EV/Sales(x)
(Č)
Price ( Č)
( Č cr )
FY16E FY17E
FY16E
FY17E
FY16E
FY17E
FY16E
FY17E
FY16E
FY17E
FY16E
FY17E
FY16E
FY17E
Agri / Agri Chemical
Rallis
Neutral
165
-
3,212
2,075
2,394
14.4
14.4
9.5
11.0
17.4
15.0
3.5
3.0
21.1
21.3
1.6
1.4
United Phosphorus
Buy
405
510
17,337
13,698
15,752
17.6
17.6
32.1
38.5
12.6
10.5
2.5
2.1
21.4
21.3
1.3
1.1
Auto & Auto Ancillary
Ashok Leyland
Buy
86
111
24,489
17,995
21,544
11.4
11.6
3.4
4.7
25.3
18.3
4.4
4.1
17.7
22.2
1.3
1.1
Bajaj Auto
Accumulate
2,410
2,728
69,730
23,695
27,298
21.3
20.4
134.6
151.5
17.9
15.9
5.7
4.9
31.8
30.6
2.5
2.1
Bharat Forge
Buy
795
943
18,508
7,867
8,881
20.0
20.3
34.4
41.0
23.1
19.4
4.5
3.7
21.1
20.9
2.5
2.2
Eicher Motors
Buy
15,367
19,036
41,726
15,379
16,498
15.6
16.6
473.2
574.8
32.5
26.7
12.0
8.9
36.7
33.2
2.7
2.4
Hero Motocorp
Accumulate
2,537
2,774
50,670
28,561
31,559
14.7
14.7
151.1
163.2
16.8
15.6
6.5
5.5
38.7
35.6
1.6
1.4
Jamna Auto Industries Accumulate
120
129
955
1,292
1,486
9.3
9.8
6.0
7.5
19.9
15.9
4.1
3.5
20.7
21.8
0.8
0.7
L G Balakrishnan & Bros Neutral
516
-
810
1,254
1,394
11.6
11.8
35.9
41.7
14.4
12.4
2.0
1.7
13.5
13.8
0.7
0.7
Mahindra and Mahindra Accumulate
1,287
1,449
79,935
39,031
44,440
13.8
13.9
57.9
67.6
22.2
19.0
3.6
3.2
16.1
16.6
1.7
1.4
Maruti
Neutral
4,570
-
138,045
57,865
68,104
16.4
16.7
176.3
225.5
25.9
20.3
5.0
4.3
19.4
21.2
2.1
1.7
Minda Industries
Accumulate
865
867
1,372
2,567
2,965
8.0
8.3
46.1
57.8
18.8
15.0
3.1
2.6
16.7
17.3
0.6
0.5
Motherson Sumi
Buy
275
313
36,428
39,343
45,100
8.8
9.1
10.1
12.5
27.3
22.0
8.6
6.8
35.3
34.4
1.0
0.9
Rane Brake Lining
Accumulate
335
366
265
454
511
11.1
11.4
23.8
28.1
14.1
11.9
2.0
1.8
14.2
15.3
0.7
0.6
Setco Automotive
Neutral
232
-
620
594
741
12.7
13.7
8.4
15.8
27.6
14.7
2.9
2.5
10.4
16.9
1.5
1.2
Tata Motors
Accumulate
372
402
107,317
255,254
301,772
12.9
13.4
23.7
37.3
15.7
10.0
1.9
1.6
7.4
12.1
0.6
0.5
TVS Motor
Buy
275
338
13,067
11,569
13,648
7.3
8.7
10.3
16.1
26.7
17.1
6.6
5.2
24.8
30.5
1.1
0.9
Amara Raja Batteries
Buy
843
1,040
14,403
4,892
5,871
17.4
17.6
28.8
37.1
29.3
22.7
6.8
5.5
23.4
24.1
2.9
2.3
Exide Industries
Buy
141
162
11,977
6,950
7,784
14.4
14.8
6.6
7.3
21.4
19.3
2.7
2.5
12.6
12.8
1.4
1.3
Apollo Tyres
Buy
151
171
7,689
12,146
12,689
16.8
16.0
21.2
19.0
7.1
8.0
1.2
1.0
16.5
13.0
0.7
0.7
Ceat
Accumulate
1,017
1,119
4,115
6,041
6,597
14.1
13.7
99.5
111.9
10.2
9.1
2.0
1.7
19.6
18.5
0.8
0.7
JK Tyres
Neutral
105
-
2,375
7,446
7,669
15.2
14.0
19.6
18.4
5.3
5.7
1.3
1.1
25.2
19.5
0.7
0.6
Swaraj Engines
Neutral
914
-
1,135
552
630
14.2
14.7
44.6
54.1
20.5
16.9
4.8
4.3
23.2
25.6
1.9
1.6
Subros
Neutral
94
-
563
1,268
1,488
11.6
11.9
3.7
6.6
25.4
14.2
1.7
1.6
6.8
11.4
0.7
0.6
Indag Rubber
Neutral
205
-
538
283
329
17.0
17.2
13.0
15.4
15.8
13.3
3.5
2.9
21.8
21.6
1.7
1.4
Capital Goods
ACE
Neutral
43
-
425
660
839
4.7
8.2
1.0
3.9
43.0
11.0
1.3
1.2
3.2
11.3
0.8
0.6
BEML
Neutral
1,076
-
4,483
3,277
4,006
6.0
8.9
29.2
64.3
36.9
16.7
2.1
1.9
5.7
11.7
1.4
1.1
BGR Energy
Neutral
114
-
823
3,615
3,181
9.5
9.4
16.7
12.4
6.8
9.2
0.6
0.6
10.0
7.0
0.6
0.8
BHEL
Neutral
167
-
40,887
33,722
35,272
10.8
11.7
10.5
14.2
15.9
11.8
1.2
1.1
7.0
9.0
1.3
1.2
Stock Watch
December 15, 2015
Company Name
Reco
CMP
Target
Mkt Cap
Sales ( Čcr )
OPM(%)
EPS (Č)
PER(x)
P/BV(x)
RoE(%)
EV/Sales(x)
(Č)
Price ( Č)
( Č cr )
FY16E
FY17E
FY16E
FY17E
FY16E
FY17E
FY16E
FY17E
FY16E
FY17E
FY16E
FY17E
FY16E
FY17E
Capital Goods
Blue Star
Buy
355
429
3,190
3,548
3,977
6.3
6.9
13.7
17.2
25.9
20.7
6.5
4.2
26.1
25.4
1.0
0.8
Crompton Greaves
Accumulate
190
204
11,902
13,484
14,687
4.9
6.2
4.5
7.1
42.2
26.8
3.0
2.8
7.2
10.8
1.0
0.9
Inox Wind
Buy
342
505
7,588
4,980
5,943
17.0
17.5
26.6
31.6
12.9
10.8
3.8
2.8
35.0
30.0
1.7
1.4
KEC International
Neutral
151
-
3,886
8,791
9,716
6.1
6.8
5.4
8.2
28.0
18.4
2.8
2.6
10.0
14.0
0.7
0.6
Thermax
Neutral
893
-
10,644
6,413
7,525
7.4
8.5
30.5
39.3
29.3
22.7
4.5
3.9
15.0
17.0
1.6
1.3
Cement
ACC
Buy
1,342
1,630
25,189
13,151
14,757
16.4
18.3
63.9
83.4
21.0
16.1
2.7
2.5
13.3
16.1
1.7
1.5
Ambuja Cements
Buy
193
233
29,936
11,564
12,556
19.4
20.7
8.9
10.1
21.7
19.1
2.7
2.6
12.8
13.8
2.2
2.0
HeidelbergCement
Neutral
74
-
1,679
1,772
1,926
13.3
15.4
1.0
3.0
74.1
24.7
1.9
1.7
2.6
7.9
1.5
1.3
India Cements
Buy
84
112
2,580
4,216
4,840
18.0
19.5
4.0
9.9
21.0
8.5
0.8
0.8
4.0
9.5
0.9
0.7
JK Cement
Accumulate
647
744
4,526
3,661
4,742
10.1
15.8
18.0
61.0
36.0
10.6
2.6
2.3
7.5
22.9
1.7
1.3
J K Lakshmi Cement
Buy
333
430
3,924
2,947
3,616
16.7
19.9
11.5
27.2
29.0
12.3
2.8
2.4
9.8
20.8
1.7
1.4
Mangalam Cements
Neutral
203
-
542
1,053
1,347
10.5
13.3
8.4
26.0
24.2
7.8
1.0
0.9
4.3
12.5
0.9
0.7
Orient Cement
Buy
157
183
3,215
1,854
2,524
21.2
22.2
7.7
11.1
20.4
14.1
2.9
2.5
13.3
15.7
2.5
1.7
Ramco Cements
Neutral
372
-
8,865
4,036
4,545
20.8
21.3
15.1
18.8
24.7
19.8
3.0
2.7
12.9
14.3
2.7
2.3
Shree Cement^
Neutral
10,824
-
37,706
7,150
8,742
26.7
28.6
228.0
345.5
47.5
31.3
7.0
5.9
15.7
20.3
5.0
4.0
UltraTech Cement
Buy
2,840
3,282
77,922
25,021
30,023
19.1
21.6
89.0
132.0
31.9
21.5
3.7
3.2
12.2
15.9
3.1
2.6
Construction
ITNL
Neutral
79
-
2,595
7,360
8,825
34.0
35.9
7.0
9.0
11.3
8.8
0.4
0.4
3.2
3.7
3.7
3.6
KNR Constructions
Buy
593
673
1,668
937
1,470
14.3
14.0
33.5
38.6
17.7
15.4
2.7
2.3
15.4
15.4
1.8
1.2
Larsen & Toubro
Buy
1,274
1,646
118,679
65,065
77,009
11.5
11.7
61.5
65.6
20.7
19.4
2.1
1.9
13.4
14.0
2.0
1.7
Gujarat Pipavav Port
Neutral
146
-
7,073
629
684
51.0
52.2
6.4
5.9
22.9
24.8
3.0
2.8
15.9
12.7
11.1
10.0
MBL Infrastructures
Buy
206
285
852
2,313
2,797
12.2
14.6
19.0
20.0
10.8
10.3
1.1
1.0
11.3
10.6
1.1
1.0
Nagarjuna Const.
Neutral
73
-
4,075
7,892
8,842
8.8
9.1
3.0
5.3
24.4
13.8
1.2
1.1
5.0
8.5
0.7
0.6
PNC Infratech
Neutral
530
-
2,718
1,873
2,288
13.2
13.5
24.0
32.0
22.1
16.6
2.1
1.9
12.1
12.3
1.6
1.3
Simplex Infra
Neutral
311
-
1,536
5,955
6,829
10.3
10.5
16.0
31.0
19.4
10.0
1.0
0.9
5.3
9.9
0.8
0.7
Power Mech Projects
Neutral
613
-
901
1,539
1,801
12.8
12.7
59.0
72.1
10.4
8.5
1.6
1.3
18.6
16.8
0.6
0.5
Sadbhav Engineering
Neutral
347
-
5,960
3,481
4,219
10.7
10.8
8.0
12.0
43.4
29.0
4.0
3.6
10.3
13.5
2.0
1.6
NBCC
Accumulate
958
1,089
11,496
7,382
9,506
7.7
8.6
39.8
54.4
24.1
17.6
5.8
4.6
26.7
29.1
1.3
1.0
SIPL
Neutral
97
-
3,424
675
1,042
62.4
64.7
-
-
3.6
4.2
-
-
16.8
11.3
Financials
Allahabad Bank
Neutral
68
-
4,081
8,569
9,392
2.8
2.9
16.3
27.5
4.2
2.5
0.4
0.3
7.6
11.9
-
-
Stock Watch
December 15, 2015
Company Name
Reco
CMP
Target
Mkt Cap
Sales ( Čcr )
OPM(%)
EPS (Č)
PER(x)
P/BV(x)
RoE(%)
EV/Sales(x)
(Č)
Price ( Č)
( Č cr )
FY16E
FY17E
FY16E
FY17E
FY16E
FY17E
FY16E
FY17E
FY16E
FY17E
FY16E
FY17E
FY16E
FY17E
Financials
Axis Bank
Buy
431
630
102,490
26,473
31,527
3.5
3.6
35.7
43.5
12.1
9.9
2.3
2.0
17.9
18.9
-
-
Bank of Baroda
Neutral
157
-
36,129
18,485
21,025
1.9
2.0
13.5
21.1
11.7
7.4
0.9
0.8
7.3
10.6
-
-
Bank of India
Neutral
116
-
9,162
15,972
17,271
1.9
2.0
15.3
33.4
7.6
3.5
0.3
0.3
3.6
7.6
-
-
Canara Bank
Neutral
242
-
13,165
15,441
16,945
2.0
2.1
46.6
70.4
5.2
3.4
0.5
0.4
8.0
11.2
-
-
Dena Bank
Neutral
41
-
2,655
3,440
3,840
2.1
2.3
7.3
10.0
5.7
4.1
0.4
0.4
6.1
7.9
-
-
Federal Bank
Neutral
54
-
9,196
3,477
3,999
3.0
3.0
5.0
6.2
10.7
8.6
1.1
1.0
10.6
11.9
-
-
HDFC
Neutral
1,188
-
187,466
10,358
11,852
3.3
3.3
41.1
47.0
28.9
25.3
5.5
5.0
24.7
24.9
-
-
HDFC Bank
Buy
1,055
1,262
266,251
38,309
47,302
4.3
4.3
49.3
61.1
21.4
17.3
3.7
3.2
18.5
19.7
-
-
ICICI Bank
Buy
249
354
144,688
34,279
39,262
3.3
3.3
21.0
24.4
11.9
10.2
2.0
1.7
14.4
14.7
-
-
IDBI Bank
Neutral
83
-
13,289
9,625
10,455
1.8
1.8
8.5
14.2
9.7
5.8
0.6
0.5
5.9
9.3
-
-
Indian Bank
Neutral
114
-
5,480
6,160
6,858
2.5
2.5
24.5
29.8
4.7
3.8
0.4
0.3
7.7
8.6
-
-
LIC Housing Finance
Buy
473
571
23,871
3,101
3,745
2.5
2.5
33.0
40.2
14.4
11.8
2.7
2.3
19.7
20.5
-
-
Oriental Bank
Neutral
134
-
4,013
7,643
8,373
2.4
2.4
37.2
45.4
3.6
3.0
0.3
0.3
8.2
9.4
-
-
Punjab Natl.Bank
Neutral
125
-
24,486
23,638
26,557
2.8
2.8
17.9
27.2
7.0
4.6
0.7
0.6
8.5
12.0
-
-
South Ind.Bank
Neutral
19
-
2,613
1,965
2,185
2.5
2.5
2.5
3.3
7.8
5.9
0.8
0.7
9.5
11.7
-
-
St Bk of India
Buy
227
283
175,827
82,520
93,299
2.7
2.8
20.0
24.5
11.3
9.3
1.2
1.1
11.5
12.8
-
-
Union Bank
Neutral
145
-
9,937
12,646
14,129
2.3
2.4
31.0
39.1
4.7
3.7
0.5
0.4
9.8
11.4
-
-
Vijaya Bank
Neutral
34
-
2,895
3,536
3,827
1.9
1.9
5.5
6.7
6.1
5.1
0.5
0.5
7.8
8.8
-
-
Yes Bank
Buy
682
921
28,599
7,190
9,011
3.2
3.3
58.2
69.7
11.7
9.8
2.1
1.8
19.2
19.6
-
-
FMCG
Asian Paints
Neutral
874
-
83,853
16,553
19,160
16.0
16.2
17.7
21.5
49.5
40.7
13.1
11.8
29.4
31.2
4.8
4.1
Britannia
Neutral
2,833
-
33,991
8,065
9,395
9.6
10.2
47.2
65.5
60.0
43.3
20.0
18.9
38.3
41.2
4.0
3.4
Colgate
Neutral
985
-
26,789
4,836
5,490
19.5
19.7
48.5
53.2
20.3
18.5
14.9
13.0
99.8
97.5
5.4
4.7
Dabur India
Neutral
267
-
46,881
9,370
10,265
17.1
17.2
7.3
8.1
36.3
32.9
11.0
8.9
33.7
30.6
4.9
4.5
GlaxoSmith Con*
Neutral
6,367
-
26,776
4,919
5,742
17.2
17.4
168.3
191.2
37.8
33.3
10.7
9.1
28.8
28.9
5.0
4.2
Godrej Consumer
Neutral
1,268
-
43,164
10,168
12,886
16.1
16.1
32.1
38.4
39.5
33.0
8.0
7.4
19.7
21.0
4.3
3.4
HUL
Neutral
837
-
181,159
34,940
38,957
17.5
17.7
20.8
24.7
40.3
33.9
44.8
35.8
110.5
114.2
4.9
4.4
ITC
Buy
320
382
256,757
41,068
45,068
37.8
37.4
13.9
15.9
23.0
20.1
7.7
6.8
34.1
33.8
5.9
5.3
Marico
Neutral
430
-
27,748
6,551
7,766
15.7
16.0
10.4
12.5
41.4
34.4
12.0
10.0
33.2
32.4
4.1
3.5
Nestle*
Accumulate
5,865
6,646
56,546
11,291
12,847
22.2
22.3
158.9
184.6
36.9
31.8
19.3
17.4
55.0
57.3
4.9
4.2
Stock Watch
December 15, 2015
Company Name
Reco
CMP
Target
Mkt Cap
Sales ( Čcr )
OPM(%)
EPS (Č)
PER(x)
P/BV(x)
RoE(%)
EV/Sales(x)
(Č)
Price ( Č)
( Č cr )
FY16E FY17E
FY16E
FY17E
FY16E
FY17E
FY16E
FY17E
FY16E
FY17E
FY16E
FY17E
FY16E
FY17E
FMCG
Tata Global
Accumulate
134
144
8,479
8,635
9,072
9.8
9.9
6.5
7.6
20.7
17.7
2.1
2.0
6.8
7.4
0.9
0.9
IT
HCL Tech^
Buy
841
1,132
118,536
42,038
47,503
23.2
23.5
55.8
62.9
15.1
13.4
3.5
2.7
23.0
19.8
2.4
1.9
Infosys
Buy
1,070
1,306
245,658
60,250
66,999
28.0
28.0
58.3
63.7
18.3
16.8
3.9
3.3
20.9
19.7
3.3
2.8
TCS
Buy
2,377
3,165
468,459
111,274
126,852
28.4
28.7
125.4
143.9
19.0
16.5
7.5
6.9
39.9
42.2
3.8
3.3
Tech Mahindra
Buy
543
646
52,463
25,566
28,890
16.0
17.0
26.3
31.9
20.6
17.0
3.7
3.2
17.9
18.6
1.8
1.5
Wipro
Buy
567
719
140,138
52,414
58,704
23.7
23.8
38.4
42.3
14.8
13.4
2.9
2.6
19.5
18.0
2.2
1.8
Media
D B Corp
Accumulate
330
356
6,071
2,241
2,495
27.8
27.9
21.8
25.6
15.2
12.9
4.0
3.5
26.7
28.5
2.6
2.3
HT Media
Neutral
80
-
1,868
2,495
2,603
11.2
11.2
7.3
8.6
11.0
9.3
0.9
0.8
7.4
8.1
0.3
0.2
Jagran Prakashan
Accumulate
153
169
4,992
2,170
2,355
27.2
26.2
8.9
9.9
17.2
15.4
3.6
3.1
20.9
20.5
2.2
2.0
Sun TV Network
Neutral
381
-
14,999
2,779
3,196
70.2
70.5
22.8
27.3
16.7
13.9
4.1
3.7
26.7
28.3
5.1
4.4
Hindustan Media
Neutral
278
-
2,040
920
1,031
20.0
20.0
19.2
20.9
14.5
13.3
2.4
2.0
16.4
15.3
1.8
1.6
Ventures
Metals & Mining
Coal India
Buy
316
380
199,408
76,167
84,130
19.9
22.3
22.4
25.8
14.1
12.2
5.1
5.0
35.5
41.0
1.9
1.7
Hind. Zinc
Buy
141
175
59,619
14,641
14,026
50.4
50.4
17.7
16.0
8.0
8.8
1.2
1.1
16.2
13.2
1.7
1.5
Hindalco
Neutral
79
-
16,231
104,356
111,186
8.7
9.5
6.7
11.1
11.7
7.1
0.4
0.4
3.5
5.9
0.7
0.6
JSW Steel
Neutral
1,022
-
24,703
42,308
45,147
16.4
20.7
(10.3)
49.5
20.7
1.1
1.1
(1.0)
5.6
1.6
1.5
NMDC
Neutral
88
-
34,771
8,237
10,893
46.6
44.5
10.0
11.7
8.8
7.5
1.0
0.9
12.5
13.0
4.0
3.1
SAIL
Neutral
46
-
18,854
45,915
53,954
7.2
10.5
1.5
4.4
30.3
10.4
0.4
0.4
2.3
4.1
1.1
0.9
Vedanta
Neutral
84
-
24,992
71,445
81,910
26.2
26.3
12.9
19.2
6.5
4.4
0.5
0.4
7.2
8.9
0.8
0.6
Tata Steel
Neutral
245
-
23,800
126,760
137,307
8.9
11.3
6.4
23.1
38.5
10.6
0.8
0.8
2.0
7.1
0.8
0.7
Oil & Gas
Cairn India
Neutral
125
-
23,426
11,323
12,490
49.4
51.0
20.7
20.7
6.0
6.1
0.4
0.4
6.4
6.1
1.2
0.5
GAIL
Neutral
340
-
43,154
64,856
70,933
9.1
9.6
24.0
28.9
14.2
11.8
1.2
1.1
8.8
9.6
0.8
0.8
ONGC
Neutral
213
-
182,617
154,564
167,321
36.8
37.4
28.6
32.5
7.5
6.6
1.0
0.9
12.7
13.5
1.4
1.3
Petronet LNG
Neutral
243
-
18,199
29,691
31,188
5.8
6.2
12.8
13.4
19.0
18.1
2.8
2.5
15.8
14.8
0.7
0.6
Indian Oil Corp
Accumulate
414
455
100,517
359,607
402,760
5.9
6.1
42.5
48.7
9.8
8.5
1.3
1.2
14.1
14.4
0.4
0.3
Reliance Industries
Accumulate
955
1,050
309,490
304,775
344,392
12.6
13.4
91.3
102.6
10.5
9.3
1.2
1.1
11.8
12.0
0.9
0.8
Pharmaceuticals
Alembic Pharma
Neutral
668
-
12,595
2,658
3,112
24.1
20.2
24.6
23.9
27.2
28.0
9.7
7.5
42.5
30.2
4.7
4.0
Aurobindo Pharma
Accumulate
823
872
48,069
14,923
17,162
23.0
23.0
38.2
43.6
21.6
18.9
6.6
5.0
36.0
30.2
3.5
3.0
Aventis*
Neutral
4,326
-
9,963
2,082
2,371
17.4
20.8
118.2
151.5
36.6
28.6
5.4
4.3
19.9
25.5
4.4
3.7
Cadila Healthcare
Neutral
397
-
40,663
10,224
11,840
21.0
22.0
14.6
17.6
27.2
22.6
7.5
5.8
30.8
29.0
4.0
3.3
Stock Watch
December 15, 2015
Company Name
Reco
CMP
Target
Mkt Cap
Sales ( Čcr )
OPM(%)
EPS (Č)
PER(x)
P/BV(x)
RoE(%)
EV/Sales(x)
(Č)
Price ( Č)
( Č cr )
FY16E FY17E
FY16E
FY17E
FY16E
FY17E
FY16E
FY17E
FY16E
FY17E
FY16E
FY17E
FY16E
FY17E
Pharmaceuticals
Cipla
Neutral
639
-
51,339
14,211
16,611
20.6
19.0
27.0
28.9
23.7
22.1
4.0
3.4
18.4
16.8
3.6
3.0
Dr Reddy's
Buy
3,005
3,933
51,237
16,838
19,575
25.0
23.1
167.5
178.8
17.9
16.8
3.8
3.2
23.1
20.4
2.9
2.5
Dishman Pharma
Neutral
322
-
2,597
1,733
1,906
21.5
21.5
17.0
19.9
18.9
16.2
1.9
1.7
10.5
11.2
2.0
1.7
GSK Pharma*
Neutral
3,294
-
27,905
2,870
3,158
20.0
22.1
59.5
68.3
55.4
48.2
16.3
16.8
28.5
34.3
9.0
8.3
Indoco Remedies
Neutral
315
-
2,900
1,033
1,199
15.9
18.2
9.4
13.6
33.5
23.1
5.0
4.2
15.7
19.7
2.9
2.5
Ipca labs
Buy
754
900
9,516
3,363
3,909
12.9
18.6
13.4
28.0
56.3
26.9
4.0
3.5
7.4
14.0
3.1
2.7
Lupin
Neutral
1,747
-
78,700
13,092
16,561
25.0
27.0
50.4
68.3
34.7
25.6
7.2
5.7
22.8
24.7
5.7
4.4
Sun Pharma
Buy
769
950
184,972
28,163
32,610
25.8
30.7
17.4
26.9
44.2
28.6
4.2
3.6
13.0
16.6
5.9
4.9
Power
Tata Power
Neutral
62
-
16,661
35,923
37,402
22.6
22.8
4.1
5.2
15.2
12.0
1.2
1.1
7.5
9.3
1.4
1.3
NTPC
Buy
133
157
109,459
87,064
98,846
23.5
23.5
11.7
13.2
11.3
10.1
1.3
1.2
11.4
12.1
2.3
2.0
Power Grid
Buy
128
170
66,964
20,702
23,361
86.7
86.4
12.1
13.2
10.6
9.7
1.6
1.4
15.6
15.1
8.2
7.6
Telecom
Bharti Airtel
Neutral
306
-
122,380
101,748
109,191
32.1
31.7
12.0
12.5
25.5
24.5
1.8
1.7
6.9
6.7
1.9
1.7
Idea Cellular
Neutral
135
-
48,600
34,282
36,941
32.0
31.5
5.9
6.2
22.9
21.8
2.1
1.9
9.9
9.3
2.0
1.9
zOthers
Abbott India
Neutral
5,446
-
11,572
2,715
3,153
14.5
14.1
134.3
152.2
40.6
35.8
10.1
8.3
27.4
25.6
4.0
3.3
Bajaj Electricals
Buy
204
341
2,059
4,719
5,287
5.2
5.8
8.6
12.7
23.8
16.1
2.7
2.4
11.4
14.8
0.4
0.4
Finolex Cables
Neutral
252
-
3,854
2,520
2,883
12.2
12.0
12.7
14.2
19.9
17.8
2.7
2.4
13.6
13.5
1.3
1.1
Goodyear India*
Accumulate
557
622
1,285
1,888
1,680
12.1
11.9
62.2
56.6
9.0
9.9
2.1
1.8
25.9
19.7
0.4
0.4
Hitachi
Neutral
1,307
-
3,554
1,779
2,081
7.8
8.8
21.8
33.4
60.0
39.1
9.7
7.8
17.4
22.1
2.1
1.8
Jyothy Laboratories
Neutral
304
-
5,513
1,620
1,847
11.5
11.5
7.3
8.5
41.8
35.9
5.4
5.0
13.3
14.4
3.2
2.8
MRF
Buy
38,606
45,575
16,373
20,316
14,488
21.4
21.1
5,488.0
3,798.0
7.0
10.2
2.4
2.0
41.1
21.2
0.8
1.0
Page Industries
Neutral
12,633
-
14,091
1,929
2,450
19.8
20.1
229.9
299.0
55.0
42.3
24.3
16.9
52.1
47.1
7.4
5.8
Relaxo Footwears
Neutral
483
-
5,794
1,767
2,152
12.3
12.5
19.3
25.1
25.1
19.3
6.2
4.7
27.7
27.8
3.3
2.7
Siyaram Silk Mills
Buy
1,102
1,354
1,033
1,636
1,815
11.5
11.5
89.9
104.1
12.3
10.6
2.0
1.8
17.9
17.8
0.8
0.7
Styrolution ABS India*
Neutral
700
-
1,231
1,271
1,440
8.6
9.2
32.0
41.1
21.9
17.1
2.2
2.0
10.7
12.4
0.9
0.8
TVS Srichakra
Buy
2,693
3,240
2,062
2,101
2,338
15.7
15.0
248.6
270.0
10.8
10.0
4.7
3.4
43.6
34.0
1.0
0.9
HSIL
Neutral
298
-
2,155
2,123
2,384
16.1
16.5
15.0
18.9
19.8
15.8
1.5
1.4
8.0
9.4
1.4
1.2
Kirloskar Engines India
Neutral
247
-
3,571
2,471
2,826
8.8
10.4
9.1
13.3
27.1
18.5
2.6
2.4
9.7
13.4
1.1
1.0
Ltd
M M Forgings
Buy
519
614
626
511
615
21.7
21.6
43.1
55.8
12.0
9.3
2.2
1.8
19.9
21.2
1.4
1.1
Banco Products (India)
Neutral
141
-
1,009
1,208
1,353
11.0
12.3
10.8
14.5
13.1
9.8
1.5
1.3
11.9
14.5
0.8
0.7
Stock Watch
December 15, 2015
Company Name
Reco
CMP
Target Mkt Cap
Sales ( Čcr )
OPM(%)
EPS (Č)
PER(x)
P/BV(x)
RoE(%)
EV/Sales(x)
(Č)
Price ( Č)
( Č cr )
FY16E FY17E FY16E FY17E FY16E FY17E FY16E FY17E FY16E FY17E FY16E FY17E FY16E FY17E
zOthers
Competent Automobiles Neutral
138
-
85
1,040
1,137
3.2
3.1
25.7
28.0
5.4
4.9
0.8
0.7
15.0
14.3
0.1
0.1
Nilkamal
Neutral
994
-
1,483
1,910
2,083
10.5
10.3
63.3
69.2
15.7
14.4
2.6
2.2
17.6
16.5
0.8
0.7
Visaka Industries
Buy
124
144
197
1,086
1,197
9.9
10.3
21.5
28.8
5.8
4.3
0.6
0.5
9.6
11.6
0.4
0.3
Transport Corporation of
Neutral
310
-
2,362
2,830
3,350
8.8
9.0
14.4
18.3
21.6
17.0
3.3
2.9
15.4
17.1
1.0
0.8
India
Elecon Engineering
Neutral
85
-
928
1,369
1,533
13.7
14.9
3.3
6.1
25.7
14.1
1.7
1.6
6.6
11.4
1.0
0.9
Surya Roshni
Buy
133
183
585
2,992
3,223
8.1
8.4
14.7
18.3
9.1
7.3
0.9
0.8
9.7
11.0
0.5
0.4
MT Educare
Buy
137
169
547
286
366
18.3
17.7
7.7
9.4
17.8
14.7
3.7
3.3
20.2
21.1
1.8
1.3
Radico Khaitan
Buy
110
156
1,461
1,565
1,687
12.2
13.0
5.7
7.1
19.3
15.5
1.6
1.5
8.3
9.6
1.4
1.2
Garware Wall Ropes
Accumulate
386
423
845
861
967
10.9
10.9
24.0
28.2
16.1
13.7
2.4
2.0
14.6
14.9
1.0
0.8
Wonderla Holidays
Neutral
369
-
2,083
206
308
44.0
43.6
9.0
12.9
41.0
28.6
5.6
5.1
13.7
17.8
10.1
6.7
Linc Pen & Plastics
Neutral
185
-
274
340
371
8.3
8.9
10.8
13.2
17.1
14.0
2.7
2.4
16.0
17.1
0.8
0.8
The Byke Hospitality
Accumulate
163
181
652
222
287
20.5
20.5
5.6
7.6
28.8
21.5
5.4
4.5
18.9
20.8
3.0
2.3
Interglobe Aviation
Neutral
1,093
-
39,389
17,022
21,122
20.7
14.5
63.9
53.7
17.1
20.4
25.6
21.0
149.9
103.2
2.2
1.8
Coffee Day Enterprises
Neutral
254
-
5,226
2,692
2,964
17.0
18.6
-
4.7
-
53.5
3.1
2.9
0.2
5.5
2.4
2.2
Ltd
Navneet Education
Buy
82
97
1,941
998
1,062
24.1
24.0
5.8
6.1
14.2
13.4
3.1
2.8
22.0
20.6
2.0
1.9
Source: Company, Angel Research; Note: *December year end; #September year end; &October year end; Price as on December 14, 2015
Market Outlook
December 15, 2015
Research Team Tel: 022 - 39357800
DISCLAIMER
Angel Broking Private Limited (hereinafter referred to as “Angel”) is a registered Member of National Stock Exchange of India Limited,
Bombay Stock Exchange Limited and Metropolitian Stock Exchange of India Limited. It is also registered as a Depository Participant with
CDSL and Portfolio Manager with SEBI. It also has registration with AMFI as a Mutual Fund Distributor. Angel Broking Private Limited is a
registered entity with SEBI for Research Analyst in terms of SEBI (Research Analyst) Regulations, 2014 vide registration number
INH000000164. Angel or its associates has not been debarred/ suspended by SEBI or any other regulatory authority for accessing
/dealing in securities Market. Angel or its associates including its relatives/analyst do not hold any financial interest/beneficial ownership
of more than 1% in the company covered by Analyst. Angel or its associates/analyst has not received any compensation / managed or co
-managed public offering of securities of the company covered by Analyst during the past twelve months. Angel/analyst has not served as
an officer, director or employee of company covered by Analyst and has not been engaged in market making activity of the company
covered by Analyst.
This document is solely for the personal information of the recipient, and must not be singularly used as the basis of any investment
decision. Nothing in this document should be construed as investment or financial advice. Each recipient of this document should make
such investigations as they deem necessary to arrive at an independent evaluation of an investment in the securities of the companies
referred to in this document (including the merits and risks involved), and should consult their own advisors to determine the merits and
risks of such an investment.
Reports based on technical and derivative analysis center on studying charts of a stock's price movement, outstanding positions and
trading volume, as opposed to focusing on a company's fundamentals and, as such, may not match with a report on a company's
fundamentals.
The information in this document has been printed on the basis of publicly available information, internal data and other reliable sources
believed to be true, but we do not represent that it is accurate or complete and it should not be relied on as such, as this document is for
general guidance only. Angel Broking Pvt. Limited or any of its affiliates/ group companies shall not be in any way responsible for any
loss or damage that may arise to any person from any inadvertent error in the information contained in this report. Angel Broking Pvt.
Limited has not independently verified all the information contained within this document. Accordingly, we cannot testify, nor make any
representation or warranty, express or implied, to the accuracy, contents or data contained within this document. While Angel Broking
Pvt. Limited endeavors to update on a reasonable basis the information discussed in this material, there may be regulatory, compliance,
or other reasons that prevent us from doing so.
This document is being supplied to you solely for your information, and its contents, information or data may not be reproduced,
redistributed or passed on, directly or indirectly.
Neither Angel Broking Pvt. Limited, nor its directors, employees or affiliates shall be liable for any loss or damage that may arise from or
in connection with the use of this information.
Note: Please refer to the important ‘Stock Holding Disclosure' report on the Angel website (Research Section). Also, please refer to the
latest update on respective stocks for the disclosure status in respect of those stocks. Angel Broking Pvt. Limited and its affiliates may have
investment positions in the stocks recommended in this report.