Market Outlook
September 15, 2015
Dealer’s Diary
Domestic Indices
Chg (%)
(Pts)
(Close)
BSE Sensex
1.0
246
25,857
Indian markets are expected to open on a Flat note tracking the SGX Nifty and
global markets.
Nifty
1.1
83
7,872
MID CAP
1.3
133
10,653
The US markets closed marginally negative as most traders awaited the outcome of
SMALL CAP
0.9
94
10,793
FOMC meet as well as data on the economic front that will be announced this week,
BSE HC
1.3
212
17,133
starting today. Vital data that is set to be announced this week includes US industrial
BSE PSU
1.8
120
6,715
Production, CPI and Housing Starts.
BANKEX
1.9
358
19,352
Most of the European markets ended in the negative territory citing lower than
AUTO
0.4
62
17,710
estimated Chinese industrial production data which elevated concerns of
METAL
2.7
195
7,393
slowdown in the Chinese economy.
OIL & GAS
1.2
103
8,723
BSE IT
0.6
70
11,098
The Indian markets rallied on Monday on series of positive economic data which
Global Indices
Chg (%)
(Pts)
(Close)
raised expectation of a possible interest cut in the near future. Better than expected
Dow Jones
(0.4)
(62)
16,371
IIP data, narrowing current account deficit and lower WPI Inflation boosted Indian
NASDAQ
(0.3)
(17)
4,806
markets which neglected below than estimated industrial production data from
FTSE
(0.5)
(33)
6,085
China.
Nikkei
(1.6)
(299)
17,966
News & Result Analysis
Hang Seng
0.3
58
21,562
CPI slows to 3.66%, WPI dips to historic lows
Straits Times
(0.6)
(17)
2,871
Refer detailed news analysis on the following page
Shanghai Com
(2.7)
(85)
3,115
Markets Today
The trend deciding level for the day is 25,672 / 7,805 levels. If NIFTY trades above
Indian ADR
Chg (%)
(Pts)
(Close)
this level during the first half-an-hour of trade then we may witness a further rally up
INFY
(0.1)
(0.0)
$17.7
to 25,814 - 26,018 / 7,
849 - 7,910 levels. However, if NIFTY trades below
WIT
0.0
0.0
$11.7
25,672 / 7,805 levels for the first half-an-hour of trade then it may correct towards
IBN
1.4
0.1
$8.4
25,468 - 25,327 / 7,745 - 7,700 levels.
HDB
1.9
1.1
$57.7
Indices
S2
S1
PIVOT
R1
R2
SENSEX
25,327
25,468
25,672
25,814
26,018
Advances / Declines
BSE
NSE
NIFTY
7,700
7,745
7,805
7,849
7,910
Advances
1,723
1,076
Declines
943
444
Net Inflows (September 11, 2015)
Unchanged
109
61
` cr
Purch
Sales
Net
MTD
YTD
FII
2,695
3,194
(498)
(6,050)
117,711
Volumes (` cr)
MFs
592
647
(55)
4,127
74,775
BSE
1,980
NSE
12,379
FII Derivatives (September 14, 2015)
` cr
Purch
Sales
Net
Open Interest
Index Futures
1,084
1,118
(34)
22,666
Stock Futures
2,139
1,651
488
46,823
Gainers / Losers
Gainer
Loser
Company
Price (`)
chg (%)
Company
Price (`)
chg (%)
JUSTDIAL
927
13.5
SUNASIAN
134
(5.0)
AXISBANK
53
13.1
DEN
122
(4.2)
JKTYRE
ADANIENT
77
11.1
105
(3.5)
STAR
1,187
7.5
REDINGTON
104
(3.1)
WELCORP
115
6.8
ECLERX
1,734
(2.8)
Market Outlook
September 15, 2015
CPI slows to 3.66%, WPI dips to historic lows
India’s August retail inflation CPI slowed down for second straight month and to
lowest level in four years to 3.66%, marginally lower than 3.78% in July.
Wholesale Price Index-based inflation which has been in the negative zone since
November 2014 has dipped to its historic lows. The WPI for August dipped to -
4.95% against estimates of -4.36% and 3.85% in August 2014. Food inflation
came in flat at 2.20%. Vegetables, was -6.36%.
Economic and Political News
Government panel okays 20% safeguard duty on select imported steel
products
WPI dips to -4.95% against estimate of -4.36%, CPI slows
Corporate News
Ashoka Buildcon bags two orders worth `440cr from Karnataka Road
Development Corporation Ltd
Bidders for `2,600cr power subsidy to be announced today
Foreign investors allowed to buy upto 40% in Maruti Suzuki
Market Outlook
September 15, 2015
Top Picks
Large Cap
Market Cap
CMP
Target
Upside
Company
Sector
Rating
(` Cr)
(`)
(`)
(%)
Aurobindo
Pharma
41,678
Buy
714
872
22.2
Axis Bank
Financials
1,17,919
Buy
496
701
41.3
ICICI Bank
Financials
1,57,948
Buy
272
370
36.0
Infosys
IT
2,52,147
Buy
1,098
1,306
19.0
Inox Wind
Capital Goods
8,349
Buy
376
505
34.2
LIC HFL
Financials
22,172
Buy
439
570
29.7
Power Grid
Power
66,650
Buy
127
170
33.4
TCS
IT
4,99,623
Buy
2,551
3,168
24.2
Tech Mahindra IT
50,641
Buy
526
646
22.7
Yes Bank
Financials
30,605
Buy
731
953
30.3
Sun Pharma
Pharma
2,06,268 Accumulate
857
950
10.8
Source: Angel Research, Bloomberg
Mid Cap
Market Cap (`
CMP
Target
Upside
Company
Sector
Rating
Cr)
(`)
(`)
(%)
Bajaj Electricals
Others
2,534
Buy
251
341
35.7
Garware Wall RopesOthers
638
Buy
292
390
33.8
MBL Infrastructures Construction
1,024
Buy
247
360
45.8
Minda Industries
Auto Ancillary
810
Buy
510
652
27.8
MT Educare
Others
510
Buy
128
169
32.1
Radico Khaitan
Others
1,133
Buy
85
112
31.5
Surya Roshni
Others
528
Buy
120
183
51.9
Tree House
Others
1,549
Buy
366
449
22.7
Source: Angel Research, Bloomberg
Market Outlook
September 15, 2015
Global economic events release calendar
Date
Time
Country Event Description
Unit
Period
Bloomberg Data
Last Reported Estimated
September 15, 2015
6:45PM
US
Industrial Production
%
Aug
0.56
(0.20)
2:00PM
UK
CPI (YoY)
% Change
Aug
0.10
--
September 16, 2015
2:00PM
UK
Jobless claims change
% Change
Aug
(4.90)
(5.00)
2:30PM
Euro Zone Euro-Zone CPI (YoY)
%
Aug F
0.20
0.20
6:00PM
US
Consumer price index (mom)
% Change
Aug
0.10
(0.10)
September 17, 2015
6:00PM
US
Initial Jobless claims
Thousands
Sep 12
275.00
277.00
6:00PM
US
Building permits
Thousands
Aug
1,130.00
1,155.00
6:00PM
US
Housing Starts
Thousands
Aug
1,206.00
1,170.00
11:30PM
US
FOMC rate decision
%
Sep 17
0.25
0.38
September 21, 2015
7:30PM
US
Existing home sales
Million
Aug
5.59
5.50
September 22, 2015
7:30PM
Euro Zone Euro-Zone Consumer Confidence
Value
Sep A
(6.90)
--
September 23, 2015
1:00PM
Germany PMI Services
Value
Sep P
54.90
--
1:00PM
Germany PMI Manufacturing
Value
Sep P
53.30
--
September 24, 2015
7:30PM
US
New home sales
Thousands
Aug
507.00
515.00
September 25, 2015
6:00PM
US
GDP Qoq (Annualised)
% Change
2Q T
3.70
3.70
September 29, 2015
7:30PM
US
Consumer Confidence
S.A./ 1985=100
Sep
101.54
--
11:00AM
India
RBI Reverse Repo rate
%
Sep 29
6.25
--
11:00AM
India
RBI Repo rate
%
Sep 29
7.25
--
11:00AM
India
RBI Cash Reserve ratio
%
Sep 29
4.00
--
September 30, 2015
1:25PM
Germany Unemployment change (000's)
Thousands
Sep
(7.00)
--
2:00PM
UK
GDP (YoY)
% Change
2Q F
2.60
--
October 1, 2015
6:30AM
China
PMI Manufacturing
Value
Sep
49.70
--
2:00PM
UK
PMI Manufacturing
Value
Sep
51.50
--
October 2, 2015
6:00PM
US
Change in Nonfarm payrolls
Thousands
Sep
173.00
--
6:00PM
US
Unnemployment rate
%
Sep
5.10
--
October 7, 2015
2:00PM
UK
Industrial Production (YoY)
% Change
Aug
0.80
--
October 8, 2015
4:30PM
UK
BOE Announces rates
% Ratio
Oct 8
0.50
0.50
October 12, 2015
5:30PM
India
Industrial Production YoY
% Change
Aug
4.20
--
October 13, 2015
China
Exports YoY%
% Change
Sep
(5.50)
--
October 14, 2015
7:00AM
China
Consumer Price Index (YoY)
% Change
Sep
2.00
--
October 19, 2015
7:30AM
China
Industrial Production (YoY)
% Change
Sep
6.10
--
7:30AM
China
Real GDP (YoY)
% Change
3Q
7.00
--
October 22, 2015
5:15PM
Euro Zone ECB announces interest rates
%
Oct 22
0.05
--
Source: Bloomberg, Angel Research
Market Outlook
September 15, 2015
Macro watch
Exhibit 1: Quarterly GDP trends
Exhibit 2: IIP trends
(%)
(%)
9.0
8.4
6.0
5.2
4.8
4.4
4.2
5.0
8.0
7.5
7.5
3.6
4.0
3.4
7.0
7.0
2.8
2.6
2.5
2.5
6.7
6.7
6.6
3.0
7.0
6.3
6.4
2.0
6.0
1.0
5.0
4.7
-
5.0
(1.0)
4.0
(2.0)
(3.0)
3.0
(2.7)
(4.0)
Source: CSO, Angel Research
Source: MOSPI, Angel Research
Exhibit 3: Monthly CPI inflation trends
Exhibit 4: Manufacturing and services PMI
(%)
56.0
Mfg. PMI
Services PMI
5.6
6.0
5.4
5.3
5.4
54.0
5.2
5.0
4.9
4.6
5.0
4.3
52.0
3.7
3.7
4.0
3.3
50.0
3.0
2.0
48.0
1.0
46.0
-
44.0
Source: Market, Angel Research; Note: Level above 50 indicates expansion
Source: MOSPI, Angel Research
Exhibit 5: Exports and imports growth trends
Exhibit 6: Key policy rates
(%)
Exports yoy growth
Imports yoy growth
(%)
Repo rate
Reverse Repo rate
CRR
30.0
9.00
20.0
8.00
10.0
7.00
0.0
6.00
(10.0)
5.00
(20.0)
4.00
(30.0)
3.00
Source: Bloomberg, Angel Research
Source: RBI, Angel Research
Market Outlook
September 15, 2015
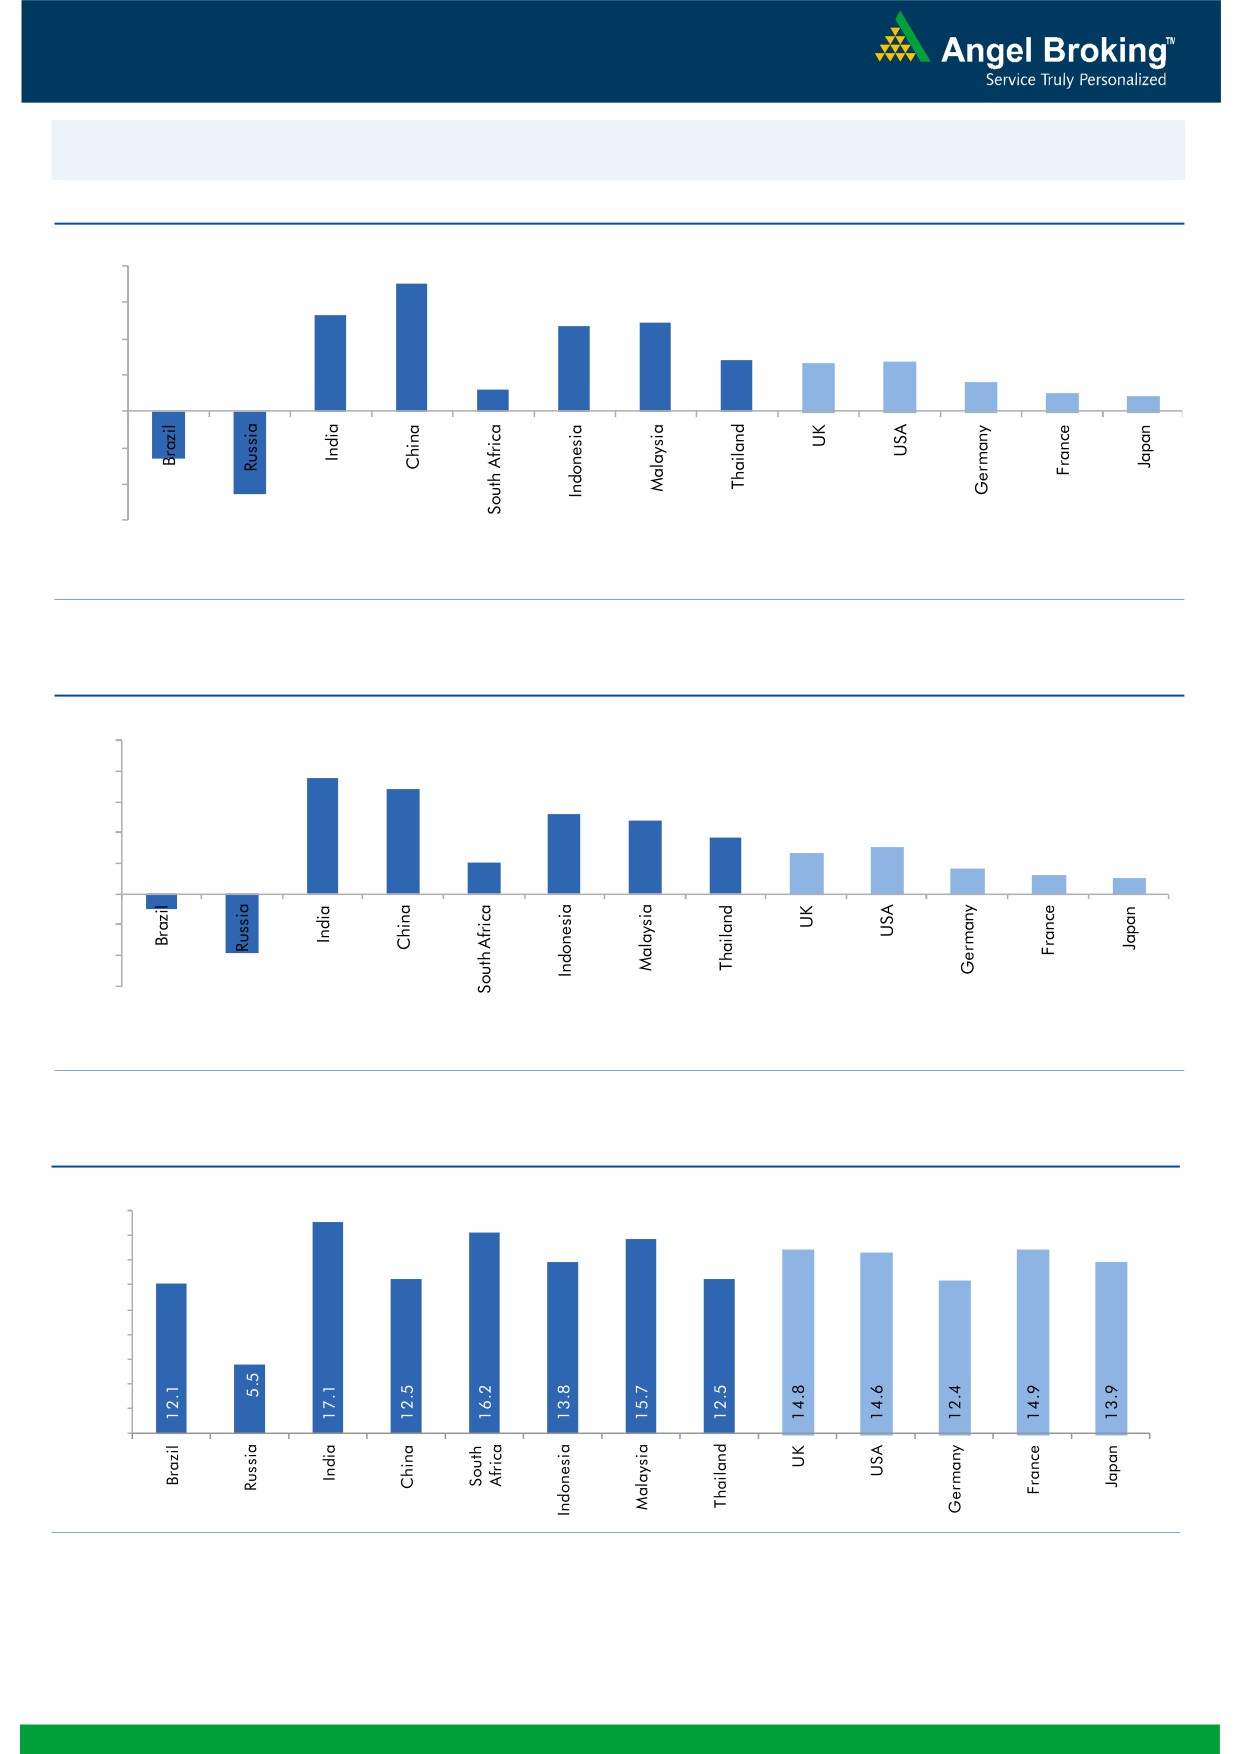
Global watch
Exhibit 1: Latest quarterly GDP Growth (%, yoy) across select developing and developed countries
(%)
8.0
7.0
6.0
5.3
4.9
4.7
4.0
2.8
2.6
2.7
1.6
2.0
1.2
1.0
0.8
(4.6)
(2.6)
-
(2.0)
(4.0)
(6.0)
Source: Bloomberg, Angel Research
Exhibit 2: 2015 GDP Growth projection by IMF (%, yoy) across select developing and developed countries
(%)
10.0
7.5
8.0
6.8
5.2
6.0
4.8
3.7
4.0
2.7
3.1
2.0
1.6
1.2
1.0
2.0
(3.8)
(1.0)
-
(2.0)
(4.0)
(6.0)
Source: IMF, Angel Research
Exhibit 3: One year forward P-E ratio across select developing and developed countries
(x)
18.0
16.0
14.0
12.0
10.0
8.0
6.0
4.0
2.0
-
Source: Bloomberg, Angel Research
Market Outlook
September 15, 2015
Exhibit 4: Relative performance of indices across globe
Returns (%)
Country
Name of index
Closing price
1M
3M
1YR
Brazil
Bovespa
47,282
(2.3)
(11.4)
(19.4)
Russia
Micex
1,730
1.5
3.7
19.3
India
Nifty
7,872
(5.8)
(2.2)
(3.7)
China
Shanghai Composite
3,115
(21.5)
(41.0)
33.3
South Africa
Top 40
43,813
(4.5)
(5.0)
(4.4)
Mexico
Mexbol
42,827
(2.4)
(4.2)
(6.5)
Indonesia
LQ45
743
(4.7)
(12.7)
(16.4)
Malaysia
KLCI
1,640
1.8
(5.5)
(12.5)
Thailand
SET 50
894
(2.7)
(10.5)
(14.7)
USA
Dow Jones
16,371
(5.9)
(8.5)
(3.9)
UK
FTSE
6,085
(7.4)
(9.3)
(10.4)
Japan
Nikkei
17,966
(12.8)
(11.9)
14.6
Germany
DAX
10,132
(8.0)
(8.3)
5.0
France
CAC
4,518
(9.4)
(6.6)
1.2
Source: Bloomberg, Angel Research
Market Outlook
September 15, 2015
Stock Watch
Company Name
Reco
CMP
Target
Mkt Cap
Sales ( Čcr )
OPM(%)
EPS (Č)
PER(x)
P/BV(x)
RoE(%)
EV/Sales(x)
(Č)
Price ( Č)
( Č cr )
FY16E FY17E
FY16E
FY17E
FY16E
FY17E
FY16E
FY17E
FY16E
FY17E
FY16E
FY17E
FY16E
FY17E
Agri / Agri Chemical
Rallis
Neutral
222
-
4,321
2,075
2,394
14.4
14.4
9.5
11.0
23.4
20.2
4.7
4.0
21.1
21.3
2.1
1.8
United Phosphorus
Neutral
502
-
21,522
13,698
15,752
17.6
17.6
32.1
38.5
15.6
13.0
3.1
2.5
21.4
21.3
1.7
1.4
Auto & Auto Ancillary
Ashok Leyland
Accumulate
90
97
25,485
18,186
21,529
10.8
11.2
3.3
4.5
27.1
19.9
4.6
4.3
17.3
21.6
1.4
1.1
Bajaj Auto
Accumulate
2,311
2,438
66,858
23,544
27,245
19.8
19.8
127.0
143.4
18.2
16.1
5.5
4.7
30.3
29.4
2.4
2.0
Eicher Motors
Buy
18,837
22,859
51,127
11,681
15,550
15.3
16.9
358.5
564.3
52.5
33.4
15.8
11.7
29.8
34.9
4.3
3.2
Hero Motocorp
Accumulate
2,349
2,672
46,899
28,500
32,764
14.1
14.3
146.9
167.0
16.0
14.1
6.1
5.1
37.8
36.5
1.5
1.3
L G Balakrishnan & Bros Neutral
444
-
697
1,254
1,394
11.6
11.8
35.9
41.7
12.4
10.7
1.7
1.5
13.5
13.8
0.7
0.6
Mahindra and Mahindra Buy
1,172
1,383
72,801
38,337
43,069
13.0
13.4
52.9
63.5
22.2
18.5
3.3
2.9
15.0
15.9
1.6
1.3
Maruti
Accumulate
4,320
4,735
130,503
58,102
68,587
16.7
16.9
182.0
225.5
23.7
19.2
4.7
4.0
19.9
21.0
2.0
1.7
Minda Industries
Buy
510
652
810
2,567
2,965
7.3
8.0
38.8
54.3
13.2
9.4
1.9
1.6
14.4
16.8
0.4
0.3
Rane Brake Lining
Buy
280
366
222
454
511
11.1
11.4
23.8
28.1
11.8
10.0
1.7
1.5
14.2
15.3
0.6
0.6
Setco Automotive
Neutral
226
-
604
594
741
12.7
13.7
8.4
15.8
26.9
14.3
2.8
2.4
10.4
16.9
1.5
1.2
Tata Motors
Accumulate
347
391
100,114
264,038
297,882
13.8
13.9
34.5
38.9
10.1
8.9
1.7
1.4
17.6
16.8
0.5
0.5
TVS Motor
Neutral
232
-
11,020
11,702
13,713
6.8
7.7
10.1
14.5
23.0
16.0
5.6
4.5
24.5
28.3
0.9
0.8
Amara Raja Batteries
Neutral
954
-
16,301
5,101
6,224
17.8
17.6
31.1
39.2
30.7
24.4
7.6
6.1
24.8
24.8
3.2
2.5
Exide Industries
Accumulate
149
159
12,682
7,363
8,247
13.7
14.5
6.6
7.7
22.6
19.4
2.9
2.6
12.6
13.3
1.5
1.3
Apollo Tyres
Neutral
188
-
9,570
12,576
12,978
16.8
16.1
22.3
19.9
8.4
9.5
1.5
1.3
17.2
13.4
0.8
0.9
Ceat
Neutral
1,207
-
4,883
6,041
6,597
14.3
14.2
101.5
116.6
11.9
10.4
2.4
2.0
20.0
19.1
1.0
0.8
JK Tyres
Neutral
105
-
2,375
7,446
7,669
15.2
14.0
19.6
18.4
5.3
5.7
1.3
1.1
25.2
19.5
0.7
0.6
Swaraj Engines
Accumulate
861
912
1,070
593
677
14.5
14.8
51.2
60.8
16.8
14.2
3.9
3.5
23.3
24.8
1.7
1.4
Subros
Neutral
78
-
467
1,268
1,488
11.6
11.9
3.7
6.6
21.0
11.8
1.4
1.3
6.8
11.4
0.7
0.6
Indag Rubber
Neutral
170
-
446
283
329
17.0
17.2
13.0
15.4
13.1
11.0
2.9
2.4
21.8
21.6
1.3
1.1
Capital Goods
ACE
Neutral
39
-
383
660
839
4.7
8.2
1.0
3.9
38.8
9.9
1.2
1.1
3.2
11.3
0.7
0.6
BEML
Neutral
1,180
-
4,914
3,277
4,006
6.0
8.9
29.2
64.3
40.4
18.4
2.3
2.1
5.7
11.7
1.6
1.2
BGR Energy
Neutral
106
-
767
3,615
3,181
9.5
9.4
16.7
12.4
6.4
8.6
0.6
0.6
10.0
7.0
0.6
0.8
BHEL
Neutral
213
-
52,134
33,722
35,272
10.8
11.7
10.5
14.2
20.3
15.0
1.5
1.4
7.0
9.0
1.6
1.6
Blue Star
Accumulate
340
387
3,059
3,649
4,209
5.0
5.9
9.2
14.7
37.2
23.1
6.7
6.3
9.1
17.5
0.9
0.8
Crompton Greaves
Buy
171
204
10,705
13,484
14,687
4.9
6.2
4.5
7.1
38.0
24.1
2.7
2.5
7.2
10.8
0.9
0.8
Inox Wind
Buy
376
505
8,349
4,980
5,943
17.0
17.5
26.6
31.6
14.1
11.9
4.2
3.1
35.0
30.0
1.8
1.5
Market Outlook
September 15, 2015
Stock Watch
Company Name
Reco
CMP
Target
Mkt Cap
Sales ( Čcr )
OPM(%)
EPS (Č)
PER(x)
P/BV(x)
RoE(%)
EV/Sales(x)
(Č)
Price ( Č)
( Č cr )
FY16E
FY17E
FY16E
FY17E
FY16E
FY17E
FY16E
FY17E
FY16E
FY17E
FY16E
FY17E
FY16E
FY17E
Capital Goods
KEC International
Neutral
138
-
3,556
8,791
9,716
6.1
6.8
5.4
8.2
25.6
16.9
2.6
2.3
10.0
14.0
0.6
0.6
Thermax
Neutral
916
-
10,914
6,413
7,525
7.4
8.5
30.5
39.3
30.0
23.3
4.6
4.0
15.0
17.0
1.7
1.4
Cement
ACC
Accumulate
1,385
1,548
25,998
11,856
14,092
14.5
17.8
47.6
76.1
29.1
18.2
3.0
2.8
10.6
15.7
2.1
1.7
Ambuja Cements
Accumulate
211
233
32,815
10,569
12,022
20.7
22.2
8.7
10.7
24.3
19.8
3.1
2.9
13.0
15.2
2.7
2.4
India Cements
Buy
73
112
2,242
4,716
5,133
15.9
16.9
3.7
7.5
19.7
9.7
0.7
0.7
3.8
7.3
0.8
0.7
JK Cement
Buy
626
767
4,377
4,056
4,748
14.5
17.0
22.6
41.1
27.7
15.2
2.5
2.2
9.3
15.3
1.5
1.3
J K Lakshmi Cement
Buy
371
430
4,360
2,947
3,616
16.7
19.9
11.5
27.2
32.2
13.6
3.1
2.6
9.8
20.8
1.9
1.5
Mangalam Cements
Neutral
217
-
580
1,053
1,347
10.5
13.3
8.4
26.0
25.9
8.4
1.1
1.0
4.3
12.5
0.9
0.7
Orient Cement
Accumulate
159
183
3,267
1,854
2,524
21.2
22.2
7.7
11.1
20.7
14.4
3.0
2.6
13.3
15.7
2.5
1.8
Ramco Cements
Accumulate
326
350
7,752
4,036
4,545
20.8
21.3
15.1
18.8
21.6
17.3
2.6
2.3
12.9
14.3
2.4
2.1
Shree Cement^
Neutral
11,500
-
40,062
7,150
8,742
26.7
28.6
228.0
345.5
50.4
33.3
7.4
6.2
15.7
20.3
5.4
4.3
UltraTech Cement
Accumulate
2,949
3,282
80,918
27,562
31,548
20.4
22.3
111.9
143.3
26.4
20.6
3.7
3.2
15.2
16.8
3.0
2.6
Construction
ITNL
Neutral
102
-
2,509
7,360
8,825
34.0
35.9
1.0
5.0
101.7
20.3
0.4
0.4
0.3
1.4
3.8
3.7
KNR Constructions
Neutral
525
-
1,476
915
1,479
14.3
13.9
20.3
37.2
25.9
14.1
2.4
2.1
9.6
15.6
1.7
1.1
Larsen & Toubro
Buy
1,604
2,013
149,255
68,920
82,446
10.9
11.5
57.0
73.0
28.1
22.0
2.6
2.4
13.6
15.5
2.4
2.0
Gujarat Pipavav Port
Neutral
174
-
8,407
721
784
53.1
53.6
8.2
9.1
21.2
19.1
3.4
2.8
20.0
18.3
11.2
9.9
MBL Infrastructures
Buy
247
360
1,024
2,313
2,797
12.2
14.6
19.0
20.0
13.0
12.4
1.4
1.3
11.3
10.6
1.2
1.0
Nagarjuna Const.
Neutral
63
-
3,494
7,892
8,842
8.3
9.1
2.4
5.3
26.2
11.9
1.1
1.0
4.2
8.6
0.7
0.6
PNC Infratech
Neutral
459
-
2,353
1,798
2,132
13.2
13.5
22.0
30.0
20.9
15.3
1.9
1.7
11.5
11.4
1.4
1.2
Simplex Infra
Neutral
281
-
1,389
6,241
7,008
10.4
10.7
20.0
36.0
14.0
7.8
1.2
1.0
6.8
11.1
0.7
0.6
Financials
Allahabad Bank
Neutral
77
-
4,385
8,438
9,521
2.8
2.8
21.9
27.0
3.5
2.9
0.4
0.3
10.2
11.5
-
-
Axis Bank
Buy
496
701
117,919
26,941
32,298
3.5
3.6
37.4
46.4
13.3
10.7
2.7
2.3
18.7
20.0
-
-
Bank of Baroda
Neutral
186
-
41,222
19,027
21,737
1.9
2.0
16.9
24.5
11.0
7.6
1.0
0.9
9.1
12.1
-
-
Bank of India
Neutral
136
-
9,046
16,438
18,706
1.9
2.0
19.2
40.9
7.1
3.3
0.4
0.3
4.5
9.1
-
-
Canara Bank
Neutral
267
-
13,769
15,491
17,269
2.0
2.0
61.6
70.9
4.3
3.8
0.5
0.4
10.5
11.1
-
-
Dena Bank
Neutral
40
-
2,259
3,498
3,977
2.1
2.3
7.8
10.7
5.2
3.8
0.4
0.3
6.5
8.4
-
-
Federal Bank
Neutral
61
-
10,464
3,527
4,135
3.0
3.1
5.2
6.7
11.7
9.1
1.2
1.1
10.8
12.7
-
-
HDFC
Neutral
1,184
-
186,667
10,883
12,799
3.5
3.4
43.0
50.6
27.6
23.4
5.5
4.9
25.9
26.7
-
-
HDFC Bank
Buy
1,017
1,255
255,959
38,059
46,851
4.4
4.5
50.0
62.7
20.3
16.2
3.6
3.0
18.8
20.2
-
-
Market Outlook
September 15, 2015
Stock Watch
Company Name
Reco
CMP
Target
Mkt Cap
Sales ( Čcr )
OPM(%)
EPS (Č)
PER(x)
P/BV(x)
RoE(%)
EV/Sales(x)
(Č)
Price ( Č)
( Č cr )
FY16E
FY17E
FY16E
FY17E
FY16E
FY17E
FY16E
FY17E
FY16E
FY17E
FY16E
FY17E
FY16E
FY17E
Financials
ICICI Bank
Buy
272
370
157,948
35,810
41,871
3.4
3.5
22.0
26.2
12.4
10.4
2.2
1.8
15.0
15.6
-
-
IDBI Bank
Neutral
58
-
9,255
9,860
10,978
1.8
1.9
9.3
15.6
6.2
3.7
0.4
0.4
6.4
10.1
-
-
Indian Bank
Neutral
126
-
6,032
6,267
7,171
2.4
2.5
25.4
32.1
4.9
3.9
0.4
0.4
8.0
9.3
-
-
LIC Housing Finance
Buy
439
570
22,172
2,934
3,511
2.3
2.3
30.9
36.8
14.2
11.9
2.3
2.0
16.8
17.5
-
-
Oriental Bank
Neutral
130
-
3,898
7,730
8,595
2.4
2.5
38.8
47.4
3.4
2.7
0.3
0.3
8.6
9.8
-
-
Punjab Natl.Bank
Neutral
137
-
25,435
23,446
26,624
2.8
2.9
17.8
27.5
7.7
5.0
0.8
0.6
8.5
12.1
-
-
South Ind.Bank
Neutral
21
-
2,775
1,930
2,215
2.4
2.4
2.6
3.6
7.9
5.7
0.8
0.7
9.9
12.5
-
-
St Bk of India
Buy
235
307
177,920
83,847
96,307
2.8
2.8
20.1
25.1
11.7
9.4
1.3
1.1
11.5
13.1
-
-
Union Bank
Neutral
172
-
10,932
12,755
14,439
2.3
2.4
31.5
39.9
5.5
4.3
0.6
0.5
9.9
11.6
-
-
Vijaya Bank
Neutral
36
-
3,076
3,594
3,969
1.8
1.9
5.8
7.1
6.1
5.1
0.5
0.5
8.2
9.3
-
-
Yes Bank
Buy
731
953
30,605
7,204
9,078
3.2
3.2
57.8
69.5
12.7
10.5
2.3
1.9
19.6
22.6
-
-
FMCG
Asian Paints
Neutral
839
-
80,472
16,553
19,160
16.0
16.2
17.7
21.5
47.5
39.0
12.6
11.3
29.4
31.2
4.7
4.1
Britannia
Neutral
2,987
-
35,838
8,065
9,395
9.6
10.2
47.2
65.5
63.3
45.6
21.0
19.9
38.3
41.2
4.3
3.7
Colgate
Neutral
1,928
-
26,221
4,836
5,490
19.5
19.7
48.5
53.2
39.8
36.2
29.1
25.4
99.8
97.5
5.3
4.7
Dabur India
Neutral
281
-
49,393
9,370
10,265
17.1
17.2
7.3
8.1
38.3
34.7
11.6
9.4
33.7
30.6
5.2
4.7
GlaxoSmith Con*
Neutral
6,138
-
25,815
4,919
5,742
17.2
17.4
168.3
191.2
36.5
32.1
10.3
8.8
28.8
28.9
4.8
4.1
Godrej Consumer
Neutral
1,247
-
42,464
10,168
12,886
16.1
16.1
32.1
38.4
38.9
32.5
7.9
7.3
19.7
21.0
4.3
3.4
HUL
Neutral
796
-
172,156
34,940
38,957
17.5
17.7
20.8
24.7
38.3
32.2
42.6
34.0
110.5
114.2
4.7
4.2
ITC
Buy
313
409
251,414
41,068
45,068
37.8
37.4
13.9
15.9
22.5
19.7
7.5
6.6
34.1
33.8
5.8
5.2
Marico
Neutral
409
-
26,365
6,551
7,766
15.7
16.0
10.4
12.5
39.4
32.7
11.4
9.5
33.2
32.4
4.0
3.3
Nestle*
Accumulate
6,048
6,646
58,308
11,291
12,847
22.2
22.3
158.9
184.6
38.1
32.8
19.9
17.9
55.0
57.3
5.0
4.4
Tata Global
Buy
124
152
7,823
8,635
9,072
9.8
9.9
6.5
7.6
19.1
16.3
1.9
1.8
6.8
7.4
0.8
0.8
IT
HCL Tech^
Buy
927
1,132
130,283
42,038
47,503
23.5
23.5
56.4
62.9
16.4
14.7
3.8
2.9
23.2
19.8
2.7
2.2
Infosys
Buy
1,098
1,306
252,147
60,250
66,999
28.0
28.0
58.3
63.7
18.8
17.2
4.0
3.4
20.9
19.7
3.5
3.0
TCS
Buy
2,551
3,168
499,623
108,420
123,559
28.8
28.7
127.2
143.9
20.1
17.7
8.0
7.4
39.9
41.8
4.2
3.6
Tech Mahindra
Buy
526
646
50,641
25,566
28,890
16.0
17.0
26.3
31.9
20.0
16.5
3.6
3.1
17.9
18.6
1.8
1.5
Wipro
Buy
571
719
140,957
52,414
58,704
23.7
23.8
38.4
42.3
14.9
13.5
2.9
2.6
19.5
18.0
2.3
1.9
Media
D B Corp
Buy
306
356
5,621
2,241
2,495
27.8
27.9
21.8
25.6
14.1
12.0
3.7
3.2
26.7
28.5
2.4
2.2
HT Media
Neutral
84
-
1,949
2,495
2,603
11.2
11.2
7.3
8.6
11.5
9.7
0.9
0.8
7.4
8.1
0.3
0.3
Market Outlook
September 15, 2015
Stock Watch
Company Name
Reco
CMP
Target
Mkt Cap
Sales ( Čcr )
OPM(%)
EPS (Č)
PER(x)
P/BV(x)
RoE(%)
EV/Sales(x)
(Č)
Price ( Č)
( Č cr )
FY16E FY17E
FY16E
FY17E
FY16E
FY17E
FY16E
FY17E
FY16E
FY17E
FY16E
FY17E
FY16E
FY17E
Media
Jagran Prakashan
Buy
134
156
4,374
1,939
2,122
26.0
26.0
8.3
9.2
16.1
14.5
2.8
2.5
17.5
17.1
2.2
2.0
Sun TV Network
Neutral
345
-
13,580
2,779
3,196
70.2
70.5
22.8
27.3
15.1
12.6
3.7
3.4
26.7
28.3
4.6
4.0
Hindustan Media
Buy
220
292
1,614
920
1,031
20.0
20.0
19.2
20.9
11.5
10.5
1.9
1.6
16.4
15.3
1.3
1.1
Ventures
Metals & Mining
Coal India
Buy
339
400
214,283
72,015
78,415
21.2
21.5
21.7
25.3
15.6
13.4
5.3
5.2
33.1
39.1
2.2
2.1
Hind. Zinc
Neutral
136
-
57,507
15,258
16,495
44.2
45.6
17.6
19.2
7.7
7.1
1.2
1.1
15.9
15.3
1.5
1.0
Hindalco
Neutral
79
-
16,251
104,356
111,186
8.7
9.5
6.7
11.1
11.7
7.1
0.4
0.4
3.5
5.9
0.7
0.6
JSW Steel
Neutral
993
-
23,993
48,125
53,595
18.8
21.0
46.9
97.5
21.2
10.2
1.0
1.0
4.4
9.5
1.3
1.2
NMDC
Neutral
103
-
40,837
8,237
10,893
46.6
44.5
10.0
11.7
10.4
8.8
1.2
1.0
12.5
13.0
4.8
3.6
SAIL
Neutral
52
-
21,518
45,915
53,954
7.2
10.5
1.5
4.4
34.6
11.9
0.5
0.5
2.3
4.1
1.1
1.0
Vedanta
Neutral
101
-
30,032
71,445
81,910
26.2
26.3
12.9
19.2
7.9
5.3
0.6
0.5
7.2
8.9
0.9
0.7
Tata Steel
Neutral
241
-
23,435
136,805
149,228
11.3
11.9
26.4
36.8
9.1
6.6
0.7
0.7
6.0
8.0
0.7
0.6
Oil & Gas
Cairn India
Neutral
144
-
26,914
11,323
12,490
49.4
51.0
20.7
20.7
6.9
7.0
0.5
0.4
6.4
6.1
1.4
0.8
GAIL
Neutral
291
-
36,944
64,856
70,933
9.1
9.6
24.0
28.9
12.2
10.1
1.0
1.0
8.8
9.6
0.8
0.7
ONGC
Neutral
230
-
196,434
154,564
167,321
36.8
37.4
28.6
32.5
8.0
7.1
1.0
0.9
12.7
13.5
1.5
1.4
Petronet LNG
Buy
174
210
13,065
39,007
40,785
3.8
4.2
9.2
11.0
19.0
15.9
2.1
1.9
11.6
12.7
0.4
0.4
Indian Oil Corp
Accumulate
402
455
97,567
359,607
402,760
5.9
6.1
42.5
48.7
9.5
8.3
1.3
1.1
14.1
14.4
0.4
0.3
Reliance Industries
Accumulate
863
930
279,493
313,085
362,904
13.1
13.8
78.4
92.9
11.0
9.3
1.2
1.1
10.8
11.6
1.4
1.2
Pharmaceuticals
Alembic Pharma
Neutral
663
-
12,493
2,601
3,115
21.2
20.2
20.8
23.9
31.9
27.7
10.2
7.7
37.2
31.8
4.8
4.0
Aurobindo Pharma
Buy
714
872
41,678
14,923
17,162
23.0
23.0
38.2
43.6
18.7
16.4
5.8
4.3
36.0
30.2
3.1
2.7
Aventis*
Neutral
3,978
-
9,160
2,156
2,455
15.1
16.8
109.7
133.9
36.3
29.7
5.0
4.1
18.4
22.5
4.0
3.3
Cadila Healthcare
Neutral
1,800
-
36,857
10,224
11,840
20.0
21.0
71.0
85.6
25.4
21.0
6.8
5.4
30.1
28.5
3.7
3.1
Cipla
Neutral
660
-
52,997
14,359
16,884
21.3
19.7
28.4
30.5
23.2
21.6
4.1
3.5
19.3
17.5
3.7
3.1
Dr Reddy's
Neutral
4,038
-
68,834
17,903
20,842
22.7
22.8
160.5
189.5
25.2
21.3
5.1
4.2
22.2
21.7
3.8
3.2
Dishman Pharma
Accumulate
254
290
2,047
1,716
1,888
20.2
20.2
16.3
21.6
15.6
11.8
1.5
1.3
9.7
11.7
1.4
1.1
GSK Pharma*
Neutral
3,325
-
28,164
2,870
3,158
20.0
22.1
59.5
68.3
55.9
48.7
16.5
16.9
28.5
34.3
9.3
8.5
Indoco Remedies
Neutral
341
-
3,138
1,088
1,262
18.2
18.2
13.1
15.5
26.0
22.0
5.1
4.3
21.2
21.1
2.9
2.5
Ipca labs
Accumulate
750
800
9,458
3,507
4,078
17.6
18.6
25.8
32.0
29.1
23.4
3.8
3.3
13.8
14.9
3.0
2.5
Lupin
Neutral
1,840
-
82,806
14,864
17,244
26.9
26.9
62.1
71.1
29.6
25.9
7.2
5.7
27.4
24.6
5.3
4.4
Sun Pharma
Accumulate
857
950
206,268
28,163
32,610
25.8
30.7
17.4
26.9
49.3
31.9
4.7
4.1
13.0
16.6
6.8
5.7
Market Outlook
September 15, 2015
Stock Watch
Company Name
Reco
CMP
Target
Mkt Cap
Sales ( Čcr )
OPM(%)
EPS (Č)
PER(x)
P/BV(x)
RoE(%)
EV/Sales(x)
(Č)
Price ( Č)
( Č cr )
FY16E FY17E
FY16E
FY17E
FY16E
FY17E
FY16E
FY17E
FY16E
FY17E
FY16E
FY17E
FY16E
FY17E
Power
Tata Power
Neutral
62
-
16,715
35,923
37,402
22.6
22.8
4.1
5.2
15.2
12.0
1.2
1.1
7.5
9.3
1.4
1.3
NTPC
Buy
126
157
103,522
87,064
98,846
23.5
23.5
11.7
13.2
10.7
9.5
1.2
1.1
11.4
12.1
2.2
2.0
Power Grid
Buy
127
170
66,650
20,702
23,361
86.7
86.4
12.1
13.2
10.5
9.7
1.6
1.4
15.6
15.1
8.1
7.6
Telecom
Bharti Airtel
Neutral
354
-
141,568
101,748
109,191
32.1
31.7
12.0
12.5
29.5
28.3
2.0
1.9
6.9
6.7
2.0
1.8
Idea Cellular
Neutral
148
-
53,217
34,282
36,941
32.0
31.5
5.9
6.2
25.1
23.9
2.3
2.1
9.9
9.3
2.1
2.0
zOthers
Abbott India
Neutral
5,471
-
11,626
2,715
3,153
14.5
14.1
134.3
152.2
40.8
35.9
10.2
8.4
27.4
25.6
4.0
3.4
Bajaj Electricals
Buy
251
341
2,535
4,719
5,287
5.2
5.8
8.6
12.7
29.4
19.8
3.4
2.9
11.4
14.8
0.5
0.5
Finolex Cables
Neutral
237
-
3,632
2,728
3,036
10.8
11.0
14.4
16.8
16.5
14.2
2.5
2.2
15.2
15.3
1.1
0.9
Goodyear India*
Accumulate
574
655
1,325
1,953
1,766
12.4
12.0
67.4
59.6
8.5
9.6
2.1
1.8
27.7
20.2
0.5
0.4
Hitachi
Neutral
1,345
-
3,657
1,806
2,112
9.0
9.2
28.6
29.1
47.0
46.2
11.7
9.4
28.1
22.6
2.1
1.8
Jyothy Laboratories
Neutral
311
-
5,626
1,620
1,847
11.5
11.5
7.3
8.5
42.6
36.7
5.5
5.1
13.3
14.4
3.3
2.8
MRF
Accumulate
40,916
43,575
17,353
20,727
14,841
19.3
18.6
4,905.8
3,351.9
8.3
12.2
2.7
2.2
37.6
19.6
0.8
1.1
Page Industries
Neutral
12,978
-
14,475
1,929
2,450
19.8
20.1
229.9
299.0
56.5
43.4
24.9
17.3
52.1
47.1
7.5
5.9
Relaxo Footwears
Neutral
533
-
6,399
1,767
2,152
12.3
12.5
19.3
25.1
27.7
21.3
6.8
5.2
27.7
27.8
3.7
3.0
Siyaram Silk Mills
Buy
981
1,221
920
1,653
1,873
11.7
12.2
99.3
122.1
9.9
8.0
1.8
1.5
19.5
20.2
0.7
0.6
Styrolution ABS India*
Neutral
739
-
1,300
1,271
1,440
8.6
9.2
32.0
41.1
23.1
18.0
2.4
2.1
10.7
12.4
1.0
0.9
Tree House
Buy
366
449
1,549
259
324
56.8
56.8
17.0
21.7
21.5
16.9
2.2
2.0
10.1
11.5
5.9
4.9
TVS Srichakra
Buy
2,748
3,210
2,104
2,127
2,388
15.2
14.9
237.7
267.5
11.6
10.3
4.9
3.5
51.7
39.8
1.1
0.9
HSIL
Buy
253
434
1,830
2,085
2,436
18.5
18.6
21.7
28.9
11.7
8.8
1.2
1.1
10.0
12.1
1.0
0.8
Kirloskar Engines India
Neutral
293
-
4,239
2,634
3,252
10.1
12.0
10.9
17.4
26.9
16.8
3.0
2.7
11.4
16.8
1.3
1.0
Ltd
M M Forgings
Buy
546
797
659
563
671
22.1
22.9
51.0
66.5
10.7
8.2
2.2
1.8
23.1
24.1
1.3
1.1
Banco Products (India)
Neutral
120
-
859
1,208
1,353
11.0
12.3
10.8
14.5
11.1
8.3
1.3
1.1
11.9
14.5
0.7
0.6
Competent Automobiles Neutral
145
-
89
1,007
1,114
3.1
3.1
23.7
28.2
6.1
5.1
0.9
0.8
13.9
14.6
0.1
0.1
Nilkamal
Accumulate
919
1,005
1,371
1,948
2,147
10.6
10.3
60.0
67.0
15.3
13.7
2.4
2.1
16.8
16.1
0.8
0.7
Visaka Industries
Buy
135
166
215
1,158
1,272
8.6
9.5
23.7
32.7
5.7
4.1
0.6
0.5
10.1
12.5
0.4
0.3
Transport Corporation of
Buy
239
293
1,820
2,830
3,350
8.8
9.0
14.4
18.3
16.7
13.1
2.6
2.2
15.4
17.1
0.8
0.7
India
Elecon Engineering
Buy
73
87
796
1,452
1,596
14.0
14.7
4.4
6.2
16.6
11.7
1.4
1.3
8.6
11.2
0.9
0.7
Surya Roshni
Buy
120
183
528
2,992
3,223
8.3
8.5
14.7
18.3
8.2
6.6
0.8
0.7
9.8
11.0
0.5
0.4
MT Educare
Buy
128
169
510
286
366
18.3
17.7
7.7
9.4
16.6
13.7
3.5
3.1
20.2
21.1
1.7
1.3
Market Outlook
September 15, 2015
Stock Watch
Company Name
Reco
CMP
Target Mkt Cap
Sales ( Čcr )
OPM(%)
EPS (Č)
PER(x)
P/BV(x)
RoE(%)
EV/Sales(x)
(Č)
Price ( Č)
( Č cr )
FY16E FY17E FY16E FY17E FY16E FY17E FY16E FY17E FY16E FY17E FY16E FY17E FY16E FY17E
zOthers
Radico Khaitan
Buy
85
112
1,133
1,565
1,687
11.9
12.4
5.4
6.6
15.7
12.9
1.3
1.2
8.0
9.0
1.2
1.2
Garware Wall Ropes
Buy
292
390
638
875
983
10.4
10.6
23.1
27.8
12.6
10.5
1.8
1.6
14.1
14.8
0.7
0.6
Wonderla Holidays
Buy
275
322
1,553
206
308
44.0
43.6
9.0
12.9
30.5
21.3
4.2
3.8
13.7
17.8
7.4
4.9
Linc Pen & Plastics
Buy
150
185
222
340
371
8.3
8.9
10.8
13.2
13.9
11.4
2.2
1.9
16.0
17.1
0.7
0.6
Source: Company, Angel Research; Note: *December year end; #September year end; &October year end; Price as on September 14, 2015
Market Outlook
September 15, 2015
Research Team Tel: 022 - 39357800
DISCLAIMER
Angel Broking Private Limited (hereinafter referred to as “Angel”) is a registered Member of National Stock Exchange of India Limited,
Bombay Stock Exchange Limited and MCX Stock Exchange Limited. It is also registered as a Depository Participant with CDSL and
Portfolio Manager with SEBI. It also has registration with AMFI as a Mutual Fund Distributor. Angel Broking Private Limited is a
registered entity with SEBI for Research Analyst in terms of SEBI (Research Analyst) Regulations, 2014 vide registration number
INH000000164. Angel or its associates has not been debarred/ suspended by SEBI or any other regulatory authority for accessing
/dealing in securities Market. Angel or its associates including its relatives/analyst do not hold any financial interest/beneficial
ownership of more than 1% in the company covered by Analyst. Angel or its associates/analyst has not received any compensation /
managed or co-managed public offering of securities of the company covered by Analyst during the past twelve months. Angel/analyst
has not served as an officer, director or employee of company covered by Analyst and has not been engaged in market making activity
of the company covered by Analyst.
This document is solely for the personal information of the recipient, and must not be singularly used as the basis of any investment
decision. Nothing in this document should be construed as investment or financial advice. Each recipient of this document should
make such investigations as they deem necessary to arrive at an independent evaluation of an investment in the securities of the
companies referred to in this document (including the merits and risks involved), and should consult their own advisors to determine
the merits and risks of such an investment.
Reports based on technical and derivative analysis center on studying charts of a stock's price movement, outstanding positions and
trading volume, as opposed to focusing on a company's fundamentals and, as such, may not match with a report on a company's
fundamentals.
The information in this document has been printed on the basis of publicly available information, internal data and other reliable
sources believed to be true, but we do not represent that it is accurate or complete and it should not be relied on as such, as this
document is for general guidance only. Angel Broking Pvt. Limited or any of its affiliates/ group companies shall not be in any way
responsible for any loss or damage that may arise to any person from any inadvertent error in the information contained in this report.
Angel Broking Pvt. Limited has not independently verified all the information contained within this document. Accordingly, we cannot
testify, nor make any representation or warranty, express or implied, to the accuracy, contents or data contained within this document.
While Angel Broking Pvt. Limited endeavors to update on a reasonable basis the information discussed in this material, there may be
regulatory, compliance, or other reasons that prevent us from doing so.
This document is being supplied to you solely for your information, and its contents, information or data may not be reproduced,
redistributed or passed on, directly or indirectly.
Neither Angel Broking Pvt. Limited, nor its directors, employees or affiliates shall be liable for any loss or damage that may arise from
or in connection with the use of this information.
Note: Please refer to the important ‘Stock Holding Disclosure' report on the Angel website (Research Section). Also, please refer to the
latest update on respective stocks for the disclosure status in respect of those stocks. Angel Broking Pvt. Limited and its affiliates may
have investment positions in the stocks recommended in this report.