Market Outlook
June 15, 2016
Market Cues
Domestic Indices
Chg (%)
(Pts)
(Close)
Indian markets are expected to open flat some consensus seems to be
BSE Sensex
(0.0)
(1)
26,396
developing for the GST bill. In a two days meet with states FMs the union
finance minister Arun Jaitly has expressed hope for positive move ahead. The
Nifty
(0.0)
(2)
8,109
SGX NIFTY is trading marginally negative. However, further direction of the
Mid Cap
0.2
21
11,340
market will be decided by global indices today and global markets closed on a
Small Cap
0.5
61
11,373
weak note.
Bankex
0.4
82
20,245
The US market closed modestly down, with Dow closing down by 57 points.
Though the selling pressure was modest risk aversion by traders head of US
Global Indices
Chg (%)
(Pts)
(Close)
Fed’s policy announcement on monetary policy on Wednesday kept the markets
subdued. Though it is widely expected that the US Fed will keep its policy rates
Dow Jones
(0.3)
(57)
17,674
unchanged, traders and investors will keenly watch out for the accompanying
Nasdaq
(0.1)
(05)
4,843
commentary, which could give time line for the same.
FTSE
(2.0)
(121)
5,923
The European market ended Tuesday further lower and ended at their lowest
Nikkei
(1.0)
(160)
15,859
level in over three months. Potential Brexit and weakness in the Asian markets
Hang Seng
(0.6)
(125)
20,388
continued to dampen the sentiment in the overall European markets
Shanghai Com
0.3
9
2,842
The Indian markets opened down on Tuesday tracking global cues However;
there was bounce back in banking stocks during the latter half of the session.
Advances / Declines
BSE
NSE
News Analysis
Advances
1,537
974
Govt unveils draft GST bill in public domain.
Detailed analysis on Pg2
Declines
1,078
589
Unchanged
157
67
Investor’s Ready Reckoner
Key Domestic & Global Indicators
Volumes (` Cr)
Stock Watch: Latest investment recommendations on 150+ stocks
BSE
2,733
Refer Pg4 onwards
NSE
14,507
Top Picks
CMP
Target
Upside
Company
Sector
Rating
Net Inflows (` Cr)
Net
Mtd
Ytd
(`)
(`)
(%)
Amara Raja
Auto/Auto Ancillary
Buy
853
1,076
26.1
FII
358
4,547
18,916
HCL Tech
IT
Buy
752
1,000
33.0
MFs
127
(489)
8,941
LIC Housing
Financials
Buy
470
592
26.0
Bharat Electronics
Capital Goods
Accumulate
1,243
1,414
13.7
Top Gainers
Price (`)
Chg (%)
Navkar Corporation Others
Buy
195
265
35.9
Jpassociat
8
15.6
More Top Picks on Pg3
Aloktext
4
13.8
Bhusanstl
41
11.5
Key Upcoming Events
Previous
Consensus
Date
Region
Event Description
Jpinfratec
8
10.9
Reading
Expectations
Adanient
79
8.4
June 15 UK
Jobeless claims change
-2.4
--
June 15 US
Industrial Production YoY
0.7
--
Top Losers
Price (`)
Chg (%)
June 15 US
FOMC rate decision
0.5
0.5
June 16 US
Initial Jobeless claims
264.0
270.0
Gati
156
(8.1)
6.(
More Events on Pg4
Kpit
179
(5.4)
Repcohome
725
(2.7)
Cholafin
943
(2.1)
Srf
1,269
(2.1)
As on June 14, 2016
Market Outlook
June 15, 2016
Govt unveils draft GST bill in public domain:
Union Finance Minister Mr Arun Jaitley today met the FMs of 22 states and tried to
bridge the differences between states and center on the passage of the crucial GST
Bill. Later during the day the Govt released the draft central GST and Integrated
GST laws in public domain.
If passed in the monsoon session of the parliament then this could be the single
largest reforms the Govt. The Finance minister has said that except for Tamil Nadu
all the states have agreed on the broader outline of GST.
As per the draft laws uniform tax shall apply to all intra state supplies of goods
and services, at the certain rate which will be decided later. If passed there will be
lot of clarity in the tax matters and will also broaden the overall tax base of the
country. Different tax structures in different states and lack of clarity has been a
point of overseas investors in setting up unit and committing big ticket investments
in India. Post GST the overall economic growth can see material change.
Economic and Political News
WPI inflation inches up 0.79% in May
Panel wants center to pare stakes in PSUs
Draft GST law brings all online transactions under purview.
Corporate News
Kitex garments to launch new infant brands ‘Little Star’ in the US
BHEL Comissions 195 MW unit at Muzzafarpura plant
Tata Power’s move to acquire Welspun Renewables may impact its
Court orders proceedings against unitech top bosses.
Airtel and Singtel team up for data business across 325 cities globally.
Mahindra to relook into bus business strategy in future.
Market Outlook
June 15, 2016
Top Picks
Large Cap
M
arket Cap
CM
P
T
arget
Upsid
e
Company
Rationale
(` Cr)
(`)
(`)
(%)
To outpace battery industry growth due to better technological
Amara Raja Batteries
14,573
853
1,076
26.1
products leading to market share gains in both the automotive
OEM and replacement segments.
Uptick in defense capex by government, coupled with BELs
Bharat Electronics
29,839
1,243
1,414
13.7
strong market positioning, indicate good times ahead for BEL.
HCL Tech
1,06,039
752
1,000
33.0
Stock is trading at attractive valuations & factors all bad news.
Strong visibility for a robust 20% earnings trajectory, coupled
HDFC Bank
2,91,555
1,152
1,262
9.6
with high quality of earnings on account of high quality retail
business and strategic focus on highly rated corporates.
Back on the growth trend, expect a long term growth of 14% to
Infosys
2,69,937
1,175
1,374
16.9
be a US$20bn in FY2020.
Continues to grow its retail loan book at healthy pace with
LIC Housing Finance
23,704
470
592
26.0
improvement in asset quality. Expect LICHF to post a healthy
loan book which is likely to reflect in a strong earnings growth.
Huge bid pipeline of re-development works at Delhi and other
NBCC
11,064
184
220
19.3
State Governments and opportunity from Smart City, positions
NBCC to report strong growth, going forward.
Strong market positioning within the domestic AC markets to
Voltas
10,924
330
407
23.3
continue, EMP business set to revive
Source: Company, Angel Research
Mid Cap
M
arket Cap
CM
P
T
arget
Upsid
e
Company
Rationale
(` Cr)
(`)
(`)
(%)
Among the top 4 players in the consumer durables segment.
Bajaj Electricals
2,313
229
268
17.1
Improved profitability backed by turn around in E&P segment.
Strong order book lends earnings visibility.
Favourable outlook for AC industry to augur well for Cooling
Blue Star
3,845
427
495
15.8
products business. EMPPAC division's profitability to improve
once operating environment turns around.
With a focus on the low and medium income (LMI) consumer
Dewan Housing
5,983
205
270
31.7
segment, the company has increased its presence in tier-II & III
cities where the growth opportunity is immense.
Strong loan growth backed by diversified loan portfolio and
Equitas Holdings
5,742
171
235
37.3
adequate CAR. ROE & ROA likely to remain decent as risk of
dilution remains low. Attractive valuations considering growth.
Commencement of new projects, downtrend in the interest rate
IL&FS Transport
2,429
74
93
25.9
cycle, to lead to stock re-rating
Economic recovery to have favourable impact on advertising &
circulation revenue growth. Further, the acquisition of a radio
Jagran Prakashan
5,558
170
205
20.6
business (Radio City) would also boost the company's revenue
growth.
Speedier execution and speedier sales, strong revenue visibility
Mahindra Lifespace
1,834
447
554
23.9
in short-to-long run, attractive valuations
Massive capacity expansion along with rail advantage at ICD
Navkar Corporation
2,781
195
265
35.9
as well CFS augurs well for the company
Earnings boost on back of stable material prices and
Radico Khaitan
1,223
92
125
35.9
favourable pricing environment. Valuation discount to peers
provides additional comfort
Strong brands and distribution network would boost growth
Siyaram Silk Mills
970
1,035
1,347
30.2
going ahead. Stock currently trades at an inexpensive
valuation.
Source: Company, Angel Research
Market Outlook
June 15, 2016
Key Upcoming Events
Global economic events release calendar
Bloomberg Data
Date
Time
Country Event Description
Unit
Period
Last Reported
Estimated
Jun 15, 2016
2:00 PM
UK
Jobless claims change
% Change May
-2.40
-
11:30 PM
US
FOMC rate decision
% Jun 15
0.50
0.50
US
Producer Price Index (mom)
% Change May
0.20
6:45 PM
US
Industrial Production
% May
0.66
(0.20)
Jun 16, 2016
6:00 PM
US
Initial Jobless claims
Thousands Jun 11
264.00
270.00
2:30 PM Euro Zone
Euro-Zone CPI (YoY)
% May F
-0.10
(0.10)
6:00 PM
US
Consumer price index (mom)
% Change May
0.40
7:12 AM
4:30 PM
UK
BOE Announces rates
% Ratio Jun 16
0.50
0.50
June 17, 2016
6:00 PM
US
Housing Starts
Thousands May
1172.00
12:00 AM
6:00 PM
US
Building permits
Thousands May
1130.00
1,145.00
Jun 22, 2016
7:30 PM Euro Zone Euro-Zone Consumer Confidence
Value Jun A
-7.00
7:30 PM
US
Existing home sales
Million
May
5.45
5.50
Jun 23, 2016
1:00 PM Germany
PMI Services
Value Jun P
55.20
7:30 PM
US
New home sales
Thousands May
619.00
565.00
1:00 PM Germany
PMI Manufacturing
Value Jun P
52.10
Jun 28, 2016
7:30 PM
US
Consumer ConfidenceS.A./ 1985=100 Jun
92.60
6:00 PM
US
GDP Qoq (Annualised)
% Change 1Q T
0.80
Jun 30, 2016
1:25 PM Germany Unemployment change (000's)
Thousands
Jun
(11.00)
2:00 PM
UK
GDP (YoY)
% Change 1Q F
2.10
Jul 01, 2016
2:00 PM
UK
PMI Manufacturing
Value
Jun
50.10
6:30 AM
China
PMI Manufacturing
Value
Jun
50.10
Source: Bloomberg, Angel Research
Market Outlook
June 15, 2016
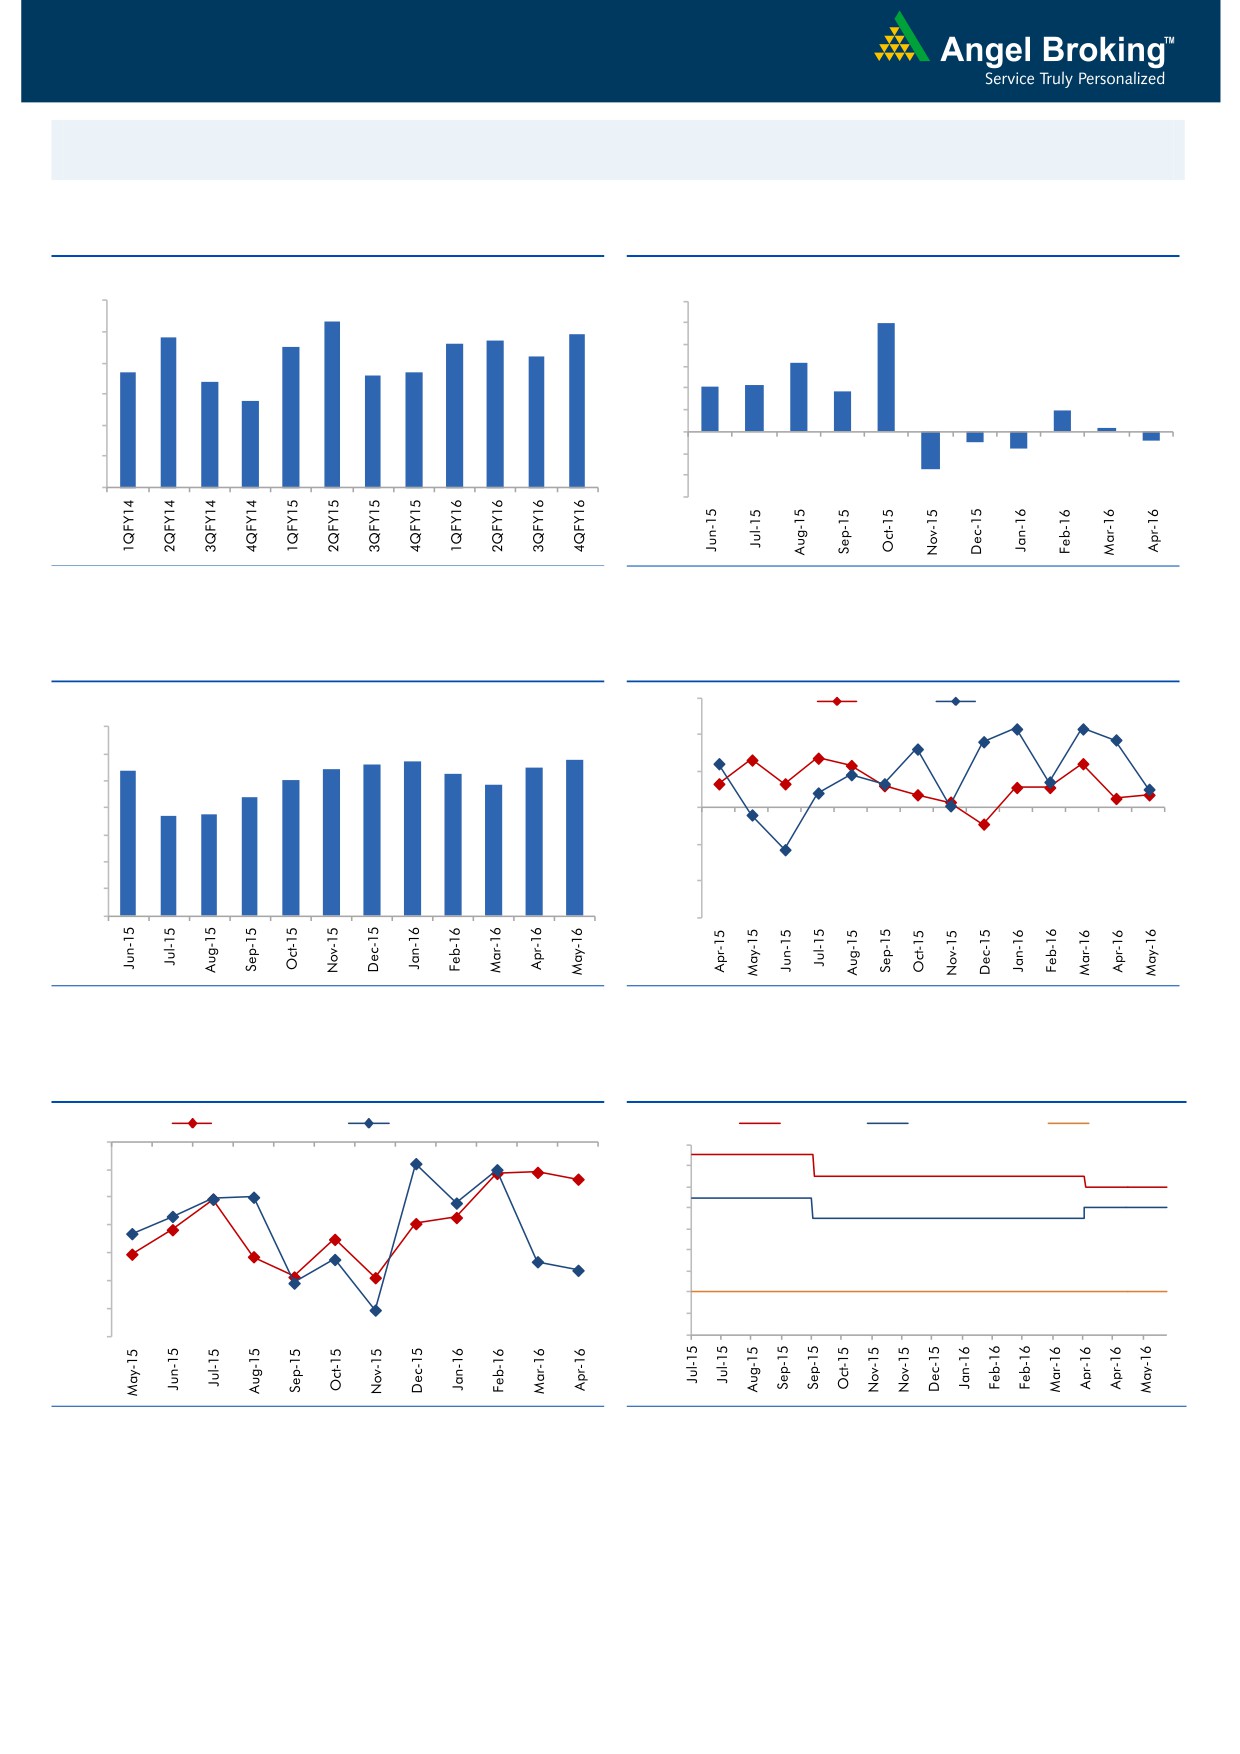
Macro watch
Exhibit 1: Quarterly GDP trends
Exhibit 2: IIP trends
(%)
(%)
9.0
12.0
8.3
9.9
7.8
7.7
7.9
10.0
8.0
7.5
7.6
7.2
8.0
6.3
6.7
6.6
6.7
7.0
6.4
6.0
4.2
4.3
3.7
5.8
4.0
6.0
2.0
2.0
0.3
5.0
-
4.0
(2.0)
(0.9)
(0.8)
(1.6)
(4.0)
3.0
(3.4)
(6.0)
Source: CSO, Angel Research
Source: MOSPI, Angel Research
Exhibit 3: Monthly CPI inflation trends
Exhibit 4: Manufacturing and services PMI
56.0
Mfg. PMI
Services PMI
(%)
7.0
54.0
5.6
5.7
5.8
5.4
5.4
5.5
6.0
5.3
5.0
4.8
52.0
5.0
4.4
3.7
3.7
4.0
50.0
3.0
48.0
2.0
46.0
1.0
-
44.0
Source: MOSPI, Angel Research
Source: Market, Angel Research; Note: Level above 50 indicates expansion
Exhibit 5: Exports and imports growth trends
Exhibit 6: Key policy rates
(%)
Exports yoy growth
Imports yoy growth
(%)
Repo rate
Reverse Repo rate
CRR
0.0
7.50
(5.0)
7.00
6.50
(10.0)
6.00
(15.0)
5.50
(20.0)
5.00
4.50
(25.0)
4.00
(30.0)
3.50
(35.0)
3.00
Source: Bloomberg, Angel Research
Source: RBI, Angel Research
Market Outlook
June 15, 2016
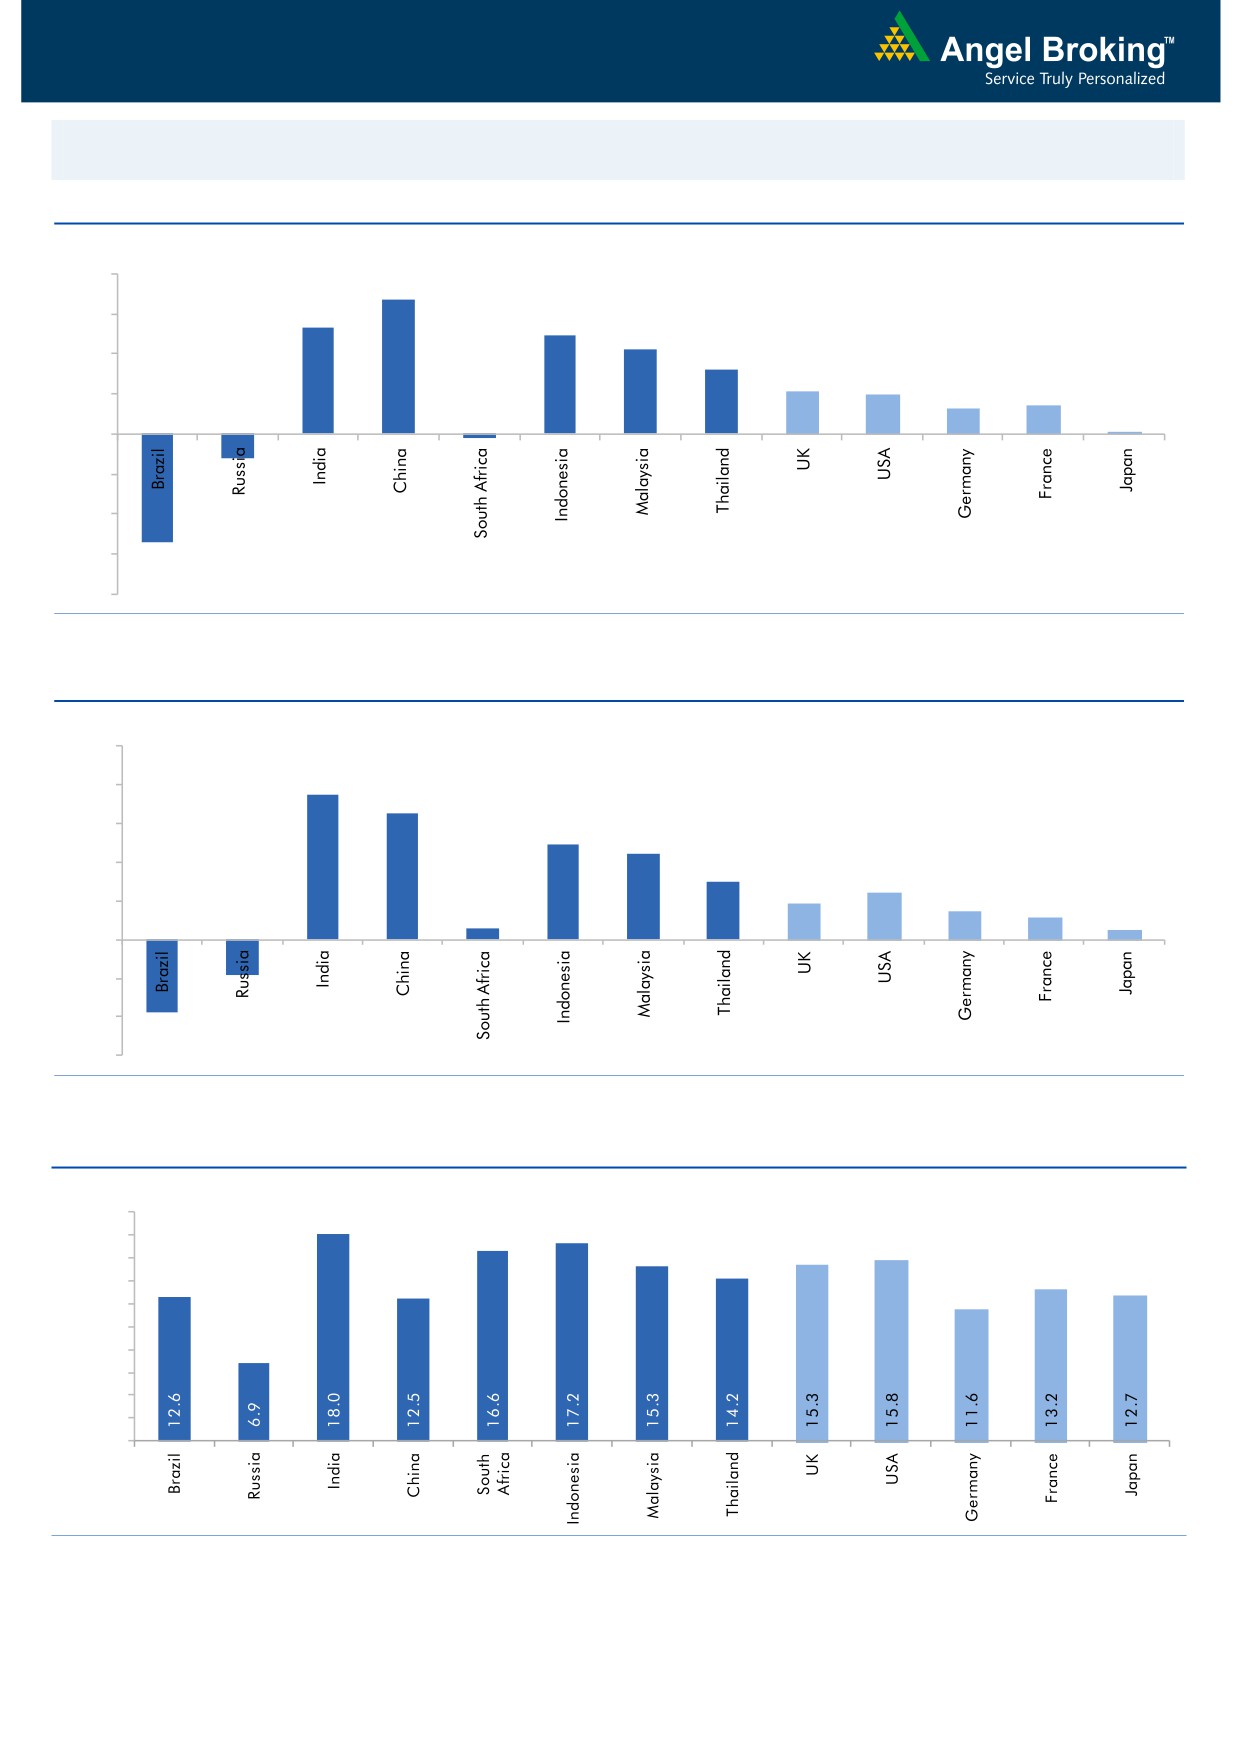
Global watch
Exhibit 1: Latest quarterly GDP Growth (%, yoy) across select developing and developed countries
(%)
8.0
6.7
6.0
5.3
4.9
4.2
4.0
3.2
2.1
2.0
1.3
1.4
2.0
0.1
-
(0.2)
(2.0)
(4.0)
(1.2)
(6.0)
(5.4)
(8.0)
Source: Bloomberg, Angel Research
Exhibit 2: 2016 GDP Growth projection by IMF (%, yoy) across select developing and developed countries
(%)
10.0
7.5
8.0
6.5
6.0
4.9
4.4
4.0
3.0
2.4
1.9
1.5
2.0
1.1
0.6
0.5
(3.8)
(1.8)
-
(2.0)
(4.0)
(6.0)
Source: IMF, Angel Research
Exhibit 3: One year forward P-E ratio across select developing and developed countries
(x)
20.0
18.0
16.0
14.0
12.0
10.0
8.0
6.0
4.0
2.0
-
Source: IMF, Angel Research
Market Outlook
June 15, 2016
Exhibit 4: Relative performance of indices across globe
Returns (%)
Country
Name of index
Closing price
1M
3M
1YR
Brazil
Bovespa
48,648
(5.9)
0.2
(6.3)
Russia
Micex
1,886
(1.3)
(0.4)
13.6
India
Nifty
8,109
3.8
7.7
1.1
China
Shanghai Composite
2,842
0.2
1.3
(42.1)
South Africa
Top 40
45,397
0.9
0.4
(0.7)
Mexico
Mexbol
44,571
(1.7)
1.3
1.2
Indonesia
LQ45
823
0.7
(1.9)
(6.4)
Malaysia
KLCI
1,626
(0.1)
(3.8)
(6.0)
Thailand
SET 50
907
1.8
1.9
(7.6)
USA
Dow Jones
17,675
0.1
3.0
(0.3)
UK
FTSE
5,924
(3.0)
(1.9)
(11.3)
Japan
Nikkei
15,859
(3.4)
(4.7)
(22.6)
Germany
DAX
9,519
(2.8)
(2.5)
(13.6)
France
CAC
4,130
(3.5)
(7.5)
(17.6)
Source: Bloomberg, Angel Research
Stock Watch
June 15, 2016
Company Name
Reco
CMP
Target
Mkt Cap
Sales ( Čcr )
OPM(%)
EPS (Č)
PER(x)
P/BV(x)
RoE(%)
EV/Sales(x)
(Č)
Price ( Č)
( Č cr )
FY16E FY17E
FY16E
FY17E
FY16E
FY17E
FY16E
FY17E
FY16E
FY17E
FY16E
FY17E
FY16E
FY17E
Agri / Agri Chemical
Rallis
Neutral
206
-
4,006
1,612
1,911
13.3
13.3
7.4
9.5
27.8
21.7
4.5
4.0
16.7
18.4
2.6
2.2
United Phosphorus
Buy
582
684
24,964
13,083
15,176
18.5
18.5
31.5
37.4
18.5
15.6
3.7
3.1
21.4
21.4
2.1
1.8
Auto & Auto Ancillary
Ashok Leyland
Accumulate
105
111
29,839
17,995
21,544
11.4
11.6
3.4
4.7
30.8
22.3
5.4
5.0
17.7
22.2
1.6
1.3
Bajaj Auto
Neutral
2,561
-
74,113
22,709
25,860
20.9
20.1
129.0
143.6
19.9
17.8
6.1
5.2
30.7
29.4
2.8
2.5
Bharat Forge
Buy
741
875
17,243
7,351
8,318
19.9
19.7
31.2
36.5
23.7
20.3
4.3
3.6
19.3
19.2
2.5
2.2
Eicher Motors
Accumulate
18,754
20,044
50,937
15,556
16,747
15.5
17.3
464.8
597.5
40.4
31.4
14.7
10.8
36.2
34.3
3.1
2.9
Gabriel India
Buy
88
101
1,258
1,415
1,544
8.7
9.0
4.6
5.4
19.0
16.2
3.5
3.1
18.1
18.9
0.9
0.8
Hero Motocorp
Neutral
3,012
-
60,137
28,244
30,532
15.5
15.9
156.7
168.5
19.2
17.9
7.7
6.5
39.9
36.4
2.0
1.8
Jamna Auto Industries Neutral
163
-
1,302
1,281
1,473
11.2
11.5
7.6
9.2
21.5
17.7
5.4
4.4
25.4
25.2
1.0
0.9
L G Balakrishnan & Bros Neutral
472
-
741
1,254
1,394
11.6
11.8
35.9
41.7
13.2
11.3
1.8
1.6
13.5
13.8
0.7
0.6
Mahindra and Mahindra Neutral
1,355
-
84,183
38,416
42,904
13.7
13.9
54.8
63.4
24.7
21.4
3.8
3.4
15.4
15.8
1.8
1.6
Maruti
Neutral
4,105
-
123,990
57,865
68,104
16.4
16.7
176.3
225.5
23.3
18.2
4.5
3.9
19.4
21.2
1.9
1.6
Minda Industries
Neutral
1,160
-
1,840
2,523
2,890
8.7
9.0
55.0
65.4
21.1
17.7
4.1
3.3
19.3
18.7
0.8
0.7
Motherson Sumi
Accumulate
290
313
38,399
39,343
45,100
8.8
9.1
10.1
12.5
28.7
23.2
9.1
7.1
35.3
34.4
1.0
0.9
Rane Brake Lining
Buy
376
465
298
454
511
11.5
12.0
25.2
31.0
14.9
12.1
2.2
2.0
14.9
16.6
0.8
0.7
Setco Automotive
Neutral
44
-
591
594
741
12.7
13.7
1.7
3.2
26.0
13.8
2.7
2.4
10.4
16.9
1.5
1.2
Tata Motors
Neutral
448
-
129,462
259,686
273,957
13.0
13.4
25.9
29.5
17.3
15.2
2.3
2.0
8.0
9.0
0.7
0.7
TVS Motor
Accumulate
291
330
13,813
11,263
13,122
6.9
8.5
9.2
15.0
31.6
19.4
7.2
5.7
22.7
29.6
1.2
1.0
Amara Raja Batteries
Buy
853
1,076
14,573
4,690
5,429
17.5
17.5
28.5
35.3
30.0
24.1
6.9
5.7
23.1
25.9
3.1
2.6
Exide Industries
Neutral
159
-
13,515
6,950
7,784
14.4
14.8
6.6
7.3
24.1
21.8
3.0
2.8
12.6
12.8
1.6
1.5
Apollo Tyres
Buy
151
183
7,696
12,056
12,714
17.2
16.4
23.0
20.3
6.6
7.5
1.2
1.0
17.7
13.6
0.7
0.7
Ceat
Buy
872
1,119
3,527
6,041
6,597
14.1
13.7
99.5
111.9
8.8
7.8
1.7
1.4
19.6
18.5
0.7
0.6
JK Tyres
Neutral
91
-
2,067
7,446
7,669
15.2
14.0
19.6
18.4
4.7
5.0
1.2
1.0
25.2
19.5
0.7
0.6
Swaraj Engines
Neutral
1,116
-
1,386
552
630
14.2
14.7
44.6
54.1
25.0
20.6
5.8
5.3
23.2
25.6
2.3
2.0
Subros
Neutral
93
-
556
1,293
1,527
11.8
11.9
4.2
6.7
22.1
13.8
1.7
1.5
7.7
11.5
0.7
0.6
Indag Rubber
Neutral
191
-
502
283
329
17.0
17.2
13.0
15.4
14.8
12.4
3.2
2.7
21.8
21.6
1.5
1.2
Capital Goods
ACE
Neutral
41
-
404
660
839
4.7
8.2
1.0
3.9
40.9
10.5
1.3
1.1
3.2
11.3
0.8
0.6
BEML
Buy
851
1,157
3,544
3,277
4,006
6.0
8.9
36.2
64.3
23.5
13.2
1.6
1.5
5.7
11.7
1.2
0.9
Bharat Electronics
Accumulate
1,243
1,414
29,839
7,295
8,137
20.0
16.8
56.5
58.7
22.0
21.2
3.3
2.9
42.1
44.6
3.3
2.8
Stock Watch
June 15, 2016
Company Name
Reco
CMP
Target
Mkt Cap
Sales ( Čcr )
OPM(%)
EPS (Č)
PER(x)
P/BV(x)
RoE(%)
EV/Sales(x)
(Č)
Price ( Č)
( Č cr )
FY16E
FY17E
FY16E
FY17E
FY16E
FY17E
FY16E
FY17E
FY16E
FY17E
FY16E
FY17E
FY16E
FY17E
Capital Goods
Voltas
Buy
330
407
10,924
5,857
6,511
7.5
7.9
11.7
12.9
28.2
25.6
4.6
4.0
17.1
16.7
1.8
1.6
BGR Energy
Neutral
117
-
841
3,615
3,181
9.5
9.4
16.7
12.4
7.0
9.4
0.7
0.6
10.0
7.0
0.6
0.8
BHEL
Neutral
121
-
29,714
33,722
35,272
10.8
11.7
10.5
14.2
11.6
8.6
0.9
0.8
7.0
9.0
1.0
0.9
Blue Star
Accumulate
427
495
3,845
3,770
4,351
5.7
6.4
11.4
17.2
37.4
24.9
5.8
5.4
18.4
23.1
1.1
0.9
Crompton Greaves
Neutral
72
-
4,531
13,484
14,687
4.9
6.2
4.5
7.1
16.1
10.2
1.1
1.1
7.2
10.8
0.5
0.4
Greaves Cotton
Neutral
138
-
3,371
1,655
1,755
16.6
16.8
7.4
7.8
18.7
17.7
3.7
3.5
21.1
20.6
2.0
1.9
Inox Wind
Buy
248
286
5,507
4,406
5,605
15.5
15.7
20.4
24.8
12.2
10.0
2.8
2.1
27.9
25.9
1.4
1.1
KEC International
Neutral
136
-
3,486
8,791
9,716
6.1
6.8
5.4
8.2
25.1
16.5
2.5
2.3
10.0
14.0
0.6
0.6
Thermax
Neutral
798
-
9,513
6,413
7,525
7.4
8.5
30.5
39.3
26.2
20.3
4.0
3.5
15.0
17.0
1.5
1.2
VATech Wabag
Neutral
605
-
3,296
2,722
3,336
7.9
8.1
19.5
24.6
31.0
24.6
3.3
2.9
11.1
12.4
1.3
1.1
Cement
ACC
Neutral
1,537
-
28,862
13,151
14,757
16.4
18.3
63.9
83.4
24.1
18.4
3.1
2.8
13.3
16.1
2.1
1.7
Ambuja Cements
Neutral
234
-
36,283
11,564
12,556
19.4
20.7
8.9
10.1
26.3
23.2
3.3
3.1
12.8
13.8
2.8
2.6
HeidelbergCement
Neutral
109
-
2,477
1,772
1,926
13.3
15.4
1.0
3.0
109.3
36.4
2.8
2.6
2.6
7.9
2.0
1.7
India Cements
Neutral
99
-
3,026
4,216
4,840
18.0
19.5
4.0
9.9
24.6
10.0
1.0
0.9
4.0
9.5
1.1
0.9
JK Cement
Neutral
620
-
4,337
3,661
4,742
10.1
15.8
7.5
28.5
82.7
21.8
2.5
2.2
7.5
22.9
1.6
1.2
J K Lakshmi Cement
Neutral
375
-
4,413
2,947
3,616
16.7
19.9
11.5
27.2
32.6
13.8
3.1
2.7
9.8
20.8
1.9
1.5
Mangalam Cements
Neutral
286
-
762
1,053
1,347
10.5
13.3
8.4
26.0
34.0
11.0
1.4
1.3
4.3
12.5
1.1
0.8
Orient Cement
Neutral
166
-
3,405
1,854
2,524
21.2
22.2
7.7
11.1
21.6
15.0
3.1
2.7
13.3
15.7
2.6
1.8
Ramco Cements
Neutral
534
-
12,704
4,036
4,545
20.8
21.3
15.1
18.8
35.3
28.4
4.3
3.8
12.9
14.3
3.6
3.2
Shree Cement^
Neutral
13,498
-
47,022
7,150
8,742
26.7
28.6
228.0
345.5
59.2
39.1
8.7
7.3
15.7
20.3
6.3
5.1
UltraTech Cement
Neutral
3,320
-
91,115
24,669
29,265
18.2
20.6
82.0
120.0
40.5
27.7
4.4
3.8
11.3
14.7
3.8
3.2
Construction
ITNL
Buy
74
93
2,429
7,360
8,682
34.0
32.2
7.0
8.6
10.6
8.6
0.4
0.4
3.2
2.5
3.7
3.5
KNR Constructions
Accumulate
562
603
1,581
937
1,470
14.3
14.0
44.2
38.6
12.7
14.6
2.5
2.2
15.4
15.4
1.7
1.1
Larsen & Toubro
Buy
1,461
1,700
136,124
58,870
65,708
8.3
10.3
42.0
53.0
34.8
27.6
2.4
2.2
8.8
11.2
2.5
2.3
Gujarat Pipavav Port
Neutral
156
-
7,554
629
684
51.0
52.2
6.4
5.9
24.4
26.5
3.2
3.0
15.9
12.7
11.6
10.5
MBL Infrastructures
Buy
119
285
492
2,313
2,797
12.2
14.6
19.0
20.0
6.3
5.9
0.7
0.6
11.3
10.6
0.9
0.8
Nagarjuna Const.
Neutral
74
-
4,097
7,892
8,842
8.8
9.1
3.0
5.3
24.6
13.9
1.2
1.1
5.0
8.5
0.8
0.6
PNC Infratech
Buy
551
647
2,825
1,873
2,288
13.2
13.5
24.0
32.0
22.9
17.2
2.2
2.0
12.1
12.3
1.6
1.3
Simplex Infra
Neutral
276
-
1,367
5,955
6,829
10.3
10.5
16.0
31.0
17.3
8.9
0.9
0.8
5.3
9.9
0.7
0.6
Stock Watch
June 15, 2016
Company Name
Reco
CMP
Target
Mkt Cap
Sales ( Čcr )
OPM(%)
EPS (Č)
PER(x)
P/BV(x)
RoE(%)
EV/Sales(x)
(Č)
Price ( Č)
( Č cr )
FY16E
FY17E
FY16E
FY17E
FY16E
FY17E
FY16E
FY17E
FY16E
FY17E
FY16E
FY17E
FY16E
FY17E
Construction
Power Mech Projects
Neutral
580
-
853
1,539
1,801
12.8
12.7
59.0
72.1
9.8
8.0
1.5
1.3
18.6
16.8
0.6
0.5
Sadbhav Engineering
Neutral
288
-
4,940
3,186
3,598
10.2
10.3
8.0
9.0
36.0
32.0
3.4
2.9
9.4
9.9
1.9
1.6
NBCC
Buy
184
220
11,064
5,838
7,428
6.0
7.9
5.2
8.2
35.5
22.5
1.1
0.9
21.9
28.2
1.7
1.2
MEP Infra
Neutral
37
-
607
1,956
1,876
28.1
30.5
1.3
3.0
28.7
12.5
6.0
4.1
21.2
32.8
1.7
1.7
SIPL
Neutral
100
-
3,522
675
1,042
62.4
64.7
-
-
3.8
4.3
-
-
16.9
11.4
Engineers India
Neutral
194
-
6,525
1,667
1,725
13.5
16.0
9.7
11.4
20.0
17.0
2.3
2.3
11.7
13.4
2.7
2.7
Financials
Allahabad Bank
Neutral
54
-
3,875
8,569
9,392
2.8
2.9
16.3
27.5
3.3
2.0
0.3
0.2
7.6
11.9
-
-
Axis Bank
Neutral
530
-
126,550
26,204
29,738
3.6
3.5
34.5
35.4
15.4
15.0
2.4
2.2
16.8
14.9
-
-
Bank of Baroda
Neutral
149
-
34,286
18,802
21,088
2.0
2.2
(7.4)
13.0
11.4
1.2
0.9
(4.2)
7.3
-
-
Bank of India
Neutral
90
-
8,448
15,972
17,271
1.9
2.0
15.3
33.4
5.9
2.7
0.3
0.2
3.6
7.6
-
-
Canara Bank
Neutral
197
-
10,702
15,441
16,945
2.0
2.1
46.6
70.4
4.2
2.8
0.4
0.3
8.0
11.2
-
-
Dena Bank
Neutral
30
-
2,014
3,440
3,840
2.1
2.3
7.3
10.0
4.2
3.0
0.3
0.3
6.1
7.9
-
-
Dewan Housing Finance Buy
205
270
5,983
1,828
2,225
2.9
3.0
24.9
29.7
8.2
6.9
1.3
1.1
15.1
16.1
-
-
Equitas Holdings
Buy
171
235
5,742
679
1,076
12.4
11.7
6.2
6.7
27.7
25.6
3.5
2.5
13.3
12.5
-
-
Federal Bank
Neutral
58
-
10,034
3,279
3,787
2.8
2.9
3.9
5.5
14.8
10.6
1.2
1.1
8.4
10.8
-
-
HDFC
Neutral
1,200
-
189,569
10,358
11,852
3.3
3.3
41.1
47.0
29.2
25.5
5.6
5.1
24.7
24.9
-
-
HDFC Bank
Accumulate
1,152
1,262
291,555
38,606
47,696
4.4
4.5
48.8
61.4
23.6
18.8
4.0
3.5
18.7
20.0
-
-
ICICI Bank
Neutral
245
-
142,702
34,279
39,262
3.3
3.3
21.0
24.4
11.7
10.1
2.0
1.7
14.4
14.7
-
-
IDBI Bank
Neutral
70
-
14,350
9,625
10,455
1.8
1.8
8.5
14.2
8.2
4.9
0.5
0.5
5.9
9.3
-
-
Indian Bank
Neutral
107
-
5,125
6,160
6,858
2.5
2.5
24.5
29.8
4.4
3.6
0.4
0.3
7.7
8.6
-
-
LIC Housing Finance
Buy
470
592
23,704
3,179
3,758
2.6
2.6
32.9
40.6
14.3
11.6
2.6
2.2
19.6
20.7
-
-
Oriental Bank
Neutral
93
-
3,211
7,643
8,373
2.4
2.4
37.2
45.4
2.5
2.0
0.2
0.2
8.2
9.4
-
-
Punjab Natl.Bank
Neutral
90
-
17,574
23,122
26,022
2.8
2.8
7.0
21.6
12.8
4.1
0.7
0.6
3.4
10.0
-
-
South Ind.Bank
Neutral
21
-
2,782
1,965
2,185
2.5
2.5
2.5
3.3
8.3
6.2
0.8
0.7
9.5
11.7
-
-
St Bk of India
Neutral
208
-
161,116
79,958
86,061
2.6
2.6
13.4
20.7
15.5
10.0
1.3
1.2
11.5
12.8
-
-
Union Bank
Neutral
122
-
8,387
12,646
14,129
2.3
2.4
31.0
39.1
3.9
3.1
0.4
0.4
9.8
11.4
-
-
Vijaya Bank
Neutral
32
-
3,181
3,536
3,827
1.9
1.9
5.5
6.7
5.8
4.8
0.5
0.4
7.8
8.8
-
-
Yes Bank
Neutral
1,065
-
44,847
7,190
9,011
3.2
3.3
58.2
69.7
18.3
15.3
3.3
2.8
19.2
19.6
-
-
FMCG
Asian Paints
Neutral
986
-
94,543
15,534
17,445
17.7
16.8
18.4
19.6
53.7
50.3
19.0
17.9
34.6
35.6
6.0
5.3
Stock Watch
June 15, 2016
Company Name
Reco
CMP
Target
Mkt Cap
Sales ( Čcr )
OPM(%)
EPS (Č)
PER(x)
P/BV(x)
RoE(%)
EV/Sales(x)
(Č)
Price ( Č)
( Č cr )
FY16E FY17E
FY16E
FY17E
FY16E
FY17E
FY16E
FY17E
FY16E
FY17E
FY16E
FY17E
FY16E
FY17E
FMCG
Britannia
Neutral
2,688
-
32,245
8,481
9,795
14.0
14.1
65.5
78.3
41.0
34.3
19.4
15.9
38.3
41.2
3.7
3.2
Colgate
Neutral
862
-
23,442
4,136
4,632
22.5
23.3
22.2
25.3
38.8
34.1
23.6
21.0
68.6
67.5
5.6
5.0
Dabur India
Neutral
307
-
54,050
9,370
10,265
17.6
17.3
7.3
8.1
41.9
37.9
10.9
9.9
31.7
30.6
5.5
5.0
GlaxoSmith Con*
Accumulate
5,616
6,118
23,619
4,519
5,142
19.6
19.8
164.3
191.2
34.2
29.4
9.5
8.1
30.8
29.9
4.7
4.1
Godrej Consumer
Neutral
1,487
-
50,631
9,003
10,335
18.1
18.7
34.1
41.8
43.6
35.6
9.4
8.1
23.9
24.8
5.8
5.0
HUL
Neutral
867
-
187,584
33,299
35,497
17.1
17.1
18.9
20.0
45.9
43.3
40.2
35.0
87.6
80.8
5.5
5.1
ITC
Accumulate
353
380
284,308
36,837
39,726
38.8
38.7
12.2
13.5
28.9
26.2
8.1
7.1
27.8
26.9
7.1
6.6
Marico
Neutral
252
-
32,512
6,151
6,966
17.2
17.3
5.4
6.4
46.7
39.4
14.7
11.6
33.2
32.4
5.2
4.6
Nestle*
Neutral
6,585
-
63,489
9,393
10,507
22.2
22.3
106.8
121.8
61.7
54.1
21.7
19.5
34.8
36.7
6.5
5.8
Tata Global
Accumulate
127
137
7,984
8,635
9,072
9.8
9.9
5.8
7.2
21.8
17.6
1.9
1.9
6.8
7.4
1.0
0.9
Procter & Gamble
Buy
6,170
7,369
20,028
2,588
2,939
23.3
23.2
130.2
146.2
47.4
42.2
94.5
90.6
27.6
25.3
7.4
6.4
Hygiene
IT
HCL Tech^
Buy
752
1,000
106,039
37,061
30,781
21.5
20.5
51.4
40.0
14.6
18.8
3.8
2.7
20.1
20.3
2.6
2.8
Infosys
Buy
1,175
1,374
269,937
62,441
70,558
27.5
27.5
59.0
65.3
19.9
18.0
4.0
3.6
22.2
22.4
3.8
3.3
TCS
Buy
2,535
3,004
499,444
108,646
122,770
28.3
28.3
123.7
141.0
20.5
18.0
6.8
6.2
33.1
34.6
4.2
3.6
Tech Mahindra
Buy
534
700
51,806
26,494
30,347
16.3
17.0
32.2
37.5
16.6
14.2
3.6
3.1
21.7
21.8
1.7
1.4
Wipro
Buy
542
680
133,900
50,808
56,189
23.7
23.8
37.3
40.7
14.5
13.3
2.8
2.5
19.2
17.7
2.1
1.7
Media
D B Corp
Neutral
373
-
6,853
2,025
2,187
27.4
27.4
17.4
18.9
21.4
19.8
4.8
4.4
22.9
23.7
3.3
3.1
HT Media
Neutral
80
-
1,857
2,495
2,673
12.9
13.2
6.8
7.2
11.7
11.1
0.9
0.9
7.5
7.8
0.3
0.3
Jagran Prakashan
Buy
170
205
5,558
2,107
2,355
33.5
28.0
10.1
10.8
16.9
15.7
3.9
3.4
23.3
21.7
2.7
2.4
Sun TV Network
Neutral
373
-
14,695
2,510
2,763
71.8
71.5
21.9
24.8
17.0
15.0
4.0
3.7
22.8
24.3
5.2
4.7
Hindustan Media
Neutral
273
-
2,004
914
1,016
21.7
21.5
21.9
23.3
12.5
11.7
2.2
1.9
18.0
16.2
1.6
1.4
Ventures
Metals & Mining
Coal India
Buy
309
380
194,955
76,167
84,130
19.9
22.3
22.4
25.8
13.8
12.0
5.0
4.8
35.5
41.0
1.9
1.7
Hind. Zinc
Neutral
176
-
74,492
14,641
14,026
50.4
50.4
17.7
16.0
10.0
11.0
1.5
1.4
16.2
13.2
2.7
2.6
Hindalco
Neutral
115
-
23,830
104,356
111,186
8.7
9.5
6.7
11.1
17.2
10.4
0.6
0.6
3.5
5.9
0.8
0.7
JSW Steel
Neutral
1,405
-
33,966
42,308
45,147
16.4
20.7
(10.3)
49.5
28.4
1.6
1.5
(1.0)
5.6
1.9
1.7
NMDC
Neutral
91
-
36,000
8,237
10,893
46.6
44.5
10.0
11.7
9.1
7.8
1.0
0.9
12.5
13.0
4.1
3.2
SAIL
Neutral
45
-
18,585
45,915
53,954
7.2
10.5
1.5
4.4
29.9
10.3
0.4
0.4
2.3
4.1
1.0
0.9
Vedanta
Neutral
115
-
34,020
71,445
81,910
26.2
26.3
12.9
19.2
8.9
6.0
0.6
0.6
7.2
8.9
0.9
0.7
Tata Steel
Neutral
325
-
31,565
126,760
137,307
8.9
11.3
6.4
23.1
51.1
14.1
1.0
1.0
2.0
7.1
0.8
0.8
Stock Watch
June 15, 2016
Company Name
Reco
CMP
Target
Mkt Cap
Sales ( Čcr )
OPM(%)
EPS (Č)
PER(x)
P/BV(x)
RoE(%)
EV/Sales(x)
(Č)
Price ( Č)
( Č cr )
FY16E FY17E
FY16E
FY17E
FY16E
FY17E
FY16E
FY17E
FY16E
FY17E
FY16E
FY17E
FY16E
FY17E
Oil & Gas
Cairn India
Neutral
139
-
25,986
11,323
12,490
49.4
51.0
20.7
20.7
6.7
6.7
0.4
0.4
6.4
6.1
1.4
0.7
GAIL
Neutral
373
-
47,257
64,856
70,933
9.1
9.6
24.0
28.9
15.6
12.9
1.3
1.2
8.8
9.6
0.9
0.8
ONGC
Neutral
213
-
182,189
154,564
145,998
36.8
37.4
20.8
22.6
10.3
9.4
1.0
0.9
10.1
9.7
1.4
1.5
Petronet LNG
Neutral
279
-
20,959
29,691
31,188
5.8
6.2
12.8
13.4
21.9
20.8
3.3
2.9
15.8
14.8
0.8
0.7
Indian Oil Corp
Accumulate
414
455
100,529
359,607
402,760
5.9
6.1
42.5
48.7
9.8
8.5
1.3
1.2
14.1
14.4
0.4
0.3
Reliance Industries
Buy
975
1,150
316,106
304,775
344,392
12.6
13.4
91.3
102.6
10.7
9.5
1.2
1.1
11.8
12.0
1.0
0.8
Pharmaceuticals
Alembic Pharma
Neutral
551
-
10,396
3,145
3,483
31.9
16.2
38.2
18.7
14.4
29.5
6.5
5.5
57.9
20.1
3.3
3.0
Aurobindo Pharma
Neutral
750
-
43,894
13,651
15,702
21.7
21.7
33.9
38.4
22.1
19.5
6.2
4.8
32.5
27.7
3.5
3.1
Aventis*
Accumulate
4,194
4,738
9,659
2,049
2,375
15.4
17.3
115.4
153.5
36.3
27.3
5.9
4.6
19.3
25.8
4.5
3.8
Cadila Healthcare
Buy
319
400
32,668
9,469
11,246
21.2
22.0
14.9
17.1
21.4
18.7
6.1
4.8
28.8
26.6
3.4
2.8
Cipla
Neutral
482
-
38,739
13,372
15,378
16.4
17.4
19.6
18.8
24.6
25.7
3.2
2.8
13.1
13.8
2.8
2.7
Dr Reddy's
Accumulate
3,096
3,476
52,798
15,471
17,479
24.6
24.6
138.2
152.4
22.4
20.3
4.1
3.5
19.7
18.7
3.4
3.0
Dishman Pharma
Neutral
143
-
2,314
1,733
1,906
21.5
21.5
10.1
10.0
14.2
14.3
1.7
1.5
10.5
11.2
1.9
1.6
GSK Pharma*
Neutral
3,472
-
29,405
2,870
3,158
20.0
22.1
59.5
68.3
58.3
50.8
17.2
17.7
28.5
34.3
9.9
9.0
Indoco Remedies
Neutral
280
-
2,582
1,033
1,199
15.9
18.2
9.4
13.6
29.8
20.6
4.4
3.8
15.7
19.7
2.6
2.2
Ipca labs
Buy
464
750
5,851
3,363
3,909
12.9
18.6
13.4
28.0
34.6
16.6
2.5
2.2
7.4
14.0
2.0
1.7
Lupin
Buy
1,451
1,809
65,395
13,702
15,912
23.7
26.4
50.5
58.1
28.7
25.0
5.9
4.9
22.9
21.4
5.2
4.2
Sun Pharma
Buy
753
950
181,152
28,163
32,610
25.8
30.7
17.4
26.9
43.3
28.0
4.1
3.6
13.0
16.6
5.8
4.8
Power
Tata Power
Neutral
76
-
20,461
35,923
37,402
22.6
22.8
4.1
5.2
18.7
14.7
1.4
1.3
7.5
9.3
1.5
1.4
NTPC
Neutral
148
-
122,198
87,271
99,297
23.5
23.5
11.8
13.3
12.6
11.1
1.4
1.3
11.5
12.2
2.4
2.2
Power Grid
Accumulate
151
170
78,866
20,702
23,361
86.7
86.4
12.1
13.2
12.5
11.4
1.8
1.6
15.6
15.1
8.8
8.1
Real Estate
MLIFE
Buy
447
554
1,834
826
1,011
20.1
21.9
22.7
30.7
19.7
14.6
1.2
1.1
6.0
7.4
4.1
3.1
Telecom
Bharti Airtel
Neutral
342
-
136,771
101,748
109,191
32.1
31.7
12.0
12.5
28.5
27.4
2.0
1.8
6.9
6.7
2.0
1.8
Idea Cellular
Neutral
100
-
35,916
34,282
36,941
32.0
31.5
5.9
6.2
16.9
16.1
1.6
1.4
9.9
9.3
1.6
1.5
zOthers
Abbott India
Neutral
4,422
-
9,396
2,715
3,153
14.5
14.1
134.3
152.2
32.9
29.0
8.2
6.8
27.4
25.6
3.2
2.7
Bajaj Electricals
Buy
229
268
2,313
4,612
5,351
5.6
5.7
23.4
18.0
9.8
12.8
3.0
2.7
12.5
14.4
0.5
0.4
Finolex Cables
Neutral
347
-
5,300
2,520
2,883
12.2
12.0
12.7
14.2
27.4
24.4
3.7
3.3
13.6
13.5
1.9
1.6
Goodyear India*
Buy
519
631
1,198
1,800
1,600
11.7
11.5
58.7
52.9
8.8
9.8
2.0
1.7
24.6
18.7
0.4
0.4
Hitachi
Neutral
1,245
-
3,386
1,779
2,081
7.8
8.8
21.8
33.4
57.1
37.3
9.2
7.5
17.4
22.1
2.0
1.7
Stock Watch
June 15, 2016
Company Name
Reco
CMP
Target
Mkt Cap
Sales ( Čcr )
OPM(%)
EPS (Č)
PER(x)
P/BV(x)
RoE(%)
EV/Sales(x)
(Č)
Price ( Č)
( Č cr )
FY16E
FY17E
FY16E
FY17E
FY16E
FY17E
FY16E
FY17E
FY16E
FY17E
FY16E
FY17E
FY16E
FY17E
zOthers
Jyothy Laboratories
Neutral
292
-
5,297
1,620
1,847
11.5
11.5
7.3
8.5
40.1
34.5
5.2
4.8
13.3
14.4
3.0
2.6
MRF
Buy
31,888
45,575
13,524
20,316
14,488
21.4
21.1
5,488.0
3,798.0
5.8
8.4
2.0
1.6
41.1
21.2
0.6
0.8
Page Industries
Neutral
13,513
-
15,073
1,929
2,450
19.8
20.1
229.9
299.0
58.8
45.2
25.9
18.0
52.1
47.1
7.9
6.2
Relaxo Footwears
Neutral
456
-
5,479
1,767
2,152
12.3
12.5
19.3
25.1
23.7
18.2
5.8
4.5
27.7
27.8
3.1
2.5
Siyaram Silk Mills
Buy
1,035
1,347
970
1,619
1,799
11.6
11.6
93.5
104.9
11.1
9.9
1.9
1.6
17.1
16.4
0.8
0.8
Styrolution ABS India* Neutral
624
-
1,096
1,271
1,440
8.6
9.2
32.0
41.1
19.5
15.2
2.0
1.8
10.7
12.4
0.8
0.7
TVS Srichakra
Buy
2,384
2,932
1,825
2,035
2,252
15.9
15.3
248.6
268.1
9.6
8.9
4.2
3.0
43.6
33.9
0.9
0.8
HSIL
Buy
258
310
1,865
2,123
2,384
16.1
16.5
15.0
18.9
17.2
13.7
1.3
1.2
8.0
9.4
1.2
1.1
Kirloskar Engines India
Neutral
255
-
3,688
2,403
2,554
8.6
9.9
9.2
10.5
27.8
24.3
2.7
2.5
9.7
10.7
1.2
1.1
Ltd
M M Forgings
Buy
442
546
533
511
615
21.7
21.6
43.1
55.8
10.3
7.9
1.9
1.5
19.9
21.2
1.2
0.9
Banco Products (India) Neutral
138
-
987
1,208
1,353
11.0
12.3
10.8
14.5
12.8
9.5
1.5
1.3
11.9
14.5
0.8
0.7
Competent Automobiles Neutral
144
-
89
1,040
1,137
3.2
3.1
25.7
28.0
5.6
5.2
0.8
0.7
15.0
14.3
0.1
0.1
Nilkamal
Neutral
1,199
-
1,789
1,871
2,031
10.7
10.5
63.2
69.8
19.0
17.2
3.1
2.7
17.6
16.6
1.0
0.9
Visaka Industries
Accumulate
152
162
242
1,020
1,120
8.7
9.1
13.9
20.1
10.9
7.6
0.7
0.7
6.4
8.7
0.5
0.4
Transport Corporation of
Neutral
305
-
2,335
2,830
3,350
8.8
9.0
14.4
18.3
21.2
16.7
3.3
2.8
15.4
17.1
1.0
0.9
India
Elecon Engineering
Neutral
61
-
667
1,359
1,482
10.3
13.7
0.8
3.9
76.3
15.7
1.3
1.2
1.6
7.8
0.8
0.8
Surya Roshni
Buy
163
201
712
2,992
3,223
8.1
8.4
14.7
18.3
11.1
8.9
1.0
0.9
9.7
11.0
0.5
0.5
MT Educare
Neutral
169
-
671
286
366
18.3
17.7
7.7
9.4
21.8
18.0
4.6
4.0
20.2
21.1
2.3
1.8
Radico Khaitan
Buy
92
125
1,223
1,543
1,659
12.6
13.0
5.8
6.3
15.9
14.5
1.4
1.3
8.5
8.6
1.3
1.2
Garware Wall Ropes
Buy
344
460
752
828
898
11.2
10.3
28.3
29.0
12.2
11.8
2.0
1.8
16.8
14.9
0.8
0.7
Wonderla Holidays
Neutral
395
-
2,234
206
308
44.0
43.6
9.0
12.9
43.9
30.7
6.0
5.4
13.7
17.8
10.6
7.1
Linc Pen & Plastics
Buy
203
235
300
344
382
9.1
9.1
12.4
13.1
16.4
15.5
3.0
2.6
18.0
16.7
1.0
0.9
The Byke Hospitality
Neutral
164
-
657
222
287
20.5
20.5
5.6
7.6
29.1
21.7
5.5
4.5
18.9
20.8
3.0
2.3
Interglobe Aviation
Neutral
990
-
35,688
17,022
21,122
20.7
14.5
63.9
53.7
15.5
18.5
23.2
19.0
149.9
103.2
2.1
1.7
Coffee Day Enterprises
Neutral
253
-
5,213
2,692
2,964
17.0
18.6
-
4.7
-
53.4
3.1
2.9
0.2
5.5
2.3
2.2
Ltd
Navneet Education
Neutral
91
-
2,157
998
1,062
24.1
24.0
5.8
6.1
15.7
14.9
3.5
3.1
22.0
20.6
2.2
2.1
Navkar Corporation
Buy
195
265
2,781
347
408
43.2
42.9
6.7
6.8
29.2
28.8
2.1
2.0
7.3
6.9
8.5
7.7
UFO Moviez
Neutral
531
-
1,466
558
619
32.0
33.2
22.5
30.0
23.6
17.7
2.8
2.5
12.0
13.8
2.5
2.1
VRL Logistics
Neutral
301
-
2,749
1,725
1,902
16.5
16.7
12.2
14.6
24.8
20.7
5.2
4.5
20.8
21.9
1.8
1.6
Stock Watch
June 15, 2016
Company Name
Reco
CMP
Target Mkt Cap
Sales ( Čcr )
OPM(%)
EPS (Č)
PER(x)
P/BV(x)
RoE(%)
EV/Sales(x)
(Č)
Price ( Č)
( Č cr )
FY16E FY17E FY16E FY17E FY16E FY17E FY16E FY17E FY16E FY17E FY16E FY17E FY16E FY17E
zOthers
Team Lease Serv.
Neutral
912
-
1,559
2,565
3,229
1.3
1.5
15.2
22.8
60.1
40.1
4.8
4.3
8.0
10.7
0.5
0.4
S H Kelkar & Co.
Neutral
213
-
3,085
928
1,036
15.3
15.1
4.9
6.1
43.2
34.9
4.0
3.7
9.4
10.7
3.3
2.9
Quick Heal
Neutral
255
-
1,788
339
408
27.8
27.3
7.1
7.7
36.1
33.0
3.1
3.1
8.5
9.3
4.1
3.5
Narayana Hrudaya
Neutral
319
-
6,510
1,603
1,873
10.9
11.5
1.0
2.6
334.4
120.4
8.1
7.4
2.4
6.1
4.2
3.6
Manpasand Bever.
Neutral
546
-
2,732
540
836
19.9
19.6
10.2
16.9
53.3
32.3
4.3
3.9
8.1
12.0
4.7
3.0
Source: Company, Angel Research; Note: *December year end; #September year end; &October year end; Price as on June 14, 2016
Market Outlook
June 15, 2016
Research Team Tel: 022 - 39357800
DISCLAIMER
Angel Broking Private Limited (hereinafter referred to as “Angel”) is a registered Member of National Stock Exchange of India Limited,
Bombay Stock Exchange Limited and Metropolitian Stock Exchange of India Limited. It is also registered as a Depository Participant with
CDSL and Portfolio Manager with SEBI. It also has registration with AMFI as a Mutual Fund Distributor. Angel Broking Private Limited is a
registered entity with SEBI for Research Analyst in terms of SEBI (Research Analyst) Regulations, 2014 vide registration number
INH000000164. Angel or its associates has not been debarred/ suspended by SEBI or any other regulatory authority for accessing
/dealing in securities Market. Angel or its associates including its relatives/analyst do not hold any financial interest/beneficial ownership
of more than 1% in the company covered by Analyst. Angel or its associates/analyst has not received any compensation / managed or co
-managed public offering of securities of the company covered by Analyst during the past twelve months. Angel/analyst has not served as
an officer, director or employee of company covered by Analyst and has not been engaged in market making activity of the company
covered by Analyst.
This document is solely for the personal information of the recipient, and must not be singularly used as the basis of any investment
decision. Nothing in this document should be construed as investment or financial advice. Each recipient of this document should make
such investigations as they deem necessary to arrive at an independent evaluation of an investment in the securities of the companies
referred to in this document (including the merits and risks involved), and should consult their own advisors to determine the merits and
risks of such an investment.
Reports based on technical and derivative analysis center on studying charts of a stock's price movement, outstanding positions and
trading volume, as opposed to focusing on a company's fundamentals and, as such, may not match with a report on a company's
fundamentals.
The information in this document has been printed on the basis of publicly available information, internal data and other reliable sources
believed to be true, but we do not represent that it is accurate or complete and it should not be relied on as such, as this document is for
general guidance only. Angel Broking Pvt. Limited or any of its affiliates/ group companies shall not be in any way responsible for any
loss or damage that may arise to any person from any inadvertent error in the information contained in this report. Angel Broking Pvt.
Limited has not independently verified all the information contained within this document. Accordingly, we cannot testify, nor make any
representation or warranty, express or implied, to the accuracy, contents or data contained within this document. While Angel Broking
Pvt. Limited endeavors to update on a reasonable basis the information discussed in this material, there may be regulatory, compliance,
or other reasons that prevent us from doing so.
This document is being supplied to you solely for your information, and its contents, information or data may not be reproduced,
redistributed or passed on, directly or indirectly.
Neither Angel Broking Pvt. Limited, nor its directors, employees or affiliates shall be liable for any loss or damage that may arise from or
in connection with the use of this information.
Note: Please refer to the important ‘Stock Holding Disclosure' report on the Angel website (Research Section). Also, please refer to the
latest update on respective stocks for the disclosure status in respect of those stocks. Angel Broking Pvt. Limited and its affiliates may have
investment positions in the stocks recommended in this report.