Market Outlook
December 14, 2015
Market Cues
Domestic Indices
Chg (%)
(Pts)
(Close)
Indian markets are expected to open negatively tracking the SGX Nifty and weak
BSE Sensex
(0.8)
(208)
25,044
global cues.
Nifty
(0.9)
(73)
7,610
U.S. markets fell steeply, with the major indices correcting by about 2% as crude oil
Mid Cap
(1.2)
(126)
10,576
prices plumbed to seven year low levels on growing oversupply concerns.
Small Cap
(0.8)
(91)
11,213
European shares closed lower with the pan European STOXX 600 closing down
Bankex
(2.2)
(428)
18,651
1.9% as the decline in the oil prices weighed on the indices.
Indian shares ended the week on a negative note. The decline in the indices was led
Global Indices
Chg (%)
(Pts)
(Close)
by the banking and the telecom space.
Dow Jones
(1.8)
(310)
17,265
News & Result Analysis
Nasdaq
(2.2)
(112)
4,933
NGT bans registration of new diesel vehicles in Delhi
FTSE
(2.2)
(135)
5,953
Government slaps anti-dumping duty on stainless steel
Nikkei
1.0
184
19,230
Detailed analysis on Pg2
Hang Seng
(1.1)
(241)
21,464
Investor’s Ready Reckoner
Shanghai Com
(0.6)
(21)
3,435
Key Domestic & Global Indicators
Advances / Declines
BSE
NSE
Stock Watch: Latest investment recommendations on 150+ stocks
Refer P4 onwards
Advances
956
1,117
Declines
1,718
418
Top Picks
Unchanged
198
66
CMP
Target
Upside
Company
Sector
Rating
(`)
(`)
(%)
Axis Bank
Financials
Buy
440
630
43.2
Volumes (` Cr)
HCL Tech
IT
Buy
840
1,132
34.8
BSE
3,853
ICICI Bank
Financials
Buy
249
354
42.0
NSE
15,571
Ashok Leyland
Automobiles
Buy
86
111
28.5
Larsen & Toubro
Construction
Buy
1,284
1,646
28.2
Net Inflows (` Cr)
Net
Mtd
Ytd
More Top Picks on Pg3
FII
(452)
(3,185)
(25,634)
Key Upcoming Events
MFs
148
1,271
58,166
Previous
Consensus
Date
Region
Event Description
Reading
Expectations
Dec 14
India
Monthly Wholesale Prices YoY%
(3.81)
(2.48)
Top Gainers
Price (`)
Chg (%)
Dec 15
US
Consumer price index (mom)
0.20
-
Pmcfin
1
9.5
Dec 16
US
Housing starts
1,060k
1,140k
Gati
169
7.0
Dec 16
Germany
PMI Services
55.6
55.5
Sadbhav
342
5.7
Pvr
790
4.9
Kpit
169
4.2
Top Losers
Price (`)
Chg (%)
Piind
598
(7.5)
Prestige
198
(5.6)
Jswenergy
75
(5.6)
Unitech
6
(5.4)
Pnb
123
(5.0)
As on December 11, 2015
Market Outlook
December 14, 2015
NGT bans registration of new diesel vehicles in Delhi
In the backdrop of rising pollution level in Delhi, the National Green Tribunal
(NGT) has ordered that diesel-run vehicles will not be registered in the national
capital. These will be interim steps till the next date of hearing on January 6, 2016,
said the green court. The NGT order further stated that there will be no renewal of
registration of diesel vehicles that are more than 10-years-old. It also asked the
Centre and Delhi government not to buy diesel cars for their respective
departments. The NGT's order came following Delhi government's proposed odd-
even formula for vehicles.
Delhi constitutes about 7% of the passenger vehicle sales and about 25% of the
passenger vehicles are diesel driven. We believe the NGT order is negative for
passenger vehicle players such as M&M and Maruti as the ban on diesel would
impact the sales. However, commercial vehicles are likely to be less impacted by
the order as the number of registrations in Delhi are relatively lower (as per our
estimates CV sales in Delhi are about 5%). We believe the impact of this ban on
the auto industry is negligible as these are only interim measures with the next
hearing scheduled on January 6, 2016. Further, the passenger vehicle consumers
have an option to purchase petrol and CNG variants which will limit the impact of
the ban. Also, the rule to not renew vehicles more than 10 years could boost the
demand for new commercial vehicles.
Government slaps anti-dumping duty on stainless steel
The Government imposed an anti-dumping duty ranging from 5-57% per cent on
import of cold-rolled flat products of stainless steel for five years. The duty has
been imposed on China, South Korea, the US, South Africa, Thailand and Taiwan,
besides the European Union. The highest duty has been levied on steel imports
from China at 57.39%, followed by the European Union at 52.56%, while imports
from Thailand will have the least duty imposition of 4.58%.
The government's decision comes in the wake of rising incidence of dumping
hampering the performance of domestic industry and with steel prices on a
decline. A review with regard to the imports of cold rolled flat products of stainless
steel was initiated in April 2014. We do not expect any significant impact for the
domestic steel players. The news is positive for Jindal Stainless.
Economic and Political News
Delhi can pay fixed cost & shut down Badarpur plant: Goyal
India, US seek co-production of new high technology items
Centre, states to discuss green nod to mines on Tuesday
Tribunal sets aside `6,316-crore CCI fine against 11 cement firms
Punjab govt approves over `3,330 crore for developing 16 cities under
AMRUT
Corporate News
Cairn takes govt to court on Barmer contract extension
Will set up 1 billion pound factory in Slovakia, says Tata JLR
Nepal seizes India-bound Dabur products
Kolte Patil in pact with J.P.Morgan for Mumbai project
Market Outlook
December 14, 2015
Top Picks ★★★★★
Large Cap
Market Cap
CMP
Target
Upside
Company
Rationale
(` Cr)
(`)
(`)
(%)
To outpace battery industry growth due to better technological
Amara Raja Batteries
14,301
837
1,040
24.2
products leading to market share gains in both the automotive
OEM and replacement segments.
Earnings to grow strongly given the MHCV cyclical upturn.
Ashok Leyland
24,588
86
111
28.5
Focus on exports and LCV's provides additional growth
avenue.
Healthy pace of branch expansion, backed by distribution
Axis Bank
104,607
440
630
43.2
network, will be the driving force for the bank’s retail business
and overall earnings.
The stock is trading at attractive valuations and is factoring all
HCL Tech
118,346
840
1,132
34.8
the bad news.
Strong visibility for a robust 20% earnings trajectory, coupled
HDFC Bank
263,867
1,046
1,262
20.7
with high quality of earnings on account of high quality retail
business and strategic focus on highly rated corporates.
Due to its robust franchise and capital adequacy position, the
bank is well positioned to grow by at least a few percentage
ICICI Bank
144,920
249
354
42.0
points higher than the average industry growth rate from a
structural point of view.
Back on the growth trend, expect a long term growth of 14%
Infosys
241,719
1,052
1,306
24.1
to be a US$20bn in FY2020.
Well positioned to benefit from such expected gradual
recovery in the overall domestic capex cycle, given its presence
Larsen & Toubro
119,605
1,284
1,646
28.2
across various infrastructure segments, its execution
capabilities, and its strong balance sheet.
LICHF continues to grow its retail loan book at a healthy pace
with improvement in asset quality. We expect the company to
LIC Housing Finance
23,260
461
571
23.9
post a healthy loan book which is likely to reflect in a strong
earnings growth.
Source: Company, Angel Research
Mid Cap
Market Cap
CMP
Target
Upside
Company
Rationale
(` Cr)
(`)
(`)
(%)
Favourable outlook for the AC industry to augur well for
Cooling products business which is out pacing the market
Blue Star
3,199
356
429
20.6
growth. EMPPAC division's profitability to improve once
operating environment turns around.
Change in business focus towards high-margin chronic &
Ipca labs
9,451
749
900
20.1
lifestyle segments and increasing penetration in Europe and
US
Economic recovery to have favourable impact on advertising &
circulation revenue growth. Further, the acquisition of a radio
Jagran Prakashan
4,922
151
169
12.3
business (Radio City) would also boost the company's revenue
growth.
Strong brand & quality teaching with innovative technologies &
MT Educare
536
135
169
25.5
higher government educational spending to boost growth
Earnings boost on back of stable material prices and
Radico Khaitan
1,389
104
156
49.4
favourable pricing environment. Valuation discount to peers
provides additional comfort
Strong brands and distribution network would boost growth
Siyaram Silk Mills
1,032
1,101
1,354
23.0
going ahead. Stock currently trades at an inexpensive
valuation.
Structural shift in the Lighting industry towards LED lighting will
Surya Roshni
584
133
183
37.4
drive growth.
Source: Company, Angel Research
Market Outlook
December 14, 2015
Key Upcoming Events
Global economic events release calendar
Date
Time
Country
Event Description
Unit
Period
Bloomberg Data
Last Reported Estimated
Dec 14, 2015
12:00PM
India
Monthly Wholesale Prices YoY%
% Change
Nov
(3.81)
(2.48)
Dec 15, 2015
7:00PM
US
Consumer price index (mom)
% Change
Nov
0.20
--
3:00PM
UK
CPI (YoY)
% Change
Nov
(0.10)
0.10
Dec 16, 2015
7:00PM
US
Housing Starts
Thousands
Nov
1,060.00
1,140.00
7:00PM
US
Building permits
Thousands
Nov
1,161.00
1,153.00
2:00PM
Germany
PMI Services
Value
Dec P
55.60
55.50
2:00PM
Germany
PMI Manufacturing
Value
Dec P
52.90
52.70
3:00PM
UK
Jobless claims change
% Change
Nov
3.30
1.25
3:30PM
Euro Zone
Euro-Zone CPI (YoY)
%
Nov F
0.10
0.10
7:45PM
US
Industrial Production
%
Nov
(0.15)
(0.10)
Dec 17, 2015
7:00PM
US
Initial Jobless claims
Thousands
Dec 12
282.00
--
12:30AM
US
FOMC rate decision
%
Dec 16
0.25
0.50
Dec 21, 2015
8:30PM
Euro Zone
Euro-Zone Consumer Confidence
Value
Dec A
(5.90)
--
Dec 22, 2015
8:30PM
US
Existing home sales
Million
Nov
5.36
--
7:00PM
US
GDP Qoq (Annualised)
% Change
3Q T
2.10
--
Dec 23, 2015
8:30PM
US
New home sales
Thousands
Nov
495.00
--
3:00PM
UK
GDP (YoY)
% Change
3Q F
2.30
--
Dec 29, 2015
8:30PM
US
Consumer Confidence
S.A./ 1985=100
Dec
90.40
--
Source: Bloomberg, Angel Research
Market Outlook
December 14, 2015
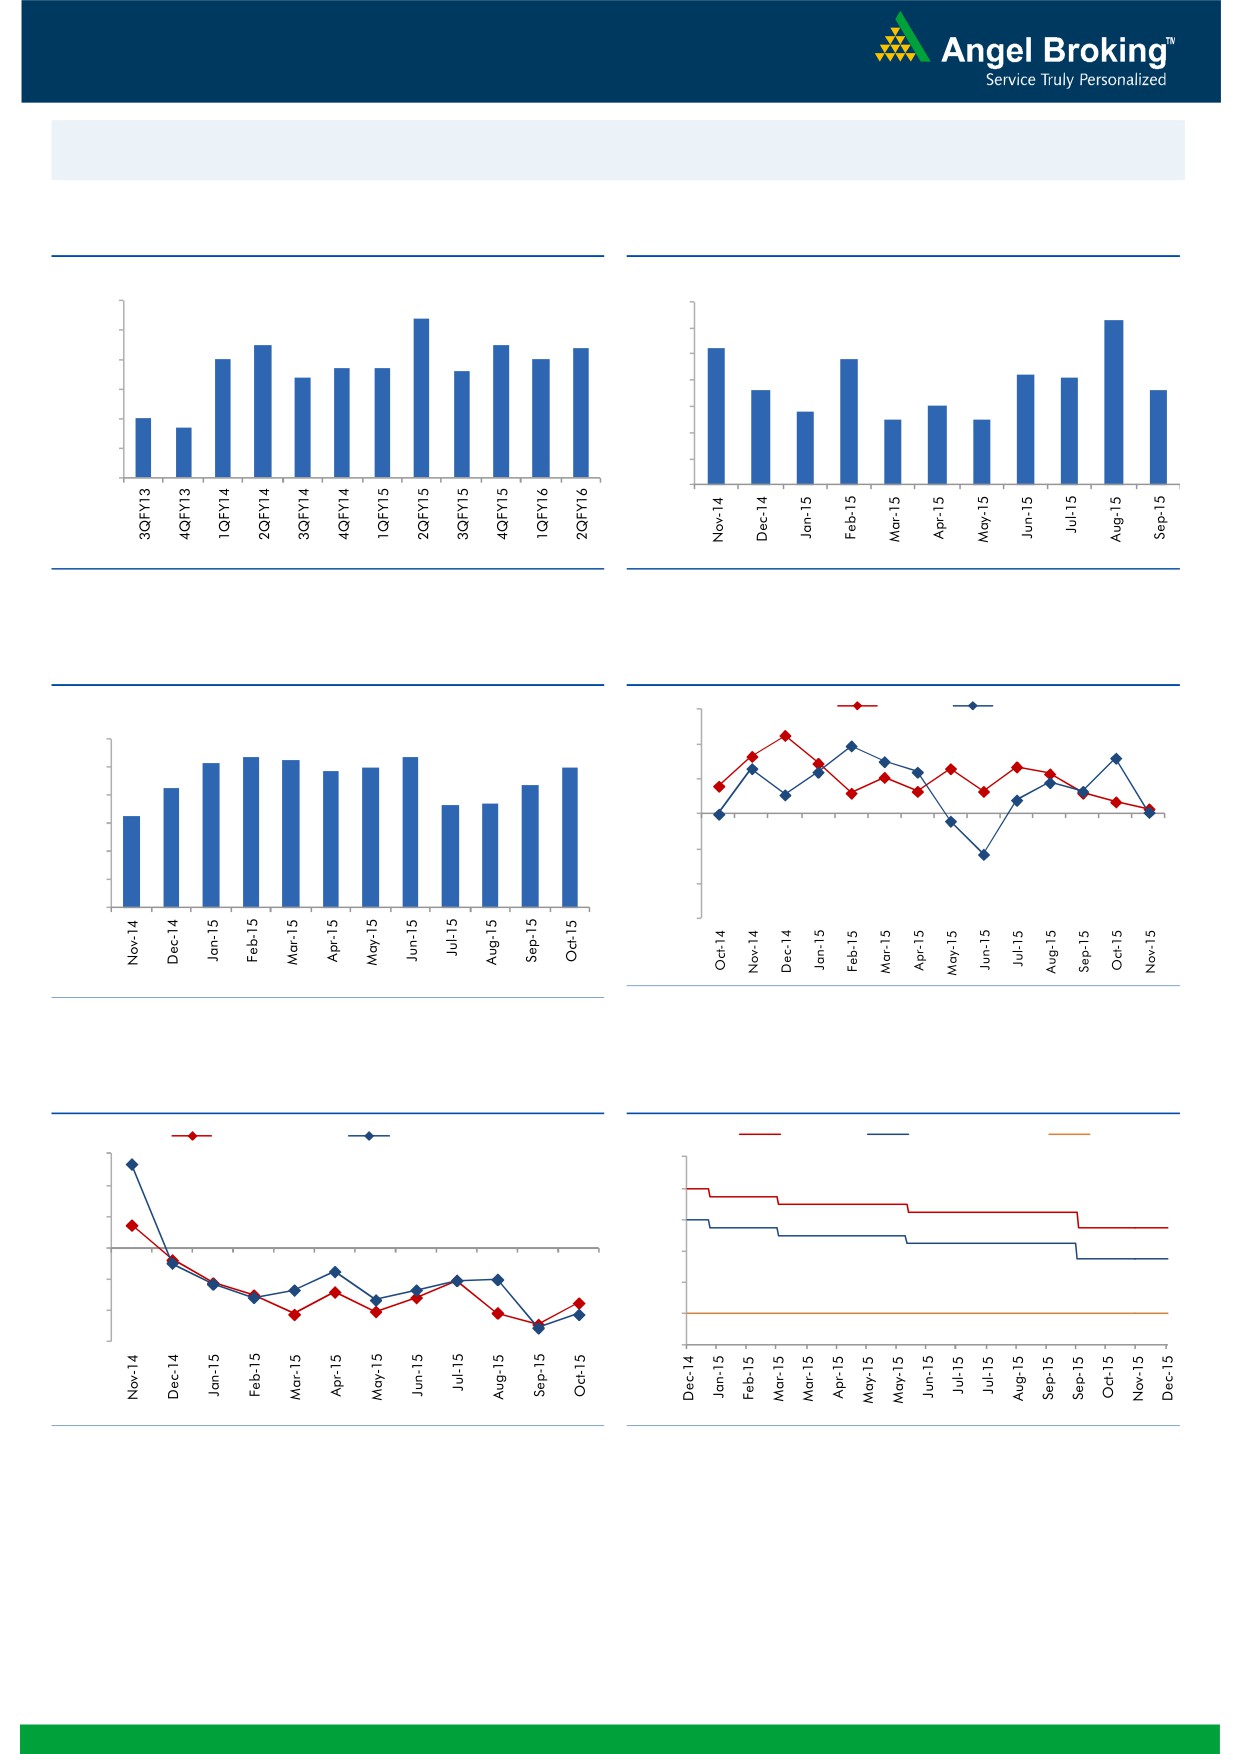
Macro watch
Exhibit 1: Quarterly GDP trends
Exhibit 2: IIP trends
(%)
(%)
9.0
8.4
7.0
6.3
8.0
7.5
7.5
7.4
6.0
5.2
7.0
7.0
4.8
6.7
6.7
6.6
5.0
7.0
6.4
4.2
4.1
3.6
3.6
4.0
6.0
2.8
3.0
5.0
3.0
2.5
2.5
4.7
5.0
2.0
4.0
1.0
3.0
-
Source: CSO, Angel Research
Source: MOSPI, Angel Research
Exhibit 3: Monthly CPI inflation trends
Exhibit 4: Manufacturing and services PMI
(%)
56.0
Mfg. PMI
Services PMI
6.0
5.4
5.3
5.4
54.0
5.2
5.0
5.0
4.9
5.0
4.3
4.4
52.0
3.7
3.7
4.0
3.3
50.0
3.0
2.0
48.0
1.0
46.0
-
44.0
Source: Market, Angel Research; Note: Level above 50 indicates expansion
Source: MOSPI, Angel Research
Exhibit 5: Exports and imports growth trends
Exhibit 6: Key policy rates
(%)
Exports yoy growth
Imports yoy growth
(%)
Repo rate
Reverse Repo rate
CRR
30.0
9.00
20.0
8.00
10.0
7.00
0.0
6.00
(10.0)
5.00
(20.0)
4.00
(30.0)
3.00
Source: Bloomberg, Angel Research
Source: RBI, Angel Research
Market Outlook
December 14, 2015
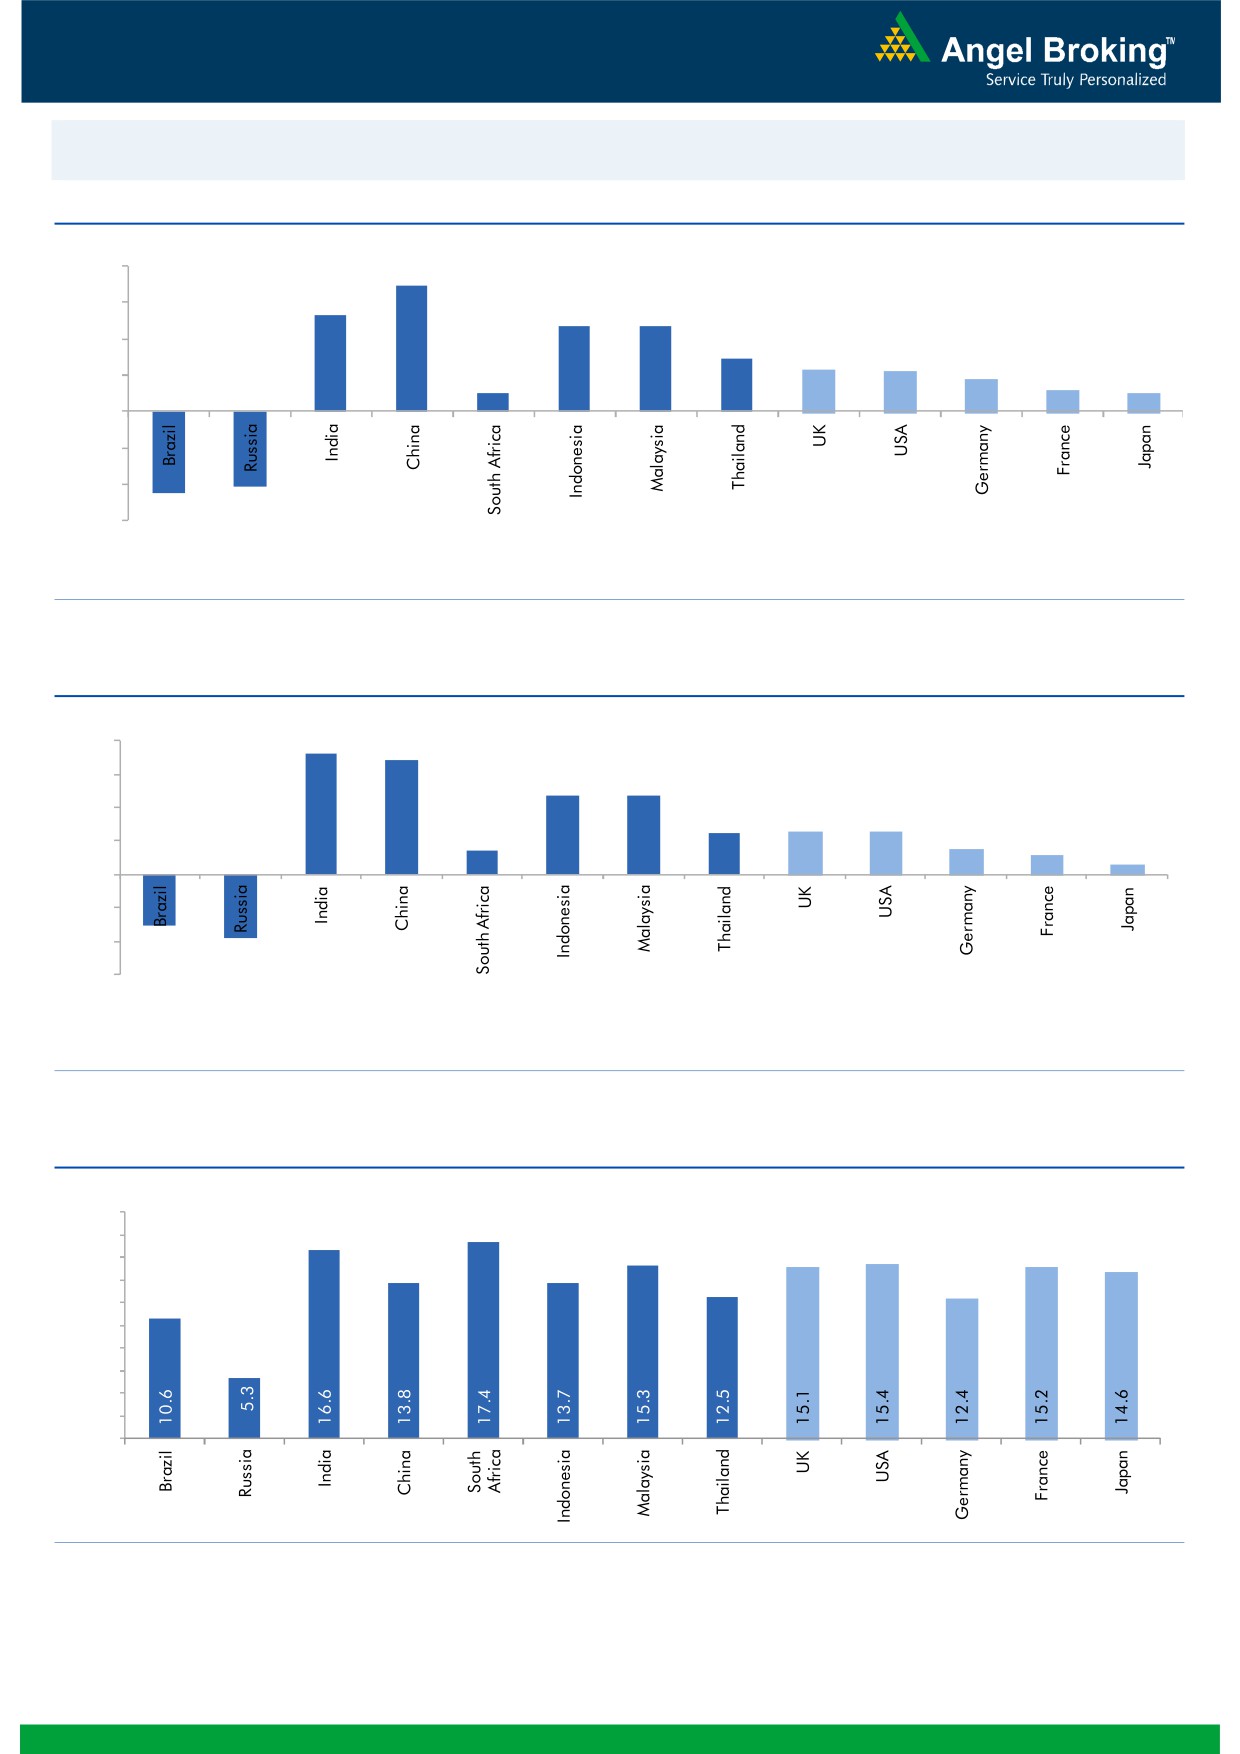
Global watch
Exhibit 1: Latest quarterly GDP Growth (%, yoy) across select developing and developed countries
(%)
8.0
6.9
6.0
5.3
4.7
4.7
4.0
2.9
2.3
2.2
1.8
2.0
1.0
1.2
1.0
-
(2.0)
(4.0)
(4.1)
(4.5)
(6.0)
Source: Bloomberg, Angel Research
Exhibit 2: 2015 GDP Growth projection by IMF (%, yoy) across select developing and developed countries
(%)
7.3
8.0
6.8
6.0
4.7
4.7
4.0
2.5
2.5
2.6
1.4
1.5
2.0
1.2
0.6
-
(2.0)
(4.0)
(3.0)
(3.8)
(6.0)
Source: IMF, Angel Research
Exhibit 3: One year forward P-E ratio across select developing and developed countries
(x)
20.0
18.0
16.0
14.0
12.0
10.0
8.0
6.0
4.0
2.0
-
Source: IMF, Angel Research
Market Outlook
December 14, 2015
Exhibit 4: Relative performance of indices across globe
Returns (%)
Country
Name of index
Closing price
1M
3M
1YR
Brazil
Bovespa
45,263
(2.0)
(3.0)
(12.0)
Russia
Micex
1,720
(1.2)
0.1
15.7
India
Nifty
7,610
(3.9)
(0.6)
(9.8)
China
Shanghai Composite
3,435
(5.4)
8.4
23.7
South Africa
Top 40
43,558
(7.8)
0.2
1.2
Mexico
Mexbol
42,001
(5.3)
(1.8)
1.5
Indonesia
LQ45
752
(1.7)
1.6
(16.5)
Malaysia
KLCI
1,640
(1.5)
3.3
(6.2)
Thailand
SET 50
819
(9.4)
(10.0)
(23.8)
USA
Dow Jones
17,265
(2.8)
5.1
(0.1)
UK
FTSE
5,953
(5.5)
(2.2)
(3.7)
Japan
Nikkei
19,230
(2.2)
8.1
8.9
Germany
DAX
10,340
(5.2)
2.1
7.8
France
CAC
4,550
(8.1)
0.7
10.6
Source: Bloomberg, Angel Research
Stock Watch
December 14, 2015
Company Name
Reco
CMP
Target
Mkt Cap
Sales ( Čcr )
OPM(%)
EPS (Č)
PER(x)
P/BV(x)
RoE(%)
EV/Sales(x)
(Č)
Price ( Č)
( Č cr )
FY16E FY17E
FY16E
FY17E
FY16E
FY17E
FY16E
FY17E
FY16E
FY17E
FY16E
FY17E
FY16E
FY17E
Agri / Agri Chemical
Rallis
Neutral
166
-
3,219
2,075
2,394
14.4
14.4
9.5
11.0
17.4
15.1
3.5
3.0
21.1
21.3
1.6
1.4
United Phosphorus
Buy
396
510
16,990
13,698
15,752
17.6
17.6
32.1
38.5
12.4
10.3
2.4
2.0
21.4
21.3
1.3
1.1
Auto & Auto Ancillary
Ashok Leyland
Buy
86
111
24,588
17,995
21,544
11.4
11.6
3.4
4.7
25.4
18.4
4.5
4.1
17.7
22.2
1.3
1.1
Bajaj Auto
Accumulate
2,412
2,728
69,792
23,695
27,298
21.3
20.4
134.6
151.5
17.9
15.9
5.7
4.9
31.8
30.6
2.5
2.1
Bharat Forge
Buy
801
943
18,636
7,867
8,881
20.0
20.3
34.4
41.0
23.3
19.5
4.5
3.7
21.1
20.9
2.5
2.2
Eicher Motors
Buy
15,561
19,036
42,254
15,379
16,498
15.6
16.6
473.2
574.8
32.9
27.1
12.2
9.1
36.7
33.2
2.7
2.4
Hero Motocorp
Accumulate
2,523
2,774
50,387
28,561
31,559
14.7
14.7
151.1
163.2
16.7
15.5
6.5
5.5
38.7
35.6
1.6
1.4
Jamna Auto Industries Accumulate
119
129
949
1,292
1,486
9.3
9.8
6.0
7.5
19.8
15.8
4.1
3.5
20.7
21.8
0.8
0.7
L G Balakrishnan & Bros Neutral
515
-
809
1,254
1,394
11.6
11.8
35.9
41.7
14.4
12.4
1.9
1.7
13.5
13.8
0.7
0.7
Mahindra and Mahindra Accumulate
1,262
1,449
78,400
39,031
44,440
13.8
13.9
57.9
67.6
21.8
18.7
3.5
3.1
16.1
16.6
1.7
1.4
Maruti
Neutral
4,481
-
135,374
57,865
68,104
16.4
16.7
176.3
225.5
25.4
19.9
4.9
4.2
19.4
21.2
2.1
1.7
Minda Industries
Accumulate
821
867
1,303
2,567
2,965
8.0
8.3
46.1
57.8
17.8
14.2
3.0
2.5
16.7
17.3
0.6
0.5
Motherson Sumi
Buy
272
313
35,965
39,343
45,100
8.8
9.1
10.1
12.5
26.9
21.8
8.5
6.7
35.3
34.4
1.0
0.9
Rane Brake Lining
Accumulate
327
366
259
454
511
11.1
11.4
23.8
28.1
13.7
11.6
2.0
1.8
14.2
15.3
0.7
0.6
Setco Automotive
Neutral
226
-
604
594
741
12.7
13.7
8.4
15.8
26.9
14.3
2.8
2.4
10.4
16.9
1.5
1.2
Tata Motors
Accumulate
378
402
109,122
255,254
301,772
12.9
13.4
23.7
37.3
16.0
10.1
1.9
1.6
7.4
12.1
0.6
0.5
TVS Motor
Buy
274
338
13,020
11,569
13,648
7.3
8.7
10.3
16.1
26.6
17.0
6.6
5.2
24.8
30.5
1.1
0.9
Amara Raja Batteries
Buy
837
1,040
14,301
4,892
5,871
17.4
17.6
28.8
37.1
29.1
22.6
6.8
5.4
23.4
24.1
2.9
2.3
Exide Industries
Buy
140
162
11,875
6,950
7,784
14.4
14.8
6.6
7.3
21.2
19.1
2.7
2.4
12.6
12.8
1.4
1.3
Apollo Tyres
Buy
149
171
7,562
12,146
12,689
16.8
16.0
21.2
19.0
7.0
7.8
1.2
1.0
16.5
13.0
0.7
0.7
Ceat
Accumulate
1,011
1,119
4,091
6,041
6,597
14.1
13.7
99.5
111.9
10.2
9.0
2.0
1.7
19.6
18.5
0.8
0.7
JK Tyres
Neutral
104
-
2,368
7,446
7,669
15.2
14.0
19.6
18.4
5.3
5.7
1.3
1.1
25.2
19.5
0.7
0.6
Swaraj Engines
Neutral
894
-
1,110
552
630
14.2
14.7
44.6
54.1
20.0
16.5
4.7
4.2
23.2
25.6
1.9
1.6
Subros
Neutral
92
-
552
1,268
1,488
11.6
11.9
3.7
6.6
24.9
14.0
1.7
1.5
6.8
11.4
0.7
0.6
Indag Rubber
Neutral
209
-
548
283
329
17.0
17.2
13.0
15.4
16.1
13.5
3.5
2.9
21.8
21.6
1.7
1.4
Capital Goods
ACE
Neutral
43
-
423
660
839
4.7
8.2
1.0
3.9
42.8
11.0
1.3
1.2
3.2
11.3
0.8
0.6
BEML
Neutral
1,069
-
4,451
3,277
4,006
6.0
8.9
29.2
64.3
36.6
16.6
2.0
1.9
5.7
11.7
1.4
1.1
BGR Energy
Neutral
113
-
818
3,615
3,181
9.5
9.4
16.7
12.4
6.8
9.2
0.6
0.6
10.0
7.0
0.6
0.8
BHEL
Neutral
165
-
40,496
33,722
35,272
10.8
11.7
10.5
14.2
15.8
11.7
1.2
1.1
7.0
9.0
1.3
1.2
Stock Watch
December 14, 2015
Company Name
Reco
CMP
Target
Mkt Cap
Sales ( Čcr )
OPM(%)
EPS (Č)
PER(x)
P/BV(x)
RoE(%)
EV/Sales(x)
(Č)
Price ( Č)
( Č cr )
FY16E
FY17E
FY16E
FY17E
FY16E
FY17E
FY16E
FY17E
FY16E
FY17E
FY16E
FY17E
FY16E
FY17E
Capital Goods
Blue Star
Buy
356
429
3,199
3,548
3,977
6.3
6.9
13.7
17.2
26.0
20.7
6.5
4.2
26.1
25.4
1.0
0.8
Crompton Greaves
Accumulate
186
204
11,636
13,484
14,687
4.9
6.2
4.5
7.1
41.3
26.2
2.9
2.7
7.2
10.8
1.0
0.9
Inox Wind
Buy
342
505
7,596
4,980
5,943
17.0
17.5
26.6
31.6
12.9
10.8
3.9
2.8
35.0
30.0
1.7
1.4
KEC International
Neutral
148
-
3,816
8,791
9,716
6.1
6.8
5.4
8.2
27.5
18.1
2.8
2.5
10.0
14.0
0.7
0.6
Thermax
Neutral
894
-
10,654
6,413
7,525
7.4
8.5
30.5
39.3
29.3
22.8
4.5
3.9
15.0
17.0
1.6
1.3
Cement
ACC
Buy
1,316
1,630
24,715
13,151
14,757
16.4
18.3
63.9
83.4
20.6
15.8
2.7
2.4
13.3
16.1
1.7
1.5
Ambuja Cements
Buy
189
233
29,292
11,564
12,556
19.4
20.7
8.9
10.1
21.2
18.7
2.7
2.5
12.8
13.8
2.2
2.0
HeidelbergCement
Neutral
74
-
1,683
1,772
1,926
13.3
15.4
1.0
3.0
74.3
24.8
1.9
1.7
2.6
7.9
1.5
1.3
India Cements
Buy
81
112
2,490
4,216
4,840
18.0
19.5
4.0
9.9
20.3
8.2
0.8
0.8
4.0
9.5
0.9
0.7
JK Cement
Accumulate
652
744
4,557
3,661
4,742
10.1
15.8
18.0
61.0
36.2
10.7
2.6
2.3
7.5
22.9
1.7
1.3
J K Lakshmi Cement
Buy
328
430
3,855
2,947
3,616
16.7
19.9
11.5
27.2
28.5
12.0
2.7
2.3
9.8
20.8
1.7
1.4
Mangalam Cements
Neutral
204
-
544
1,053
1,347
10.5
13.3
8.4
26.0
24.3
7.8
1.0
0.9
4.3
12.5
0.9
0.7
Orient Cement
Buy
156
183
3,189
1,854
2,524
21.2
22.2
7.7
11.1
20.2
14.0
2.9
2.5
13.3
15.7
2.5
1.7
Ramco Cements
Neutral
366
-
8,702
4,036
4,545
20.8
21.3
15.1
18.8
24.2
19.4
3.0
2.6
12.9
14.3
2.7
2.3
Shree Cement^
Neutral
10,689
-
37,238
7,150
8,742
26.7
28.6
228.0
345.5
46.9
30.9
6.9
5.8
15.7
20.3
5.0
4.0
UltraTech Cement
Buy
2,777
3,282
76,218
25,021
30,023
19.1
21.6
89.0
132.0
31.2
21.0
3.6
3.1
12.2
15.9
3.1
2.6
Construction
ITNL
Neutral
79
-
2,595
7,360
8,825
34.0
35.9
7.0
9.0
11.3
8.8
0.4
0.4
3.2
3.7
3.7
3.6
KNR Constructions
Buy
584
673
1,643
937
1,470
14.3
14.0
33.5
38.6
17.4
15.1
2.6
2.3
15.4
15.4
1.8
1.2
Larsen & Toubro
Buy
1,284
1,646
119,605
65,065
77,009
11.5
11.7
61.5
65.6
20.9
19.6
2.1
1.9
13.4
14.0
2.0
1.7
Gujarat Pipavav Port
Neutral
149
-
7,179
629
684
51.0
52.2
6.4
5.9
23.2
25.2
3.1
2.8
15.9
12.7
11.1
10.0
MBL Infrastructures
Buy
206
285
854
2,313
2,797
12.2
14.6
19.0
20.0
10.8
10.3
1.1
1.0
11.3
10.6
1.1
1.0
Nagarjuna Const.
Neutral
72
-
4,019
7,892
8,842
8.8
9.1
3.0
5.3
24.1
13.6
1.2
1.1
5.0
8.5
0.7
0.6
PNC Infratech
Neutral
535
-
2,742
1,873
2,288
13.2
13.5
24.0
32.0
22.3
16.7
2.2
1.9
12.1
12.3
1.6
1.3
Simplex Infra
Neutral
311
-
1,537
5,955
6,829
10.3
10.5
16.0
31.0
19.4
10.0
1.0
0.9
5.3
9.9
0.8
0.7
Power Mech Projects
Neutral
609
-
896
1,539
1,801
12.8
12.7
59.0
72.1
10.3
8.4
1.6
1.3
18.6
16.8
0.6
0.5
Sadbhav Engineering
Neutral
344
-
5,892
3,481
4,219
10.7
10.8
8.0
12.0
42.9
28.6
4.0
3.5
10.3
13.5
2.0
1.6
NBCC
Accumulate
948
1,089
11,376
7,382
9,506
7.7
8.6
39.8
54.4
23.8
17.4
5.8
4.5
26.7
29.1
1.3
1.0
SIPL
Neutral
98
-
3,436
675
1,042
62.4
64.7
-
-
3.7
4.2
-
-
16.8
11.3
Financials
Allahabad Bank
Neutral
68
-
4,072
8,569
9,392
2.8
2.9
16.3
27.5
4.2
2.5
0.4
0.3
7.6
11.9
-
-
Stock Watch
December 14, 2015
Company Name
Reco
CMP
Target
Mkt Cap
Sales ( Čcr )
OPM(%)
EPS (Č)
PER(x)
P/BV(x)
RoE(%)
EV/Sales(x)
(Č)
Price ( Č)
( Č cr )
FY16E
FY17E
FY16E
FY17E
FY16E
FY17E
FY16E
FY17E
FY16E
FY17E
FY16E
FY17E
FY16E
FY17E
Financials
Axis Bank
Buy
440
630
104,607
26,473
31,527
3.5
3.6
35.7
43.5
12.3
10.1
2.4
2.1
17.9
18.9
-
-
Bank of Baroda
Neutral
155
-
35,784
18,485
21,025
1.9
2.0
13.5
21.1
11.5
7.4
0.9
0.8
7.3
10.6
-
-
Bank of India
Neutral
115
-
9,139
15,972
17,271
1.9
2.0
15.3
33.4
7.5
3.5
0.3
0.3
3.6
7.6
-
-
Canara Bank
Neutral
241
-
13,102
15,441
16,945
2.0
2.1
46.6
70.4
5.2
3.4
0.5
0.4
8.0
11.2
-
-
Dena Bank
Neutral
41
-
2,629
3,440
3,840
2.1
2.3
7.3
10.0
5.6
4.1
0.4
0.4
6.1
7.9
-
-
Federal Bank
Neutral
55
-
9,377
3,477
3,999
3.0
3.0
5.0
6.2
10.9
8.8
1.1
1.0
10.6
11.9
-
-
HDFC
Neutral
1,175
-
185,391
10,358
11,852
3.3
3.3
41.1
47.0
28.6
25.0
5.4
4.9
24.7
24.9
-
-
HDFC Bank
Buy
1,046
1,262
263,867
38,309
47,302
4.3
4.3
49.3
61.1
21.2
17.1
3.7
3.2
18.5
19.7
-
-
ICICI Bank
Buy
249
354
144,920
34,279
39,262
3.3
3.3
21.0
24.4
11.9
10.2
2.0
1.7
14.4
14.7
-
-
IDBI Bank
Neutral
83
-
13,233
9,625
10,455
1.8
1.8
8.5
14.2
9.7
5.8
0.6
0.5
5.9
9.3
-
-
Indian Bank
Neutral
117
-
5,617
6,160
6,858
2.5
2.5
24.5
29.8
4.8
3.9
0.4
0.3
7.7
8.6
-
-
LIC Housing Finance
Buy
461
571
23,260
3,101
3,745
2.5
2.5
33.0
40.2
14.0
11.5
2.6
2.2
19.7
20.5
-
-
Oriental Bank
Neutral
133
-
3,995
7,643
8,373
2.4
2.4
37.2
45.4
3.6
2.9
0.3
0.3
8.2
9.4
-
-
Punjab Natl.Bank
Neutral
123
-
24,152
23,638
26,557
2.8
2.8
17.9
27.2
6.9
4.5
0.7
0.6
8.5
12.0
-
-
South Ind.Bank
Neutral
19
-
2,572
1,965
2,185
2.5
2.5
2.5
3.3
7.7
5.8
0.8
0.7
9.5
11.7
-
-
St Bk of India
Buy
227
283
176,293
82,520
93,299
2.7
2.8
20.0
24.5
11.3
9.3
1.2
1.1
11.5
12.8
-
-
Union Bank
Neutral
146
-
10,047
12,646
14,129
2.3
2.4
31.0
39.1
4.7
3.7
0.5
0.4
9.8
11.4
-
-
Vijaya Bank
Neutral
34
-
2,904
3,536
3,827
1.9
1.9
5.5
6.7
6.1
5.1
0.5
0.5
7.8
8.8
-
-
Yes Bank
Buy
681
921
28,538
7,190
9,011
3.2
3.3
58.2
69.7
11.7
9.8
2.1
1.8
19.2
19.6
-
-
FMCG
Asian Paints
Neutral
856
-
82,146
16,553
19,160
16.0
16.2
17.7
21.5
48.5
39.8
12.9
11.6
29.4
31.2
4.8
4.1
Britannia
Neutral
2,781
-
33,369
8,065
9,395
9.6
10.2
47.2
65.5
58.9
42.5
19.6
18.5
38.3
41.2
4.0
3.4
Colgate
Neutral
975
-
26,529
4,836
5,490
19.5
19.7
48.5
53.2
20.1
18.3
14.7
12.8
99.8
97.5
5.4
4.7
Dabur India
Neutral
268
-
47,163
9,370
10,265
17.1
17.2
7.3
8.1
36.6
33.1
11.0
9.0
33.7
30.6
4.9
4.5
GlaxoSmith Con*
Neutral
6,371
-
26,793
4,919
5,742
17.2
17.4
168.3
191.2
37.9
33.3
10.7
9.1
28.8
28.9
5.0
4.2
Godrej Consumer
Neutral
1,262
-
42,958
10,168
12,886
16.1
16.1
32.1
38.4
39.3
32.9
8.0
7.4
19.7
21.0
4.3
3.4
HUL
Neutral
821
-
177,643
34,940
38,957
17.5
17.7
20.8
24.7
39.5
33.2
43.9
35.1
110.5
114.2
4.9
4.4
ITC
Buy
321
382
257,761
41,068
45,068
37.8
37.4
13.9
15.9
23.1
20.2
7.7
6.8
34.1
33.8
5.9
5.3
Marico
Neutral
428
-
27,629
6,551
7,766
15.7
16.0
10.4
12.5
41.3
34.3
12.0
10.0
33.2
32.4
4.1
3.5
Nestle*
Accumulate
5,894
6,646
56,827
11,291
12,847
22.2
22.3
158.9
184.6
37.1
31.9
19.4
17.4
55.0
57.3
4.9
4.2
Stock Watch
December 14, 2015
Company Name
Reco
CMP
Target
Mkt Cap
Sales ( Čcr )
OPM(%)
EPS (Č)
PER(x)
P/BV(x)
RoE(%)
EV/Sales(x)
(Č)
Price ( Č)
( Č cr )
FY16E FY17E
FY16E
FY17E
FY16E
FY17E
FY16E
FY17E
FY16E
FY17E
FY16E
FY17E
FY16E
FY17E
FMCG
Tata Global
Accumulate
133
144
8,407
8,635
9,072
9.8
9.9
6.5
7.6
20.5
17.5
2.0
2.0
6.8
7.4
0.9
0.9
IT
HCL Tech^
Buy
840
1,132
118,346
42,038
47,503
23.2
23.5
55.8
62.9
15.1
13.4
3.5
2.6
23.0
19.8
2.4
1.9
Infosys
Buy
1,052
1,306
241,719
60,250
66,999
28.0
28.0
58.3
63.7
18.1
16.5
3.8
3.3
20.9
19.7
3.3
2.8
TCS
Buy
2,387
3,165
470,390
111,274
126,852
28.4
28.7
125.4
143.9
19.0
16.6
7.5
6.9
39.9
42.2
3.8
3.3
Tech Mahindra
Buy
536
646
51,787
25,566
28,890
16.0
17.0
26.3
31.9
20.4
16.8
3.7
3.1
17.9
18.6
1.8
1.5
Wipro
Buy
566
719
139,866
52,414
58,704
23.7
23.8
38.4
42.3
14.7
13.4
2.9
2.6
19.5
18.0
2.2
1.8
Media
D B Corp
Accumulate
323
356
5,932
2,241
2,495
27.8
27.9
21.8
25.6
14.8
12.6
3.9
3.4
26.7
28.5
2.6
2.3
HT Media
Neutral
80
-
1,872
2,495
2,603
11.2
11.2
7.3
8.6
11.0
9.4
0.9
0.8
7.4
8.1
0.3
0.2
Jagran Prakashan
Accumulate
151
169
4,922
2,170
2,355
27.2
26.2
8.9
9.9
16.9
15.2
3.6
3.1
20.9
20.5
2.2
2.0
Sun TV Network
Neutral
379
-
14,948
2,779
3,196
70.2
70.5
22.8
27.3
16.6
13.9
4.1
3.7
26.7
28.3
5.1
4.4
Hindustan Media
Neutral
283
-
2,076
920
1,031
20.0
20.0
19.2
20.9
14.7
13.6
2.4
2.1
16.4
15.3
1.8
1.6
Ventures
Metals & Mining
Coal India
Buy
308
380
194,323
76,167
84,130
19.9
22.3
22.4
25.8
13.7
11.9
5.0
4.8
35.5
41.0
1.9
1.7
Hind. Zinc
Buy
141
175
59,366
14,641
14,026
50.4
50.4
17.7
16.0
8.0
8.8
1.2
1.1
16.2
13.2
1.7
1.5
Hindalco
Neutral
76
-
15,756
104,356
111,186
8.7
9.5
6.7
11.1
11.4
6.9
0.4
0.4
3.5
5.9
0.7
0.6
JSW Steel
Neutral
969
-
23,411
42,308
45,147
16.4
20.7
(10.3)
49.5
19.6
1.1
1.0
(1.0)
5.6
1.6
1.5
NMDC
Neutral
88
-
34,850
8,237
10,893
46.6
44.5
10.0
11.7
8.8
7.5
1.0
0.9
12.5
13.0
4.0
3.1
SAIL
Neutral
45
-
18,585
45,915
53,954
7.2
10.5
1.5
4.4
29.9
10.3
0.4
0.4
2.3
4.1
1.1
0.9
Vedanta
Neutral
83
-
24,740
71,445
81,910
26.2
26.3
12.9
19.2
6.5
4.4
0.5
0.4
7.2
8.9
0.8
0.6
Tata Steel
Neutral
241
-
23,397
126,760
137,307
8.9
11.3
6.4
23.1
37.9
10.4
0.8
0.7
2.0
7.1
0.8
0.7
Oil & Gas
Cairn India
Neutral
126
-
23,558
11,323
12,490
49.4
51.0
20.7
20.7
6.1
6.1
0.4
0.4
6.4
6.1
1.2
0.5
GAIL
Neutral
339
-
42,951
64,856
70,933
9.1
9.6
24.0
28.9
14.1
11.7
1.2
1.1
8.8
9.6
0.8
0.8
ONGC
Neutral
216
-
184,371
154,564
167,321
36.8
37.4
28.6
32.5
7.5
6.6
1.0
0.9
12.7
13.5
1.4
1.3
Petronet LNG
Neutral
243
-
18,195
29,691
31,188
5.8
6.2
12.8
13.4
19.0
18.1
2.8
2.5
15.8
14.8
0.7
0.6
Indian Oil Corp
Accumulate
415
455
100,857
359,607
402,760
5.9
6.1
42.5
48.7
9.8
8.5
1.3
1.2
14.1
14.4
0.4
0.3
Reliance Industries
Accumulate
952
1,050
308,454
304,775
344,392
12.6
13.4
91.3
102.6
10.4
9.3
1.2
1.1
11.8
12.0
0.9
0.8
Pharmaceuticals
Alembic Pharma
Neutral
663
-
12,498
2,658
3,112
24.1
20.2
24.6
23.9
27.0
27.7
9.7
7.4
42.5
30.2
4.7
4.0
Aurobindo Pharma
Accumulate
808
872
47,208
14,923
17,162
23.0
23.0
38.2
43.6
21.2
18.5
6.5
4.9
36.0
30.2
3.5
3.0
Aventis*
Neutral
4,306
-
9,918
2,082
2,371
17.4
20.8
118.2
151.5
36.4
28.4
5.3
4.3
19.9
25.5
4.4
3.7
Cadila Healthcare
Neutral
389
-
39,834
10,224
11,840
21.0
22.0
14.6
17.6
26.7
22.1
7.3
5.7
30.8
29.0
4.0
3.3
Stock Watch
December 14, 2015
Company Name
Reco
CMP
Target
Mkt Cap
Sales ( Čcr )
OPM(%)
EPS (Č)
PER(x)
P/BV(x)
RoE(%)
EV/Sales(x)
(Č)
Price ( Č)
( Č cr )
FY16E FY17E
FY16E
FY17E
FY16E
FY17E
FY16E
FY17E
FY16E
FY17E
FY16E
FY17E
FY16E
FY17E
Pharmaceuticals
Cipla
Neutral
639
-
51,355
14,211
16,611
20.6
19.0
27.0
28.9
23.7
22.1
4.0
3.4
18.4
16.8
3.6
3.0
Dr Reddy's
Buy
2,965
3,933
50,557
16,838
19,575
25.0
23.1
167.5
178.8
17.7
16.6
3.7
3.1
23.1
20.4
2.9
2.5
Dishman Pharma
Neutral
309
-
2,491
1,733
1,906
21.5
21.5
17.0
19.9
18.2
15.5
1.8
1.7
10.5
11.2
2.0
1.7
GSK Pharma*
Neutral
3,233
-
27,386
2,870
3,158
20.0
22.1
59.5
68.3
54.3
47.3
16.0
16.5
28.5
34.3
9.0
8.3
Indoco Remedies
Neutral
311
-
2,862
1,033
1,199
15.9
18.2
9.4
13.6
33.0
22.8
4.9
4.2
15.7
19.7
2.9
2.5
Ipca labs
Buy
749
900
9,451
3,363
3,909
12.9
18.6
13.4
28.0
55.9
26.8
4.0
3.5
7.4
14.0
3.1
2.7
Lupin
Neutral
1,741
-
78,412
13,092
16,561
25.0
27.0
50.4
68.3
34.5
25.5
7.1
5.6
22.8
24.7
5.7
4.4
Sun Pharma
Buy
758
950
182,433
28,163
32,610
25.8
30.7
17.4
26.9
43.6
28.2
4.1
3.6
13.0
16.6
5.9
4.9
Power
Tata Power
Neutral
62
-
16,728
35,923
37,402
22.6
22.8
4.1
5.2
15.3
12.0
1.2
1.1
7.5
9.3
1.4
1.3
NTPC
Buy
133
157
109,417
87,064
98,846
23.5
23.5
11.7
13.2
11.3
10.1
1.3
1.2
11.4
12.1
2.3
2.0
Power Grid
Buy
128
170
66,991
20,702
23,361
86.7
86.4
12.1
13.2
10.6
9.7
1.6
1.4
15.6
15.1
8.2
7.6
Telecom
Bharti Airtel
Neutral
309
-
123,660
101,748
109,191
32.1
31.7
12.0
12.5
25.8
24.8
1.8
1.7
6.9
6.7
1.9
1.7
Idea Cellular
Neutral
132
-
47,394
34,282
36,941
32.0
31.5
5.9
6.2
22.3
21.2
2.0
1.9
9.9
9.3
2.0
1.9
zOthers
Abbott India
Neutral
5,418
-
11,512
2,715
3,153
14.5
14.1
134.3
152.2
40.4
35.6
10.1
8.3
27.4
25.6
4.0
3.3
Bajaj Electricals
Buy
204
341
2,057
4,719
5,287
5.2
5.8
8.6
12.7
23.8
16.1
2.7
2.4
11.4
14.8
0.4
0.4
Finolex Cables
Neutral
248
-
3,793
2,520
2,883
12.2
12.0
12.7
14.2
19.6
17.5
2.7
2.4
13.6
13.5
1.3
1.1
Goodyear India*
Accumulate
548
622
1,264
1,888
1,680
12.1
11.9
62.2
56.6
8.8
9.7
2.1
1.8
25.9
19.7
0.4
0.4
Hitachi
Neutral
1,317
-
3,581
1,779
2,081
7.8
8.8
21.8
33.4
60.4
39.4
9.8
7.9
17.4
22.1
2.1
1.8
Jyothy Laboratories
Neutral
301
-
5,457
1,620
1,847
11.5
11.5
7.3
8.5
41.3
35.6
5.3
5.0
13.3
14.4
3.2
2.8
MRF
Buy
39,421
45,575
16,719
20,316
14,488
21.4
21.1
5,488.0
3,798.0
7.2
10.4
2.5
2.0
41.1
21.2
0.8
1.0
Page Industries
Neutral
12,726
-
14,194
1,929
2,450
19.8
20.1
229.9
299.0
55.4
42.6
24.4
17.0
52.1
47.1
7.4
5.8
Relaxo Footwears
Neutral
483
-
5,796
1,767
2,152
12.3
12.5
19.3
25.1
25.1
19.3
6.2
4.7
27.7
27.8
3.3
2.7
Siyaram Silk Mills
Buy
1,101
1,354
1,032
1,636
1,815
11.5
11.5
89.9
104.1
12.2
10.6
2.0
1.8
17.9
17.8
0.8
0.7
Styrolution ABS India*
Neutral
697
-
1,227
1,271
1,440
8.6
9.2
32.0
41.1
21.8
17.0
2.2
2.0
10.7
12.4
0.9
0.8
TVS Srichakra
Buy
2,730
3,240
2,090
2,101
2,338
15.7
15.0
248.6
270.0
11.0
10.1
4.8
3.4
43.6
34.0
1.0
0.9
HSIL
Neutral
302
-
2,184
2,123
2,384
16.1
16.5
15.0
18.9
20.1
16.0
1.6
1.5
8.0
9.4
1.4
1.2
Kirloskar Engines India
Neutral
255
-
3,684
2,471
2,826
8.8
10.4
9.1
13.3
27.9
19.1
2.7
2.5
9.7
13.4
1.1
1.0
Ltd
M M Forgings
Buy
524
614
632
511
615
21.7
21.6
43.1
55.8
12.1
9.4
2.2
1.8
19.9
21.2
1.4
1.1
Banco Products (India)
Neutral
141
-
1,011
1,208
1,353
11.0
12.3
10.8
14.5
13.1
9.8
1.5
1.3
11.9
14.5
0.8
0.7
Stock Watch
December 14, 2015
Company Name
Reco
CMP
Target Mkt Cap
Sales ( Čcr )
OPM(%)
EPS (Č)
PER(x)
P/BV(x)
RoE(%)
EV/Sales(x)
(Č)
Price ( Č)
( Č cr )
FY16E FY17E FY16E FY17E FY16E FY17E FY16E FY17E FY16E FY17E FY16E FY17E FY16E FY17E
zOthers
Competent Automobiles Neutral
143
-
88
1,040
1,137
3.2
3.1
25.7
28.0
5.6
5.1
0.8
0.7
15.0
14.3
0.1
0.1
Nilkamal
Neutral
993
-
1,482
1,910
2,083
10.5
10.3
63.3
69.2
15.7
14.4
2.6
2.2
17.6
16.5
0.8
0.7
Visaka Industries
Buy
123
144
196
1,086
1,197
9.9
10.3
21.5
28.8
5.7
4.3
0.6
0.5
9.6
11.6
0.4
0.3
Transport Corporation of
Neutral
309
-
2,351
2,830
3,350
8.8
9.0
14.4
18.3
21.5
16.9
3.3
2.9
15.4
17.1
1.0
0.8
India
Elecon Engineering
Neutral
82
-
888
1,369
1,533
13.7
14.9
3.3
6.1
24.6
13.5
1.6
1.5
6.6
11.4
1.0
0.9
Surya Roshni
Buy
133
183
584
2,992
3,223
8.1
8.4
14.7
18.3
9.1
7.3
0.9
0.8
9.7
11.0
0.5
0.4
MT Educare
Buy
135
169
536
286
366
18.3
17.7
7.7
9.4
17.4
14.4
3.7
3.2
20.2
21.1
1.8
1.3
Radico Khaitan
Buy
104
156
1,389
1,565
1,687
12.2
13.0
5.7
7.1
18.3
14.7
1.5
1.4
8.3
9.6
1.4
1.2
Garware Wall Ropes
Accumulate
376
423
823
861
967
10.9
10.9
24.0
28.2
15.7
13.3
2.3
2.0
14.6
14.9
1.0
0.8
Wonderla Holidays
Neutral
373
-
2,108
206
308
44.0
43.6
9.0
12.9
41.5
28.9
5.7
5.1
13.7
17.8
10.1
6.7
Linc Pen & Plastics
Neutral
182
-
268
340
371
8.3
8.9
10.8
13.2
16.8
13.8
2.7
2.4
16.0
17.1
0.8
0.8
The Byke Hospitality
Accumulate
162
181
650
222
287
20.5
20.5
5.6
7.6
28.8
21.5
5.4
4.5
18.9
20.8
3.0
2.3
Interglobe Aviation
Neutral
1,035
-
37,297
17,022
21,122
20.7
14.5
63.9
53.7
16.2
19.3
24.3
19.9
149.9
103.2
2.2
1.8
Coffee Day Enterprises
Neutral
257
-
5,295
2,692
2,964
17.0
18.6
-
4.7
-
54.3
3.1
3.0
0.2
5.5
2.4
2.2
Ltd
Navneet Education
Buy
81
97
1,926
998
1,062
24.1
24.0
5.8
6.1
14.1
13.3
3.1
2.7
22.0
20.6
2.0
1.9
Source: Company, Angel Research; Note: *December year end; #September year end; &October year end; Price as on December 11, 2015
Market Outlook
December 14, 2015
Research Team Tel: 022 - 39357800
DISCLAIMER
Angel Broking Private Limited (hereinafter referred to as “Angel”) is a registered Member of National Stock Exchange of India Limited,
Bombay Stock Exchange Limited and Metropolitian Stock Exchange of India Limited. It is also registered as a Depository Participant with
CDSL and Portfolio Manager with SEBI. It also has registration with AMFI as a Mutual Fund Distributor. Angel Broking Private Limited is a
registered entity with SEBI for Research Analyst in terms of SEBI (Research Analyst) Regulations, 2014 vide registration number
INH000000164. Angel or its associates has not been debarred/ suspended by SEBI or any other regulatory authority for accessing
/dealing in securities Market. Angel or its associates including its relatives/analyst do not hold any financial interest/beneficial ownership
of more than 1% in the company covered by Analyst. Angel or its associates/analyst has not received any compensation / managed or co
-managed public offering of securities of the company covered by Analyst during the past twelve months. Angel/analyst has not served as
an officer, director or employee of company covered by Analyst and has not been engaged in market making activity of the company
covered by Analyst.
This document is solely for the personal information of the recipient, and must not be singularly used as the basis of any investment
decision. Nothing in this document should be construed as investment or financial advice. Each recipient of this document should make
such investigations as they deem necessary to arrive at an independent evaluation of an investment in the securities of the companies
referred to in this document (including the merits and risks involved), and should consult their own advisors to determine the merits and
risks of such an investment.
Reports based on technical and derivative analysis center on studying charts of a stock's price movement, outstanding positions and
trading volume, as opposed to focusing on a company's fundamentals and, as such, may not match with a report on a company's
fundamentals.
The information in this document has been printed on the basis of publicly available information, internal data and other reliable sources
believed to be true, but we do not represent that it is accurate or complete and it should not be relied on as such, as this document is for
general guidance only. Angel Broking Pvt. Limited or any of its affiliates/ group companies shall not be in any way responsible for any
loss or damage that may arise to any person from any inadvertent error in the information contained in this report. Angel Broking Pvt.
Limited has not independently verified all the information contained within this document. Accordingly, we cannot testify, nor make any
representation or warranty, express or implied, to the accuracy, contents or data contained within this document. While Angel Broking
Pvt. Limited endeavors to update on a reasonable basis the information discussed in this material, there may be regulatory, compliance,
or other reasons that prevent us from doing so.
This document is being supplied to you solely for your information, and its contents, information or data may not be reproduced,
redistributed or passed on, directly or indirectly.
Neither Angel Broking Pvt. Limited, nor its directors, employees or affiliates shall be liable for any loss or damage that may arise from or
in connection with the use of this information.
Note: Please refer to the important ‘Stock Holding Disclosure' report on the Angel website (Research Section). Also, please refer to the
latest update on respective stocks for the disclosure status in respect of those stocks. Angel Broking Pvt. Limited and its affiliates may have
investment positions in the stocks recommended in this report.