Market Outlook
September 14, 2015
Dealer’s Diary
Domestic Indices
Chg (%)
(Pts)
(Close)
BSE Sensex
(0.0)
(12)
25,610
Indian markets are expected to open on a Flat note with Positive bias tracking the
SGX Nifty and most of global markets.
Nifty
0.0
1
7,789
MID CAP
0.2
17
10,520
The US markets remained in the same range as its previous session throughout
SMALL CAP
0.6
67
10,699
Friday but managed to close in the green. The traders were on the side-line ahead
BSE HC
0.2
28
16,921
of the two day Federal Reserve's monetary policy meeting starting September 16,
BSE PSU
(0.1)
(3)
6,595
2015.
BANKEX
0.0
0
18,994
For the second consecutive session, the European markets closed in the negative
AUTO
(0.3)
(51)
17,648
territory on Thursday. The pull back was attributed to investor uncertainty ahead of
METAL
(1.5)
(112)
7,198
the release of China’s Industrial Production data on September 13, 2015 and
OIL & GAS
(0.3)
(28)
8,620
outcome of FOMC meeting next week.
BSE IT
0.4
48
11,028
After registering early gains, Indian Markets ended flat on Friday as trader remained
Global Indices
Chg (%)
(Pts)
(Close)
cautious ahead of economic data release from China on Sunday as well as much
Dow Jones
0.6
103
16,433
anticipated FOMC meet this week.
NASDAQ
0.5
26
4,822
FTSE
(0.6)
(38)
6,118
News & Result Analysis
Nikkei
(0.2)
(35)
18,264
IIP posts growth of 4.2% in the month of July
Hang Sang
(0.3)
(58)
21,504
JK Group (JK Tyres and group companies) to acquire Haridwar tyre unit of
Straits Times
(1.4)
(40)
2,888
Kesoram industries
Refer detailed news analysis on the following page
Shanghai Com
0.1
2
3,200
Markets Today
Indian ADR
Chg (%)
(Pts)
(Close)
The trend deciding level for the day is 25,672 / 7,805 levels. If NIFTY trades above
this level during the first half-an-hour of trade then we may witness a further rally up
INFY
0.5
0.1
$17.7
to 25,814 - 26,018 / 7,849 - 7,910 levels. However, if NIFTY trades below
WIT
0.6
0.1
$11.7
25,672 / 7,805 levels for the first half-an-hour of trade then it may correct towards
IBN
(0.8)
(0.1)
$8.3
25,468 - 25,327 / 7,745 - 7,700 levels.
HDB
(1.0)
(0.6)
$56.6
Indices
S2
S1
PIVOT
R1
R2
Advances / Declines
BSE
NSE
SENSEX
25,102
25,362
25,548
25,808
25,994
Advances
1,507
898
NIFTY
7,621
7,704
7,762
7,846
7,904
Declines
1,164
594
Unchanged
110
79
Net Inflows (September 10, 2015)
` cr
Purch
Sales
Net
MTD
YTD
Volumes (` cr)
FII
3,575
3,613
(38)
(5,552)
118,209
BSE
2,625
MFs
1,477
647
830
4,515
74,183
NSE
13,917
FII Derivatives (September 11, 2015)
` cr
Purch
Sales
Net
Open Interest
Index Futures
2,200
1,960
241
22,621
Stock Futures
2,248
1,806
442
45,766
Gainers / Losers
Gainer
Loser
Company
Price (`)
chg (%)
Company
Price (`)
chg (%)
AMTEKAUTO
47
53.6
COX&KINGS
206
(5.1)
DEN
101
7.2
SUNASIAN
141
(5.0)
GATI
137
6.5
MONSANTO
2,196
(4.8)
JETAIRWAYS
328
5.8
PMCFIN
1
(4.7)
WOCKPHARMA
1,385
5.2
INFRATEL
376
(3.8)
Market Outlook
September 14, 2015
IIP posts growth of 4.2% in the month of July
India’s Industrial Production growth in July came in above analyst expectation as
per the data released by Central Statistics Office on Friday. The industrial
production rose by 4.2% in July, much higher than estimates of 3.5%. This was
slightly below the revised June growth rate of 4.4%. The manufacturing posted
4.7% growth in July while mining and electricity generation grew by 1.3% and
3.5% respectively.
JK Group (JK Tyres and group companies) to acquire Haridwar
tyre unit of Kesoram industries
JK Tyre & Industries (JKT) has signed a binding term sheet with Kesoram Industries
to acquire its tyre manufacturing unit at Haridwar (Cavendish Industries Ltd). The
Haridwar unit manufactures Truck and bus radial as well as two/three wheeler
tyres. JK Tyre along with its associate/group companies would acquire 100% of
Cavendish at an enterprise value not exceeding `2,200cr. JKT will hold the largest
shareholding block and will have substantial management control of Cavendish
with an option to place up to 55% with its associates /group companies. The
acquisition would be funded by combination of debt and internal accruals raised
by JKT and other JK Group entities. As per JKT, its financial exposure is expected to
be to the order of `450cr. The transaction is expected to be completed over next
few months. The deal appears to be expensive, as the tyre segment is currently loss
making for Kesoram. As per 9MFY15 financials, the tyre business of Kesoram
(which comprises of two plants one at Haridwar and other relatively smaller unit at
Balasore) had revenues of `2,045 cr and an EBIT loss of `293.9cr. Further, since
the acquisition is EPS dilutive and JKT would have to take debt to fund the
acquisition, JKT debt/equity ratio which is already high (Current debt/equity is
1.9x) would worsen further. Given the expensive acquisition and deteriorating
financials in the near term, we keep our rating on JK Tyre under review. We would
update after getting more clarity from the management.
Economic and Political News
Govt may extend interest subsidy scheme for exporters by 3 yrs
FIPB clears 14 FDI proposals
Corporate News
Bharat Petroleum to invest `40,000cr to up capacity to 50 mtpa by 2021
Adani to expand capacity of Udupi power plant by 1600 MW
Elder Pharma in advanced talks with lenders for restructuring
Market Outlook
September 14, 2015
Top Picks
Large Cap
Market Cap
CMP
Target
Upside
Company
Sector
Rating
(` Cr)
(`)
(`)
(%)
Aurobindo
Pharma
41,327
Buy
708
872
23.2
Axis Bank
Financials
1,14,424
Buy
481
701
45.6
ICICI Bank
Financials
1,55,161
Buy
267
370
38.4
Infosys
IT
2,50,528
Buy
1,091
1,306
19.7
Inox Wind
Capital Goods
8,331
Buy
375
505
34.5
LIC HFL
Financials
21,637
Buy
429
570
32.9
Power Grid
Power
64,924
Buy
124
170
37.0
TCS
IT
4,98,594
Buy
2,546
3,168
24.5
Tech Mahindra IT
50,482
Buy
525
646
23.1
Yes Bank
Financials
29,770
Buy
711
953
34.0
Sun Pharma
Pharma
2,03,488 Accumulate
846
950
12.3
Source: Angel Research, Bloomberg
Mid Cap
Market Cap
CMP
Target
Upside
Company
Sector
Rating
(` Cr)
(`)
(`)
(%)
Bajaj Electricals
Others
2,492
Buy
247
341
38.0
Garware Wall RopesOthers
624
Buy
285
390
36.8
MBL Infrastructures Construction
1,008
Buy
243
360
48.0
Minda Industries
Auto Ancillary
816
Buy
514
652
26.8
MT Educare
Others
489
Buy
123
169
37.7
Radico Khaitan
Others
1,141
Buy
86
112
30.6
Surya Roshni
Others
518
Buy
118
183
54.8
Tree House
Others
1,590
Buy
376
449
19.5
Source: Angel Research, Bloomberg
Market Outlook
September 14, 2015
Global economic events release calendar
Date
Time
Country Event Description
Unit
Period
Bloomberg Data
Last Reported Estimated
September 14, 2015
India
Imports YoY%
% Change
Aug
(10.28)
--
India
Exports YoY%
% Change
Aug
(10.30)
--
12:00PM
India
Monthly Wholesale Prices YoY%
% Change
Aug
(4.05)
(4.36)
September 15, 2015
6:45PM
US
Industrial Production
%
Aug
0.56
(0.20)
2:00PM
UK
CPI (YoY)
% Change
Aug
0.10
--
September 16, 2015
2:00PM
UK
Jobless claims change
% Change
Aug
(4.90)
(5.00)
2:30PM
Euro Zone Euro-Zone CPI (YoY)
%
Aug F
0.20
0.20
6:00PM
US
Consumer price index (mom)
% Change
Aug
0.10
(0.10)
September 17, 2015
6:00PM
US
Initial Jobless claims
Thousands
Sep 12
275.00
277.00
6:00PM
US
Building permits
Thousands
Aug
1,130.00
1,155.00
6:00PM
US
Housing Starts
Thousands
Aug
1,206.00
1,170.00
11:30PM
US
FOMC rate decision
%
Sep 17
0.25
0.44
September 21, 2015
7:30PM
US
Existing home sales
Million
Aug
5.59
5.50
September 22, 2015
7:30PM
Euro Zone Euro-Zone Consumer Confidence
Value
Sep A
(6.90)
--
September 23, 2015
1:00PM
Germany PMI Services
Value
Sep P
54.90
--
1:00PM
Germany PMI Manufacturing
Value
Sep P
53.30
--
September 24, 2015
7:30PM
US
New home sales
Thousands
Aug
507.00
515.00
September 25, 2015
6:00PM
US
GDP Qoq (Annualised)
% Change
2Q T
3.70
3.70
September 29, 2015
7:30PM
US
Consumer Confidence
S.A./ 1985=100
Sep
101.54
--
11:00AM
India
RBI Reverse Repo rate
%
Sep 29
6.25
--
11:00AM
India
RBI Repo rate
%
Sep 29
7.25
--
11:00AM
India
RBI Cash Reserve ratio
%
Sep 29
4.00
--
September 30, 2015
1:25PM
Germany Unemployment change (000's)
Thousands
Sep
(7.00)
--
2:00PM
UK
GDP (YoY)
% Change
2Q F
2.60
--
October 1, 2015
6:30AM
China
PMI Manufacturing
Value
Sep
49.70
--
2:00PM
UK
PMI Manufacturing
Value
Sep
51.50
--
October 2, 2015
6:00PM
US
Change in Nonfarm payrolls
Thousands
Sep
173.00
--
6:00PM
US
Unnemployment rate
%
Sep
5.10
--
October 7, 2015
2:00PM
UK
Industrial Production (YoY)
% Change
Aug
0.80
--
October 8, 2015
4:30PM
UK
BOE Announces rates
% Ratio
Oct 8
0.50
0.50
October 12, 2015
5:30PM
India
Industrial Production YoY
% Change
Aug
4.20
--
October 13, 2015
China
Exports YoY%
% Change
Sep
(5.50)
--
October 14, 2015
7:00AM
China
Consumer Price Index (YoY)
% Change
Sep
2.00
--
October 19, 2015
7:30AM
China
Real GDP (YoY)
% Change
3Q
7.00
--
Source: Bloomberg, Angel Research
Market Outlook
September 14, 2015
Macro watch
Exhibit 1: Quarterly GDP trends
Exhibit 2: IIP trends
(%)
(%)
9.0
8.4
6.0
5.2
4.8
4.4
4.2
5.0
8.0
7.5
7.5
3.6
4.0
3.4
7.0
7.0
2.8
2.6
2.5
2.5
6.7
6.7
6.6
3.0
7.0
6.3
6.4
2.0
6.0
1.0
5.0
4.7
-
5.0
(1.0)
4.0
(2.0)
(3.0)
3.0
(2.7)
(4.0)
Source: CSO, Angel Research
Source: MOSPI, Angel Research
Exhibit 3: Monthly CPI inflation trends
Exhibit 4: Manufacturing and services PMI
(%)
56.0
Mfg. PMI
Services PMI
8.0
7.0
54.0
7.0
5.6
6.0
5.2
5.4
5.3
5.0
5.4
52.0
4.6
4.9
5.0
4.3
3.8
4.0
3.3
50.0
3.0
48.0
2.0
1.0
46.0
-
44.0
Source: MOSPI, Angel Research
Source: Market, Angel Research; Note: Level above 50 indicates expansion
Exhibit 5: Exports and imports growth trends
Exhibit 6: Key policy rates
(%)
Exports yoy growth
Imports yoy growth
(%)
Repo rate
Reverse Repo rate
CRR
30.0
9.00
20.0
8.00
10.0
7.00
0.0
6.00
(10.0)
5.00
(20.0)
4.00
(30.0)
3.00
Source: Bloomberg, Angel Research
Source: RBI, Angel Research
Market Outlook
September 14, 2015
Global watch
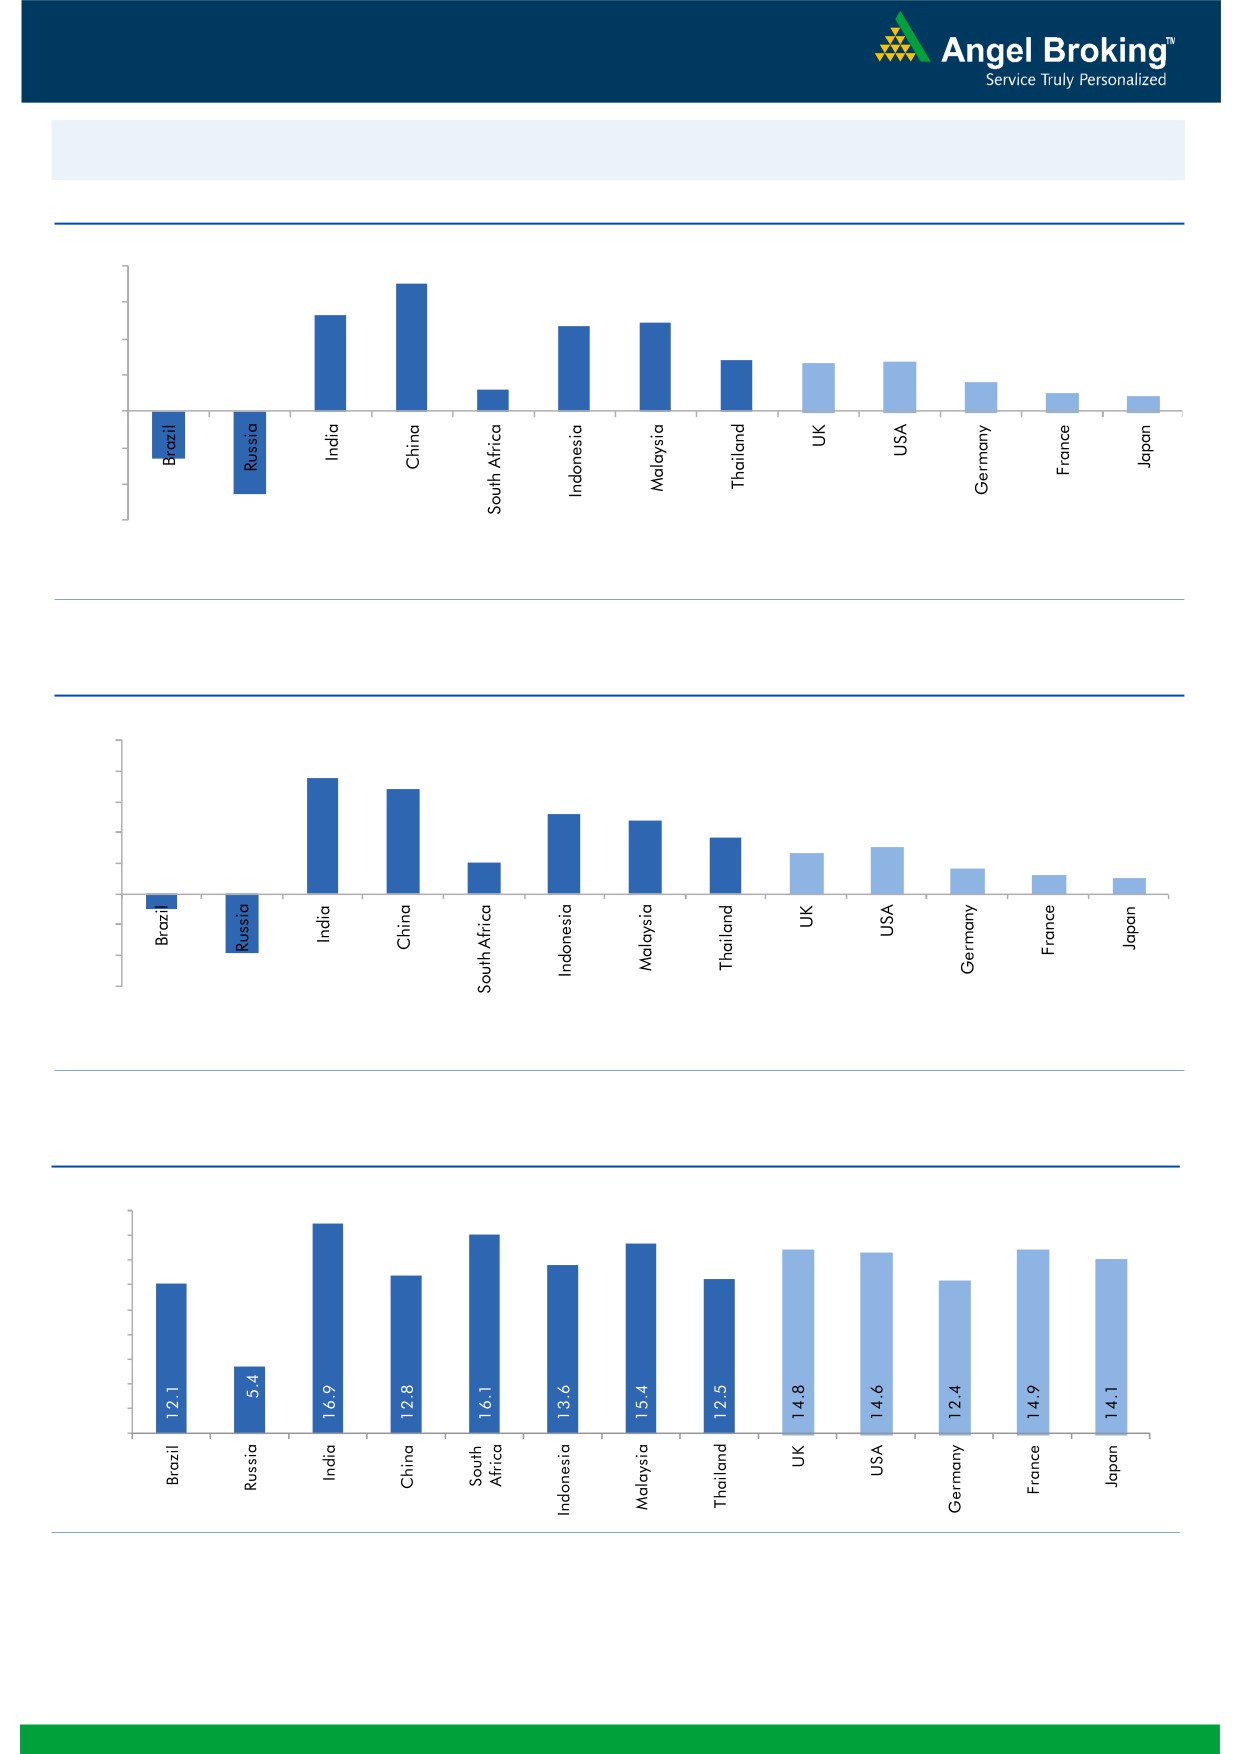
Exhibit 1: Latest quarterly GDP Growth (%, yoy) across select developing and developed countries
(%)
8.0
7.0
6.0
5.3
4.9
4.7
4.0
2.8
2.6
2.7
1.6
2.0
1.2
1.0
0.8
(4.6)
(2.6)
-
(2.0)
(4.0)
(6.0)
Source: Bloomberg, Angel Research
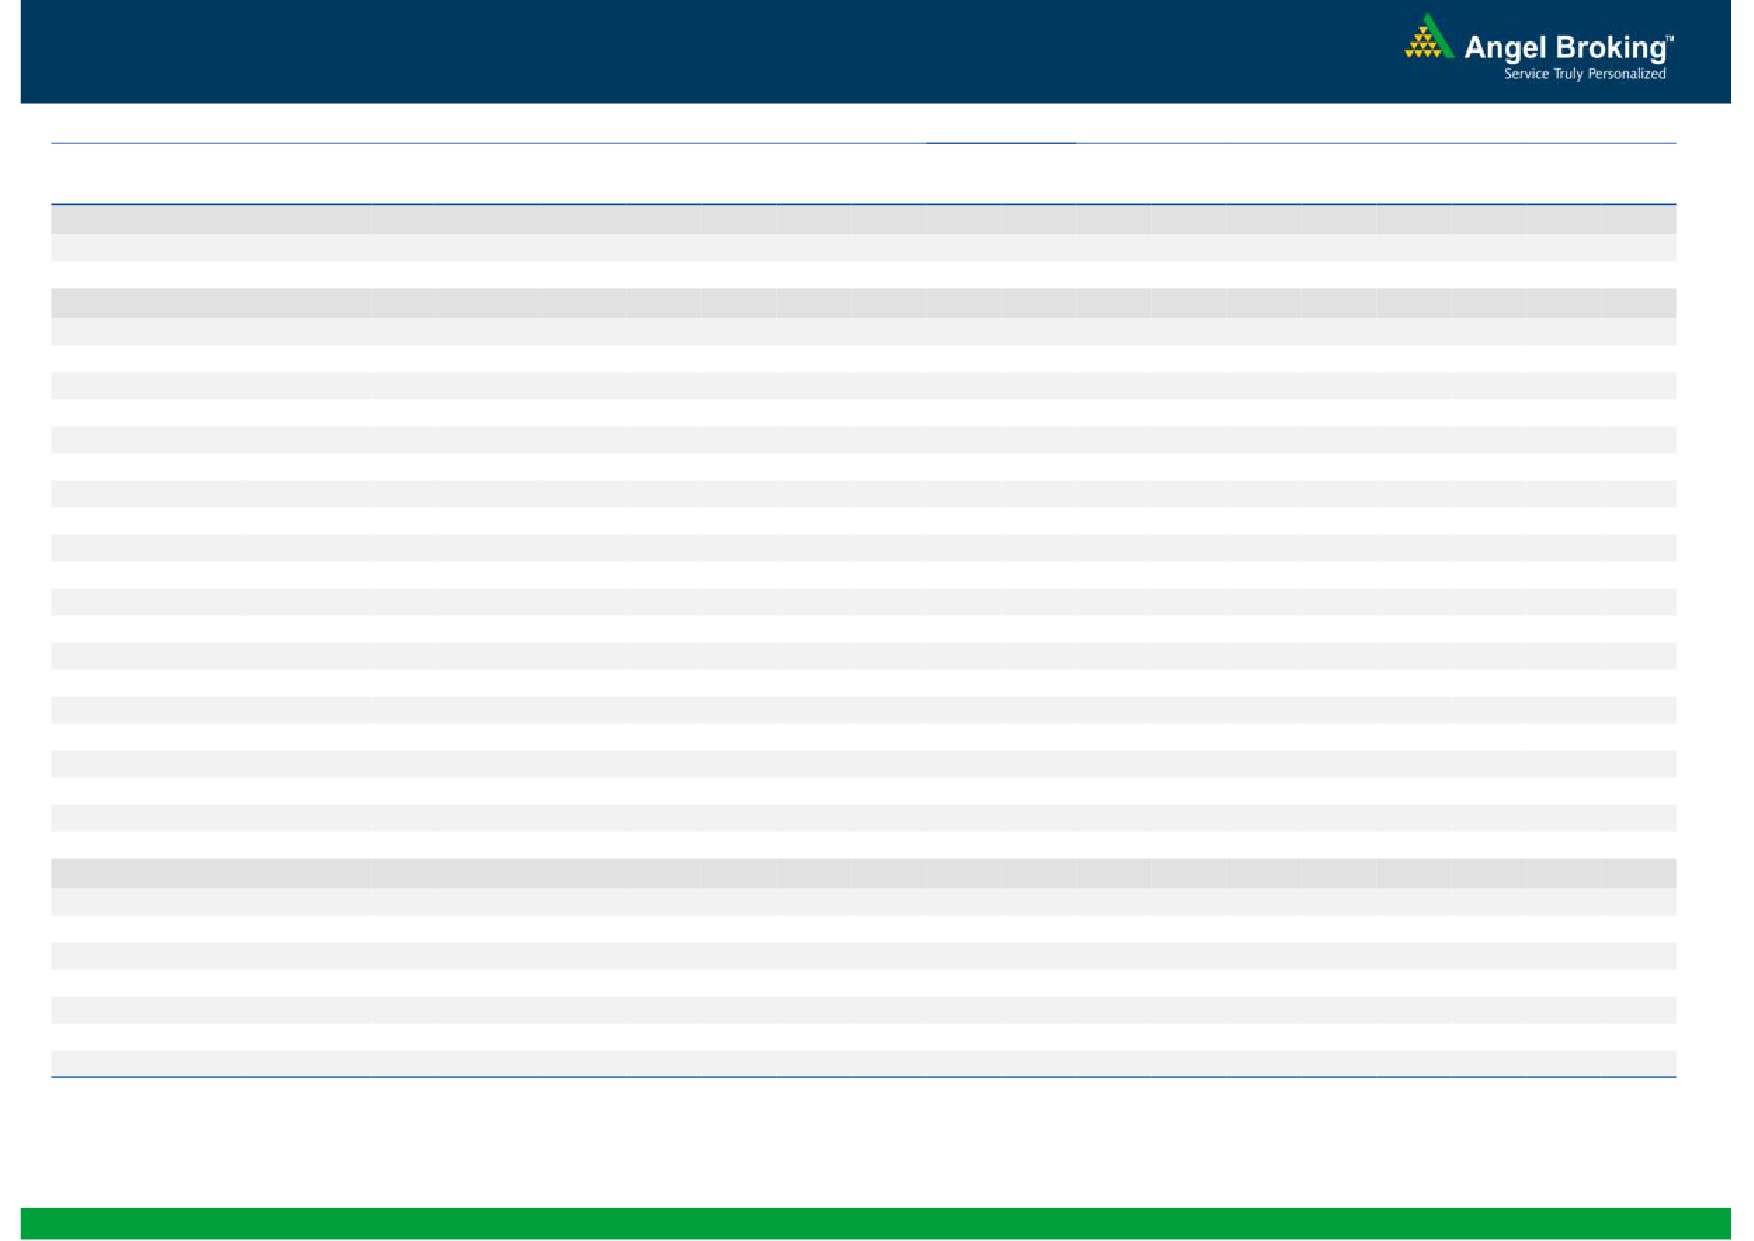
Exhibit 2: 2015 GDP Growth projection by IMF (%, yoy) across select developing and developed countries
(%)
10.0
7.5
8.0
6.8
5.2
6.0
4.8
3.7
4.0
2.7
3.1
2.0
1.6
1.2
1.0
2.0
(3.8)
(1.0)
-
(2.0)
(4.0)
(6.0)
Source: IMF, Angel Research
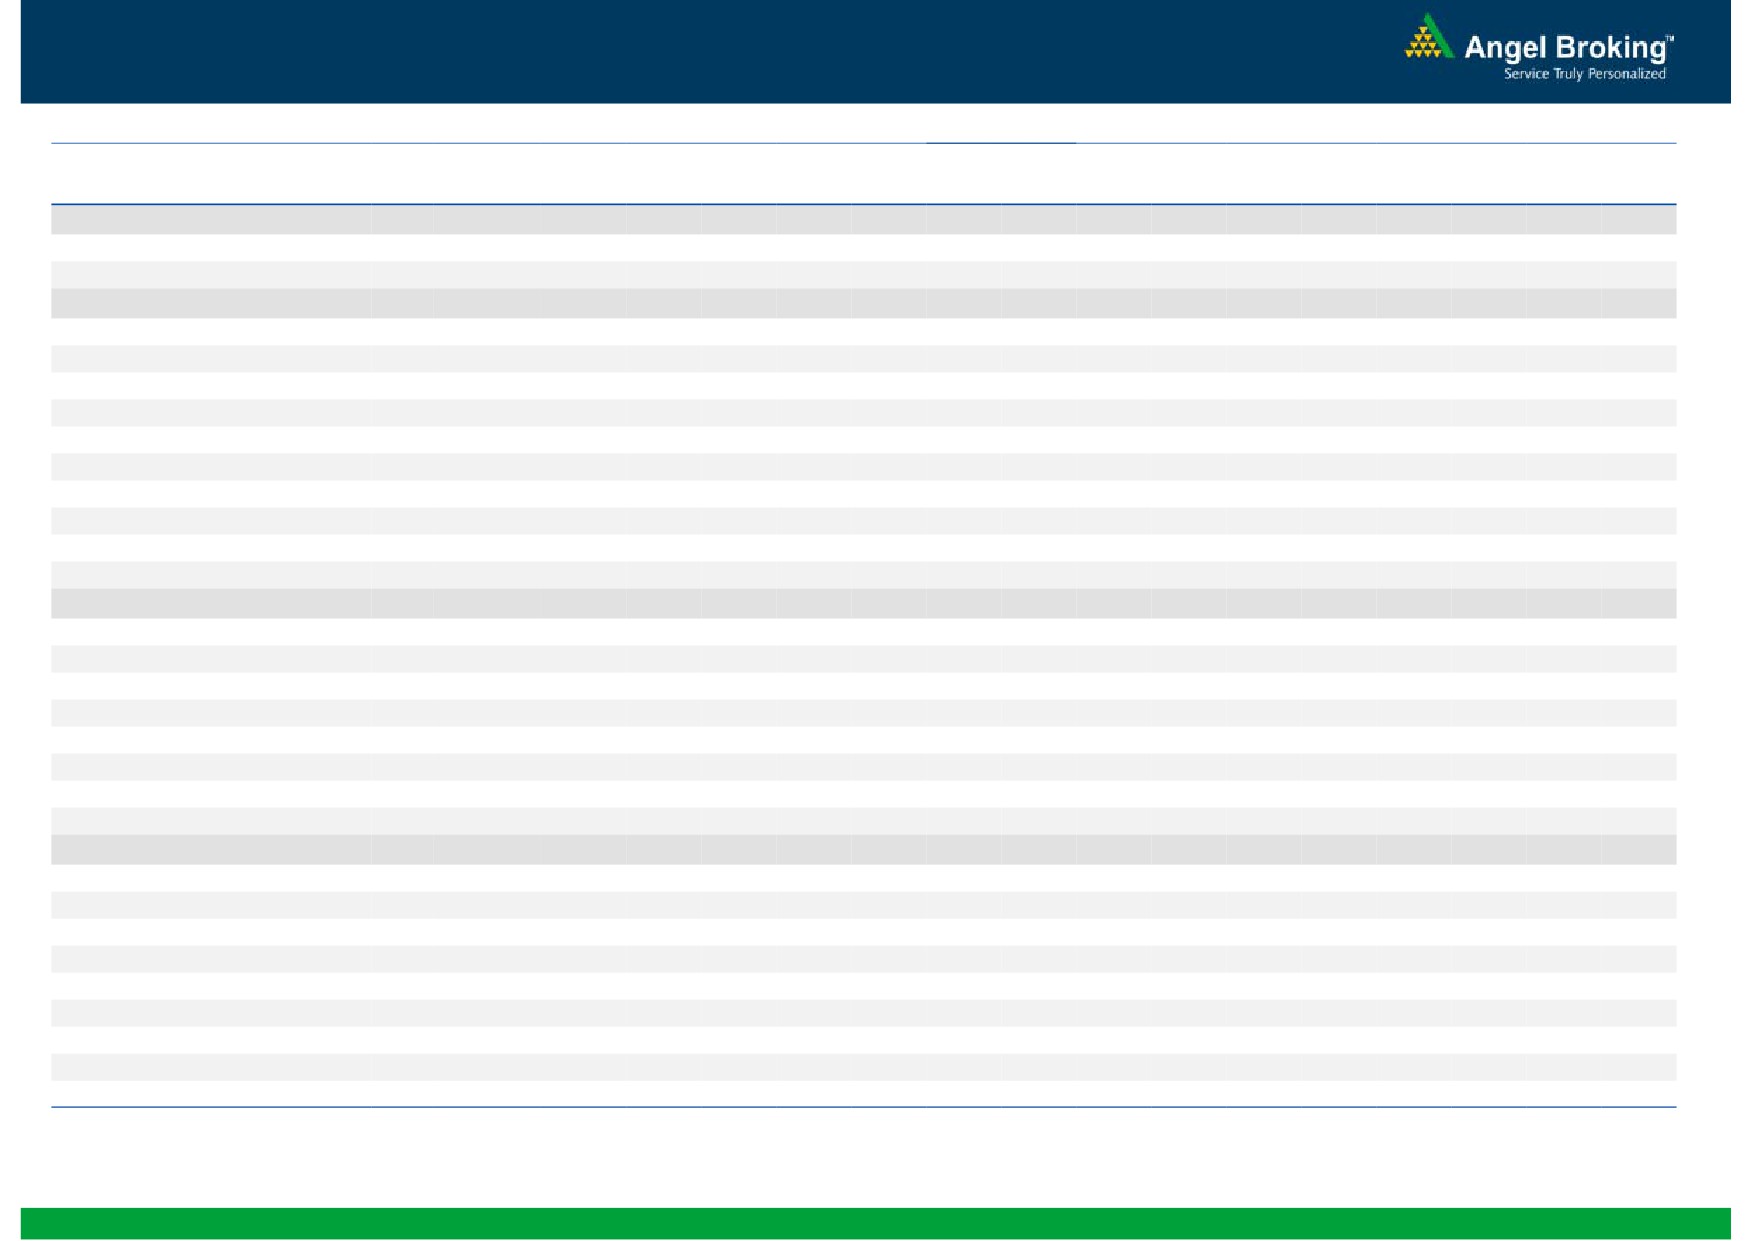
Exhibit 3: One year forward P-E ratio across select developing and developed countries
(x)
18.0
16.0
14.0
12.0
10.0
8.0
6.0
4.0
2.0
-
Source: Bloomberg, Angel Research
Market Outlook
September 14, 2015
Exhibit 4: Relative performance of indices across globe
Returns (%)
Country
Name of index
Closing price
1M
3M
1YR
Brazil
Bovespa
46,401
(5.4)
(13.6)
(21.6)
Russia
Micex
1,718
1.2
3.7
17.0
India
Nifty
7,789
(6.7)
(2.8)
(3.7)
China
Shanghai Composite
3,200
(18.5)
(37.3)
43.2
South Africa
Top 40
43,450
(3.4)
(5.8)
(5.3)
Mexico
Mexbol
42,781
(2.8)
(3.6)
(6.3)
Indonesia
LQ45
736
(5.7)
(14.7)
(16.9)
Malaysia
KLCI
1,604
(2.0)
(7.6)
(14.3)
Thailand
SET 50
897
(2.3)
(9.5)
(14.2)
USA
Dow Jones
16,433
(5.6)
(8.9)
(3.3)
UK
FTSE
6,118
(8.2)
(9.8)
(10.1)
Japan
Nikkei
18,264
(10.4)
(10.5)
16.1
Germany
DAX
10,124
(7.3)
(7.8)
4.5
France
CAC
4,549
(7.6)
(5.5)
2.6
Source: Bloomberg, Angel Research
Market Outlook
September 14, 2015
Stock Watch
Company Name
Reco
CMP
Target
Mkt Cap
Sales ( Čcr )
OPM(%)
EPS (Č)
PER(x)
P/BV(x)
RoE(%)
EV/Sales(x)
(Č)
Price ( Č)
( Č cr )
FY16E FY17E
FY16E
FY17E
FY16E
FY17E
FY16E
FY17E
FY16E
FY17E
FY16E
FY17E
FY16E
FY17E
Agri / Agri Chemical
Rallis
Neutral
220
-
4,277
2,075
2,394
14.4
14.4
9.5
11.0
23.2
20.0
4.6
4.0
21.1
21.3
2.1
1.8
United Phosphorus
Neutral
507
-
21,722
13,698
15,752
17.6
17.6
32.1
38.5
15.8
13.2
3.1
2.6
21.4
21.3
1.7
1.4
Auto & Auto Ancillary
Ashok Leyland
Accumulate
88
97
24,944
18,186
21,529
10.8
11.2
3.3
4.5
26.6
19.5
4.5
4.2
17.3
21.6
1.3
1.1
Bajaj Auto
Accumulate
2,319
2,438
67,090
23,544
27,245
19.8
19.8
127.0
143.4
18.3
16.2
5.5
4.8
30.3
29.4
2.4
2.1
Eicher Motors
Buy
18,882
22,859
51,250
11,681
15,550
15.3
16.9
358.5
564.3
52.7
33.5
15.8
11.8
29.8
34.9
4.3
3.2
Hero Motocorp
Accumulate
2,342
2,672
46,768
28,500
32,764
14.1
14.3
146.9
167.0
15.9
14.0
6.0
5.1
37.8
36.5
1.5
1.3
L G Balakrishnan & Bros Neutral
460
-
722
1,254
1,394
11.6
11.8
35.9
41.7
12.8
11.0
1.7
1.5
13.5
13.8
0.7
0.6
Mahindra and Mahindra Buy
1,166
1,383
72,398
38,337
43,069
13.0
13.4
52.9
63.5
22.0
18.4
3.3
2.9
15.0
15.9
1.5
1.3
Maruti
Accumulate
4,317
4,735
130,422
58,102
68,587
16.7
16.9
182.0
225.5
23.7
19.2
4.7
4.0
19.9
21.0
2.0
1.7
Minda Industries
Buy
514
652
816
2,567
2,965
7.3
8.0
38.8
54.3
13.3
9.5
1.9
1.6
14.4
16.8
0.4
0.3
Rane Brake Lining
Buy
284
366
225
454
511
11.1
11.4
23.8
28.1
11.9
10.1
1.7
1.5
14.2
15.3
0.6
0.6
Setco Automotive
Neutral
226
-
603
594
741
12.7
13.7
8.4
15.8
26.9
14.3
2.8
2.4
10.4
16.9
1.5
1.2
Tata Motors
Accumulate
346
391
99,767
264,038
297,882
13.8
13.9
34.5
38.9
10.0
8.9
1.7
1.4
17.6
16.8
0.5
0.5
TVS Motor
Neutral
233
-
11,051
11,702
13,713
6.8
7.7
10.1
14.5
23.0
16.0
5.6
4.6
24.5
28.3
0.9
0.8
Amara Raja Batteries
Accumulate
928
979
15,847
5,101
6,224
17.8
17.6
31.1
39.2
29.8
23.7
7.4
5.9
24.8
24.8
3.1
2.5
Exide Industries
Accumulate
147
159
12,533
7,363
8,247
13.7
14.5
6.6
7.7
22.3
19.2
2.8
2.6
12.6
13.3
1.4
1.3
Apollo Tyres
Neutral
186
-
9,445
12,576
12,978
16.8
16.1
22.3
19.9
8.3
9.3
1.4
1.3
17.2
13.4
0.8
0.9
Ceat
Neutral
1,216
-
4,921
6,041
6,597
14.3
14.2
101.5
116.6
12.0
10.4
2.4
2.0
20.0
19.1
1.0
0.8
JK Tyres
Neutral
108
-
2,460
7,446
7,669
15.2
14.0
19.6
18.4
5.5
5.9
1.4
1.2
25.2
19.5
0.7
0.6
Swaraj Engines
Accumulate
852
912
1,058
593
677
14.5
14.8
51.2
60.8
16.6
14.0
3.9
3.5
23.3
24.8
1.6
1.4
Subros
Neutral
78
-
467
1,268
1,488
11.6
11.9
3.7
6.6
21.1
11.8
1.4
1.3
6.8
11.4
0.7
0.6
Indag Rubber
Neutral
172
-
450
283
329
17.0
17.2
13.0
15.4
13.3
11.1
2.9
2.4
21.8
21.6
1.3
1.1
Capital Goods
ACE
Neutral
38
-
374
660
839
4.7
8.2
1.0
3.9
37.8
9.7
1.2
1.1
3.2
11.3
0.7
0.6
BEML
Neutral
1,193
-
4,969
3,277
4,006
6.0
8.9
29.2
64.3
40.9
18.6
2.3
2.1
5.7
11.7
1.6
1.3
BGR Energy
Neutral
105
-
756
3,615
3,181
9.5
9.4
16.7
12.4
6.3
8.5
0.6
0.6
10.0
7.0
0.6
0.8
BHEL
Neutral
212
-
51,828
33,722
35,272
10.8
11.7
10.5
14.2
20.2
14.9
1.5
1.4
7.0
9.0
1.6
1.5
Blue Star
Accumulate
340
387
3,059
3,649
4,209
5.0
5.9
9.2
14.7
37.2
23.1
6.7
6.3
9.1
17.5
0.9
0.8
Crompton Greaves
Buy
167
204
10,457
13,484
14,687
4.9
6.2
4.5
7.1
37.1
23.5
2.6
2.5
7.2
10.8
0.9
0.8
Inox Wind
Buy
375
505
8,331
4,980
5,943
17.0
17.5
26.6
31.6
14.1
11.9
4.2
3.1
35.0
30.0
1.8
1.5
Market Outlook
September 14, 2015
Stock Watch
Company Name
Reco
CMP
Target
Mkt Cap
Sales ( Čcr )
OPM(%)
EPS (Č)
PER(x)
P/BV(x)
RoE(%)
EV/Sales(x)
(Č)
Price ( Č)
( Č cr )
FY16E
FY17E
FY16E
FY17E
FY16E
FY17E
FY16E
FY17E
FY16E
FY17E
FY16E
FY17E
FY16E
FY17E
Capital Goods
KEC International
Neutral
138
-
3,535
8,791
9,716
6.1
6.8
5.4
8.2
25.5
16.8
2.6
2.3
10.0
14.0
0.6
0.6
Thermax
Neutral
935
-
11,145
6,413
7,525
7.4
8.5
30.5
39.3
30.7
23.8
4.7
4.1
15.0
17.0
1.7
1.4
Cement
ACC
Accumulate
1,366
1,548
25,637
11,856
14,092
14.5
17.8
47.6
76.1
28.7
17.9
3.0
2.7
10.6
15.7
2.0
1.6
Ambuja Cements
Accumulate
207
233
32,186
10,569
12,022
20.7
22.2
8.7
10.7
23.8
19.4
3.0
2.9
13.0
15.2
2.6
2.3
India Cements
Buy
72
112
2,202
4,716
5,133
15.9
16.9
3.7
7.5
19.4
9.6
0.7
0.7
3.8
7.3
0.8
0.7
JK Cement
Buy
620
767
4,338
4,056
4,748
14.5
17.0
22.6
41.1
27.5
15.1
2.5
2.2
9.3
15.3
1.5
1.2
J K Lakshmi Cement
Buy
370
430
4,357
2,947
3,616
16.7
19.9
11.5
27.2
32.2
13.6
3.1
2.6
9.8
20.8
1.9
1.5
Mangalam Cements
Neutral
213
-
567
1,053
1,347
10.5
13.3
8.4
26.0
25.3
8.2
1.1
1.0
4.3
12.5
0.9
0.7
Orient Cement
Accumulate
163
183
3,337
1,854
2,524
21.2
22.2
7.7
11.1
21.2
14.7
3.0
2.6
13.3
15.7
2.5
1.8
Ramco Cements
Accumulate
324
350
7,707
4,036
4,545
20.8
21.3
15.1
18.8
21.4
17.2
2.6
2.3
12.9
14.3
2.4
2.1
Shree Cement^
Neutral
11,416
-
39,769
7,150
8,742
26.7
28.6
228.0
345.5
50.1
33.0
7.4
6.2
15.7
20.3
5.3
4.3
UltraTech Cement
Accumulate
2,939
3,282
80,640
27,562
31,548
20.4
22.3
111.9
143.3
26.3
20.5
3.7
3.2
15.2
16.8
3.0
2.6
Construction
ITNL
Neutral
101
-
2,501
7,360
8,825
34.0
35.9
1.0
5.0
101.4
20.3
0.4
0.4
0.3
1.4
3.8
3.7
KNR Constructions
Neutral
515
-
1,449
915
1,479
14.3
13.9
20.3
37.2
25.4
13.9
2.3
2.0
9.6
15.6
1.7
1.1
Larsen & Toubro
Buy
1,599
2,013
148,827
68,920
82,446
10.9
11.5
57.0
73.0
28.1
21.9
2.6
2.4
13.6
15.5
2.4
2.0
Gujarat Pipavav Port
Neutral
176
-
8,521
721
784
53.1
53.6
8.2
9.1
21.4
19.4
3.5
2.8
20.0
18.3
11.4
10.1
MBL Infrastructures
Buy
243
360
1,008
2,313
2,797
12.2
14.6
19.0
20.0
12.8
12.2
1.3
1.2
11.3
10.6
1.1
1.0
Nagarjuna Const.
Neutral
63
-
3,505
7,892
8,842
8.3
9.1
2.4
5.3
26.3
11.9
1.1
1.0
4.2
8.6
0.7
0.6
PNC Infratech
Neutral
470
-
2,412
1,798
2,132
13.2
13.5
22.0
30.0
21.4
15.7
1.9
1.7
11.5
11.4
1.4
1.2
Simplex Infra
Neutral
273
-
1,353
6,241
7,008
10.4
10.7
20.0
36.0
13.7
7.6
1.1
1.0
6.8
11.1
0.7
0.6
Financials
Allahabad Bank
Neutral
75
-
4,302
8,438
9,521
2.8
2.8
21.9
27.0
3.4
2.8
0.4
0.3
10.2
11.5
-
-
Axis Bank
Buy
481
701
114,424
26,941
32,298
3.5
3.6
37.4
46.4
12.9
10.4
2.6
2.3
18.7
20.0
-
-
Bank of Baroda
Neutral
181
-
40,050
19,027
21,737
1.9
2.0
16.9
24.5
10.7
7.4
1.0
0.9
9.1
12.1
-
-
Bank of India
Neutral
132
-
8,780
16,438
18,706
1.9
2.0
19.2
40.9
6.9
3.2
0.4
0.3
4.5
9.1
-
-
Canara Bank
Neutral
259
-
13,344
15,491
17,269
2.0
2.0
61.6
70.9
4.2
3.7
0.5
0.4
10.5
11.1
-
-
Dena Bank
Neutral
41
-
2,287
3,498
3,977
2.1
2.3
7.8
10.7
5.2
3.8
0.4
0.4
6.5
8.4
-
-
Federal Bank
Neutral
60
-
10,370
3,527
4,135
3.0
3.1
5.2
6.7
11.6
9.0
1.2
1.1
10.8
12.7
-
-
HDFC
Neutral
1,174
-
185,130
10,883
12,799
3.5
3.4
43.0
50.6
27.3
23.2
5.4
4.9
25.9
26.7
-
-
HDFC Bank
Buy
1,008
1,255
253,593
38,059
46,851
4.4
4.5
50.0
62.7
20.2
16.1
3.5
3.0
18.8
20.2
-
-
Market Outlook
September 14, 2015
Stock Watch
Company Name
Reco
CMP
Target
Mkt Cap
Sales ( Čcr )
OPM(%)
EPS (Č)
PER(x)
P/BV(x)
RoE(%)
EV/Sales(x)
(Č)
Price ( Č)
( Č cr )
FY16E
FY17E
FY16E
FY17E
FY16E
FY17E
FY16E
FY17E
FY16E
FY17E
FY16E
FY17E
FY16E
FY17E
Financials
ICICI Bank
Buy
267
370
155,161
35,810
41,871
3.4
3.5
22.0
26.2
12.2
10.2
2.1
1.8
15.0
15.6
-
-
IDBI Bank
Neutral
56
-
8,990
9,860
10,978
1.8
1.9
9.3
15.6
6.1
3.6
0.4
0.4
6.4
10.1
-
-
Indian Bank
Neutral
126
-
6,054
6,267
7,171
2.4
2.5
25.4
32.1
5.0
3.9
0.4
0.4
8.0
9.3
-
-
LIC Housing Finance
Buy
429
570
21,637
2,934
3,511
2.3
2.3
30.9
36.8
13.9
11.7
2.2
1.9
16.8
17.5
-
-
Oriental Bank
Neutral
126
-
3,774
7,730
8,595
2.4
2.5
38.8
47.4
3.2
2.7
0.3
0.3
8.6
9.8
-
-
Punjab Natl.Bank
Neutral
134
-
24,907
23,446
26,624
2.8
2.9
17.8
27.5
7.5
4.9
0.8
0.6
8.5
12.1
-
-
South Ind.Bank
Neutral
20
-
2,761
1,930
2,215
2.4
2.4
2.6
3.6
7.9
5.7
0.8
0.7
9.9
12.5
-
-
St Bk of India
Buy
230
307
174,137
83,847
96,307
2.8
2.8
20.1
25.1
11.5
9.2
1.3
1.1
11.5
13.1
-
-
Union Bank
Neutral
166
-
10,551
12,755
14,439
2.3
2.4
31.5
39.9
5.3
4.2
0.6
0.5
9.9
11.6
-
-
Vijaya Bank
Neutral
36
-
3,076
3,594
3,969
1.8
1.9
5.8
7.1
6.1
5.1
0.5
0.5
8.2
9.3
-
-
Yes Bank
Buy
711
953
29,770
7,204
9,078
3.2
3.2
57.8
69.5
12.3
10.2
2.2
1.9
19.6
22.6
-
-
FMCG
Asian Paints
Neutral
815
-
78,127
16,553
19,160
16.0
16.2
17.7
21.5
46.1
37.9
12.2
11.0
29.4
31.2
4.6
3.9
Britannia
Neutral
2,954
-
35,438
8,065
9,395
9.6
10.2
47.2
65.5
62.6
45.1
20.8
19.7
38.3
41.2
4.2
3.6
Colgate
Accumulate
1,856
2,022
25,246
4,836
5,490
19.5
19.7
48.5
53.2
38.3
34.9
28.1
24.4
99.8
97.5
5.1
4.5
Dabur India
Neutral
282
-
49,498
9,370
10,265
17.1
17.2
7.3
8.1
38.4
34.8
11.6
9.4
33.7
30.6
5.2
4.7
GlaxoSmith Con*
Neutral
6,077
-
25,559
4,919
5,742
17.2
17.4
168.3
191.2
36.1
31.8
10.2
8.7
28.8
28.9
4.8
4.0
Godrej Consumer
Neutral
1,225
-
41,708
10,168
12,886
16.1
16.1
32.1
38.4
38.2
31.9
7.8
7.2
19.7
21.0
4.2
3.3
HUL
Neutral
795
-
171,918
34,940
38,957
17.5
17.7
20.8
24.7
38.2
32.2
42.5
34.0
110.5
114.2
4.7
4.2
ITC
Buy
313
409
251,173
41,068
45,068
37.8
37.4
13.9
15.9
22.5
19.7
7.5
6.6
34.1
33.8
5.7
5.2
Marico
Neutral
405
-
26,097
6,551
7,766
15.7
16.0
10.4
12.5
39.0
32.4
11.3
9.4
33.2
32.4
3.9
3.3
Nestle*
Accumulate
5,985
6,646
57,703
11,291
12,847
22.2
22.3
158.9
184.6
37.7
32.4
19.7
17.7
55.0
57.3
5.0
4.3
Tata Global
Buy
123
152
7,772
8,635
9,072
9.8
9.9
6.5
7.6
19.0
16.2
1.9
1.8
6.8
7.4
0.8
0.8
IT
HCL Tech^
Buy
919
1,132
129,278
42,038
47,503
23.5
23.5
56.4
62.9
16.3
14.6
3.8
2.9
23.2
19.8
2.7
2.2
Infosys
Buy
1,091
1,306
250,528
60,250
66,999
28.0
28.0
58.3
63.7
18.7
17.1
3.9
3.4
20.9
19.7
3.5
3.0
TCS
Buy
2,546
3,168
498,594
108,420
123,559
28.8
28.7
127.2
143.9
20.0
17.7
8.0
7.4
39.9
41.8
4.2
3.6
Tech Mahindra
Buy
525
646
50,482
25,566
28,890
16.0
17.0
26.3
31.9
20.0
16.5
3.6
3.1
17.9
18.6
1.7
1.5
Wipro
Buy
557
719
137,635
52,414
58,704
23.7
23.8
38.4
42.3
14.5
13.2
2.8
2.5
19.5
18.0
2.2
1.8
Media
D B Corp
Buy
301
356
5,535
2,241
2,495
27.8
27.9
21.8
25.6
13.8
11.8
3.6
3.2
26.7
28.5
2.4
2.2
HT Media
Neutral
82
-
1,900
2,495
2,603
11.2
11.2
7.3
8.6
11.2
9.5
0.9
0.8
7.4
8.1
0.3
0.2
Market Outlook
September 14, 2015
Stock Watch
Company Name
Reco
CMP
Target
Mkt Cap
Sales ( Čcr )
OPM(%)
EPS (Č)
PER(x)
P/BV(x)
RoE(%)
EV/Sales(x)
(Č)
Price ( Č)
( Č cr )
FY16E FY17E
FY16E
FY17E
FY16E
FY17E
FY16E
FY17E
FY16E
FY17E
FY16E
FY17E
FY16E
FY17E
Media
Jagran Prakashan
Buy
134
156
4,389
1,939
2,122
26.0
26.0
8.3
9.2
16.2
14.6
2.8
2.5
17.5
17.1
2.2
2.0
Sun TV Network
Neutral
341
-
13,456
2,779
3,196
70.2
70.5
22.8
27.3
15.0
12.5
3.7
3.3
26.7
28.3
4.6
4.0
Hindustan Media
Buy
219
292
1,610
920
1,031
20.0
20.0
19.2
20.9
11.4
10.5
1.9
1.6
16.4
15.3
1.3
1.1
Ventures
Metals & Mining
Coal India
Buy
334
400
210,872
72,015
78,415
21.2
21.5
21.7
25.3
15.4
13.2
5.2
5.1
33.1
39.1
2.2
2.0
Hind. Zinc
Neutral
130
-
54,908
15,258
16,495
44.2
45.6
17.6
19.2
7.4
6.8
1.1
1.0
15.9
15.3
1.3
0.9
Hindalco
Neutral
76
-
15,715
104,356
111,186
8.7
9.5
6.7
11.1
11.3
6.9
0.4
0.4
3.5
5.9
0.7
0.6
JSW Steel
Neutral
963
-
23,277
48,125
53,595
18.8
21.0
46.9
97.5
20.5
9.9
1.0
0.9
4.4
9.5
1.3
1.2
NMDC
Neutral
100
-
39,806
8,237
10,893
46.6
44.5
10.0
11.7
10.1
8.6
1.1
1.0
12.5
13.0
4.6
3.5
SAIL
Neutral
51
-
21,105
45,915
53,954
7.2
10.5
1.5
4.4
33.9
11.7
0.5
0.5
2.3
4.1
1.1
1.0
Vedanta
Neutral
97
-
28,758
71,445
81,910
26.2
26.3
12.9
19.2
7.5
5.1
0.5
0.5
7.2
8.9
0.9
0.7
Tata Steel
Neutral
233
-
22,634
136,805
149,228
11.3
11.9
26.4
36.8
8.8
6.3
0.7
0.7
6.0
8.0
0.7
0.6
Oil & Gas
Cairn India
Neutral
146
-
27,326
11,323
12,490
49.4
51.0
20.7
20.7
7.0
7.1
0.5
0.4
6.4
6.1
1.5
0.8
GAIL
Neutral
285
-
36,158
64,856
70,933
9.1
9.6
24.0
28.9
11.9
9.9
1.0
1.0
8.8
9.6
0.7
0.7
ONGC
Neutral
228
-
195,236
154,564
167,321
36.8
37.4
28.6
32.5
8.0
7.0
1.0
0.9
12.7
13.5
1.5
1.4
Petronet LNG
Buy
173
210
12,979
39,007
40,785
3.8
4.2
9.2
11.0
18.9
15.8
2.1
1.9
11.6
12.7
0.4
0.4
Indian Oil Corp
Accumulate
399
455
96,948
359,607
402,760
5.9
6.1
42.5
48.7
9.4
8.2
1.3
1.1
14.1
14.4
0.4
0.3
Reliance Industries
Accumulate
861
930
278,845
313,085
362,904
13.1
13.8
78.4
92.9
11.0
9.3
1.2
1.0
10.8
11.6
1.4
1.2
Pharmaceuticals
Alembic Pharma
Neutral
667
-
12,582
2,601
3,115
21.2
20.2
20.8
23.9
32.1
27.9
10.3
7.8
37.2
31.8
4.9
4.0
Aurobindo Pharma
Buy
708
872
41,327
14,923
17,162
23.0
23.0
38.2
43.6
18.5
16.2
5.7
4.3
36.0
30.2
3.1
2.6
Aventis*
Neutral
3,938
-
9,069
2,156
2,455
15.1
16.8
109.7
133.9
35.9
29.4
4.9
4.0
18.4
22.5
3.9
3.3
Cadila Healthcare
Neutral
1,784
-
36,533
10,224
11,840
20.0
21.0
71.0
85.6
25.1
20.8
6.7
5.3
30.1
28.5
3.6
3.1
Cipla
Neutral
653
-
52,443
14,359
16,884
21.3
19.7
28.4
30.5
23.0
21.4
4.1
3.5
19.3
17.5
3.6
3.0
Dr Reddy's
Neutral
4,005
-
68,284
17,903
20,842
22.7
22.8
160.5
189.5
25.0
21.1
5.1
4.2
22.2
21.7
3.8
3.2
Dishman Pharma
Buy
244
290
1,968
1,716
1,888
20.2
20.2
16.3
21.6
15.0
11.3
1.4
1.3
9.7
11.7
1.3
1.1
GSK Pharma*
Neutral
3,345
-
28,333
2,870
3,158
20.0
22.1
59.5
68.3
56.2
49.0
16.6
17.0
28.5
34.3
9.4
8.6
Indoco Remedies
Neutral
341
-
3,142
1,088
1,262
18.2
18.2
13.1
15.5
26.0
22.0
5.1
4.3
21.2
21.1
3.0
2.5
Ipca labs
Accumulate
747
800
9,429
3,507
4,078
17.6
18.6
25.8
32.0
29.0
23.4
3.7
3.2
13.8
14.9
3.0
2.5
Lupin
Neutral
1,811
-
81,492
14,864
17,244
26.9
26.9
62.1
71.1
29.2
25.5
7.1
5.6
27.4
24.6
5.2
4.4
Sun Pharma
Accumulate
846
950
203,488
28,163
32,610
25.8
30.7
17.4
26.9
48.6
31.4
4.6
4.0
13.0
16.6
6.7
5.6
Market Outlook
September 14, 2015
Stock Watch
Company Name
Reco
CMP
Target
Mkt Cap
Sales ( Čcr )
OPM(%)
EPS (Č)
PER(x)
P/BV(x)
RoE(%)
EV/Sales(x)
(Č)
Price ( Č)
( Č cr )
FY16E FY17E
FY16E
FY17E
FY16E
FY17E
FY16E
FY17E
FY16E
FY17E
FY16E
FY17E
FY16E
FY17E
Power
Tata Power
Neutral
60
-
16,106
35,923
37,402
22.6
22.8
4.1
5.2
14.7
11.6
1.1
1.1
7.5
9.3
1.4
1.3
NTPC
Buy
120
157
98,533
87,064
98,846
23.5
23.5
11.7
13.2
10.2
9.1
1.1
1.1
11.4
12.1
2.2
1.9
Power Grid
Buy
124
170
64,924
20,702
23,361
86.7
86.4
12.1
13.2
10.3
9.4
1.5
1.3
15.6
15.1
8.1
7.5
Telecom
Bharti Airtel
Neutral
348
-
139,110
101,748
109,191
32.1
31.7
12.0
12.5
29.0
27.8
2.0
1.9
6.9
6.7
2.0
1.8
Idea Cellular
Neutral
149
-
53,559
34,282
36,941
32.0
31.5
5.9
6.2
25.2
24.0
2.3
2.1
9.9
9.3
2.1
2.0
zOthers
Abbott India
Neutral
5,395
-
11,464
2,715
3,153
14.5
14.1
134.3
152.2
40.2
35.4
10.0
8.3
27.4
25.6
3.9
3.3
Bajaj Electricals
Buy
247
341
2,492
4,719
5,287
5.2
5.8
8.6
12.7
28.9
19.5
3.3
2.9
11.4
14.8
0.5
0.5
Finolex Cables
Neutral
236
-
3,612
2,728
3,036
10.8
11.0
14.4
16.8
16.4
14.1
2.5
2.2
15.2
15.3
1.1
0.9
Goodyear India*
Buy
535
655
1,234
1,953
1,766
12.4
12.0
67.4
59.6
7.9
9.0
2.0
1.7
27.7
20.2
0.4
0.4
Hitachi
Neutral
1,365
-
3,712
1,806
2,112
9.0
9.2
28.6
29.1
47.7
46.9
11.9
9.6
28.1
22.6
2.1
1.8
Jyothy Laboratories
Neutral
308
-
5,570
1,620
1,847
11.5
11.5
7.3
8.5
42.2
36.3
5.5
5.1
13.3
14.4
3.3
2.8
MRF
Accumulate
40,534
43,575
17,191
20,727
14,841
19.3
18.6
4,905.8
3,351.9
8.3
12.1
2.6
2.2
37.6
19.6
0.8
1.1
Page Industries
Neutral
13,287
-
14,821
1,929
2,450
19.8
20.1
229.9
299.0
57.8
44.5
25.5
17.7
52.1
47.1
7.7
6.1
Relaxo Footwears
Neutral
536
-
6,432
1,767
2,152
12.3
12.5
19.3
25.1
27.9
21.4
6.8
5.3
27.7
27.8
3.7
3.0
Siyaram Silk Mills
Buy
996
1,221
934
1,653
1,873
11.7
12.2
99.3
122.1
10.0
8.2
1.8
1.5
19.5
20.2
0.7
0.6
Styrolution ABS India*
Neutral
740
-
1,302
1,271
1,440
8.6
9.2
32.0
41.1
23.1
18.0
2.4
2.1
10.7
12.4
1.0
0.9
Tree House
Buy
376
449
1,590
259
324
56.8
56.8
17.0
21.7
22.1
17.3
2.2
2.0
10.1
11.5
6.1
5.0
TVS Srichakra
Buy
2,658
3,210
2,035
2,127
2,388
15.2
14.9
237.7
267.5
11.2
9.9
4.8
3.4
51.7
39.8
1.0
0.9
HSIL
Buy
243
434
1,758
2,085
2,436
18.5
18.6
21.7
28.9
11.2
8.4
1.1
1.0
10.0
12.1
1.0
0.8
Kirloskar Engines India
Neutral
283
-
4,091
2,634
3,252
10.1
12.0
10.9
17.4
26.0
16.2
2.9
2.6
11.4
16.8
1.2
0.9
Ltd
M M Forgings
Buy
539
797
650
563
671
22.1
22.9
51.0
66.5
10.6
8.1
2.2
1.8
23.1
24.1
1.3
1.1
Banco Products (India)
Neutral
118
-
842
1,208
1,353
11.0
12.3
10.8
14.5
10.9
8.1
1.3
1.1
11.9
14.5
0.7
0.6
Competent Automobiles Neutral
145
-
89
1,007
1,114
3.1
3.1
23.7
28.2
6.1
5.1
0.9
0.8
13.9
14.6
0.1
0.1
Nilkamal
Accumulate
904
1,005
1,348
1,948
2,147
10.6
10.3
60.0
67.0
15.1
13.5
2.4
2.0
16.8
16.1
0.7
0.6
Visaka Industries
Buy
132
166
210
1,158
1,272
8.6
9.5
23.7
32.7
5.6
4.1
0.6
0.5
10.1
12.5
0.4
0.3
Transport Corporation of
Buy
237
293
1,800
2,830
3,350
8.8
9.0
14.4
18.3
16.5
12.9
2.5
2.2
15.4
17.1
0.8
0.7
India
Elecon Engineering
Buy
70
87
766
1,452
1,596
14.0
14.7
4.4
6.2
15.9
11.3
1.3
1.2
8.6
11.2
0.8
0.7
Surya Roshni
Buy
118
183
518
2,992
3,223
8.3
8.5
14.7
18.3
8.0
6.5
0.8
0.7
9.8
11.0
0.5
0.4
MT Educare
Buy
123
169
489
286
366
18.3
17.7
7.7
9.4
15.9
13.1
3.3
2.9
20.2
21.1
1.6
1.2
Market Outlook
September 14, 2015
Stock Watch
Company Name
Reco
CMP
Target Mkt Cap
Sales ( Čcr )
OPM(%)
EPS (Č)
PER(x)
P/BV(x)
RoE(%)
EV/Sales(x)
(Č)
Price ( Č)
( Č cr )
FY16E FY17E FY16E FY17E FY16E FY17E FY16E FY17E FY16E FY17E FY16E FY17E FY16E FY17E
zOthers
Radico Khaitan
Buy
86
112
1,141
1,565
1,687
11.9
12.4
5.4
6.6
15.8
13.0
1.3
1.2
8.0
9.0
1.2
1.2
Garware Wall Ropes
Buy
285
390
624
875
983
10.4
10.6
23.1
27.8
12.4
10.3
1.7
1.5
14.1
14.8
0.7
0.6
Wonderla Holidays
Buy
274
322
1,547
206
308
44.0
43.6
9.0
12.9
30.4
21.2
4.2
3.8
13.7
17.8
7.4
4.9
Linc Pen & Plastics
Buy
151
185
223
340
371
8.3
8.9
10.8
13.2
14.0
11.5
2.2
2.0
16.0
17.1
0.7
0.6
Source: Company, Angel Research; Note: *December year end; #September year end; &October year end; Price as on September 11, 2015
Market Outlook
September 14, 2015
Research Team Tel: 022 - 39357800
DISCLAIMER
Angel Broking Private Limited (hereinafter referred to as “Angel”) is a registered Member of National Stock Exchange of India Limited,
Bombay Stock Exchange Limited and MCX Stock Exchange Limited. It is also registered as a Depository Participant with CDSL and
Portfolio Manager with SEBI. It also has registration with AMFI as a Mutual Fund Distributor. Angel Broking Private Limited is a registered
entity with SEBI for Research Analyst in terms of SEBI (Research Analyst) Regulations, 2014 vide registration number INH000000164.
Angel or its associates has not been debarred/ suspended by SEBI or any other regulatory authority for accessing /dealing in securities
Market. Angel or its associates including its relatives/analyst do not hold any financial interest/beneficial ownership of more than 1% in
the company covered by Analyst. Angel or its associates/analyst has not received any compensation / managed or co-managed public
offering of securities of the company covered by Analyst during the past twelve months. Angel/analyst has not served as an officer,
director or employee of company covered by Analyst and has not been engaged in market making activity of the company covered by
Analyst.
This document is solely for the personal information of the recipient, and must not be singularly used as the basis of any investment
decision. Nothing in this document should be construed as investment or financial advice. Each recipient of this document should make
such investigations as they deem necessary to arrive at an independent evaluation of an investment in the securities of the companies
referred to in this document (including the merits and risks involved), and should consult their own advisors to determine the merits and
risks of such an investment.
Reports based on technical and derivative analysis center on studying charts of a stock's price movement, outstanding positions and
trading volume, as opposed to focusing on a company's fundamentals and, as such, may not match with a report on a company's
fundamentals.
The information in this document has been printed on the basis of publicly available information, internal data and other reliable sources
believed to be true, but we do not represent that it is accurate or complete and it should not be relied on as such, as this document is for
general guidance only. Angel Broking Pvt. Limited or any of its affiliates/ group companies shall not be in any way responsible for any
loss or damage that may arise to any person from any inadvertent error in the information contained in this report. Angel Broking Pvt.
Limited has not independently verified all the information contained within this document. Accordingly, we cannot testify, nor make any
representation or warranty, express or implied, to the accuracy, contents or data contained within this document. While Angel Broking
Pvt. Limited endeavors to update on a reasonable basis the information discussed in this material, there may be regulatory, compliance,
or other reasons that prevent us from doing so.
This document is being supplied to you solely for your information, and its contents, information or data may not be reproduced,
redistributed or passed on, directly or indirectly.
Neither Angel Broking Pvt. Limited, nor its directors, employees or affiliates shall be liable for any loss or damage that may arise from or
in connection with the use of this information.
Note: Please refer to the important ‘Stock Holding Disclosure' report on the Angel website (Research Section). Also, please refer to the
latest update on respective stocks for the disclosure status in respect of those stocks. Angel Broking Pvt. Limited and its affiliates may have
investment positions in the stocks recommended in this report.