Market Outlook
November 13, 2015
Market Cues
Domestic Indices
Chg (%)
(Pts)
(Close)
Indian markets are expected to open in red tracking SGX Nifty and Asian peers.
BSE Sensex
0.5
124
25,867
U.S. stocks closed more than 1% down on Thursday, under pressure from sharp fall
Nifty
0.5
42
7,825
in the oil prices, as investors eyed negatively several speeches from the Fed officials.
Mid Cap
1.0
112
10,801
Energy closed down nearly 2.4% as the greatest decliner in S&P, which was lower for
Small Cap
1.5
163
11,211
the 6th time in 7 sessions. All major indices posted their worst day since Sept. 28,
Bankex
0.9
171
19,395
with S&P 500 ending lower year-to-date for the first time since Oct. 22 and the Dow
Jones industrial average off more than 250 points.
Global Indices
Chg (%)
(Pts)
(Close)
British blue-chip stocks dropped the most in last 6 weeks on Thursday, leaving the
benchmark FTSE 100 at its lowest in more than a month’s time. Commodity shares
Dow Jones
(1.4)
(254)
17,448
slumped as metals prices declined, while Rolls-Royce Holdings Plc shares dropped
Nasdaq
(1.2)
(62)
5,005
on the back of aircraft-engine maker’s profit warning. FTSE was down by 1.9%, the
FTSE
(1.9)
(119)
6,179
sharpest percentage loss since Sept. 28.
Nikkei
0.0
6
19,698
After a dismal trading session on Tuesday, markets showed a bit of enthusiasm in
Hang Seng
2.4
537
22,889
auspicious Muhurat trading for Diwali. The key benchmark indices ended 0.5% up.
Shanghai Com
(0.5)
(17)
3,633
Adding to festive mood was government’s push for FDI by liberalising norms in15
sectors. Stocks in the banking, realty and media sector ended in green.
Advances / Declines
BSE
NSE
News & Result Analysis
Advances
1,974
1,257
Dr Reddy's restrained from selling generic drug Nexium in US market
Declines
405
180
Industrial growth dips to 4-month low in Sept
Unchanged
90
40
Result Review: NCC, Hindalco Industries
Detailed analysis on Pg2
Volumes (` Cr)
Investor’s Ready Reckoner
BSE
697
Key Domestic & Global Indicators
NSE
2,788
Stock Watch: Latest investment recommendations on 150+ stocks
Refer P6 onwards
Net Inflows (` Cr)
Net
Mtd
Ytd
Top Picks
FII
(423)
(430)
(15,249)
CMP
Target
Upside
Company
Sector
Rating
MFs
1,049
1,216
51,563
(`)
(`)
(%)
Axis Bank
Financials
Buy
480
630
31.1
Top Gainers
Price (`)
Chg (%)
HCL Tech
IT
Buy
852
1,132
32.9
ICICI Bank
Financials
Buy
264
348
31.7
Den
115
14.9
Ashok Leyland
Automobiles
Buy
91
111
22.7
Hathway
46
10.5
Larsen & Toubro
Construction
Buy
1,367
1,646
20.5
Vakrangee
124
6.1
More Top Picks on Pg4
Hcc
24
5.7
Pmcfin
1
5.5
Key Upcoming Events
Previous
Consensus
Date
Region
Event Description
Reading
Expectations
Top Losers
Price (`)
Chg (%)
Nov 13
EUR
German GDP (QoQ) (Q3)
0.4%
0.3%
Kpit
147
(2.1)
Nov 13
USD
Core Retail Sales (MOM) (Oct)
-0.3%
0.4%
Kscl
454
(1.9)
Nov 16
EUR
CPI (YoY) (Oct)
Monsanto
2,262
(1.2)
Nov 17
GBP
CPI (YoY) (Oct)
-0.1%
Pageind
12,545
(1.1)
Gspl
126
(0.8)
As on November 11, 2015
Market Outlook
November 13, 2015
Dr Reddy's restrained from selling generic drug Nexium in US market
In an order passed by the District Court of Delaware, USA, Dr Reddy’s has granted
a Temporary Restraining Order (TRO) with immediate effect on sales, delivery,
transfer, or other disposition of its generic esomeprazole product in the US market.
The order came about as a result of a motion moved by Astra Zeneca objecting to
the usage of the colour Purple in the said generic product.
The order has been passed pending further hearing or trial. The Court has asked
the parties to propose a next course of action and submit the same to the court.
The court shall conduct a telephonic status conference on Thursday, November 12,
2015. The Company is said to have compiled with the order of the Court and
simultaneously evaluating all possible options to resolve the matter at the earliest.
While we believe that the issues is not that big, given that it involves, only colour
issue. However, in worst case scenario we had factored in sales of US$30-50mn
for the product, leading to the EPS impact of Rs 1-2. We remain NEUTRAL on the
stock.
Industrial growth dips to 4-month low in Sept
Industrial growth fell to 4-month low of 3.6% in September, against 6.2% in
August, reflecting deceleration in manufacturing and mining activities. Electricity
generation, registered a double-digit growth (up 11% in September against 5.6%
in August). Manufacturing growth was down at 2.6% in September against 6.6% in
August, capital goods and consumer durable goods continued to register double
digit growth rates. Capital goods production rose 21.8% in September against
10.6% in August, showing investment activities. However, the activities were still
confined to public expenditure, instead of private investment. Consumer durables
output rose by 17% in September against 10.3% in previous month. Consumer
non-durables/ Fast moving consumer goods struggled to recover. Their production
grew 0.4% in September against contraction of 4.6% in the previous month.
IIP growth rose to 4.6% in 2QFY2016 against 3.3 % in 1Q, which will have
positive implications for gross domestic product (GDP) numbers for July-September
(to be released by end of this month).
Result Review
NCC (CMP: `77/ TP: -/ Upside: -)
NCC reported numbers ahead of our expectations. The company reported top-line
of `2,067cr, ahead of our estimate of `1,979cr. At the EBITDA margin front, NCC
reported 8.8% margins, ahead of our expectation of 8.5% for the quarter. In-line
with EBITDA margin surprise, NCC’s PAT margins were also ahead of our
expectations of 2.2% at 2.6% for 2QFY2016. NCC reported order inflows of
`2,293cr for 1HFY2016 (reflecting order wins to the tune of `1,015cr for
2QFY2016). Also, the company in 3QFY2016 has reported Order Inflows of
`2,058cr, thereby taking the total Order inflows YTDFY2016 to
`4,351cr.
Accordingly, YTD order book of the company currently stands at `1,955cr (OB to
LTM ratio of 2.3x). We maintain Neutral rating on the stock.
Market Outlook
November 13, 2015
Hindalco Industries (CMP: `80 / TP: - / Upside: -)
Hindalco Industries reported a 31% yoy increase in net profit for 2QFY16 to
`103.27cr, vs. expectations `96.4cr of driven by higher revenues as the company
ramped up production. Higher other income also supported the rise in profits. Net
sales increased 4% yoy `8,840cr (vs. expectations of `8,026cr) as production at its
new smelters rose. Results came in ahead of expectations led by the positive
surprise from volumes. However, lower prices on the LME continue to hurt
realisations. Aluminium prices fell 5% to $1566.75 per metric tonne during the
quarter. We expect the weakness in aluminium prices to remain and retain our
neutral rating on the stock.
Economic and Political News
Gujarat mulls upgrading old power plants
Andhra Pradesh likely to set up medical devices park
Global gold demand rises 7.58% in Q3 to 1,121 tonnes: WGC
Corporate News
Indiabulls Housing Finance to acquire 40% in British bank
Tension at Essar Steel Paradip plant
Coal India invites global firms to set up washery in Jharkhand
Market Outlook
November 13, 2015
Top Picks ★★★★★
Large Cap
Market Cap
CMP
Target
Upside
Company
Rationale
(` Cr)
(`)
(`)
(%)
To outpace battery industry growth due to better technological
Amara Raja Batteries
15,287
895
1,040
16.2
products leading to market share gains in both the automotive
OEM and replacement segments.
Earnings to grow strongly given the MHCV cyclical upturn.
Ashok Leyland
25,755
91
111
22.7
Focus on exports and LCV's provides additional growth
avenue.
Healthy pace of branch expansion, backed by distribution
Axis Bank
114,185
480
630
31.1
network, will be the driving force for the bank’s retail business
and overall earnings.
The stock is trading at attractive valuations and is factoring all
HCL Tech
119,788
852
1,132
32.9
the bad news.
Strong visibility for a robust 20% earnings trajectory, coupled
HDFC Bank
265,392
1,054
1,262
19.8
with high quality of earnings on account of high quality retail
business and strategic focus on highly rated corporates.
Due to its robust franchise and capital adequacy position, the
bank is well positioned to grow by at least a few percentage
ICICI Bank
153,323
264
348
31.7
points higher than the average industry growth rate from a
structural point of view.
Back on the growth trend, expect a long term growth of 14%
Infosys
254,766
1,109
1,306
17.7
to be a US$20bn in FY2020.
Well positioned to benefit from such expected gradual
recovery in the overall domestic capex cycle, given its presence
Larsen & Toubro
127,175
1,367
1,646
20.5
across various infrastructure segments, its execution
capabilities, and its strong balance sheet.
LICHF continues to grow its retail loan book at a healthy pace
with improvement in asset quality. We expect the company to
LIC Housing Finance
23,666
469
571
21.7
post a healthy loan book which is likely to reflect in a strong
earnings growth.
Source: Company, Angel Research
Mid Cap
Market Cap
CMP
Target
Upside
Company
Rationale
(` Cr)
(`)
(`)
(%)
Government thrust on Renewable sector and strong order
Inox Wind
8,302
374
505
35.0
book would drive future growth.
Change in business focus towards high-margin chronic and
Ipca labs
9,196
729
900
23.5
lifestyle segments and increasing penetration in Europe and
US
Economic recovery to have favourable impact on advertising &
circulation revenue growth. Further, the acquisition of a radio
Jagran Prakashan
5,023
154
169
10.0
business (Radio City) would also boost the company's revenue
growth.
Strong brand & quality teaching with innovative technologies
MT Educare
549
138
169
22.6
& higher government educational spending to boost growth
Earnings boost on back of stable material prices and
Radico Khaitan
1,474
111
128
15.5
favourable pricing environment. Valuation discount to peers
provides additional comfort
Strong brands and distribution network would boost growth
Siyaram Silk Mills
869
928
1,145
23.5
going ahead. Stock currently trades at an inexpensive
valuation.
Structural shift in the Lighting industry towards LED lighting will
Surya Roshni
577
132
183
39.0
drive growth.
Source: Company, Angel Research
Market Outlook
November 13, 2015
Quarterly Bloomberg Brokers Consensus Estimate
Coal India Ltd (Consol.) - November 13, 2015
Particulars (` cr)
2QFY16E
2QFY15
y-o-y (%)
1QFY16
q-o-q (%)
Net sales
17,130
15,678
9.3
18,956
(9.6)
EBITDA
2,991
2,070
44.5
4,922
(39.2)
EBITDA margin (%)
17.5
13.2
26.0
Net profit
2,741
2,192
25.0
3,764
(27.2)
GMR Infrastructure Ltd (Consol.) - November 13, 2015
Particulars (` cr)
2QFY16E
2QFY15
y-o-y (%)
1QFY16
q-o-q (%)
Net sales
2,425
2,636
(8.0)
2,928
(17.2)
EBITDA
855
561
52.5
855
(0.0)
EBITDA margin (%)
35.3
21.3
29.2
Net profit
(482)
(796)
(39.4)
(410)
17.4
Market Outlook
November 13, 2015
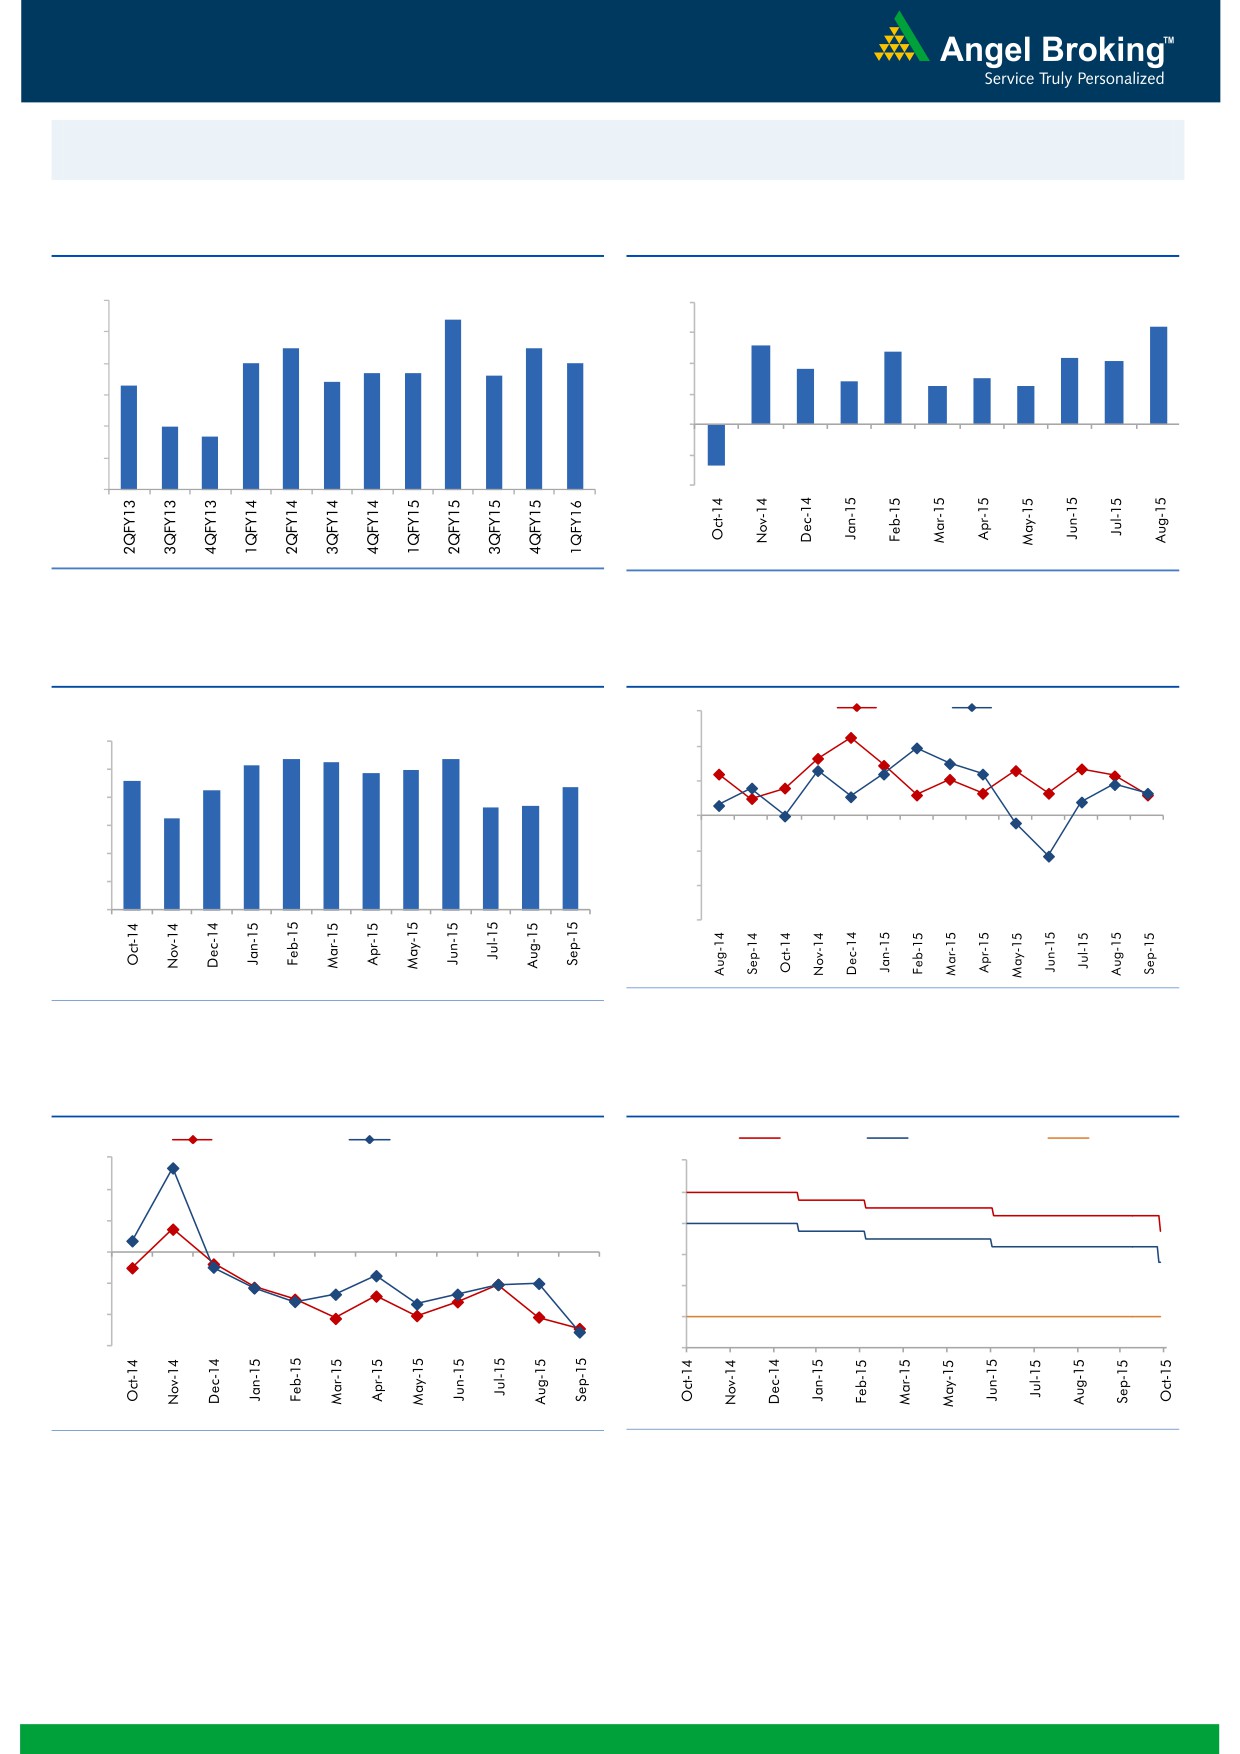
Macro watch
Exhibit 1: Quarterly GDP trends
Exhibit 2: IIP trends
(%)
(%)
9.0
8.4
8.0
6.4
7.5
7.5
5.2
8.0
6.0
4.8
7.0
7.0
4.4
4.1
6.7
6.7
3.6
7.0
6.4
6.6
4.0
2.8
3.0
6.3
2.5
2.5
6.0
2.0
5.0
4.7
5.0
-
4.0
(2.0)
3.0
(4.0)
(2.7)
Source: CSO, Angel Research
Source: MOSPI, Angel Research
Exhibit 3: Monthly CPI inflation trends
Exhibit 4: Manufacturing and services PMI
(%)
56.0
Mfg. PMI
Services PMI
6.0
5.4
5.3
5.4
54.0
5.2
5.0
4.9
4.6
5.0
4.3
4.4
52.0
3.7
3.7
4.0
3.3
50.0
3.0
2.0
48.0
1.0
46.0
-
44.0
Source: Market, Angel Research; Note: Level above 50 indicates expansion
Source: MOSPI, Angel Research
Exhibit 5: Exports and imports growth trends
Exhibit 6: Key policy rates
(%)
Exports yoy growth
Imports yoy growth
(%)
Repo rate
Reverse Repo rate
CRR
30.0
9.00
20.0
8.00
10.0
7.00
0.0
6.00
(10.0)
5.00
(20.0)
4.00
(30.0)
3.00
Source: Bloomberg, Angel Research
Source: RBI, Angel Research
Market Outlook
November 13, 2015
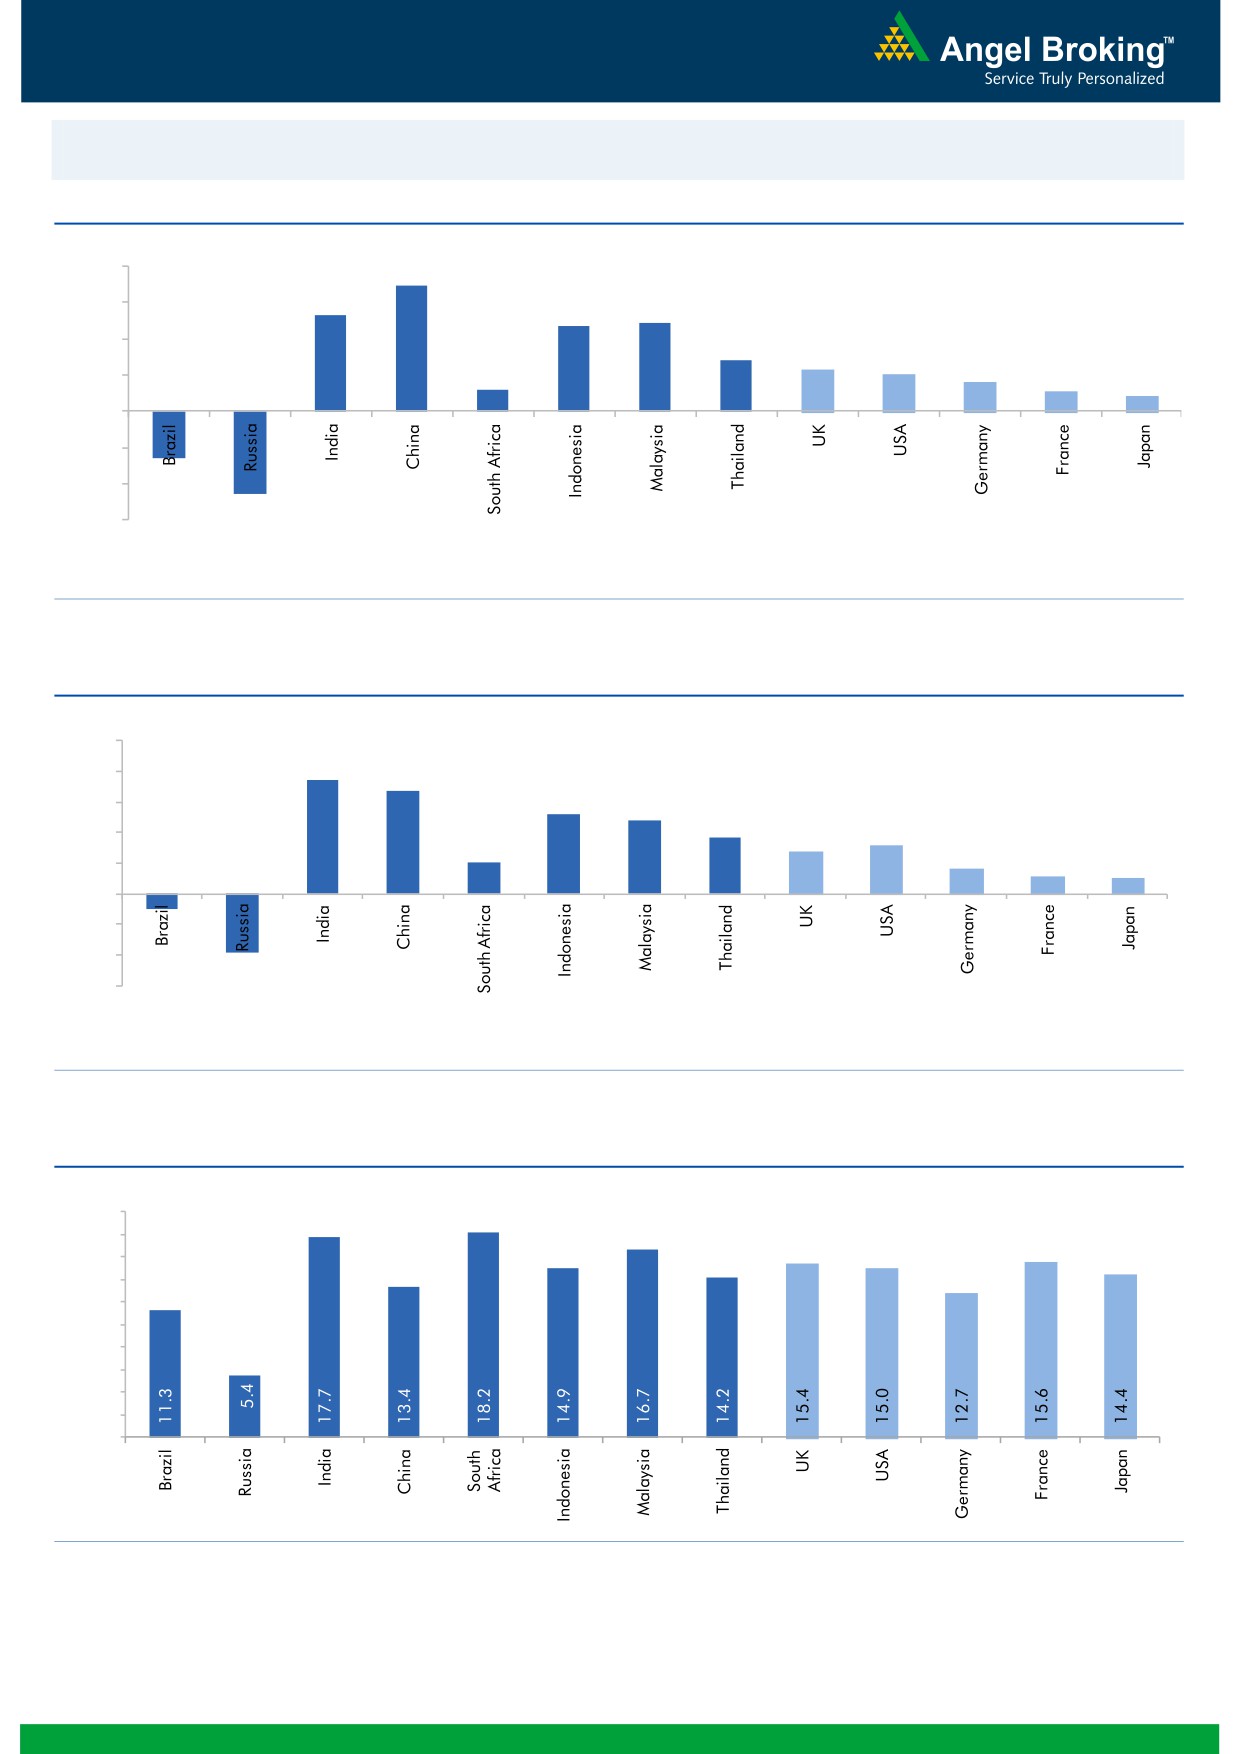
Global watch
Exhibit 1: Latest quarterly GDP Growth (%, yoy) across select developing and developed countries
(%)
8.0
6.9
5.3
6.0
4.9
4.7
4.0
2.8
2.3
2.0
1.6
2.0
1.2
1.1
0.8
(2.6)
-
(2.0)
(4.0)
(4.6)
(6.0)
Source: Bloomberg, Angel Research
Exhibit 2: 2015 GDP Growth projection by IMF (%, yoy) across select developing and developed countries
(%)
10.0
7.5
8.0
6.8
5.2
6.0
4.8
3.7
3.1
4.0
2.7
2.0
1.6
2.0
1.2
1.0
-
(2.0)
(4.0)
(1.0)
(3.8)
(6.0)
Source: IMF, Angel Research
Exhibit 3: One year forward P-E ratio across select developing and developed countries
(x)
20.0
18.0
16.0
14.0
12.0
10.0
8.0
6.0
4.0
2.0
-
Source: IMF, Angel Research
Market Outlook
November 13, 2015
Exhibit 4: Relative performance of indices across globe
Returns (%)
Country
Name of index
Closing price
1M
3M
1YR
Brazil
Bovespa
47,232
(0.5)
(2.3)
(9.4)
Russia
Micex
1,740
1.0
1.6
15.9
India
Nifty
7,825
(3.5)
(8.1)
(6.7)
China
Shanghai Composite
3,633
11.4
(8.4)
46.6
South Africa
Top 40
46,788
(1.7)
3.2
3.7
Mexico
Mexbol
44,121
0.1
0.9
1.7
Indonesia
LQ45
759
(1.4)
(2.2)
(12.3)
Malaysia
KLCI
1,663
(2.5)
4.2
(8.3)
Thailand
SET 50
890
(2.2)
(3.8)
(15.4)
USA
Dow Jones
17,448
3.1
(0.2)
(1.1)
UK
FTSE
6,179
(1.5)
(5.1)
(7.1)
Japan
Nikkei
19,698
8.0
(4.0)
12.6
Germany
DAX
10,783
8.5
(1.8)
16.5
France
CAC
4,857
5.4
(2.0)
15.6
Source: Bloomberg, Angel Research
Stock Watch
November 13, 2015
Company Name
Reco
CMP
Target
Mkt Cap
Sales ( Čcr )
OPM(%)
EPS (Č)
PER(x)
P/BV(x)
RoE(%)
EV/Sales(x)
(Č)
Price ( Č)
( Č cr )
FY16E FY17E
FY16E
FY17E
FY16E
FY17E
FY16E
FY17E
FY16E
FY17E
FY16E
FY17E
FY16E
FY17E
Agri / Agri Chemical
Rallis
Neutral
199
-
3,874
2,075
2,394
14.4
14.4
9.5
11.0
21.0
18.1
4.2
3.6
21.1
21.3
1.9
1.6
United Phosphorus
Buy
453
510
19,431
13,698
15,752
17.6
17.6
32.1
38.5
14.1
11.8
2.8
2.3
21.4
21.3
1.5
1.2
Auto & Auto Ancillary
Ashok Leyland
Buy
91
111
25,755
18,763
22,357
11.1
11.2
3.6
4.8
25.1
18.9
4.6
4.3
18.7
22.6
1.3
1.0
Bajaj Auto
Accumulate
2,451
2,672
70,925
24,115
27,600
21.3
21.0
136.8
157.2
17.9
15.6
5.8
4.9
32.2
31.5
2.5
2.1
Eicher Motors
Buy
16,049
22,900
43,562
11,809
15,609
15.5
17.0
362.9
567.0
44.2
28.3
13.4
10.0
30.1
35.0
4.0
3.0
Hero Motocorp
Neutral
2,644
-
52,805
28,561
31,559
14.7
14.7
151.1
163.2
17.5
16.2
6.8
5.8
38.7
35.6
1.7
1.5
L G Balakrishnan & Bros Neutral
464
-
728
1,254
1,394
11.6
11.8
35.9
41.7
12.9
11.1
1.8
1.5
13.5
13.8
0.7
0.6
Mahindra and Mahindra Accumulate
1,264
1,410
78,515
38,513
43,579
13.6
13.7
56.1
65.1
22.5
19.4
3.6
3.1
15.7
16.2
1.7
1.4
Maruti
Accumulate
4,747
4,960
143,382
57,865
68,104
16.4
16.7
176.3
225.5
26.9
21.1
5.2
4.5
19.4
21.2
2.1
1.8
Minda Industries
Accumulate
751
809
1,192
2,567
2,965
8.0
8.3
46.1
57.8
16.3
13.0
2.7
2.3
16.7
17.3
0.5
0.4
Rane Brake Lining
Accumulate
324
366
257
454
511
11.1
11.4
23.8
28.1
13.6
11.5
1.9
1.8
14.2
15.3
0.7
0.6
Setco Automotive
Neutral
206
-
551
594
741
12.7
13.7
8.4
15.8
24.6
13.1
2.6
2.2
10.4
16.9
1.4
1.2
Tata Motors
Accumulate
412
424
118,881
264,038
297,882
13.8
13.9
34.5
38.9
11.9
10.6
2.0
1.7
17.6
16.8
0.6
0.6
TVS Motor
Accumulate
297
313
14,110
11,845
14,040
7.2
9.0
10.4
17.4
28.6
17.1
7.1
5.5
25.1
32.0
1.1
0.9
Amara Raja Batteries
Buy
895
1,040
15,287
4,892
5,871
17.4
17.6
28.8
37.1
31.1
24.1
7.3
5.8
23.4
24.1
3.0
2.5
Exide Industries
Accumulate
144
162
12,206
6,950
7,784
14.4
14.8
6.6
7.3
21.8
19.7
2.8
2.5
12.6
12.8
1.5
1.3
Apollo Tyres
Accumulate
158
171
8,053
12,146
12,689
16.8
16.0
21.2
19.0
7.5
8.3
1.2
1.1
16.5
13.0
0.7
0.8
Ceat
Accumulate
986
1,119
3,989
6,041
6,597
14.1
13.7
99.5
111.9
9.9
8.8
2.0
1.6
19.6
18.5
0.8
0.7
JK Tyres
Neutral
94
-
2,137
7,446
7,669
15.2
14.0
19.6
18.4
4.8
5.1
1.2
1.0
25.2
19.5
0.7
0.6
Swaraj Engines
Neutral
942
-
1,169
552
630
14.2
14.7
44.6
54.1
21.1
17.4
4.9
4.5
23.2
25.6
2.0
1.7
Subros
Neutral
84
-
507
1,268
1,488
11.6
11.9
3.7
6.6
22.8
12.8
1.5
1.4
6.8
11.4
0.7
0.6
Indag Rubber
Neutral
198
-
520
283
329
17.0
17.2
13.0
15.4
15.3
12.9
3.3
2.8
21.8
21.6
1.6
1.3
Capital Goods
ACE
Neutral
44
-
435
660
839
4.7
8.2
1.0
3.9
44.0
11.3
1.4
1.2
3.2
11.3
0.8
0.6
BEML
Neutral
1,114
-
4,640
3,277
4,006
6.0
8.9
29.2
64.3
38.2
17.3
2.1
1.9
5.7
11.7
1.5
1.2
BGR Energy
Neutral
112
-
807
3,615
3,181
9.5
9.4
16.7
12.4
6.7
9.0
0.6
0.6
10.0
7.0
0.6
0.8
BHEL
Neutral
181
-
44,191
33,722
35,272
10.8
11.7
10.5
14.2
17.2
12.7
1.3
1.2
7.0
9.0
1.5
1.4
Blue Star
Accumulate
352
382
3,165
3,624
4,157
5.3
6.0
9.6
14.5
36.5
24.3
6.7
5.7
18.6
25.4
1.0
0.9
Crompton Greaves
Buy
169
204
10,608
13,484
14,687
4.9
6.2
4.5
7.1
37.6
23.8
2.7
2.5
7.2
10.8
0.9
0.8
Inox Wind
Buy
374
505
8,302
4,980
5,943
17.0
17.5
26.6
31.6
14.1
11.8
4.2
3.1
35.0
30.0
1.9
1.5
Stock Watch
November 13, 2015
Company Name
Reco
CMP
Target
Mkt Cap
Sales ( Čcr )
OPM(%)
EPS (Č)
PER(x)
P/BV(x)
RoE(%)
EV/Sales(x)
(Č)
Price ( Č)
( Č cr )
FY16E
FY17E
FY16E
FY17E
FY16E
FY17E
FY16E
FY17E
FY16E
FY17E
FY16E
FY17E
FY16E
FY17E
Capital Goods
KEC International
Neutral
139
-
3,567
8,791
9,716
6.1
6.8
5.4
8.2
25.7
16.9
2.6
2.4
10.0
14.0
0.6
0.6
Thermax
Neutral
864
-
10,292
6,413
7,525
7.4
8.5
30.5
39.3
28.3
22.0
4.4
3.8
15.0
17.0
1.6
1.3
Cement
ACC
Buy
1,332
1,630
25,007
13,151
14,757
16.4
18.3
63.9
83.4
20.8
16.0
2.7
2.5
13.3
16.1
1.8
1.5
Ambuja Cements
Accumulate
198
233
30,697
11,564
12,556
19.4
20.7
8.9
10.1
22.2
19.6
2.8
2.6
12.8
13.8
2.4
2.2
India Cements
Buy
79
112
2,414
4,216
4,840
18.0
19.5
4.0
9.9
19.7
7.9
0.8
0.7
4.0
9.5
0.9
0.7
JK Cement
Accumulate
650
744
4,546
3,661
4,742
10.1
15.8
18.0
61.0
36.1
10.7
2.6
2.3
7.5
22.9
1.7
1.3
J K Lakshmi Cement
Buy
363
430
4,276
2,947
3,616
16.7
19.9
11.5
27.2
31.6
13.4
3.0
2.6
9.8
20.8
1.8
1.5
Mangalam Cements
Neutral
206
-
551
1,053
1,347
10.5
13.3
8.4
26.0
24.6
7.9
1.0
1.0
4.3
12.5
0.9
0.7
Orient Cement
Accumulate
166
183
3,404
1,854
2,524
21.2
22.2
7.7
11.1
21.6
15.0
3.1
2.7
13.3
15.7
2.6
1.8
Ramco Cements
Neutral
371
-
8,822
4,036
4,545
20.8
21.3
15.1
18.8
24.5
19.7
3.0
2.7
12.9
14.3
2.7
2.3
Shree Cement^
Neutral
11,794
-
41,087
7,150
8,742
26.7
28.6
228.0
345.5
51.7
34.1
7.6
6.4
15.7
20.3
5.6
4.5
UltraTech Cement
Buy
2,720
3,282
74,634
25,021
30,023
19.1
21.6
89.0
132.0
30.6
20.6
3.5
3.1
12.2
15.9
3.2
2.7
Construction
ITNL
Neutral
91
-
2,990
7,360
8,825
34.0
35.9
1.0
5.0
90.9
18.2
0.4
0.4
0.3
1.4
3.8
3.7
KNR Constructions
Neutral
569
-
1,599
915
1,479
14.3
13.9
20.3
37.2
28.0
15.3
2.6
2.2
9.6
15.6
1.9
1.2
Larsen & Toubro
Buy
1,367
1,646
127,175
64,148
73,241
11.5
11.7
62.0
66.0
22.0
20.7
2.3
2.1
13.4
14.0
2.2
1.9
Gujarat Pipavav Port
Neutral
165
-
7,989
629
684
51.0
52.2
6.4
5.9
25.8
28.0
3.4
3.1
15.9
12.7
12.2
11.0
MBL Infrastructures
Buy
214
285
888
2,313
2,797
12.2
14.6
19.0
20.0
11.3
10.7
1.2
1.1
11.3
10.6
1.1
1.0
Nagarjuna Const.
Neutral
77
-
4,303
7,892
8,842
8.3
9.1
2.4
5.3
32.3
14.6
1.3
1.2
4.2
8.6
0.8
0.7
PNC Infratech
Neutral
533
-
2,733
1,798
2,132
13.2
13.5
22.0
30.0
24.2
17.8
2.2
2.0
11.5
11.4
1.6
1.3
Simplex Infra
Neutral
326
-
1,613
6,241
7,008
10.4
10.7
20.0
36.0
16.3
9.1
1.3
1.2
6.8
11.1
0.8
0.6
Financials
Allahabad Bank
Neutral
77
-
4,621
8,332
9,259
2.8
2.8
21.0
25.6
3.7
3.0
0.4
0.3
9.8
10.9
-
-
Axis Bank
Buy
480
630
114,185
26,473
31,527
3.5
3.6
35.7
43.5
13.4
11.0
2.6
2.3
17.9
18.9
-
-
Bank of Baroda
Neutral
174
-
40,046
19,105
21,474
2.0
2.0
19.1
24.8
9.1
7.0
0.9
0.8
10.2
12.1
-
-
Bank of India
Neutral
133
-
10,493
15,972
17,271
1.9
2.0
15.3
33.4
8.7
4.0
0.4
0.3
3.6
7.6
-
-
Canara Bank
Neutral
274
-
14,902
15,251
16,725
2.0
2.0
59.3
68.6
4.6
4.0
0.5
0.4
10.1
10.7
-
-
Dena Bank
Neutral
42
-
2,351
3,440
3,840
2.1
2.3
7.3
10.0
5.8
4.2
0.4
0.4
6.1
7.9
-
-
Federal Bank
Neutral
54
-
9,277
3,477
3,999
3.0
3.0
5.0
6.2
10.8
8.7
1.1
1.0
10.6
11.9
-
-
HDFC
Neutral
1,178
-
185,851
10,358
11,852
3.3
3.3
41.1
47.0
28.7
25.0
5.5
5.0
24.7
24.9
-
-
HDFC Bank
Buy
1,054
1,262
265,392
38,309
47,302
4.3
4.3
49.3
61.1
21.4
17.3
3.7
3.2
18.5
19.7
-
-
Stock Watch
November 13, 2015
Company Name
Reco
CMP
Target
Mkt Cap
Sales ( Čcr )
OPM(%)
EPS (Č)
PER(x)
P/BV(x)
RoE(%)
EV/Sales(x)
(Č)
Price ( Č)
( Č cr )
FY16E
FY17E
FY16E
FY17E
FY16E
FY17E
FY16E
FY17E
FY16E
FY17E
FY16E
FY17E
FY16E
FY17E
Financials
ICICI Bank
Buy
264
348
153,323
35,168
40,517
3.4
3.4
21.4
25.2
12.3
10.5
2.1
1.8
14.7
15.2
-
-
IDBI Bank
Neutral
89
-
14,219
9,625
10,455
1.8
1.8
8.5
14.2
10.4
6.2
0.6
0.6
5.9
9.3
-
-
Indian Bank
Neutral
128
-
6,124
6,160
6,858
2.5
2.5
24.5
29.8
5.2
4.3
0.4
0.4
7.7
8.6
-
-
LIC Housing Finance
Buy
469
571
23,666
3,101
3,745
2.5
2.5
33.0
40.2
14.2
11.7
2.7
2.3
19.7
20.5
-
-
Oriental Bank
Neutral
149
-
4,468
7,643
8,373
2.4
2.4
37.2
45.4
4.0
3.3
0.4
0.3
8.2
9.4
-
-
Punjab Natl.Bank
Neutral
134
-
26,381
23,638
26,557
2.8
2.8
17.9
27.2
7.5
4.9
0.8
0.6
8.5
12.0
-
-
South Ind.Bank
Neutral
20
-
2,761
1,965
2,185
2.5
2.5
2.5
3.3
8.2
6.2
0.8
0.7
9.5
11.7
-
-
St Bk of India
Buy
243
283
188,830
82,520
93,299
2.7
2.8
20.0
24.5
12.1
9.9
1.3
1.2
11.5
12.8
-
-
Union Bank
Neutral
162
-
11,116
12,646
14,129
2.3
2.4
31.0
39.1
5.2
4.1
0.6
0.5
9.8
11.4
-
-
Vijaya Bank
Neutral
34
-
2,930
3,536
3,827
1.9
1.9
5.5
6.7
6.2
5.1
0.5
0.5
7.8
8.8
-
-
Yes Bank
Buy
757
914
31,688
7,228
9,043
3.2
3.3
57.7
69.4
13.1
10.9
2.3
2.0
19.1
19.6
-
-
FMCG
Asian Paints
Neutral
806
-
77,302
16,553
19,160
16.0
16.2
17.7
21.5
45.6
37.5
12.1
10.9
29.4
31.2
4.5
3.9
Britannia
Neutral
3,046
-
36,550
8,065
9,395
9.6
10.2
47.2
65.5
64.5
46.5
21.5
20.3
38.3
41.2
4.6
3.9
Colgate
Neutral
961
-
26,150
4,836
5,490
19.5
19.7
48.5
53.2
19.8
18.1
14.5
12.7
99.8
97.5
5.2
4.6
Dabur India
Neutral
267
-
46,828
9,370
10,265
17.1
17.2
7.3
8.1
36.3
32.9
11.0
8.9
33.7
30.6
4.9
4.5
GlaxoSmith Con*
Neutral
5,986
-
25,174
4,919
5,742
17.2
17.4
168.3
191.2
35.6
31.3
10.1
8.6
28.8
28.9
4.6
3.9
Godrej Consumer
Neutral
1,325
-
45,110
10,168
12,886
16.1
16.1
32.1
38.4
41.3
34.5
8.4
7.8
19.7
21.0
4.3
3.4
HUL
Neutral
806
-
174,375
34,940
38,957
17.5
17.7
20.8
24.7
38.7
32.6
43.1
34.4
110.5
114.2
4.8
4.3
ITC
Buy
335
409
268,888
41,068
45,068
37.8
37.4
13.9
15.9
24.1
21.1
8.1
7.1
34.1
33.8
6.2
5.6
Marico
Neutral
410
-
26,429
6,551
7,766
15.7
16.0
10.4
12.5
39.5
32.8
11.5
9.5
33.2
32.4
3.9
3.3
Nestle*
Accumulate
6,163
6,646
59,424
11,291
12,847
22.2
22.3
158.9
184.6
38.8
33.4
20.3
18.2
55.0
57.3
5.1
4.5
Tata Global
Accumulate
128
144
8,069
8,635
9,072
9.8
9.9
6.5
7.6
19.7
16.8
2.0
1.9
6.8
7.4
0.9
0.8
IT
HCL Tech^
Buy
852
1,132
119,788
42,038
47,503
23.2
23.5
55.8
62.9
15.3
13.5
3.5
2.7
23.0
19.8
2.5
2.0
Infosys
Buy
1,109
1,306
254,766
60,250
66,999
28.0
28.0
58.3
63.7
19.0
17.4
4.0
3.4
20.9
19.7
3.6
3.1
TCS
Buy
2,471
3,165
486,804
111,274
126,852
28.4
28.7
125.4
143.9
19.7
17.2
7.8
7.2
39.9
42.2
4.0
3.5
Tech Mahindra
Buy
526
646
50,569
25,566
28,890
16.0
17.0
26.3
31.9
20.0
16.5
3.6
3.1
17.9
18.6
1.8
1.5
Wipro
Buy
557
719
137,660
52,414
58,704
23.7
23.8
38.4
42.3
14.5
13.2
2.8
2.5
19.5
18.0
2.3
1.9
Media
D B Corp
Accumulate
326
356
5,983
2,241
2,495
27.8
27.9
21.8
25.6
15.0
12.7
3.9
3.5
26.7
28.5
2.5
2.2
HT Media
Neutral
77
-
1,801
2,495
2,603
11.2
11.2
7.3
8.6
10.6
9.0
0.8
0.8
7.4
8.1
0.2
0.2
Stock Watch
November 13, 2015
Company Name
Reco
CMP
Target
Mkt Cap
Sales ( Čcr )
OPM(%)
EPS (Č)
PER(x)
P/BV(x)
RoE(%)
EV/Sales(x)
(Č)
Price ( Č)
( Č cr )
FY16E FY17E
FY16E
FY17E
FY16E
FY17E
FY16E
FY17E
FY16E
FY17E
FY16E
FY17E
FY16E
FY17E
Media
Jagran Prakashan
Buy
154
169
5,023
2,170
2,355
27.0
27.6
12.8
10.3
12.0
15.0
3.3
3.1
21.8
19.4
1.9
1.6
Sun TV Network
Neutral
376
-
14,798
2,779
3,196
70.2
70.5
22.8
27.3
16.5
13.8
4.1
3.7
26.7
28.3
5.2
4.5
Hindustan Media
Neutral
278
-
2,041
920
1,031
20.0
20.0
19.2
20.9
14.5
13.3
2.4
2.0
16.4
15.3
1.7
1.5
Ventures
Metals & Mining
Coal India
Buy
329
400
207,872
77,508
85,330
21.4
23.7
24.8
27.6
13.3
11.9
5.1
4.8
38.6
41.6
2.1
1.8
Hind. Zinc
Accumulate
146
175
61,838
14,641
14,026
50.4
50.4
17.7
16.0
8.3
9.2
1.3
1.2
16.2
13.2
2.1
1.9
Hindalco
Neutral
80
-
16,572
104,356
111,186
8.7
9.5
6.7
11.1
11.9
7.3
0.4
0.4
3.5
5.9
0.7
0.6
JSW Steel
Neutral
879
-
21,249
42,308
45,147
16.4
20.7
(10.3)
49.5
17.8
1.0
0.9
(1.0)
5.6
1.5
1.4
NMDC
Neutral
92
-
36,634
8,237
10,893
46.6
44.5
10.0
11.7
9.3
7.9
1.0
0.9
12.5
13.0
4.3
3.3
SAIL
Neutral
46
-
18,875
45,915
53,954
7.2
10.5
1.5
4.4
30.3
10.4
0.4
0.4
2.3
4.1
1.1
1.0
Vedanta
Neutral
91
-
27,008
71,445
81,910
26.2
26.3
12.9
19.2
7.1
4.8
0.5
0.4
7.2
8.9
0.8
0.6
Tata Steel
Neutral
221
-
21,449
126,760
137,307
8.9
11.3
6.4
23.1
34.7
9.6
0.7
0.7
2.0
7.1
0.8
0.7
Oil & Gas
Cairn India
Neutral
138
-
25,939
11,323
12,490
49.4
51.0
20.7
20.7
6.7
6.7
0.4
0.4
6.4
6.1
1.6
0.9
GAIL
Neutral
281
-
35,651
64,856
70,933
9.1
9.6
24.0
28.9
11.7
9.7
1.0
0.9
8.8
9.6
0.8
0.7
ONGC
Neutral
237
-
202,337
154,564
167,321
36.8
37.4
28.6
32.5
8.3
7.3
1.1
1.0
12.7
13.5
1.6
1.5
Petronet LNG
Neutral
204
-
15,326
29,691
31,188
5.8
6.2
12.8
13.4
16.0
15.2
2.4
2.1
15.8
14.8
0.6
0.5
Indian Oil Corp
Accumulate
409
455
99,194
359,607
402,760
5.9
6.1
42.5
48.7
9.6
8.4
1.3
1.1
14.1
14.4
0.4
0.3
Reliance Industries
Accumulate
929
1,050
300,834
304,775
344,392
12.6
13.4
91.3
102.6
10.2
9.1
1.1
1.0
11.8
12.0
0.9
0.8
Pharmaceuticals
Alembic Pharma
Neutral
672
-
12,668
2,658
3,112
24.1
20.2
24.6
23.9
27.3
28.1
9.8
7.5
42.5
30.2
4.8
4.0
Aurobindo Pharma
Accumulate
837
872
48,904
14,923
17,162
23.0
23.0
38.2
43.6
21.9
19.2
6.8
5.1
36.0
30.2
3.6
3.0
Aventis*
Neutral
4,612
-
10,622
2,082
2,371
17.4
20.8
118.2
151.5
39.0
30.4
5.7
4.6
19.9
25.5
4.4
3.7
Cadila Healthcare
Neutral
417
-
42,721
10,224
11,840
21.0
22.0
14.6
17.6
28.6
23.7
7.8
6.1
30.8
29.0
4.4
3.7
Cipla
Neutral
643
-
51,624
14,211
16,611
20.6
19.0
27.0
28.9
23.8
22.2
4.0
3.5
18.4
16.8
3.7
3.1
Dr Reddy's
Neutral
3,355
-
57,207
18,213
21,214
22.6
22.7
163.0
192.5
20.6
17.4
4.2
3.5
22.5
20.0
3.9
3.3
Dishman Pharma
Neutral
396
-
3,197
1,716
1,888
20.2
20.2
16.3
21.6
24.3
18.3
2.3
2.0
9.7
11.7
2.1
1.7
GSK Pharma*
Neutral
3,163
-
26,787
2,870
3,158
20.0
22.1
59.5
68.3
53.2
46.3
15.7
16.1
28.5
34.3
8.9
8.2
Indoco Remedies
Neutral
305
-
2,812
1,033
1,199
15.9
18.2
9.4
13.6
32.5
22.4
4.8
4.1
15.7
19.7
2.9
2.5
Ipca labs
Buy
729
900
9,196
3,363
3,909
12.9
18.6
13.4
28.0
54.4
26.0
7.1
5.7
7.4
14.0
3.0
2.6
Lupin
Neutral
1,801
-
81,059
13,092
16,561
25.0
27.0
50.4
68.3
35.7
26.4
7.4
5.8
22.8
24.7
6.0
4.7
Sun Pharma
Buy
747
950
179,652
28,163
32,610
25.8
30.7
17.4
26.9
42.9
27.8
4.1
3.5
13.0
16.6
6.4
5.3
Stock Watch
November 13, 2015
Company Name
Reco
CMP
Target
Mkt Cap
Sales ( Čcr )
OPM(%)
EPS (Č)
PER(x)
P/BV(x)
RoE(%)
EV/Sales(x)
(Č)
Price ( Č)
( Č cr )
FY16E FY17E
FY16E
FY17E
FY16E
FY17E
FY16E
FY17E
FY16E
FY17E
FY16E
FY17E
FY16E
FY17E
Power
Tata Power
Neutral
68
-
18,500
35,923
37,402
22.6
22.8
4.1
5.2
16.9
13.3
1.3
1.2
7.5
9.3
1.5
1.3
NTPC
Buy
132
157
108,634
87,064
98,846
23.5
23.5
11.7
13.2
11.3
10.0
1.3
1.2
11.4
12.1
2.3
2.1
Power Grid
Buy
129
170
67,566
20,702
23,361
86.7
86.4
12.1
13.2
10.7
9.8
1.6
1.4
15.6
15.1
8.2
7.7
Telecom
Bharti Airtel
Neutral
331
-
132,354
101,748
109,191
32.1
31.7
12.0
12.5
27.6
26.5
1.9
1.8
6.9
6.7
2.0
1.8
Idea Cellular
Neutral
131
-
47,299
34,282
36,941
32.0
31.5
5.9
6.2
22.3
21.2
2.0
1.9
9.9
9.3
2.0
1.9
zOthers
Abbott India
Neutral
5,099
-
10,835
2,715
3,153
14.5
14.1
134.3
152.2
38.0
33.5
9.5
7.8
27.4
25.6
4.0
3.4
Bajaj Electricals
Buy
235
341
2,367
4,719
5,287
5.2
5.8
8.6
12.7
27.4
18.5
3.1
2.8
11.4
14.8
0.5
0.5
Finolex Cables
Neutral
243
-
3,719
2,728
3,036
10.8
11.0
14.4
16.8
16.9
14.5
2.6
2.2
15.2
15.3
1.1
0.9
Goodyear India*
Accumulate
569
622
1,313
1,888
1,680
12.1
11.9
62.2
56.6
9.2
10.1
2.1
1.8
25.9
19.7
0.5
0.5
Hitachi
Neutral
1,369
-
3,722
1,779
2,081
7.8
8.8
21.8
33.4
62.8
40.9
10.1
8.2
17.4
22.1
2.1
1.8
Jyothy Laboratories
Neutral
302
-
5,461
1,620
1,847
11.5
11.5
7.3
8.5
41.4
35.6
5.3
5.0
13.3
14.4
3.3
2.8
MRF
Buy
38,222
45,575
16,211
20,316
14,488
21.4
21.1
5,488.0
3,798.0
7.0
10.1
2.4
1.9
41.1
21.2
0.8
1.0
Page Industries
Neutral
12,545
-
13,992
1,929
2,450
19.8
20.1
229.9
299.0
54.6
42.0
24.1
16.7
52.1
47.1
7.9
6.2
Relaxo Footwears
Neutral
519
-
6,233
1,767
2,152
12.3
12.5
19.3
25.1
27.0
20.7
6.6
5.1
27.7
27.8
3.6
2.9
Siyaram Silk Mills
Buy
928
1,145
869
1,636
1,815
11.5
11.5
89.9
104.1
10.3
8.9
1.7
1.5
17.9
17.8
0.7
0.6
Styrolution ABS India*
Neutral
732
-
1,288
1,271
1,440
8.6
9.2
32.0
41.1
22.9
17.8
2.3
2.1
10.7
12.4
1.0
0.9
Tree House
Buy
249
314
1,055
256
315
57.2
57.5
16.5
21.0
15.1
11.9
1.5
1.3
9.6
10.9
4.6
3.8
TVS Srichakra
Buy
2,766
3,210
2,118
2,127
2,388
15.2
14.9
237.7
267.5
11.6
10.3
5.0
3.5
51.7
39.8
1.1
0.9
HSIL
Accumulate
297
302
2,144
2,123
2,384
16.1
16.5
15.0
18.9
19.7
15.7
1.5
1.4
8.0
9.4
1.3
1.1
Kirloskar Engines India
Neutral
263
-
3,810
2,634
3,252
10.1
12.0
10.9
17.4
24.2
15.1
2.7
2.4
11.4
16.8
1.1
0.8
Ltd
M M Forgings
Buy
515
670
622
541
634
21.7
21.4
47.8
55.9
10.8
9.2
2.1
1.8
21.8
20.9
1.3
1.1
Banco Products (India)
Neutral
130
-
933
1,208
1,353
11.0
12.3
10.8
14.5
12.1
9.0
1.4
1.2
11.9
14.5
0.7
0.6
Competent Automobiles Neutral
145
-
89
1,007
1,114
3.1
3.1
23.7
28.2
6.1
5.1
0.9
0.8
13.9
14.6
0.1
0.1
Nilkamal
Neutral
1,001
-
1,494
1,910
2,083
10.5
10.3
63.3
69.2
15.8
14.5
2.6
2.2
17.6
16.5
0.9
0.8
Visaka Industries
Buy
132
166
209
1,158
1,272
8.6
9.5
23.7
32.7
5.6
4.0
0.6
0.5
10.1
12.5
0.3
0.3
Transport Corporation of
Neutral
285
-
2,170
2,830
3,350
8.8
9.0
14.4
18.3
19.9
15.6
3.1
2.7
15.4
17.1
0.9
0.7
India
Elecon Engineering
Accumulate
75
85
819
1,369
1,533
13.7
14.9
3.3
6.1
22.7
12.4
1.5
1.4
6.6
11.4
1.0
0.9
Surya Roshni
Buy
132
183
577
2,992
3,223
8.1
8.4
14.7
18.3
9.0
7.2
0.8
0.8
9.7
11.0
0.5
0.4
MT Educare
Buy
138
169
549
286
366
18.3
17.7
7.7
9.4
17.9
14.7
3.8
3.3
20.2
21.1
1.8
1.4
Stock Watch
November 13, 2015
Company Name
Reco
CMP
Target Mkt Cap
Sales ( Čcr )
OPM(%)
EPS (Č)
PER(x)
P/BV(x)
RoE(%)
EV/Sales(x)
(Č)
Price ( Č)
( Č cr )
FY16E FY17E FY16E FY17E FY16E FY17E FY16E FY17E FY16E FY17E FY16E FY17E FY16E FY17E
zOthers
Radico Khaitan
Buy
111
128
1,474
1,565
1,687
12.2
13.0
5.7
7.1
19.4
15.6
1.6
1.5
8.3
9.6
1.4
1.2
Garware Wall Ropes
Buy
356
423
778
861
967
10.9
10.9
24.0
28.2
14.8
12.6
2.2
1.9
14.6
14.9
0.9
0.8
Wonderla Holidays
Neutral
342
-
1,932
206
308
44.0
43.6
9.0
12.9
38.0
26.5
5.2
4.7
13.7
17.8
9.0
6.0
Linc Pen & Plastics
Accumulate
165
185
244
340
371
8.3
8.9
10.8
13.2
15.3
12.5
2.4
2.1
16.0
17.1
0.8
0.7
The Byke Hospitality
Buy
164
181
658
222
287
20.5
20.5
5.6
7.6
29.1
21.7
5.5
4.5
18.9
20.8
2.8
2.2
Source: Company, Angel Research; Note: *December year end; #September year end; &October year end; Price as on November 11, 2015
Market Outlook
November 13, 2015
Research Team Tel: 022 - 39357800
DISCLAIMER
Angel Broking Private Limited (hereinafter referred to as “Angel”) is a registered Member of National Stock Exchange of India Limited,
Bombay Stock Exchange Limited and Metropolitian Stock Exchange of India Limited. It is also registered as a Depository Participant with
CDSL and Portfolio Manager with SEBI. It also has registration with AMFI as a Mutual Fund Distributor. Angel Broking Private Limited is a
registered entity with SEBI for Research Analyst in terms of SEBI (Research Analyst) Regulations, 2014 vide registration number
INH000000164. Angel or its associates has not been debarred/ suspended by SEBI or any other regulatory authority for accessing
/dealing in securities Market. Angel or its associates including its relatives/analyst do not hold any financial interest/beneficial ownership
of more than 1% in the company covered by Analyst. Angel or its associates/analyst has not received any compensation / managed or co
-managed public offering of securities of the company covered by Analyst during the past twelve months. Angel/analyst has not served as
an officer, director or employee of company covered by Analyst and has not been engaged in market making activity of the company
covered by Analyst.
This document is solely for the personal information of the recipient, and must not be singularly used as the basis of any investment
decision. Nothing in this document should be construed as investment or financial advice. Each recipient of this document should make
such investigations as they deem necessary to arrive at an independent evaluation of an investment in the securities of the companies
referred to in this document (including the merits and risks involved), and should consult their own advisors to determine the merits and
risks of such an investment.
Reports based on technical and derivative analysis center on studying charts of a stock's price movement, outstanding positions and
trading volume, as opposed to focusing on a company's fundamentals and, as such, may not match with a report on a company's
fundamentals.
The information in this document has been printed on the basis of publicly available information, internal data and other reliable sources
believed to be true, but we do not represent that it is accurate or complete and it should not be relied on as such, as this document is for
general guidance only. Angel Broking Pvt. Limited or any of its affiliates/ group companies shall not be in any way responsible for any
loss or damage that may arise to any person from any inadvertent error in the information contained in this report. Angel Broking Pvt.
Limited has not independently verified all the information contained within this document. Accordingly, we cannot testify, nor make any
representation or warranty, express or implied, to the accuracy, contents or data contained within this document. While Angel Broking
Pvt. Limited endeavors to update on a reasonable basis the information discussed in this material, there may be regulatory, compliance,
or other reasons that prevent us from doing so.
This document is being supplied to you solely for your information, and its contents, information or data may not be reproduced,
redistributed or passed on, directly or indirectly.
Neither Angel Broking Pvt. Limited, nor its directors, employees or affiliates shall be liable for any loss or damage that may arise from or
in connection with the use of this information.
Note: Please refer to the important ‘Stock Holding Disclosure' report on the Angel website (Research Section). Also, please refer to the
latest update on respective stocks for the disclosure status in respect of those stocks. Angel Broking Pvt. Limited and its affiliates may have
investment positions in the stocks recommended in this report.