Market Outlook
July 13, 2016
Market Cues
Domestic Indices
Chg (%)
(Pts)
(Close)
Indian markets are expected to open flat tracking SGX Nifty.
BSE Sensex
0.7
181
27,808
Nifty
0.6
53
8,521
US stock hit another milestone as the Dow Jones industrial average closed at a
record high, a day after the Standard & Poor's 500 index did. The optimism about
Mid Cap
0.5
59
12,117
stimulus from Japan and China and expectations of interest rate cut by Bank of
Small Cap
0.1
10
12,081
England generated buying interest.
Bankex
1.6
341
21,402
European shares rose for fourth straight day on Tuesday where the pan-European
STOXX Europe 600 index and the similar FTS Euro first 300 index both rose 1.1%.
Global Indices
Chg (%)
(Pts)
(Close)
Autos and banks were among the top gainers, up 3.8% and 3.3% respectively.
Dow Jones
0.7
121
18,348
Indian markets gained for second consecutive day on the back of encouraging U.S.
Nasdaq
0.7
34
5,023
data and expectations of further monetary stimulus from global policymakers.
FTSE
(0.0)
(2)
6,681
News Analysis
Nikkei
2.5
387
16,096
IDFC Bank to expand reach with acquisition of Grama Vidiyal Micro Finance
Hang Seng
1.6
344
21,225
Detailed analysis on Pg2
Shanghai Com
1.8
54
3,049
Investor’s Ready Reckoner
Advances / Declines
BSE
NSE
Key Domestic & Global Indicators
Advances
1,236
735
Stock Watch: Latest investment recommendations on 150+ stocks
Refer Pg6 onwards
Declines
1,534
882
Unchanged
175
65
Top Picks
CMP
Target
Upside
Company
Sector
Rating
(`)
(`)
(%)
Volumes (` Cr)
Amara Raja
Auto/Auto Ancillary
Buy
861
1,076
25.0
BSE
3,310
HCL Tech
IT
Buy
719
1,000
39.0
NSE
19,861
LIC Housing
Financials
Accumulate
521
592
13.6
Bharat Electronics
Capital Goods
Accumulate
1,262
1,414
12.1
Net Inflows (` Cr)
Net
Mtd
Ytd
Navkar Corporation Others
Buy
211
265
25.5
FII
1,073
1,455
20,999
More Top Picks on Pg4
MFs
(286)
(92)
9,252
Key Upcoming Events
Previous
Consensus
Date
Region
Event Description
Reading
Expectations
Top Gainers
Price (`)
Chg (%)
July 13 India
Imports YoY%
(13.2)
--
Unitech
8
13.8
July 13 China
Exports YoY%
(4.1)
(5.0)
Nationalum
50
13.3
July 13 India
Exports YoY%
(0.8)
--
Cairn
163
8.3
June 14 US
Initial Jobless claims
254.0
265.0
6.(
Jindalstel
74
8.2
More Events on Pg5
Vedl
160
7.3
Top Losers
Price (`)
Chg (%)
Aloktext
4
(5.0)
Kpit
145
(2.5)
Bergepaint
313
(2.4)
Ajantpharm
1,604
(2.4)
Bfutilitie
548
(2.4)
As on July 12, 2016
Market Outlook
July 13, 2016
IDFC Bank to expand reach with acquisition of Grama Vidiyal
Micro Finance
IDFC bank has announced that it has signed a share purchase agreement to
acquire 100% of Grama Vidiyal Micro Finance Ltd (GVMFL), which is one of the
largest microfinance institutions in India. Upon completion of the acquisition,
GVMFL will be a wholly owned subsidiary of the company. The company in the
announcement however did not disclose the value of the transaction.
The acquisition will give IDFC bank immediate access to 1.2mn rural and semi
urban households and it operates from 319 locations across 65 districts of Tamil
Nadu, Kerala Karnataka, Puducherry, Maharashtra, Gujarat, and Madhya
Pradesh. GVMFL’s assets under management were `1,502 crore as on March 31.
As of the FY2016 ended quarter, IDFC Bank’s advances stood at `45,699 crore,
higher than `43,440 crore as on 31 December 2015. About 95% of these loans
were from large firms and the remaining from smaller firms and retail customers.
The bank’s deposit base as on 31 March stood at `8,219 crore, of which
about `200 crore worth of deposits came from its retail customers.
Economic and Political News
Industrial production growth rises 1.2 per cent in May after a slowdown.
Government invites bits from Merchant bankers for HUDCO stake sell.
All ministry to old road shows for discovered small field.
Sizable dip Indian black money parked abroad, said by Arun Jaitley.
Corporate News
KKR commits to invest `520crore in dairy company Kwality Ltd.
Lenders by the State Bank of India are looking to recover loans worth `20,000
crore given to Alok Industries by restructuring them.
Cairn India seeks $5.6 billion compensation from Indian for retrospective
demand
Market Outlook
July 13, 2016
Quarterly Bloomberg Brokers Consensus Estimate
Tata Consultancy Services Ltd Consol - July 14, 2016
Particulars (` cr)
1QFY17E
1QFY16
y-o-y (%)
4QFY16
q-o-q (%)
Net sales
29,284
25,668
14.1
28,449
2.9
EBITDA
7,723
7,202
7.2
7,887
(2.1)
EBITDA margin (%)
26.4
28.1
27.7
Net profit
6,056
5,684
6.5
6,413
(5.6)
LIC Housing Finance Ltd - July 15, 2016
Particulars (` cr)
1QFY17E
1QFY16
y-o-y (%)
4QFY16
q-o-q (%)
PAT
460
382
20.3
448
2.6
Reliance Industries Ltd - July 15, 2016
Particulars (` cr)
1QFY17E
1QFY16
y-o-y (%)
4QFY16
q-o-q (%)
Net sales
57,274
65,817
(13.0)
49,957
14.6
EBITDA
9,273
9,307
(0.4)
10,727
(13.6)
EBITDA margin (%)
16.2
14.1
21.5
Net profit
6,409
6,318
1.4
7,320
(12.4)
Infosys Ltd Consol - July 15, 2016
Particulars (` cr)
1QFY17E
1QFY16
y-o-y (%)
4QFY16
q-o-q (%)
Net sales
17,030
14,354
18.6
16,550
2.9
EBITDA
4,450
3,760
18.3
4,639
(4.1)
EBITDA margin (%)
26.1
26.2
28.0
Net profit
3,424
3,030
13.0
3,597
(4.8)
Exide Industries Ltd - July 18, 2016
Particulars (` cr)
1QFY17E
1QFY16
y-o-y (%)
4QFY16
q-o-q (%)
Net sales
1,952
1,795
8.7
1,756
11.1
EBITDA
302
266
13.6
267
13.0
EBITDA margin (%)
15.5
14.8
15.2
Net profit
183
155
18.2
178
3.3
Market Outlook
July 13, 2016
Top Picks ★★★★★
Large Cap
Market Cap
CMP
Target
Upside
Company
Rationale
(` Cr)
(`)
(`)
(%)
To outpace battery industry growth due to better technological
Amara Raja Batteries
14,704
861
1,076
25.0
products leading to market share gains in both the automotive
OEM and replacement segments.
Uptick in defense capex by government, coupled with BELs
Bharat Electronics
30,283
1,262
1,414
12.1
strong market positioning, indicate good times ahead for BEL.
HCL Tech
1,01,497
719
1,000
39.0
Stock is trading at attractive valuations & factors all bad news.
Strong visibility for a robust 20% earnings trajectory, coupled
HDFC Bank
3,03,708
1,200
1,262
5.2
with high quality of earnings on account of high quality retail
business and strategic focus on highly rated corporates.
Back on the growth trend, expect a long term growth of 14% to
Infosys
2,70,121
1,176
1,374
16.8
be a US$20bn in FY2020.
Continues to grow its retail loan book at healthy pace with
LIC Housing Fin.
26,285
521
592
13.6
improvement in asset quality. Expect LICHF to post a healthy
loan book which is likely to reflect in a strong earnings growth.
Huge bid pipeline of re-development works at Delhi and other
NBCC
15,474
258
242
(6.2)
State Governments and opportunity from Smart City, positions
NBCC to report strong growth, going forward.
Strong market positioning within the domestic AC markets to
Voltas
10,530
318
407
27.9
continue, EMP business set to revive
Source: Company, Angel Research
Mid Cap
Market Cap
CMP
Target
Upside
Company
Rationale
(` Cr)
(`)
(`)
(%)
Among the top 4 players in the consumer durables segment.
Bajaj Electricals
2,446
242
268
10.7
Improved profitability backed by turn around in E&P segment.
Strong order book lends earnings visibility.
Favourable outlook for AC industry to augur well for Cooling
Blue Star
4,075
453
495
9.3
products business. EMPPAC division's profitability to improve
once operating environment turns around.
With a focus on the low and medium income (LMI) consumer
Dewan Housing
6,342
217
270
24.2
segment, the company has increased its presence in tier-II & III
cities where the growth opportunity is immense.
Strong loan growth backed by diversified loan portfolio and
Equitas Holdings
5,997
179
235
31.4
adequate CAR. ROE & ROA likely to remain decent as risk of
dilution remains low. Attractive valuations considering growth.
Expectations of above average monsoon augurs well for
Goodyear India
1,216
527
631
19.7
Goodyear India as it derives ~50% of its turnover from farm
tyre segment.
Commencement of new projects, downtrend in the interest rate
IL&FS Transport
2,781
85
93
10.0
cycle, to lead to stock re-rating
Economic recovery to have favourable impact on advertising &
Jagran Prakashan
5,984
183
205
12.0
circulation revenue growth. Further, the acquisition of a radio business
(Radio City) would also boost the company's revenue growth.
Speedier execution and speedier sales, strong revenue visibility
Mahindra Lifespace
1,956
477
554
16.2
in short-to-long run, attractive valuations
Massive capacity expansion along with rail advantage at ICD
Navkar Corporation
3,010
211
265
25.5
as well CFS augurs well for the company
Earnings boost on back of stable material prices and
Radico Khaitan
1,237
93
125
34.4
favourable pricing environment. Valuation discount to peers
provides additional comfort
Strong brands and distribution network would boost growth
Siyaram Silk Mills
1,015
1,083
1,347
24.4
going ahead. Stock currently trades at an inexpensive
valuation.
Source: Company, Angel Research
Market Outlook
July 13, 2016
Key Upcoming Events
Global economic events release calendar
Bloomberg Data
Date
Time
Country
Event Description
Unit
Period
Last Reported
Estimated
Jul 13, 2016
India
Imports YoY%
% Change
Jun
(13.20)
China Exports YoY%
% Change
Jun
(4.10)
(5.00)
India
Exports YoY%
% Change
Jun
(0.80)
Jul 14, 2016
6:00 PM
US
Initial Jobless claims
Thousands
Jul 9
254.00
265.00
12:00 PM
India
Monthly Wholesale Prices YoY%
% Change
Jun
0.79
1.20
4:30 PM
UK BOE Announces rates
% Ratio
Jul 14
0.50
0.25
US
Producer Price Index (mom)
% Change
Jun
0.50
July 15, 2016
2:30 PM Euro Zone Euro-Zone CPI (YoY)
%
Jun F
0.10
0.10
6:00 PM
US
Consumer price index (mom)
% Change
Jun
0.20
0.30
6:45 PM
US
Industrial Production
%
Jun
(0.42)
0.30
7:30 AM
China Industrial Production (YoY)
% Change
Jun
6.00
5.90
7:30 AM
China Real GDP (YoY)
% Change
2Q
6.70
6.60
Jul 19, 2016
6:00 PM
US
Housing Starts
Thousands
Jun
1,164.00
1,165.00
6:00 PM
US
Building permits
Thousands
Jun
1,136.00
1,150.00
2:00 PM
UK CPI (YoY)
% Change
Jun
0.30
Jul 20, 2016
2:00 PM
UK Jobless claims change
% Change
Jun
(0.40)
7:30 PM
US
Existing home sales
Million
Jun
5.53
5.45
Jul 21, 2016
7:30 PM Euro Zone Euro-Zone Consumer Confidence
Value
Jul A
(7.30)
5:15 PM Euro Zone ECB announces interest rates
%
Jul 21
-
Source: Bloomberg, Angel Research
Market Outlook
July 13, 2016
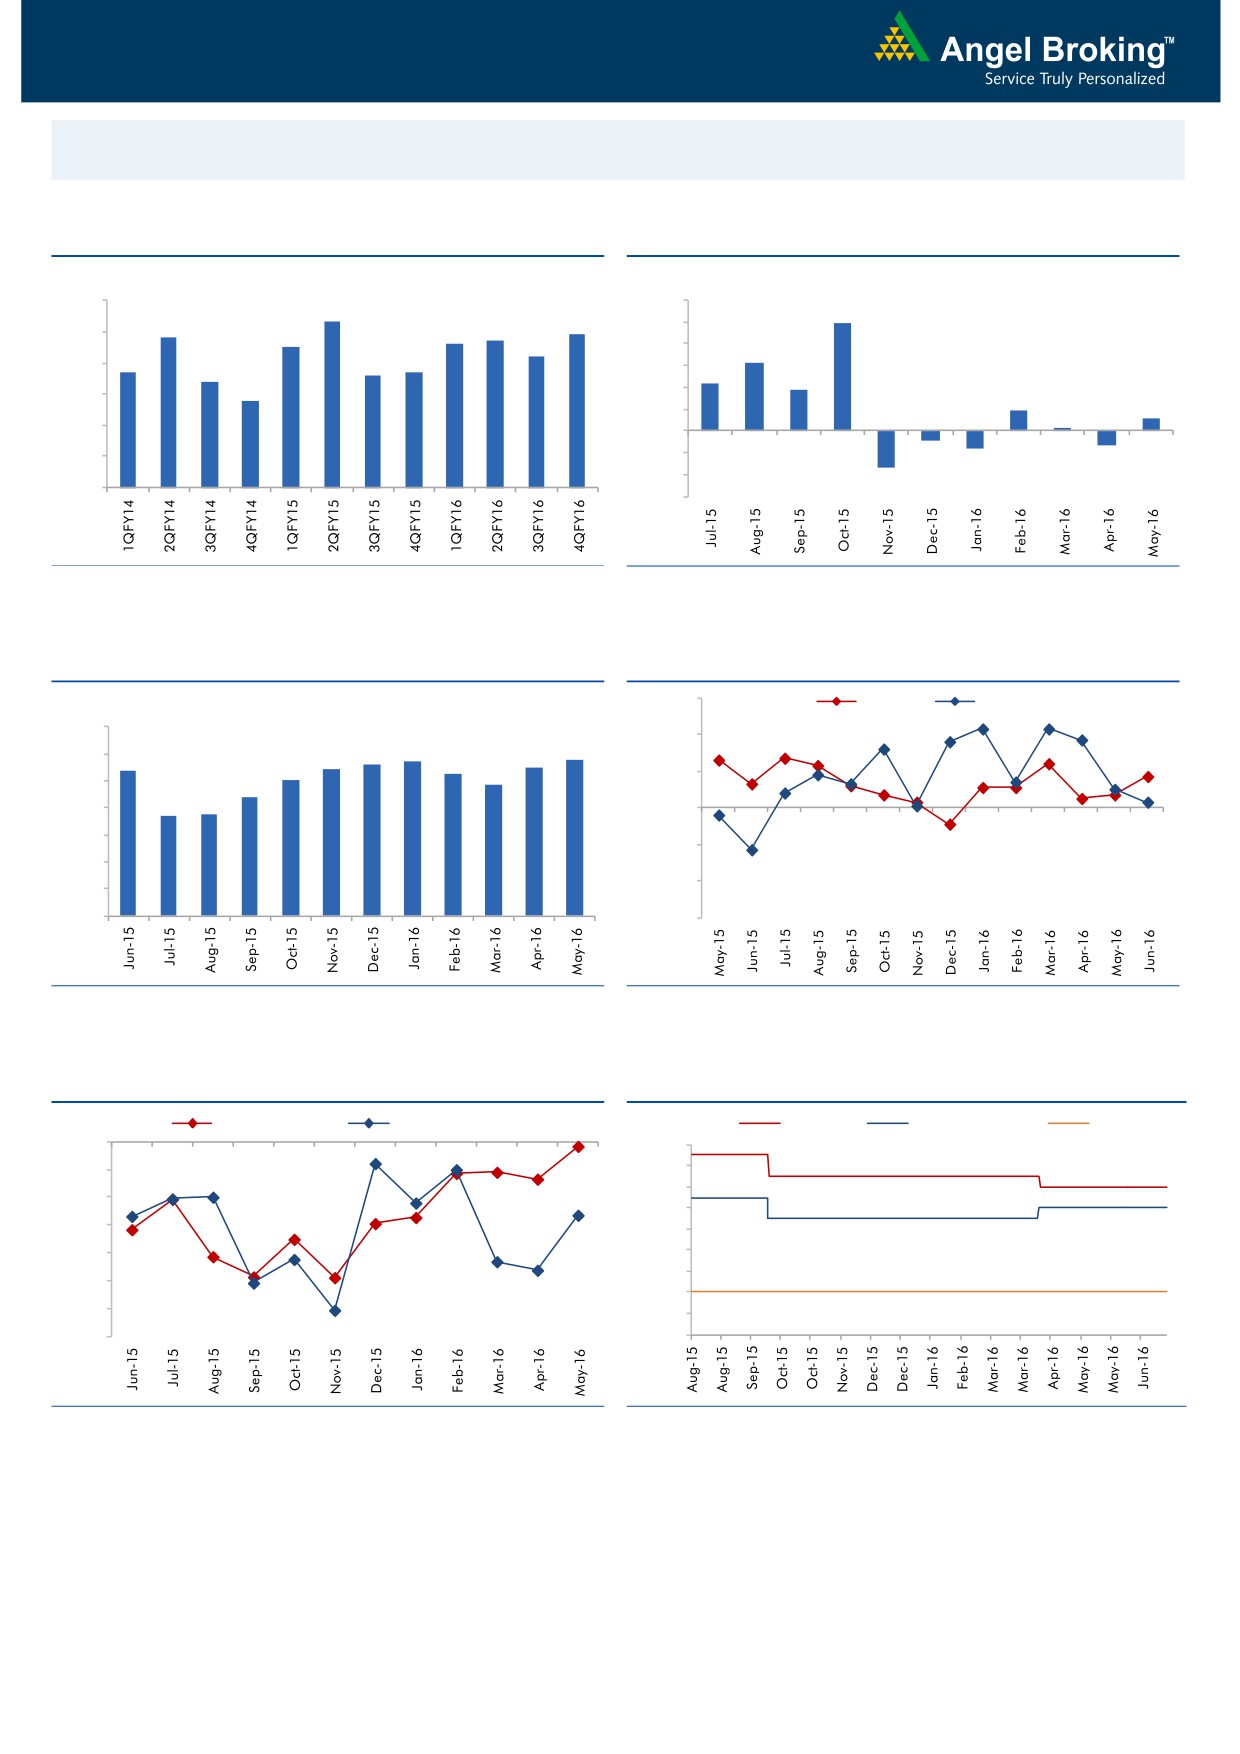
Macro watch
Exhibit 1: Quarterly GDP trends
Exhibit 2: IIP trends
(%)
(%)
9.0
8.3
12.0
9.9
7.8
7.7
7.9
10.0
8.0
7.5
7.6
7.2
8.0
6.3
6.7
6.6
6.7
7.0
6.4
6.0
4.3
3.7
5.8
4.0
6.0
1.9
1.2
2.0
0.3
5.0
-
4.0
(2.0)
(0.9)
(1.3)
(1.6)
(4.0)
3.0
(3.4)
(6.0)
Source: CSO, Angel Research
Source: MOSPI, Angel Research
Exhibit 3: Monthly CPI inflation trends
Exhibit 4: Manufacturing and services PMI
56.0
Mfg. PMI
Services PMI
(%)
7.0
54.0
5.6
5.7
5.8
5.4
5.4
5.5
6.0
5.3
5.0
4.8
52.0
5.0
4.4
3.7
3.7
4.0
50.0
3.0
48.0
2.0
46.0
1.0
-
44.0
Source: MOSPI, Angel Research
Source: Market, Angel Research; Note: Level above 50 indicates expansion
Exhibit 5: Exports and imports growth trends
Exhibit 6: Key policy rates
(%)
Exports yoy growth
Imports yoy growth
(%)
Repo rate
Reverse Repo rate
CRR
0.0
7.50
(5.0)
7.00
6.50
(10.0)
6.00
(15.0)
5.50
(20.0)
5.00
4.50
(25.0)
4.00
(30.0)
3.50
(35.0)
3.00
Source: Bloomberg, Angel Research
Source: RBI, Angel Research
Market Outlook
July 13, 2016
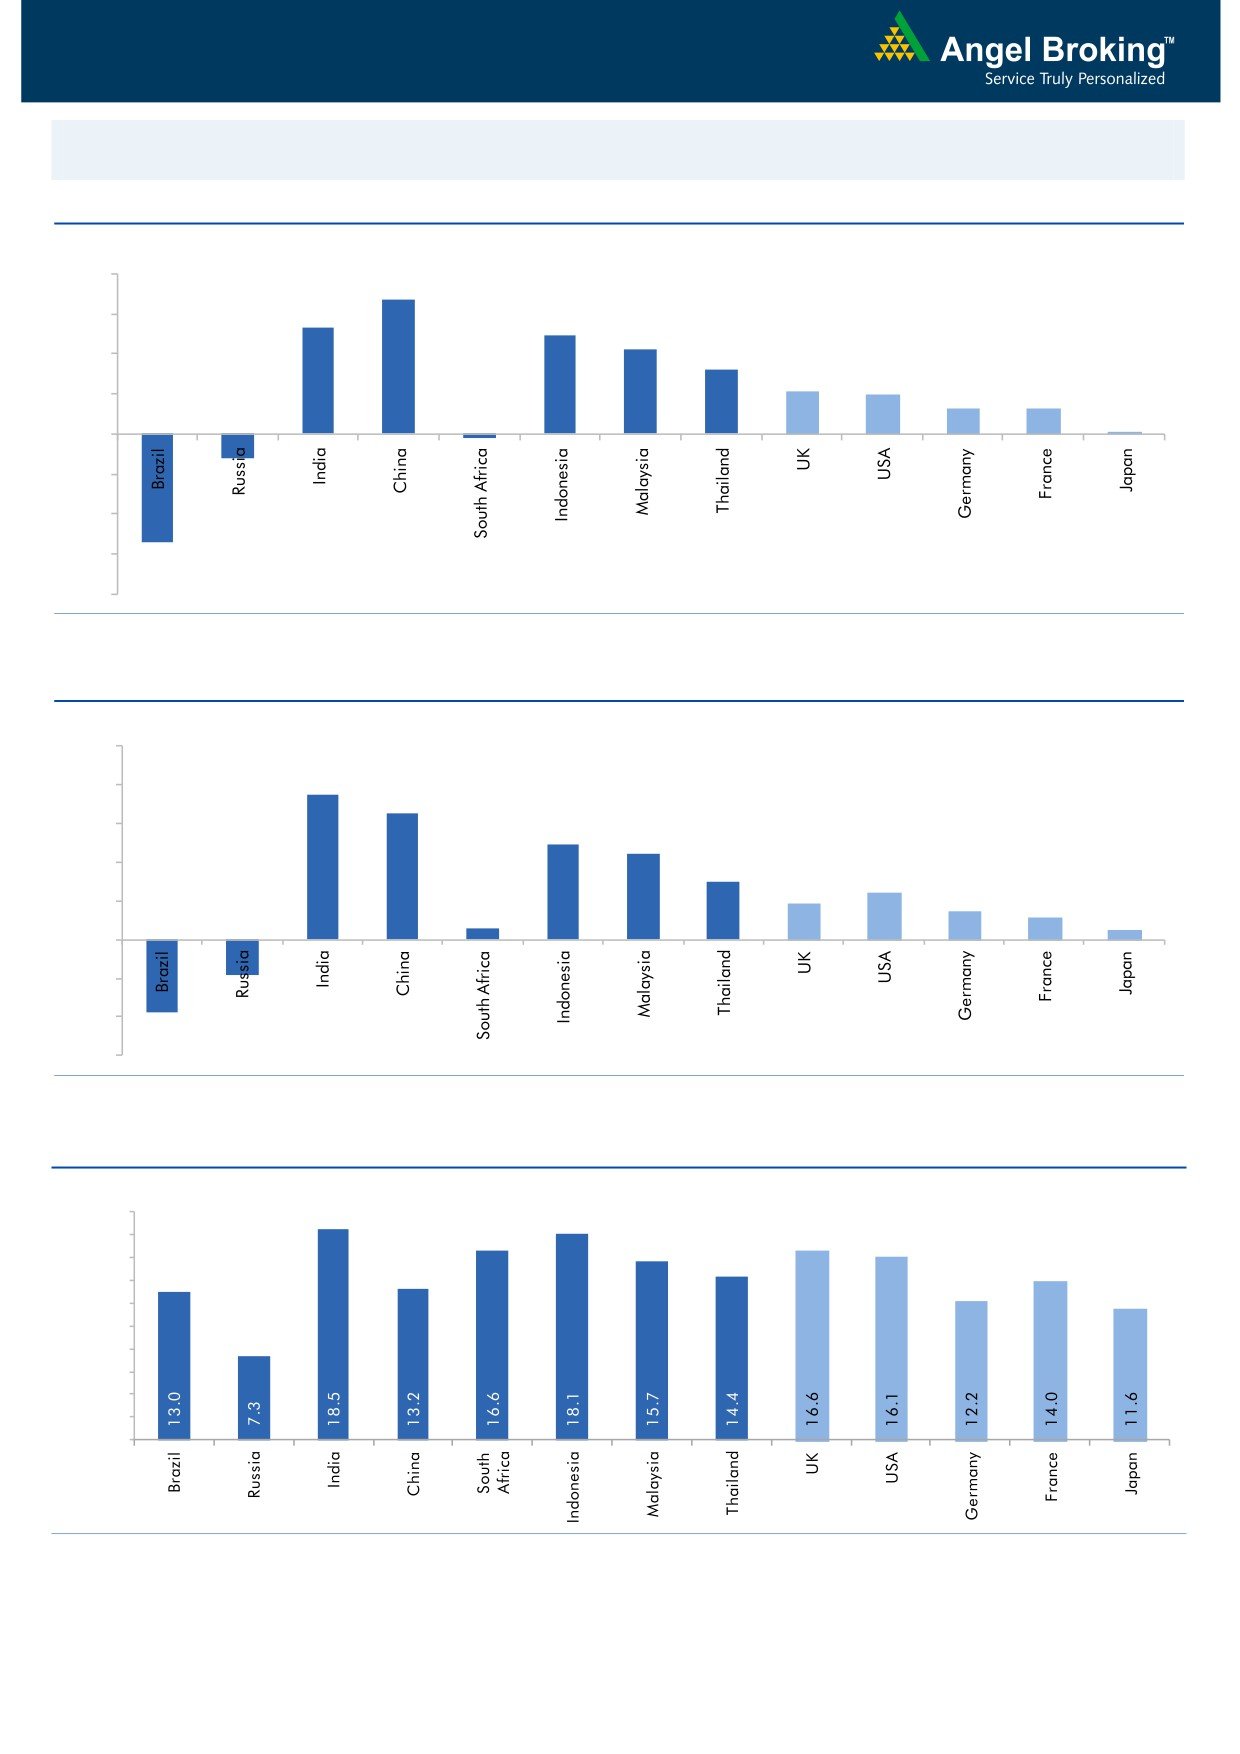
Global watch
Exhibit 1: Latest quarterly GDP Growth (%, yoy) across select developing and developed countries
(%)
8.0
6.7
6.0
5.3
4.9
4.2
4.0
3.2
2.1
2.0
2.0
1.3
1.3
0.1
-
(2.0)
(4.0)
(1.2)
(6.0)
(0.2)
(5.4)
(8.0)
Source: Bloomberg, Angel Research
Exhibit 2: 2016 GDP Growth projection by IMF (%, yoy) across select developing and developed countries
(%)
10.0
7.5
8.0
6.5
6.0
4.9
4.4
4.0
3.0
2.4
1.9
1.5
2.0
1.1
0.6
0.5
(3.8)
(1.8)
-
(2.0)
(4.0)
(6.0)
Source: IMF, Angel Research
Exhibit 3: One year forward P-E ratio across select developing and developed countries
(x)
20.0
18.0
16.0
14.0
12.0
10.0
8.0
6.0
4.0
2.0
-
Source: IMF, Angel Research
Market Outlook
July 13, 2016
Exhibit 4: Relative performance of indices across globe
Returns (%)
Country
Name of index
Closing price
1M
3M
1YR
Brazil
Bovespa
54,256
2.9
9.5
0.1
Russia
Micex
1,938
(2.0)
2.8
18.5
India
Nifty
8,521
2.4
11.2
(0.2)
China
Shanghai Composite
3,049
2.9
0.9
(23.0)
South Africa
Top 40
46,057
(4.3)
1.5
(0.4)
Mexico
Mexbol
46,433
1.1
2.4
2.6
Indonesia
LQ45
877
5.9
4.3
4.6
Malaysia
KLCI
1,654
(0.4)
(4.1)
(4.6)
Thailand
SET 50
931
0.3
1.9
(6.4)
USA
Dow Jones
18,348
1.2
3.7
1.4
UK
FTSE
6,681
9.2
7.8
(1.1)
Japan
Nikkei
16,096
(3.0)
2.2
(21.6)
Germany
DAX
9,964
(2.5)
1.6
(14.8)
France
CAC
4,331
(3.2)
(1.9)
(17.1)
Source: Bloomberg, Angel Research
Stock Watch
July 13, 2016
Company Name
Reco
CMP
Target
Mkt Cap
Sales ( Čcr )
OPM(%)
EPS (Č)
PER(x)
P/BV(x)
RoE(%)
EV/Sales(x)
(Č)
Price ( Č)
( Č cr )
FY16E FY17E
FY16E
FY17E
FY16E
FY17E
FY16E
FY17E
FY16E
FY17E
FY16E
FY17E
FY16E
FY17E
Agri / Agri Chemical
Rallis
Neutral
210
-
4,085
1,612
1,911
13.3
13.3
7.4
9.5
28.4
22.1
4.6
4.1
16.7
18.4
2.6
2.2
United Phosphorus
Buy
549
684
23,533
13,083
15,176
18.5
18.5
31.5
37.4
17.4
14.7
3.5
2.9
21.4
21.4
2.0
1.7
Auto & Auto Ancillary
Ashok Leyland
Buy
94
111
26,623
17,995
21,544
11.4
11.6
3.4
4.7
27.5
19.9
4.8
4.4
17.7
22.2
1.4
1.2
Bajaj Auto
Neutral
2,652
-
76,744
22,709
25,860
20.9
20.1
129.0
143.6
20.6
18.5
6.3
5.4
30.7
29.4
2.9
2.5
Bharat Forge
Accumulate
751
875
17,477
7,351
8,318
19.9
19.7
31.2
36.5
24.1
20.6
4.3
3.6
19.3
19.2
2.6
2.2
Eicher Motors
Neutral
19,677
-
53,445
15,556
16,747
15.5
17.3
464.8
597.5
42.3
32.9
15.5
11.4
36.2
34.3
3.3
3.0
Gabriel India
Accumulate
96
101
1,381
1,415
1,544
8.7
9.0
4.6
5.4
20.9
17.8
3.8
3.4
18.1
18.9
0.9
0.8
Hero Motocorp
Neutral
3,244
-
64,774
28,244
30,532
15.5
15.9
156.7
168.5
20.7
19.3
8.3
7.0
39.9
36.4
2.0
1.9
Jamna Auto Industries Neutral
172
-
1,374
1,281
1,473
11.2
11.5
7.6
9.2
22.6
18.7
5.7
4.7
25.4
25.2
1.1
1.0
L G Balakrishnan & Bros Neutral
496
-
778
1,254
1,394
11.6
11.8
35.9
41.7
13.8
11.9
1.9
1.7
13.5
13.8
0.7
0.6
Mahindra and Mahindra Neutral
1,473
-
91,496
38,416
42,904
13.7
13.9
54.8
63.4
26.9
23.2
4.2
3.7
15.4
15.8
2.0
1.7
Maruti
Neutral
4,370
-
132,011
57,865
68,104
16.4
16.7
176.3
225.5
24.8
19.4
4.8
4.1
19.4
21.2
2.0
1.6
Minda Industries
Neutral
1,168
-
1,853
2,523
2,890
8.7
9.0
55.0
65.4
21.2
17.9
4.1
3.3
19.3
18.7
0.8
0.7
Motherson Sumi
Accumulate
293
313
38,763
39,343
45,100
8.8
9.1
10.1
12.5
29.0
23.4
9.2
7.2
35.3
34.4
1.0
0.9
Rane Brake Lining
Accumulate
403
465
319
454
511
11.5
12.0
25.2
31.0
16.0
13.0
2.4
2.2
14.9
16.6
0.8
0.8
Setco Automotive
Neutral
49
-
650
594
741
12.7
13.7
1.7
3.2
28.6
15.2
3.0
2.6
10.4
16.9
1.6
1.3
Tata Motors
Neutral
484
-
139,798
259,686
273,957
13.0
13.4
25.9
29.5
18.7
16.4
2.5
2.1
8.0
9.0
0.7
0.7
TVS Motor
Accumulate
305
330
14,476
11,263
13,122
6.9
8.5
9.2
15.0
33.1
20.3
7.6
6.0
22.7
29.6
1.3
1.1
Amara Raja Batteries
Buy
861
1,076
14,704
4,690
5,429
17.5
17.5
28.5
35.3
30.3
24.4
7.0
5.7
23.1
25.9
3.1
2.7
Exide Industries
Neutral
177
-
15,049
6,950
7,784
14.4
14.8
6.6
7.3
26.8
24.3
3.4
3.1
12.6
12.8
1.8
1.6
Apollo Tyres
Buy
156
183
7,946
12,056
12,714
17.2
16.4
23.0
20.3
6.8
7.7
1.2
1.0
17.7
13.6
0.7
0.7
Ceat
Buy
876
1,119
3,542
6,041
6,597
14.1
13.7
99.5
111.9
8.8
7.8
1.7
1.5
19.6
18.5
0.7
0.6
JK Tyres
Neutral
91
-
2,053
7,446
7,669
15.2
14.0
19.6
18.4
4.6
4.9
1.2
1.0
25.2
19.5
0.7
0.6
Swaraj Engines
Neutral
1,143
-
1,420
552
630
14.2
14.7
44.6
54.1
25.6
21.1
6.0
5.4
23.2
25.6
2.7
2.3
Subros
Neutral
94
-
566
1,293
1,527
11.8
11.9
4.2
6.7
22.5
14.1
1.7
1.5
7.7
11.5
0.7
0.6
Indag Rubber
Neutral
188
-
494
283
329
17.0
17.2
13.0
15.4
14.5
12.2
3.2
2.6
21.8
21.6
1.5
1.2
Capital Goods
ACE
Neutral
46
-
451
660
839
4.7
8.2
1.0
3.9
45.6
11.7
1.4
1.3
3.2
11.3
0.8
0.7
BEML
Buy
887
1,157
3,692
3,277
4,006
6.0
8.9
36.2
64.3
24.5
13.8
1.7
1.5
5.7
11.7
1.2
1.0
Bharat Electronics
Accumulate
1,262
1,414
30,283
7,295
8,137
20.0
16.8
56.5
58.7
22.3
21.5
3.3
3.0
42.1
44.6
3.4
2.9
Stock Watch
July 13, 2016
Company Name
Reco
CMP
Target
Mkt Cap
Sales ( Čcr )
OPM(%)
EPS (Č)
PER(x)
P/BV(x)
RoE(%)
EV/Sales(x)
(Č)
Price ( Č)
( Č cr )
FY16E
FY17E
FY16E
FY17E
FY16E
FY17E
FY16E
FY17E
FY16E
FY17E
FY16E
FY17E
FY16E
FY17E
Capital Goods
Voltas
Buy
318
407
10,530
5,857
6,511
7.5
7.9
11.7
12.9
27.2
24.7
4.4
3.9
17.1
16.7
1.9
1.7
BGR Energy
Neutral
125
-
903
3,615
3,181
9.5
9.4
16.7
12.4
7.5
10.1
0.7
0.7
10.0
7.0
0.7
0.8
BHEL
Neutral
138
-
33,850
33,722
35,272
10.8
11.7
10.5
14.2
13.2
9.7
1.0
0.9
7.0
9.0
1.1
1.0
Blue Star
Accumulate
453
495
4,075
3,770
4,351
5.7
6.4
11.4
17.2
39.7
26.4
6.2
5.7
18.4
23.1
1.1
0.9
Crompton Greaves
Neutral
73
-
4,582
13,484
14,687
4.9
6.2
4.5
7.1
16.2
10.3
1.2
1.1
7.2
10.8
0.5
0.4
Greaves Cotton
Neutral
147
-
3,580
1,655
1,755
16.6
16.8
7.4
7.8
19.8
18.8
4.0
3.8
21.1
20.6
2.0
1.9
Inox Wind
Buy
238
286
5,277
4,406
5,605
15.5
15.7
20.4
24.8
11.7
9.6
2.7
2.0
27.9
25.9
1.4
1.1
KEC International
Neutral
147
-
3,775
8,791
9,716
6.1
6.8
5.4
8.2
27.2
17.9
2.7
2.5
10.0
14.0
0.6
0.6
Thermax
Neutral
891
-
10,614
6,413
7,525
7.4
8.5
30.5
39.3
29.2
22.7
4.5
3.9
15.0
17.0
1.6
1.3
VATech Wabag
Accumulate
610
681
3,324
2,722
3,336
7.9
8.1
19.5
24.6
31.3
24.8
3.3
2.9
11.1
12.4
1.3
1.0
Cement
ACC
Neutral
1,619
-
30,398
13,151
14,757
16.4
18.3
63.9
83.4
25.3
19.4
3.3
3.0
13.3
16.1
2.1
1.8
Ambuja Cements
Neutral
261
-
40,450
11,564
12,556
19.4
20.7
8.9
10.1
29.3
25.8
3.7
3.5
12.8
13.8
3.0
2.8
HeidelbergCement
Neutral
123
-
2,782
1,772
1,926
13.3
15.4
1.0
3.0
122.8
40.9
3.1
2.9
2.6
7.9
2.1
1.8
India Cements
Neutral
118
-
3,617
4,216
4,840
18.0
19.5
4.0
9.9
29.4
11.9
1.2
1.1
4.0
9.5
1.2
1.0
JK Cement
Neutral
705
-
4,933
3,661
4,742
10.1
15.8
7.5
28.5
94.1
24.8
2.8
2.5
7.5
22.9
1.8
1.4
J K Lakshmi Cement
Neutral
402
-
4,729
2,947
3,616
16.7
19.9
11.5
27.2
35.0
14.8
3.3
2.9
9.8
20.8
2.0
1.6
Mangalam Cements
Neutral
303
-
809
1,053
1,347
10.5
13.3
8.4
26.0
36.1
11.7
1.5
1.4
4.3
12.5
1.1
0.9
Orient Cement
Neutral
182
-
3,728
1,854
2,524
21.2
22.2
7.7
11.1
23.6
16.4
3.4
2.9
13.3
15.7
2.7
1.9
Ramco Cements
Neutral
582
-
13,849
4,036
4,545
20.8
21.3
15.1
18.8
38.5
30.9
4.7
4.2
12.9
14.3
3.9
3.4
Shree Cement^
Neutral
16,049
-
55,911
7,150
8,742
26.7
28.6
228.0
345.5
70.4
46.5
10.4
8.7
15.7
20.3
7.0
5.6
UltraTech Cement
Neutral
3,480
-
95,507
24,669
29,265
18.2
20.6
82.0
120.0
42.4
29.0
4.6
4.0
11.3
14.7
3.8
3.2
Construction
ITNL
Accumulate
85
93
2,781
7,360
8,682
34.0
32.2
7.0
8.6
12.1
9.8
0.4
0.4
3.2
2.5
3.7
3.6
KNR Constructions
Accumulate
565
603
1,588
937
1,470
14.3
14.0
44.2
38.6
12.8
14.6
2.6
2.2
15.4
15.4
1.8
1.2
Larsen & Toubro
Accumulate
1,568
1,700
146,139
58,870
65,708
8.3
10.3
42.0
53.0
37.3
29.6
2.6
2.4
8.8
11.2
2.7
2.4
Gujarat Pipavav Port
Neutral
184
-
8,881
629
684
51.0
52.2
6.4
5.9
28.7
31.1
3.8
3.5
15.9
12.7
12.4
11.2
MBL Infrastructures
Buy
143
285
593
2,313
2,797
12.2
14.6
19.0
20.0
7.5
7.2
0.8
0.7
11.3
10.6
0.9
0.8
Nagarjuna Const.
Neutral
81
-
4,503
7,892
8,842
8.8
9.1
3.0
5.3
27.0
15.3
1.4
1.3
5.0
8.5
0.8
0.7
PNC Infratech
Accumulate
564
647
2,894
1,873
2,288
13.2
13.5
24.0
32.0
23.5
17.6
2.3
2.0
12.1
12.3
1.7
1.4
Simplex Infra
Neutral
309
-
1,531
5,955
6,829
10.3
10.5
16.0
31.0
19.3
10.0
1.0
0.9
5.3
9.9
0.7
0.6
Stock Watch
July 13, 2016
Company Name
Reco
CMP
Target
Mkt Cap
Sales ( Čcr )
OPM(%)
EPS (Č)
PER(x)
P/BV(x)
RoE(%)
EV/Sales(x)
(Č)
Price ( Č)
( Č cr )
FY16E
FY17E
FY16E
FY17E
FY16E
FY17E
FY16E
FY17E
FY16E
FY17E
FY16E
FY17E
FY16E
FY17E
Construction
Power Mech Projects
Neutral
561
-
825
1,539
1,801
12.8
12.7
59.0
72.1
9.5
7.8
1.4
1.2
18.6
16.8
0.5
0.5
Sadbhav Engineering
Neutral
287
-
4,923
3,186
3,598
10.2
10.3
8.0
9.0
35.9
31.9
3.3
2.9
9.4
9.9
1.9
1.7
NBCC
Accumulate
258
220
15,474
5,838
7,428
6.0
7.9
5.2
8.2
49.6
31.5
1.6
1.2
21.9
28.2
1.8
1.3
MEP Infra
Neutral
45
-
733
1,956
1,876
28.1
30.5
1.3
3.0
34.7
15.0
7.3
4.9
21.2
32.8
1.8
1.8
SIPL
Neutral
102
-
3,593
675
1,042
62.4
64.7
-
-
3.8
4.4
-
-
16.9
11.4
Engineers India
Neutral
214
-
7,204
1,667
1,725
13.5
16.0
9.7
11.4
22.0
18.8
2.6
2.5
11.7
13.4
3.0
3.0
Financials
Allahabad Bank
Neutral
81
-
5,885
8,569
9,392
2.8
2.9
16.3
27.5
5.0
3.0
0.5
0.4
7.6
11.9
-
-
Axis Bank
Neutral
561
-
133,861
26,204
29,738
3.6
3.5
34.5
35.4
16.3
15.8
2.6
2.3
16.8
14.9
-
-
Bank of Baroda
Neutral
161
-
37,039
18,802
21,088
2.0
2.2
(7.4)
13.0
12.4
1.3
1.0
(4.2)
7.3
-
-
Bank of India
Neutral
114
-
10,653
15,972
17,271
1.9
2.0
15.3
33.4
7.5
3.4
0.3
0.3
3.6
7.6
-
-
Canara Bank
Neutral
238
-
12,939
15,441
16,945
2.0
2.1
46.6
70.4
5.1
3.4
0.5
0.4
8.0
11.2
-
-
Dena Bank
Neutral
42
-
2,791
3,440
3,840
2.1
2.3
7.3
10.0
5.8
4.2
0.4
0.4
6.1
7.9
-
-
Dewan Housing Finance Buy
217
270
6,342
1,828
2,225
2.9
3.0
24.9
29.7
8.7
7.3
1.3
1.2
15.1
16.1
-
-
Equitas Holdings
Buy
179
235
5,997
679
1,076
12.4
11.7
6.2
6.7
28.9
26.7
3.6
2.6
13.3
12.5
-
-
Federal Bank
Neutral
63
-
10,739
3,279
3,787
2.8
2.9
3.9
5.5
15.9
11.3
1.3
1.2
8.4
10.8
-
-
HDFC
Neutral
1,333
-
210,703
10,358
11,852
3.3
3.3
41.1
47.0
32.5
28.3
6.2
5.6
24.7
24.9
-
-
HDFC Bank
Accumulate
1,200
1,262
303,708
38,606
47,696
4.4
4.5
48.8
61.4
24.6
19.6
4.2
3.6
18.7
20.0
-
-
ICICI Bank
Neutral
262
-
152,142
34,279
39,262
3.3
3.3
21.0
24.4
12.5
10.7
2.1
1.8
14.4
14.7
-
-
IDBI Bank
Neutral
76
-
15,657
9,625
10,455
1.8
1.8
8.5
14.2
8.9
5.4
0.6
0.5
5.9
9.3
-
-
Indian Bank
Neutral
153
-
7,358
6,160
6,858
2.5
2.5
24.5
29.8
6.3
5.1
0.5
0.4
7.7
8.6
-
-
LIC Housing Finance
Buy
521
592
26,285
3,179
3,758
2.6
2.6
32.9
40.6
15.8
12.8
2.9
2.5
19.6
20.7
-
-
Oriental Bank
Neutral
124
-
4,291
7,643
8,373
2.4
2.4
37.2
45.4
3.3
2.7
0.3
0.3
8.2
9.4
-
-
Punjab Natl.Bank
Neutral
126
-
24,800
23,122
26,022
2.8
2.8
7.0
21.6
18.1
5.9
0.9
0.8
3.4
10.0
-
-
South Ind.Bank
Neutral
23
-
3,052
1,965
2,185
2.5
2.5
2.5
3.3
9.1
6.8
0.9
0.8
9.5
11.7
-
-
St Bk of India
Neutral
226
-
175,788
79,958
86,061
2.6
2.6
13.4
20.7
16.9
11.0
1.4
1.3
11.5
12.8
-
-
Union Bank
Neutral
138
-
9,476
12,646
14,129
2.3
2.4
31.0
39.1
4.5
3.5
0.5
0.4
9.8
11.4
-
-
Vijaya Bank
Neutral
43
-
4,260
3,536
3,827
1.9
1.9
5.5
6.7
7.7
6.4
0.6
0.6
7.8
8.8
-
-
Yes Bank
Neutral
1,154
-
48,573
7,190
9,011
3.2
3.3
58.2
69.7
19.8
16.6
3.5
3.0
19.2
19.6
-
-
FMCG
Asian Paints
Neutral
1,019
-
97,709
15,534
17,445
17.7
16.8
18.4
19.6
55.5
52.0
19.6
18.5
34.6
35.6
5.9
5.3
Stock Watch
July 13, 2016
Company Name
Reco
CMP
Target
Mkt Cap
Sales ( Čcr )
OPM(%)
EPS (Č)
PER(x)
P/BV(x)
RoE(%)
EV/Sales(x)
(Č)
Price ( Č)
( Č cr )
FY16E FY17E
FY16E
FY17E
FY16E
FY17E
FY16E
FY17E
FY16E
FY17E
FY16E
FY17E
FY16E
FY17E
FMCG
Britannia
Neutral
2,850
-
34,189
8,481
9,795
14.0
14.1
65.5
78.3
43.5
36.4
20.6
16.9
38.3
41.2
3.9
3.4
Colgate
Neutral
932
-
25,359
4,136
4,632
22.5
23.3
22.2
25.3
42.0
36.9
25.5
22.7
68.6
67.5
6.0
5.4
Dabur India
Neutral
314
-
55,246
9,370
10,265
17.6
17.3
7.3
8.1
42.8
38.8
11.1
10.2
31.7
30.6
5.6
5.1
GlaxoSmith Con*
Neutral
6,206
-
26,098
4,519
5,142
19.6
19.8
164.3
191.2
37.8
32.5
10.5
8.9
30.8
29.9
5.1
4.5
Godrej Consumer
Neutral
1,619
-
55,126
9,003
10,335
18.1
18.7
34.1
41.8
47.5
38.7
10.3
8.8
23.9
24.8
6.4
5.6
HUL
Neutral
923
-
199,738
33,299
35,497
17.1
17.1
18.9
20.0
48.9
46.1
42.8
37.3
87.6
80.8
5.6
5.2
ITC
Buy
248
380
299,416
36,837
39,726
38.8
38.7
12.2
13.5
20.3
18.4
5.7
5.0
27.8
26.9
7.4
6.9
Marico
Neutral
273
-
35,241
6,151
6,966
17.2
17.3
5.4
6.4
50.6
42.7
15.9
12.5
33.2
32.4
5.6
4.9
Nestle*
Neutral
6,423
-
61,925
9,393
10,507
22.2
22.3
106.8
121.8
60.1
52.7
21.1
19.0
34.8
36.7
6.5
5.8
Tata Global
Neutral
133
-
8,388
8,635
9,072
9.8
9.9
5.8
7.2
22.9
18.5
2.0
2.0
6.8
7.4
1.0
1.0
Procter & Gamble
Buy
6,264
7,369
20,333
2,588
2,939
23.3
23.2
130.2
146.2
48.1
42.9
95.9
92.0
27.6
25.3
7.5
6.5
Hygiene
IT
HCL Tech^
Buy
719
1,000
101,497
37,061
30,781
21.5
20.5
51.4
40.0
14.0
18.0
3.6
2.6
20.1
20.3
2.6
2.7
Infosys
Buy
1,176
1,374
270,121
62,441
70,558
27.5
27.5
59.0
65.3
19.9
18.0
4.0
3.6
22.2
22.4
3.8
3.2
TCS
Buy
2,462
3,004
485,021
108,646
122,770
28.3
28.3
123.7
141.0
19.9
17.5
6.6
6.0
33.1
34.6
4.0
3.5
Tech Mahindra
Buy
508
700
49,283
26,494
30,347
16.3
17.0
32.2
37.5
15.8
13.5
3.4
3.0
21.7
21.8
1.6
1.4
Wipro
Buy
570
680
140,719
50,808
56,189
23.7
23.8
37.3
40.7
15.3
14.0
2.9
2.7
19.2
17.7
2.2
1.8
Media
D B Corp
Neutral
378
-
6,944
2,025
2,187
27.4
27.4
17.4
18.9
21.7
20.0
4.9
4.5
22.9
23.7
3.5
3.2
HT Media
Neutral
82
-
1,903
2,495
2,673
12.9
13.2
6.8
7.2
12.0
11.4
0.9
0.9
7.5
7.8
0.3
0.3
Jagran Prakashan
Buy
183
205
5,984
2,107
2,355
33.5
28.0
10.1
10.8
18.2
17.0
4.2
3.7
23.3
21.7
2.8
2.5
Sun TV Network
Neutral
376
-
14,812
2,510
2,763
71.8
71.5
21.9
24.8
17.2
15.2
4.1
3.7
22.8
24.3
5.3
4.8
Hindustan Media
Neutral
272
-
1,996
914
1,016
21.7
21.5
21.9
23.3
12.4
11.7
2.2
1.9
18.0
16.2
1.6
1.4
Ventures
Metals & Mining
Coal India
Buy
317
380
200,134
76,167
84,130
19.9
22.3
22.4
25.8
14.1
12.3
5.1
5.0
35.5
41.0
2.0
1.8
Hind. Zinc
Neutral
195
-
82,520
14,641
14,026
50.4
50.4
17.7
16.0
11.1
12.2
1.7
1.5
16.2
13.2
3.0
2.8
Hindalco
Neutral
135
-
27,939
104,356
111,186
8.7
9.5
6.7
11.1
20.1
12.2
0.7
0.7
3.5
5.9
0.8
0.7
JSW Steel
Neutral
1,542
-
37,269
42,308
45,147
16.4
20.7
(10.3)
49.5
31.2
1.7
1.7
(1.0)
5.6
1.9
1.8
NMDC
Neutral
97
-
38,359
8,237
10,893
46.6
44.5
10.0
11.7
9.7
8.3
1.1
0.9
12.5
13.0
4.4
3.3
SAIL
Neutral
50
-
20,444
45,915
53,954
7.2
10.5
1.5
4.4
32.9
11.3
0.5
0.5
2.3
4.1
1.1
1.0
Vedanta
Neutral
160
-
47,376
71,445
81,910
26.2
26.3
12.9
19.2
12.4
8.3
0.9
0.8
7.2
8.9
1.0
0.8
Tata Steel
Neutral
342
-
33,254
126,760
137,307
8.9
11.3
6.4
23.1
53.8
14.8
1.1
1.0
2.0
7.1
0.8
0.8
Stock Watch
July 13, 2016
Company Name
Reco
CMP
Target
Mkt Cap
Sales ( Čcr )
OPM(%)
EPS (Č)
PER(x)
P/BV(x)
RoE(%)
EV/Sales(x)
(Č)
Price ( Č)
( Č cr )
FY16E FY17E
FY16E
FY17E
FY16E
FY17E
FY16E
FY17E
FY16E
FY17E
FY16E
FY17E
FY16E
FY17E
Oil & Gas
Cairn India
Neutral
163
-
30,476
11,323
12,490
49.4
51.0
20.7
20.7
7.9
7.9
0.5
0.5
6.4
6.1
1.5
0.9
GAIL
Neutral
378
-
48,006
64,856
70,933
9.1
9.6
24.0
28.9
15.8
13.1
1.4
1.3
8.8
9.6
0.9
0.8
ONGC
Neutral
228
-
194,851
154,564
145,998
36.8
37.4
20.8
22.6
11.0
10.1
1.0
1.0
10.1
9.7
1.5
1.6
Petronet LNG
Neutral
295
-
22,099
29,691
31,188
5.8
6.2
12.8
13.4
23.1
22.0
3.4
3.1
15.8
14.8
0.8
0.8
Indian Oil Corp
Neutral
477
-
115,728
359,607
402,760
5.9
6.1
42.5
48.7
11.2
9.8
1.5
1.3
14.1
14.4
0.4
0.4
Reliance Industries
Neutral
1,002
-
324,925
304,775
344,392
12.6
13.4
91.3
102.6
11.0
9.8
1.2
1.1
11.8
12.0
1.0
0.8
Pharmaceuticals
Alembic Pharma
Neutral
592
-
11,164
3,145
3,483
31.9
16.2
38.2
18.7
15.5
31.7
7.0
5.9
57.9
20.1
3.4
3.1
Aurobindo Pharma
Neutral
779
-
45,576
13,651
15,702
21.7
21.7
33.9
38.4
23.0
20.3
6.5
5.0
32.5
27.7
3.5
3.1
Aventis*
Neutral
4,552
-
10,483
2,049
2,375
15.4
17.3
115.4
153.5
39.4
29.7
6.4
5.0
19.3
25.8
5.0
4.2
Cadila Healthcare
Buy
371
400
38,006
9,469
11,246
21.2
22.0
14.9
17.1
24.9
21.7
7.1
5.6
28.8
26.6
3.6
3.0
Cipla
Neutral
516
-
41,480
13,372
15,378
16.4
17.4
18.8
21.6
27.5
23.9
3.5
3.1
13.3
13.7
3.1
2.9
Dr Reddy's
Neutral
3,591
-
61,246
15,471
17,479
24.6
24.6
138.2
152.4
26.0
23.6
4.8
4.1
19.7
18.7
3.8
3.3
Dishman Pharma
Neutral
137
-
2,211
1,733
1,906
21.5
21.5
10.1
10.0
13.6
13.7
1.6
1.4
10.5
11.2
1.8
1.5
GSK Pharma*
Neutral
3,506
-
29,696
2,741
3,528
16.5
18.9
44.2
60.1
79.3
58.3
17.5
17.4
21.2
29.9
10.3
8.1
Indoco Remedies
Neutral
285
-
2,629
977
1,112
14.9
18.2
9.0
13.2
31.7
21.6
4.5
3.8
15.1
19.2
2.8
2.5
Ipca labs
Buy
469
613
5,922
2,844
3,799
10.6
15.3
10.6
17.3
44.3
27.1
2.6
2.4
5.9
9.1
2.3
1.7
Lupin
Buy
1,672
1,809
75,383
13,702
15,912
23.7
26.4
50.5
58.1
33.1
28.8
6.8
5.6
22.9
21.4
5.6
4.5
Sun Pharma
Buy
784
944
188,625
27,744
31,129
26.0
30.0
22.0
28.0
35.6
28.0
5.2
4.3
18.3
18.7
6.6
5.6
Power
Tata Power
Neutral
73
-
19,663
35,923
37,402
22.6
22.8
4.1
5.2
17.9
14.1
1.4
1.3
7.5
9.3
1.5
1.4
NTPC
Neutral
158
-
130,278
87,271
99,297
23.5
23.5
11.8
13.3
13.5
11.9
1.5
1.4
11.5
12.2
2.5
2.2
Power Grid
Accumulate
167
170
87,132
20,702
23,361
86.7
86.4
12.1
13.2
13.8
12.6
2.0
1.8
15.6
15.1
9.0
8.3
Real Estate
MLIFE
Buy
477
554
1,956
826
1,011
20.1
21.9
22.7
30.7
21.0
15.5
1.3
1.2
6.0
7.4
4.2
3.2
Telecom
Bharti Airtel
Neutral
363
-
145,126
101,748
109,191
32.1
31.7
12.0
12.5
30.3
29.0
2.1
2.0
6.9
6.7
2.1
1.9
Idea Cellular
Neutral
104
-
37,484
34,282
36,941
32.0
31.5
5.9
6.2
17.6
16.8
1.6
1.5
9.9
9.3
1.7
1.6
zOthers
Abbott India
Neutral
4,767
-
10,129
2,715
3,153
14.5
14.1
134.3
152.2
35.5
31.3
8.9
7.3
27.4
25.6
3.4
2.9
Bajaj Electricals
Accumulate
242
268
2,446
4,612
5,351
5.6
5.7
23.4
18.0
10.3
13.5
3.2
2.8
12.5
14.4
0.5
0.5
Finolex Cables
Neutral
374
-
5,715
2,520
2,883
12.2
12.0
12.7
14.2
29.5
26.3
4.0
3.6
13.6
13.5
2.0
1.7
Goodyear India*
Buy
527
631
1,216
1,800
1,600
11.7
11.5
58.7
52.9
9.0
10.0
2.0
1.7
24.6
18.7
0.5
0.4
Hitachi
Neutral
1,386
-
3,769
1,779
2,081
7.8
8.8
21.8
33.4
63.6
41.5
10.3
8.3
17.4
22.1
2.2
1.8
Stock Watch
July 13, 2016
Company Name
Reco
CMP
Target
Mkt Cap
Sales ( Čcr )
OPM(%)
EPS (Č)
PER(x)
P/BV(x)
RoE(%)
EV/Sales(x)
(Č)
Price ( Č)
( Č cr )
FY16E
FY17E
FY16E
FY17E
FY16E
FY17E
FY16E
FY17E
FY16E
FY17E
FY16E
FY17E
FY16E
FY17E
zOthers
Jyothy Laboratories
Neutral
296
-
5,354
1,620
1,847
11.5
11.5
7.3
8.5
40.6
34.9
5.2
4.9
13.3
14.4
3.3
2.8
MRF
Buy
35,218
45,575
14,936
20,316
14,488
21.4
21.1
5,488.0
3,798.0
6.4
9.3
2.2
1.8
41.1
21.2
0.7
0.9
Page Industries
Neutral
13,272
-
14,803
1,929
2,450
19.8
20.1
229.9
299.0
57.7
44.4
25.5
17.7
52.1
47.1
8.0
6.3
Relaxo Footwears
Neutral
480
-
5,765
1,767
2,152
12.3
12.5
19.3
25.1
25.0
19.2
6.1
4.7
27.7
27.8
3.4
2.8
Siyaram Silk Mills
Buy
1,083
1,347
1,015
1,619
1,799
11.6
11.6
93.5
104.9
11.6
10.3
2.0
1.7
17.1
16.4
0.9
0.8
Styrolution ABS India* Neutral
638
-
1,122
1,271
1,440
8.6
9.2
32.0
41.1
19.9
15.5
2.0
1.8
10.7
12.4
0.9
0.8
TVS Srichakra
Buy
2,370
2,932
1,815
2,035
2,252
15.9
15.3
248.6
268.1
9.5
8.8
4.2
3.0
43.6
33.9
1.0
0.8
HSIL
Accumulate
280
310
2,025
2,123
2,384
16.1
16.5
15.0
18.9
18.6
14.8
1.4
1.3
8.0
9.4
1.3
1.2
Kirloskar Engines India
Neutral
257
-
3,709
2,403
2,554
8.6
9.9
9.2
10.5
27.9
24.5
2.7
2.6
9.7
10.7
1.3
1.2
Ltd
M M Forgings
Buy
415
546
501
511
615
21.7
21.6
43.1
55.8
9.6
7.4
1.8
1.4
19.9
21.2
1.3
1.0
Banco Products (India) Neutral
153
-
1,094
1,208
1,353
11.0
12.3
10.8
14.5
14.2
10.6
1.6
1.5
11.9
14.5
0.9
0.8
Competent Automobiles Neutral
150
-
92
1,040
1,137
3.2
3.1
25.7
28.0
5.8
5.4
0.9
0.8
15.0
14.3
0.1
0.1
Nilkamal
Neutral
1,236
-
1,844
1,871
2,031
10.7
10.5
63.2
69.8
19.6
17.7
3.2
2.7
17.6
16.6
1.0
0.9
Visaka Industries
Neutral
158
-
251
1,020
1,120
8.7
9.1
13.9
20.1
11.4
7.9
0.7
0.7
6.4
8.7
0.5
0.4
Transport Corporation of
Neutral
332
-
2,542
2,830
3,350
8.8
9.0
14.4
18.3
23.1
18.1
3.6
3.1
15.4
17.1
1.0
0.9
India
Elecon Engineering
Neutral
62
-
680
1,359
1,482
10.3
13.7
0.8
3.9
77.8
16.0
1.3
1.2
1.6
7.8
0.9
0.8
Surya Roshni
Buy
168
201
738
2,992
3,223
8.1
8.4
14.7
18.3
11.5
9.2
1.1
1.0
9.7
11.0
0.5
0.5
MT Educare
Neutral
164
-
651
286
366
18.3
17.7
7.7
9.4
21.2
17.5
4.5
3.9
20.2
21.1
2.2
1.7
Radico Khaitan
Buy
93
125
1,237
1,543
1,659
12.6
13.0
5.8
6.3
16.1
14.7
1.4
1.3
8.5
8.6
1.3
1.2
Garware Wall Ropes
Buy
429
460
940
828
898
11.2
10.3
28.3
29.0
15.2
14.8
2.6
2.2
16.8
14.9
1.0
0.9
Wonderla Holidays
Neutral
399
-
2,254
206
308
44.0
43.6
9.0
12.9
44.3
30.9
6.1
5.5
13.7
17.8
10.8
7.2
Linc Pen & Plastics
Neutral
248
-
367
344
382
9.1
9.1
12.4
13.1
20.0
19.0
3.6
3.2
18.0
16.7
1.1
1.0
The Byke Hospitality
Neutral
162
-
651
222
287
20.5
20.5
5.6
7.6
28.8
21.5
5.4
4.5
18.9
20.8
2.9
2.2
Interglobe Aviation
Neutral
1,013
-
36,488
17,022
21,122
20.7
14.5
63.9
53.7
15.8
18.9
23.8
19.5
149.9
103.2
2.2
1.8
Coffee Day Enterprises
Neutral
250
-
5,155
2,692
2,964
17.0
18.6
-
4.7
-
52.8
3.1
2.9
0.2
5.5
2.4
2.2
Ltd
Navneet Education
Neutral
99
-
2,358
998
1,062
24.1
24.0
5.8
6.1
17.2
16.3
3.8
3.3
22.0
20.6
2.5
2.3
Navkar Corporation
Buy
211
265
3,010
347
408
43.2
42.9
6.7
6.8
31.6
31.2
2.3
2.2
7.3
6.9
9.2
8.3
UFO Moviez
Neutral
556
-
1,536
558
619
32.0
33.2
22.5
30.0
24.7
18.6
3.0
2.6
12.0
13.8
2.6
2.2
VRL Logistics
Neutral
316
-
2,884
1,725
1,902
16.5
16.7
12.2
14.6
26.0
21.7
5.4
4.8
20.8
21.9
1.8
1.6
Stock Watch
July 13, 2016
Company Name
Reco
CMP
Target Mkt Cap
Sales ( Čcr )
OPM(%)
EPS (Č)
PER(x)
P/BV(x)
RoE(%)
EV/Sales(x)
(Č)
Price ( Č)
( Č cr )
FY16E FY17E FY16E FY17E FY16E FY17E FY16E FY17E FY16E FY17E FY16E FY17E FY16E FY17E
zOthers
Team Lease Serv.
Neutral
1,037
-
1,773
2,565
3,229
1.3
1.5
15.2
22.8
68.3
45.5
5.5
4.9
8.0
10.7
0.6
0.5
S H Kelkar & Co.
Neutral
230
-
3,321
928
1,036
15.3
15.1
4.9
6.1
46.5
37.6
4.4
4.0
9.4
10.7
3.2
2.8
Quick Heal
Neutral
281
-
1,970
339
408
27.8
27.3
7.1
7.7
39.8
36.3
3.4
3.4
8.5
9.3
4.8
4.0
Narayana Hrudaya
Neutral
310
-
6,339
1,603
1,873
10.9
11.5
1.0
2.6
325.6
117.3
7.8
7.2
2.4
6.1
4.1
3.5
Manpasand Bever.
Neutral
630
-
3,151
540
836
19.9
19.6
10.2
16.9
61.5
37.3
5.0
4.5
8.1
12.0
5.1
3.2
Parag Milk Foods
Accumulate
330
336
2,772
1,645
1,919
9.0
9.3
6.7
9.5
49.1
34.9
6.4
5.4
13.1
15.5
1.8
1.5
Source: Company, Angel Research; Note: *December year end; #September year end; &October year end; Price as on July 12, 2016
Market Outlook
July 13, 2016
Research Team Tel: 022 - 39357800
DISCLAIMER
Angel Broking Private Limited (hereinafter referred to as “Angel”) is a registered Member of National Stock Exchange of India Limited,
Bombay Stock Exchange Limited and Metropolitian Stock Exchange of India Limited. It is also registered as a Depository Participant with
CDSL and Portfolio Manager with SEBI. It also has registration with AMFI as a Mutual Fund Distributor. Angel Broking Private Limited is a
registered entity with SEBI for Research Analyst in terms of SEBI (Research Analyst) Regulations, 2014 vide registration number
INH000000164. Angel or its associates has not been debarred/ suspended by SEBI or any other regulatory authority for accessing
/dealing in securities Market. Angel or its associates including its relatives/analyst do not hold any financial interest/beneficial ownership
of more than 1% in the company covered by Analyst. Angel or its associates/analyst has not received any compensation / managed or co
-managed public offering of securities of the company covered by Analyst during the past twelve months. Angel/analyst has not served as
an officer, director or employee of company covered by Analyst and has not been engaged in market making activity of the company
covered by Analyst.
This document is solely for the personal information of the recipient, and must not be singularly used as the basis of any investment
decision. Nothing in this document should be construed as investment or financial advice. Each recipient of this document should make
such investigations as they deem necessary to arrive at an independent evaluation of an investment in the securities of the companies
referred to in this document (including the merits and risks involved), and should consult their own advisors to determine the merits and
risks of such an investment.
Reports based on technical and derivative analysis center on studying charts of a stock's price movement, outstanding positions and
trading volume, as opposed to focusing on a company's fundamentals and, as such, may not match with a report on a company's
fundamentals.
The information in this document has been printed on the basis of publicly available information, internal data and other reliable sources
believed to be true, but we do not represent that it is accurate or complete and it should not be relied on as such, as this document is for
general guidance only. Angel Broking Pvt. Limited or any of its affiliates/ group companies shall not be in any way responsible for any
loss or damage that may arise to any person from any inadvertent error in the information contained in this report. Angel Broking Pvt.
Limited has not independently verified all the information contained within this document. Accordingly, we cannot testify, nor make any
representation or warranty, express or implied, to the accuracy, contents or data contained within this document. While Angel Broking
Pvt. Limited endeavors to update on a reasonable basis the information discussed in this material, there may be regulatory, compliance,
or other reasons that prevent us from doing so.
This document is being supplied to you solely for your information, and its contents, information or data may not be reproduced,
redistributed or passed on, directly or indirectly.
Neither Angel Broking Pvt. Limited, nor its directors, employees or affiliates shall be liable for any loss or damage that may arise from or
in connection with the use of this information.
Note: Please refer to the important ‘Stock Holding Disclosure' report on the Angel website (Research Section). Also, please refer to the
latest update on respective stocks for the disclosure status in respect of those stocks. Angel Broking Pvt. Limited and its affiliates may have
investment positions in the stocks recommended in this report.