Market Outlook
May 13, 2016
Market Cues
Domestic Indices
Chg (%)
(Pts)
(Close)
BSE Sensex
0.8
193
25,790
Indian markets are expected to open in negative zone tracking SGX Nifty.
Nifty
0.7
52
7,900
Concerns about slowing sales at Apple dragged the company's share price down
Mid Cap
0.7
77
11,221
2.4% on Thursday, causing losses on the wider Nasdaq index. Dow Jones Industrial
Small Cap
0.9
102
11,141
Average gained 0.1% on the back off of gains in oil prices. Exxon Mobile and
Chevron shares both climbed 1%, while the price of a barrel of US crude rose by
Bankex
0.9
181
19,281
0.6% to $46.51.
London's FTSE 100 dipped in afternoon trading, with mining stocks dragging the
Global Indices
Chg (%)
(Pts)
(Close)
index down. The downturn reversed an earlier rise in the wake of the Bank of
Dow Jones
0.1
9
17,721
England's inflation report and decision to leave interest rates unchanged. Anglo
Nasdaq
(0.5)
(23)
4,737
American led the losers list, down 6.9%, while Antofagasta and Glencore fell by
FTSE
(0.9)
(58)
6,104
4.6% and 4.2% respectively.
Nikkei
0.4
67
16,646
After the initial negative reaction on Wednesday’s trade, over amendments to the
Hang Seng
(0.7)
(140)
19,915
Mauritius Double Tax Avoidance Agreement (DTAA), Indian markets ended the day
Shanghai Com
(0.0)
(1)
2,836
in green. We sense positive news flow on the monsoon front to cheer up the market
investors. Banks, Auto, IT and Metals lead the market rally. ICICI Bank, Asian Paints,
SBI & TCS were amongst major gainers in Sensex.
Advances / Declines
BSE
NSE
Advances
1,581
996
News Analysis
Declines
1,015
543
Avg. launch price of Affordable homes in Mumbai fall 36%
Unchanged
171
89
IIP rises 0.1% in March against 1.9% in February
Detailed analysis on Pg2
Volumes (` Cr)
Investor’s Ready Reckoner
BSE
2,651
NSE
15,781
Key Domestic & Global Indicators
Stock Watch: Latest investment recommendations on 150+ stocks
Refer Pg5 onwards
Net Inflows (` Cr)
Net
Mtd
Ytd
FII
(324)
(213)
11,577
Top Picks
MFs
1,583
2,439
5,035
CMP
Target
Upside
Company
Sector
Rating
(`)
(`)
(%)
Amara Raja
Auto & Auto Ancillary Accumulate
949
1,076
13.4
Top Gainers
Price (`)
Chg (%)
HCL Tech
IT
Buy
716
1,038
45.0
Monsanto
2,405
17.4
LIC Housing
Financials
Buy
468
592
26.4
Amtekauto
36
6.8
Bharat Electronics
Capital Goods
Buy
1,160
1,414
21.9
Abirlanuvo
946
6.3
Navkar Corporation Others
Buy
176
265
50.6
Eclerx
1,387
5.4
More Top Picks on Pg4
Sci
74
5.1
Key Upcoming Events
Previous
Consensus
Date
Region
Event Description
Top Losers
Price (`)
Chg (%)
Reading
Expectations
May 13 India
Imports YoY%
(21.56)
--
Indianb
86
(4.6)
May 13 Germany
German GDP (QoQ) (Q1)
0.3%
0.6%
Fsl
40
(4.4)
May 13 USA
Retail Sales (MoM) (April)
(0.4%)
0.8%
Syndibank
68
(3.7)
May 14 China
Industrial Production (YoY) (Apr)
6.8%
6.5%
Srf
1,385
(3.6)
6.(
More Events on Pg5
Mrpl
70
(3.2)
As on May 12, 2016
Market Outlook
May 13, 2016
Avg. launch price of Affordable homes in Mumbai fall 36%
As per Cushman & Wakefield report, Average launch price of affordable homes in
Mumbai, declined 36% in first quarter of 2016 from two years ago to ~`4,300/
sq. ft. Given that affordable housing is a highly price sensitive segment, in order to
increase sales velocity, developers are resorting to offer smaller sized residential
units. Average size of affordable homes in Mumbai was at ~850 sq. ft., reflecting
11% decline during last 2 years. In the current quarter, Mumbai market witnessed
5,360 units being launched, accounting for 17% of total launches in top 8 cities.
This further represents 35% yoy increase in the March ended quarter.
Mid-segment accounted for majority of Mumbai launches, driven by launches seen
across Eastern suburbs, Thane & Navi Mumbai. During the quarter, the affordable
segment accounted for only 5% of total launches in the city.
In addition to the Mumbai markets, Average launch prices across all major cities
too declined, thereby making new projects cheaper than those launched in last 12-
24 months time period. Affordable homes launch prices declined 25%/10%/5% in
Pune/ Delhi-National Capital Region/ Kolkata, respectively.
Pune witnessed 24% yoy increase in average size of apartments launched during
the March quarter, thereby impacting average ticket size of new launches.
Developers in Delhi-NCR market have focused on affordable housing segment, as
41% of total launches (1,855 units) during the quarter were from Affordable
housing segment. This segment reported 67% yoy increase in the new launches.
We expect companies with fast portfolio churns, wide geographical presence and
diversified portfolio of Affordable and Mid-segment housing should benefit the
most. Within the Real Estate space, we expect Mahindra Life space to be one of the
beneficiaries of this green shoots seen. We maintain BUY on Mahindra Life space
with price target of `554.
IIP rises 0.1% in March against 1.9% in February
India’s factory output grew for the second straight month, albeit marginally. The
Index of Industrial Production (IIP) rose 0.1% in March against 1.9% in February.
Factory output has grown for last
2 consecutive months, after witnessing
contraction for 3 consecutive months. Industrial activity is showing some signs of
pick-up, recovery continues to be volatile, as indicated by this data released.
While, Mining & manufacturing contracted by 0.1% & 1.2%, respectively, in March,
Electricity grew by 11.3%.
Retail inflation in April accelerated to 5.39% from 4.83% in March, as Food
inflation rose to 6.21% from 5.39% in the previous month. Food prices rose mainly
on account of 34% jump in the pulses prices.
Market Outlook
May 13, 2016
Economic and Political News
SEBI mulls tougher P-Note rules to curb black money in D-Street
5/20 rule for airlines: Key ministries support abolition
Steel min seeks similar freight for iron ore, coal
Corporate News
Cairn gives Vedanta 2 more years to pay back $1.25-bn loan
Lender's to Alok Industries hunt O&M agency
R-Power’s plea to mortgage Sasan coal blocks rejected
Reliance to rebrand some digital stores for Jio push
Quarterly Bloomberg Brokers Consensus Estimate
Cadila Healthcare Ltd. - May 13, 2016
Particulars (` cr)
4QFY16E
4QFY15
y-o-y (%)
3QFY16
q-o-q (%)
Net sales
2,502
2,247
11.4
2,342
6.8
EBITDA
579
501
15.6
591
(2)
EBITDA margin (%)
23.1
22.3
25.2
Net profit
396
355
11.6
399
(0.8)
Bank of Baroda - May 13, 2016
Particulars (` cr)
4QFY16E
4QFY15
y-o-y (%)
3QFY16
q-o-q (%)
Net profit
273
598
(54.5)
(3,342)
108.2
United Breweries Ltd. - May 13, 2016
Particulars (` cr)
4QFY16E
4QFY15
y-o-y (%)
3QFY16
q-o-q (%)
Net sales
1,290
1,045
23.4
1,031
25.2
EBITDA
181
122
48.4
183
(1.2)
EBITDA margin (%)
14.0
11.7
17.8
Net profit
69
48
42.3
72
(5.0)
Union Bank of India - May 13, 2016
Particulars (` cr)
4QFY16E
4QFY15
y-o-y (%)
3QFY16
q-o-q (%)
Net profit
187
444
(57.8)
78
139.7
Market Outlook
May 13, 2016
Top Picks
Large Cap
Market Cap
CMP
Target
Upside
Company
Rationale
(` Cr)
(`)
(`)
(%)
To outpace battery industry growth due to better technological
Amara Raja Batteries
16,212
949
1,076
13.4
products leading to market share gains in both the automotive
OEM and replacement segments.
Uptick in defense capex by government when coupled with
Bharat Electronics
27,841
1,160
1,414
21.9
BELs strong market positioning, indicate that good times are
ahead for BEL.
The stock is trading at attractive valuations and is factoring all
HCL Tech
100,989
716
1,038
45.0
the bad news.
Strong visibility for a robust 20% earnings trajectory, coupled
HDFC Bank
290,837
1,150
1,262
9.8
with high quality of earnings on account of high quality retail
business and strategic focus on highly rated corporates.
Back on the growth trend, expect a long term growth of 14%
Infosys
278,884
1,210
1,374
13.5
to be a US$20bn in FY2020.
LICHF continues to grow its retail loan book at a healthy pace
with improvement in asset quality. We expect the company to
LIC Housing Finance
23,631
468
592
26.4
post a healthy loan book which is likely to reflect in a strong
earnings growth.
Huge bid pipeline of re-development works at Delhi and other
NBCC
11,740
978
1,089
11.3
State Governments and opportunity from Smart City, positions
NBCC to report strong growth, going forward.
Source: Company, AngelResearch
Mid Cap
Market Cap
CMP
Target
Upside
Company
Rationale
(` Cr)
(`)
(`)
(%)
Favorable outlook for the AC industry to augur well for
Cooling products business which is out pacing the market
Blue Star
3,819
425
481
13.3
growth. EMPPAC division's profitability to improve once
operating environment turns around.
With a focus on the low and medium income (LMI) consumer
Dewan Housing
5,982
205
270
31.7
segment, the company has increased its presence in tier-II &
III cities where the growth opportunity is immense.
Commencement of new projects, downtrend in the interest
IL&FS Transport
2,349
71
93
30.3
rate cycle, to lead to stock re-rating
Economic recovery to have favourable impact on advertising
& circulation revenue growth. Further, the acquisition of a
Jagran Prakashan
5,647
173
205
18.7
radio business (Radio City) would also boost the company's
revenue growth.
Speedier execution and speedier sales, strong revenue visibilty
Mahindra Lifespace
1,910
466
554
19.0
in short-to-long run, attractive valuations
Massive capacity expansion along with rail advantage at ICD
Navkar Corporation
2,510
176
265
50.6
as well CFS augurs well for the company
Earnings boost on back of stable material prices and
Radico Khaitan
1,193
90
156
74.0
favourable pricing environment. Valuation discount to peers
provides additional comfort
Strong brands and distribution network would boost growth
Siyaram Silk Mills
1,034
1,104
1,354
22.7
going ahead. Stock currently trades at an inexpensive
valuation.
Source: Company, AngelResearch
Market Outlook
May 13, 2016
Key Upcoming Events
Result Calendar
Date
Company
Bank of Baroda, Union Bank, Allahabad Bank, Central Bank, UCO Bank, Dena Bank, Indraprasth Gas, Cadila
May 13, 2016
Healthcare
May 14, 2016
Electrosteel Castings, Relaxo, Nilkamal
May 16, 2016
JK Tyre, Petronet LNG, Styrolution
May 17, 2016
Motherson Sumi, Bharat Forge, Syndicate Bank, GlaxoSmith Con, MT Educare
May 18, 2016
J K Lakshmi Cements, Punjab Natl.Bank, JSW Steel , Kirloskar Engines India Ltd, PTC India
May 19, 2016
GSPL, Lupin, Dishman Pharma, CESC
May 20, 2016
Ramco Cements, ITC, Britannia, Siyaram Silk Mills, Sterling Tools, Coffee Day Enterprises Ltd
May 20, 2016
Ramco Cements, ITC, Britannia, Siyaram Silk Mills, Sterling Tools, Coffee Day Enterprises Ltd
May 23, 2016
BPCL, Heritage Foods, Tata Power Co., VRL Logistics
May 24, 2016
Tata Global, Amara Raja Batteries, Colgate, Tech Mahindra
May 25, 2016
Bajaj Auto, Bosch India, Cummins India, Thermax, LMW, Hindustan Media Ventures, Tata Steel, GAIL, GSK Pharma
May 26, 2016
Tata Chemicals, Mphasis, HT Media, Finolex Cables, GIPCL
May 27, 2016
BHEL, Rural Elec.Corp., Indoco Remedies
May 28, 2016
Coal India, Hindalco, NHPC
May 30, 2016
Tata Motors, M&M, Blue Star, Bajaj Electrical, Hitachi
Source: Bloomberg, Angel Research
Global economic events release calendar
Date
Time
Country
Event Description
Unit
Period
Bloomberg Data
Last Reported Estimated
May 13, 2016
US
Producer Price Index (mom)
% Change
Apr
0.20
--
11:30AM Germany
GDP nsa (YoY)
% Change
1Q P
2.10
1.20
May 14, 201612:00PM India
Monthly Wholesale Prices YoY%
% Change
Apr
(0.85)
(0.22)
May 16, 201611:00AM China
Industrial Production (YoY)
% Change
Apr
6.80
6.50
May 17, 2016 2:00PM UK
CPI (YoY)
% Change
Apr
0.50
0.50
6:00PM US
Consumer price index (mom)
% Change
Apr
0.10
0.40
6:45PM US
Industrial Production
%
Apr
(0.59)
0.25
6:00PM US
Housing Starts
Thousands
Apr
1,089.00
1,120.00
6:00PM US
Building permits
Thousands
Apr
1,076.00
1,128.00
May 18, 2016 2:30PM Euro Zone
Euro-Zone CPI (YoY)
%
Apr F
(0.20)
(0.20)
2:00PM UK
Jobless claims change
% Change
Apr
6.70
2.00
May 20, 2016 7:30PM US
Existing home sales
Million
Apr
5.33
5.39
May 23, 2016 7:30PM US
New home sales
Thousands
Apr
511.00
--
May 24, 2016 2:00PM UK
GDP (YoY)
% Change
1Q P
2.10
--
May 26, 2016 6:00PM US
GDP Qoq (Annualised)
% Change
1Q S
0.50
--
May 27, 2016 7:30PM Euro Zone
Euro-Zone Consumer Confidence
Value
May A
(9.30)
--
May 31, 2016 1:25PM Germany
Unemployment change (000's)
Thousands
May
(16.00)
--
7:30PM US
Consumer Confidence
S.A./ 1985=100
May
94.20
--
Source: Bloomberg, Angel Research
Market Outlook
May 13, 2016
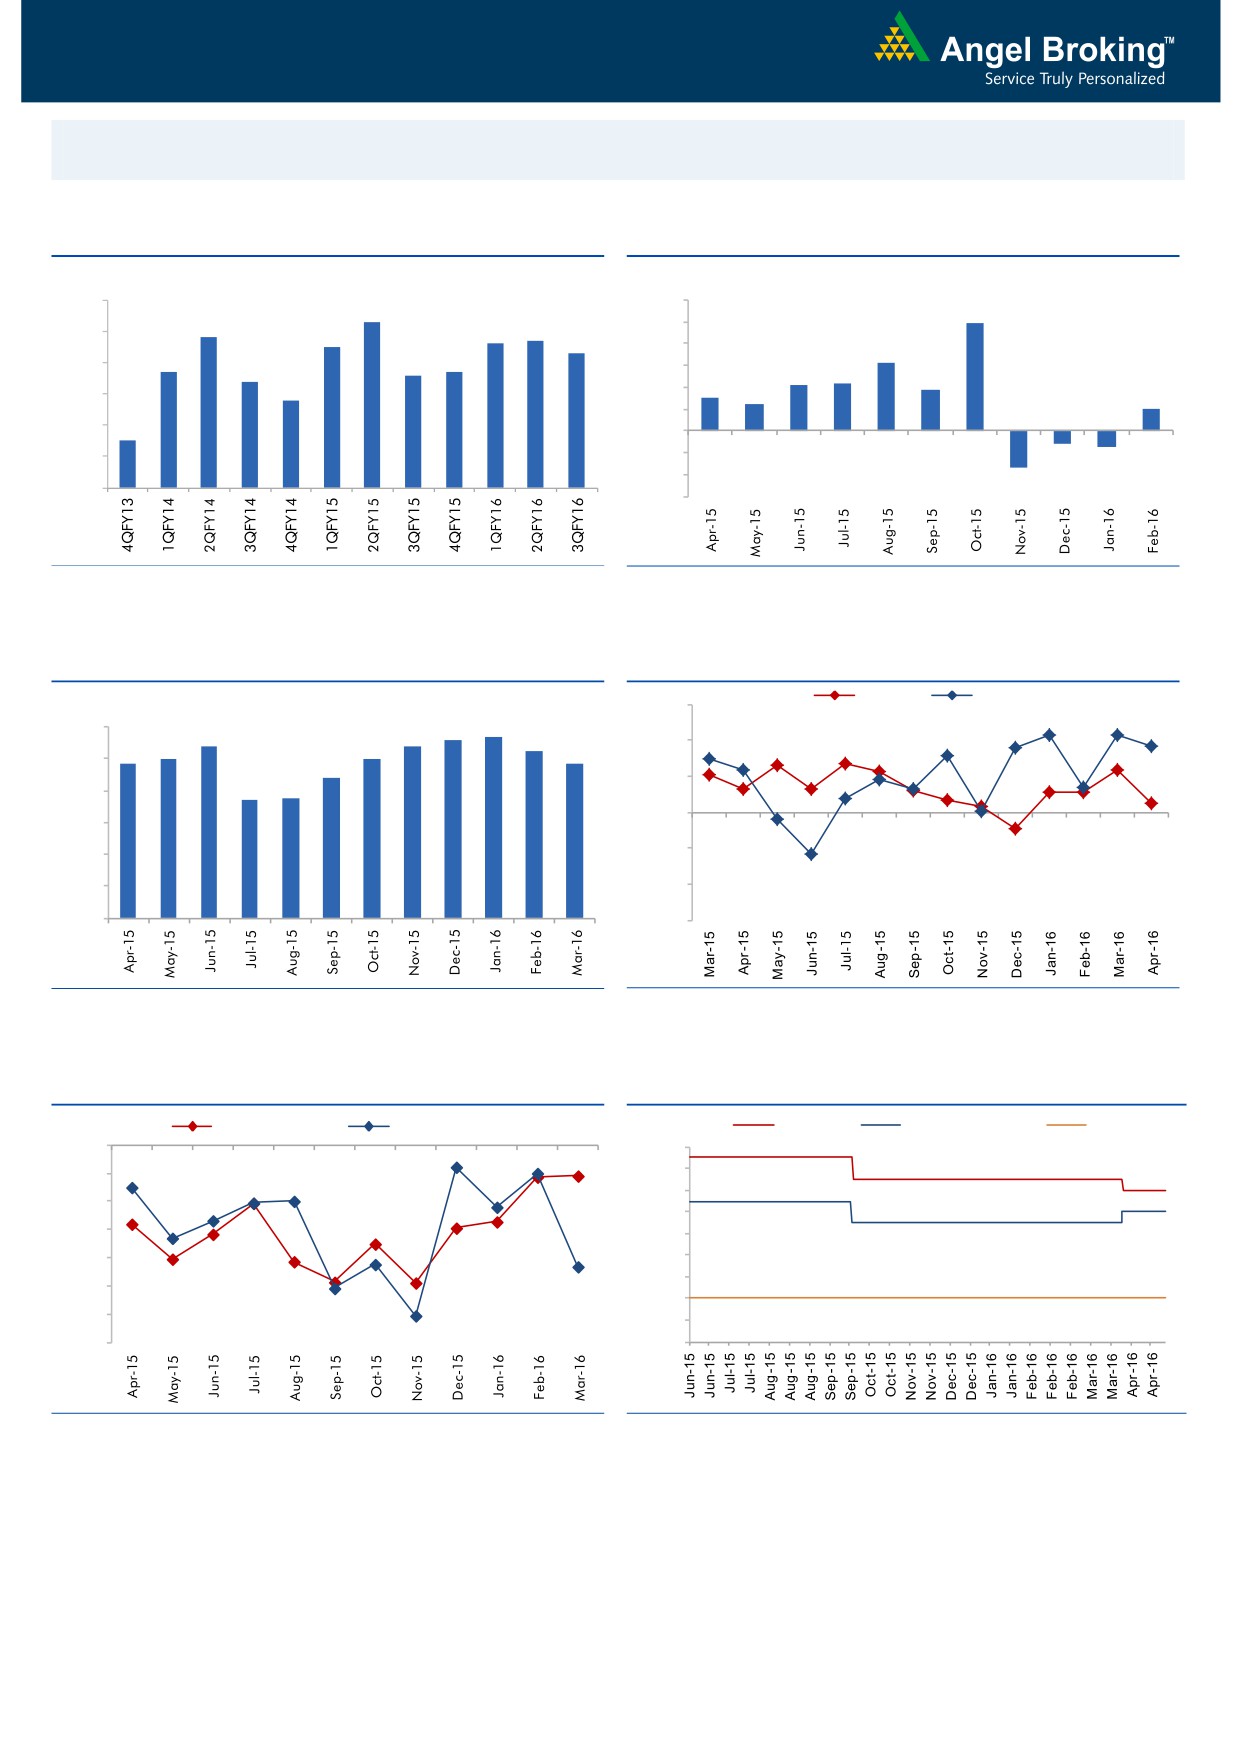
Macro watch
Exhibit 1: Quarterly GDP trends
Exhibit 2: IIP trends
(%)
(%)
9.0
8.3
12.0
9.9
7.8
7.7
10.0
8.0
7.5
7.6
7.3
8.0
6.3
6.7
6.6
6.7
7.0
6.4
6.0
4.2
4.3
3.7
5.8
3.0
2.5
6.0
4.0
2.0
2.0
5.0
4.5
-
4.0
(2.0)
(1.2)
(1.5)
(4.0)
3.0
(3.4)
(6.0)
Source: CSO, Angel Research
Source: MOSPI, Angel Research
Exhibit 3: Monthly CPI inflation trends
Exhibit 4: Manufacturing and services PMI
Mfg. PMI
Services PMI
(%)
56.0
5.6
5.7
6.0
5.4
5.4
5.3
5.0
5.0
54.0
4.9
4.8
5.0
4.4
52.0
3.7
3.7
4.0
50.0
3.0
48.0
2.0
1.0
46.0
-
44.0
Source: MOSPI, Angel Research
Source: Market, Angel Research; Note: Level above 50 indicates expansion
Exhibit 5: Exports and imports growth trends
Exhibit 6: Key policy rates
(%)
Exports yoy growth
Imports yoy growth
(%)
Repo rate
Reverse Repo rate
CRR
0.0
7.50
(5.0)
7.00
6.50
(10.0)
6.00
(15.0)
5.50
(20.0)
5.00
4.50
(25.0)
4.00
(30.0)
3.50
(35.0)
3.00
Source: Bloomberg, Angel Research
Source: RBI, Angel Research
Market Outlook
May 13, 2016
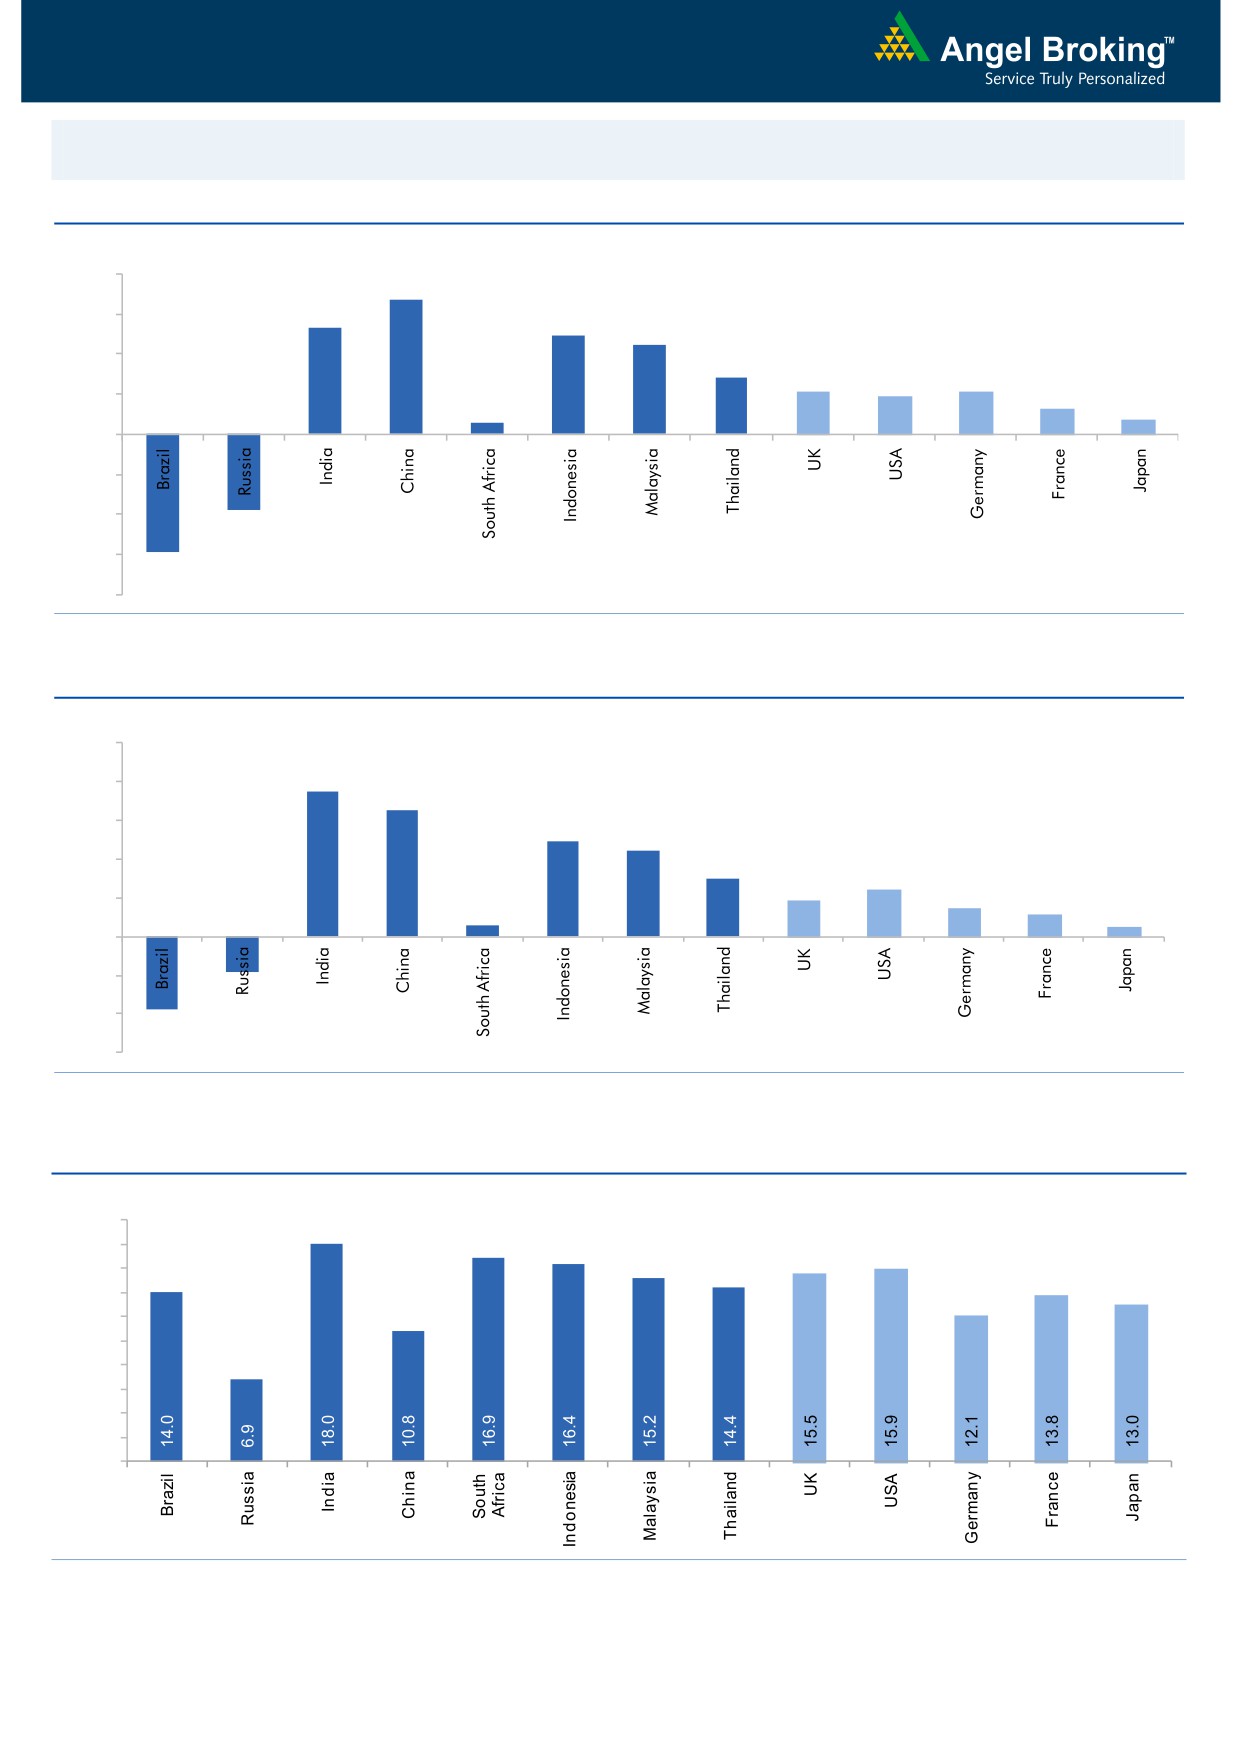
Global watch
Exhibit 1: Latest quarterly GDP Growth (%, yoy) across select developing and developed countries
(%)
8.0
6.7
6.0
5.3
4.9
4.5
4.0
2.8
2.1
1.9
2.1
2.0
1.3
0.6
0.7
-
(2.0)
(4.0)
(3.8)
(6.0)
(5.9)
(8.0)
Source: Bloomberg, Angel Research
Exhibit 2: 2016 GDP Growth projection by IMF (%, yoy) across select developing and developed countries
(%)
10.0
7.5
8.0
6.5
6.0
4.9
4.4
4.0
3.0
2.4
1.9
1.5
2.0
1.1
0.6
0.5
(3.8)
(1.8)
-
(2.0)
(4.0)
(6.0)
Source: IMF, Angel Research
Exhibit 3: One year forward P-E ratio across select developing and developed countries
(x)
20.0
18.0
16.0
14.0
12.0
10.0
8.0
6.0
4.0
2.0
-
Source: IMF, Angel Research
Market Outlook
May 13, 2016
Exhibit 4: Relative performance of indices across globe
Returns (%)
Country
Name of index
Closing price
1M
3M
1YR
Brazil
Bovespa
53,241
6.1
31.9
(6.8)
Russia
Micex
1,902
2.3
6.8
11.6
India
Nifty
7,900
4.7
6.7
(1.9)
China
Shanghai Composite
2,836
(6.0)
2.2
(32.8)
South Africa
Top 40
45,190
(0.1)
1.7
(5.6)
Mexico
Mexbol
45,686
1.3
7.8
0.9
Indonesia
LQ45
826
(0.4)
(1.9)
(5.4)
Malaysia
KLCI
1,649
(3.9)
0.3
(8.6)
Thailand
SET 50
890
(1.0)
9.8
(11.3)
USA
Dow Jones
17,721
(0.0)
11.3
(2.9)
UK
FTSE
6,104
(1.5)
8.4
(12.3)
Japan
Nikkei
16,646
5.9
(2.3)
(17.0)
Germany
DAX
9,862
1.0
9.4
(14.9)
France
CAC
4,293
(1.2)
5.7
(16.6)
Source: Bloomberg, Angel Research
Stock Watch
May 13, 2016
Company Name
Reco
CMP
Target
Mkt Cap
Sales ( Čcr )
OPM(%)
EPS (Č)
PER(x)
P/BV(x)
RoE(%)
EV/Sales(x)
(Č)
Price ( Č)
( Č cr )
FY16E FY17E
FY16E
FY17E
FY16E
FY17E
FY16E
FY17E
FY16E
FY17E
FY16E
FY17E
FY16E
FY17E
Agri / Agri Chemical
Rallis
Neutral
210
-
4,075
1,612
1,911
13.3
13.3
7.4
9.5
28.3
22.1
4.5
4.1
16.7
18.4
2.4
2.0
United Phosphorus
Buy
599
684
25,654
13,083
15,176
18.5
18.5
31.5
37.4
19.0
16.0
3.8
3.1
21.4
21.4
2.1
1.8
Auto & Auto Ancillary
Ashok Leyland
Accumulate
104
111
29,611
17,995
21,544
11.4
11.6
3.4
4.7
30.6
22.1
5.4
4.9
17.7
22.2
1.6
1.3
Bajaj Auto
Accumulate
2,550
2,585
73,802
22,709
25,860
20.9
20.1
129.0
143.6
19.8
17.8
6.1
5.2
30.7
29.4
2.6
2.3
Bharat Forge
Accumulate
775
875
18,036
7,351
8,318
19.9
19.7
31.2
36.5
24.8
21.2
4.4
3.8
19.3
19.2
2.6
2.3
Eicher Motors
Neutral
19,753
-
53,652
15,556
16,747
15.5
17.3
464.8
597.5
42.5
33.1
15.5
11.4
36.2
34.3
3.5
3.2
Gabriel India
Accumulate
89
101
1,280
1,415
1,544
8.7
9.0
4.6
5.4
19.4
16.5
3.5
3.1
18.1
18.9
0.9
0.8
Hero Motocorp
Neutral
2,950
-
58,911
28,244
30,532
15.5
15.9
156.7
168.5
18.8
17.5
7.5
6.4
39.9
36.4
1.9
1.7
Jamna Auto Industries Accumulate
148
160
1,184
1,281
1,473
11.2
11.5
7.6
9.2
19.5
16.1
4.9
4.0
25.4
25.2
0.9
0.8
L G Balakrishnan & Bros Neutral
467
-
732
1,254
1,394
11.6
11.8
35.9
41.7
13.0
11.2
1.8
1.6
13.5
13.8
0.7
0.6
Mahindra and Mahindra Neutral
1,332
-
82,717
38,416
42,904
13.7
13.9
54.8
63.4
24.3
21.0
3.8
3.3
15.4
15.8
1.8
1.6
Maruti
Neutral
3,863
-
116,692
57,865
68,104
16.4
16.7
176.3
225.5
21.9
17.1
4.3
3.6
19.4
21.2
1.8
1.4
Minda Industries
Neutral
1,076
-
1,706
2,523
2,890
8.7
9.0
55.0
65.4
19.6
16.5
3.8
3.1
19.3
18.7
0.7
0.6
Motherson Sumi
Buy
268
313
35,390
39,343
45,100
8.8
9.1
10.1
12.5
26.5
21.4
8.4
6.6
35.3
34.4
0.9
0.8
Rane Brake Lining
Buy
375
465
297
454
511
11.5
12.0
25.2
31.0
14.9
12.1
2.2
2.0
14.9
16.6
0.8
0.7
Setco Automotive
Neutral
31
-
415
594
741
12.7
13.7
1.7
3.2
18.3
9.7
1.9
1.7
10.4
16.9
1.1
0.9
Tata Motors
Neutral
387
-
111,793
259,686
273,957
13.0
13.4
25.9
29.5
15.0
13.1
2.0
1.7
8.0
9.0
0.6
0.6
TVS Motor
Accumulate
296
330
14,051
11,263
13,122
6.9
8.5
9.2
15.0
32.2
19.7
7.3
5.8
22.7
29.6
1.2
1.0
Amara Raja Batteries
Accumulate
949
1,076
16,212
4,892
5,871
17.4
17.6
28.8
37.1
33.0
25.6
7.7
6.2
23.4
24.1
3.2
2.6
Exide Industries
Accumulate
148
162
12,597
6,950
7,784
14.4
14.8
6.6
7.3
22.5
20.3
2.8
2.6
12.6
12.8
1.5
1.3
Apollo Tyres
Buy
159
183
8,073
12,056
12,714
17.2
16.4
23.0
20.3
6.9
7.8
1.2
1.1
17.7
13.6
0.7
0.7
Ceat
Accumulate
1,024
1,119
4,141
6,041
6,597
14.1
13.7
99.5
111.9
10.3
9.2
2.0
1.7
19.6
18.5
0.9
0.7
JK Tyres
Neutral
84
-
1,901
7,446
7,669
15.2
14.0
19.6
18.4
4.3
4.6
1.1
0.9
25.2
19.5
0.6
0.6
Swaraj Engines
Neutral
1,102
-
1,369
552
630
14.2
14.7
44.6
54.1
24.7
20.4
5.7
5.2
23.2
25.6
2.3
2.0
Subros
Neutral
90
-
538
1,293
1,527
11.8
11.9
4.2
6.7
21.4
13.4
1.6
1.5
7.7
11.5
0.7
0.6
Indag Rubber
Neutral
182
-
477
283
329
17.0
17.2
13.0
15.4
14.0
11.8
3.1
2.5
21.8
21.6
1.4
1.1
Capital Goods
ACE
Neutral
42
-
417
660
839
4.7
8.2
1.0
3.9
42.1
10.8
1.3
1.2
3.2
11.3
0.8
0.6
BEML
Buy
918
1,157
3,822
3,277
4,006
6.0
8.9
36.2
64.3
25.4
14.3
1.8
1.6
5.7
11.7
1.2
1.0
Bharat Electronics
Buy
1,160
1,414
27,841
7,737
8,634
16.8
17.2
54.0
61.5
21.5
18.9
3.1
2.7
39.3
45.6
2.7
2.3
Stock Watch
May 13, 2016
Company Name
Reco
CMP
Target
Mkt Cap
Sales ( Čcr )
OPM(%)
EPS (Č)
PER(x)
P/BV(x)
RoE(%)
EV/Sales(x)
(Č)
Price ( Č)
( Č cr )
FY16E
FY17E
FY16E
FY17E
FY16E
FY17E
FY16E
FY17E
FY16E
FY17E
FY16E
FY17E
FY16E
FY17E
Capital Goods
Voltas
Accumulate
325
353
10,762
5,363
5,963
8.0
9.1
11.0
13.8
29.6
23.6
4.5
4.0
16.2
17.9
1.9
1.7
BGR Energy
Neutral
113
-
812
3,615
3,181
9.5
9.4
16.7
12.4
6.7
9.1
0.6
0.6
10.0
7.0
0.6
0.8
BHEL
Neutral
126
-
30,803
33,722
35,272
10.8
11.7
10.5
14.2
12.0
8.9
0.9
0.8
7.0
9.0
1.0
1.0
Blue Star
Accumulate
425
481
3,819
3,548
3,977
6.3
6.9
13.7
17.2
31.0
24.7
7.8
5.1
26.1
25.4
1.2
1.0
Crompton Greaves
Neutral
64
-
3,983
13,484
14,687
4.9
6.2
4.5
7.1
14.1
9.0
1.0
0.9
7.2
10.8
0.4
0.4
Greaves Cotton
Neutral
145
-
3,541
1,655
1,755
16.6
16.8
7.4
7.8
19.6
18.6
3.9
3.7
21.1
20.6
2.1
1.9
Inox Wind
Buy
237
286
5,254
4,406
5,605
15.5
15.7
20.4
24.8
11.6
9.6
2.7
2.0
27.9
25.9
1.4
1.1
KEC International
Neutral
131
-
3,358
8,791
9,716
6.1
6.8
5.4
8.2
24.2
15.9
2.4
2.2
10.0
14.0
0.6
0.6
Thermax
Neutral
770
-
9,169
6,413
7,525
7.4
8.5
30.5
39.3
25.2
19.6
3.9
3.4
15.0
17.0
1.4
1.1
VATech Wabag
Neutral
592
-
3,228
2,722
3,336
7.9
8.1
19.5
24.6
30.4
24.1
3.2
2.8
11.1
12.4
1.3
1.0
Cement
ACC
Neutral
1,463
-
27,459
13,151
14,757
16.4
18.3
63.9
83.4
22.9
17.5
2.9
2.7
13.3
16.1
1.9
1.6
Ambuja Cements
Neutral
221
-
34,243
11,564
12,556
19.4
20.7
8.9
10.1
24.8
21.9
3.1
2.9
12.8
13.8
2.6
2.4
HeidelbergCement
Neutral
99
-
2,241
1,772
1,926
13.3
15.4
1.0
3.0
98.9
33.0
2.5
2.3
2.6
7.9
1.9
1.6
India Cements
Neutral
92
-
2,829
4,216
4,840
18.0
19.5
4.0
9.9
23.0
9.3
0.9
0.9
4.0
9.5
1.0
0.8
JK Cement
Accumulate
587
605
4,108
3,661
4,742
10.1
15.8
7.5
28.5
78.3
20.6
2.4
2.1
7.5
22.9
1.5
1.2
J K Lakshmi Cement
Neutral
346
-
4,066
2,947
3,616
16.7
19.9
11.5
27.2
30.1
12.7
2.9
2.5
9.8
20.8
1.8
1.4
Mangalam Cements
Neutral
264
-
706
1,053
1,347
10.5
13.3
8.4
26.0
31.5
10.2
1.3
1.2
4.3
12.5
1.1
0.8
Orient Cement
Neutral
155
-
3,173
1,854
2,524
21.2
22.2
7.7
11.1
20.1
14.0
2.9
2.5
13.3
15.7
2.4
1.7
Ramco Cements
Neutral
487
-
11,585
4,036
4,545
20.8
21.3
15.1
18.8
32.2
25.9
3.9
3.5
12.9
14.3
3.4
3.0
Shree Cement^
Neutral
13,496
-
47,018
7,150
8,742
26.7
28.6
228.0
345.5
59.2
39.1
8.7
7.3
15.7
20.3
6.3
5.0
UltraTech Cement
Neutral
3,221
-
88,405
24,669
29,265
18.2
20.6
82.0
120.0
39.3
26.8
4.2
3.7
11.3
14.7
3.6
3.1
Construction
ITNL
Buy
71
93
2,349
7,360
8,825
34.0
35.9
7.0
9.0
10.2
7.9
0.4
0.3
3.2
3.7
3.7
3.6
KNR Constructions
Accumulate
520
603
1,462
937
1,470
14.3
14.0
44.2
38.6
11.8
13.5
2.4
2.0
15.4
15.4
1.7
1.1
Larsen & Toubro
Neutral
1,318
-
122,783
58,870
65,708
8.3
10.3
42.0
53.0
31.4
24.9
2.2
2.0
8.8
11.2
2.3
2.1
Gujarat Pipavav Port
Neutral
160
-
7,733
629
684
51.0
52.2
6.4
5.9
25.0
27.1
3.3
3.0
15.9
12.7
12.0
10.8
MBL Infrastructures
Buy
131
285
542
2,313
2,797
12.2
14.6
19.0
20.0
6.9
6.5
0.7
0.7
11.3
10.6
0.9
0.8
Nagarjuna Const.
Neutral
78
-
4,320
7,892
8,842
8.8
9.1
3.0
5.3
25.9
14.7
1.3
1.2
5.0
8.5
0.8
0.7
PNC Infratech
Neutral
537
-
2,753
1,873
2,288
13.2
13.5
24.0
32.0
22.4
16.8
2.2
1.9
12.1
12.3
1.6
1.3
Simplex Infra
Neutral
274
-
1,358
5,955
6,829
10.3
10.5
16.0
31.0
17.2
8.9
0.9
0.8
5.3
9.9
0.7
0.6
Stock Watch
May 13, 2016
Company Name
Reco
CMP
Target
Mkt Cap
Sales ( Čcr )
OPM(%)
EPS (Č)
PER(x)
P/BV(x)
RoE(%)
EV/Sales(x)
(Č)
Price ( Č)
( Č cr )
FY16E
FY17E
FY16E
FY17E
FY16E
FY17E
FY16E
FY17E
FY16E
FY17E
FY16E
FY17E
FY16E
FY17E
Construction
Power Mech Projects
Neutral
598
-
879
1,539
1,801
12.8
12.7
59.0
72.1
10.1
8.3
1.5
1.3
18.6
16.8
0.6
0.5
Sadbhav Engineering
Accumulate
281
298
4,828
3,186
3,598
10.2
10.3
8.0
9.0
35.2
31.3
3.3
2.9
9.4
9.9
1.8
1.6
NBCC
Accumulate
978
1,089
11,740
5,816
7,382
6.9
7.7
29.6
39.8
33.1
24.6
5.9
4.7
24.1
26.7
1.7
1.3
MEP Infra
Neutral
41
-
666
1,956
1,876
28.1
30.5
1.3
3.0
31.5
13.7
6.6
4.5
21.2
32.8
1.8
1.7
SIPL
Neutral
99
-
3,491
675
1,042
62.4
64.7
-
-
3.7
4.2
-
-
16.9
11.4
Engineers India
Neutral
186
-
6,265
1,667
1,725
13.5
16.0
9.7
11.4
19.2
16.3
2.3
2.2
11.7
13.4
2.5
2.5
Financials
Allahabad Bank
Neutral
53
-
3,278
8,569
9,392
2.8
2.9
16.3
27.5
3.3
1.9
0.3
0.2
7.6
11.9
-
-
Axis Bank
Neutral
492
-
117,436
26,204
29,738
3.6
3.5
34.5
35.4
14.3
13.9
2.3
2.0
16.8
14.9
-
-
Bank of Baroda
Neutral
158
-
36,337
18,802
21,088
2.0
2.2
(7.4)
13.0
12.1
1.3
1.0
(4.2)
7.3
-
-
Bank of India
Neutral
87
-
7,112
15,972
17,271
1.9
2.0
15.3
33.4
5.7
2.6
0.3
0.2
3.6
7.6
-
-
Canara Bank
Neutral
189
-
10,235
15,441
16,945
2.0
2.1
46.6
70.4
4.1
2.7
0.4
0.3
8.0
11.2
-
-
Dena Bank
Neutral
29
-
1,954
3,440
3,840
2.1
2.3
7.3
10.0
4.0
2.9
0.3
0.3
6.1
7.9
-
-
Dewan Housing Finance Buy
205
270
5,982
1,828
2,225
2.9
3.0
24.9
29.7
8.2
6.9
1.3
1.1
15.1
16.1
-
-
Federal Bank
Neutral
49
-
8,393
3,279
3,787
2.8
2.9
3.9
5.5
12.4
8.8
1.0
0.9
8.4
10.8
-
-
HDFC
Neutral
1,195
-
188,846
10,358
11,852
3.3
3.3
41.1
47.0
29.1
25.4
5.5
5.0
24.7
24.9
-
-
HDFC Bank
Accumulate
1,150
1,262
290,837
38,606
47,696
4.4
4.5
48.8
61.4
23.6
18.7
4.0
3.5
18.7
20.0
-
-
ICICI Bank
Accumulate
232
243
134,833
34,279
39,262
3.3
3.3
21.0
24.4
11.1
9.5
1.9
1.6
14.4
14.7
-
-
IDBI Bank
Neutral
68
-
14,051
9,625
10,455
1.8
1.8
8.5
14.2
8.0
4.8
0.5
0.5
5.9
9.3
-
-
Indian Bank
Neutral
86
-
4,123
6,160
6,858
2.5
2.5
24.5
29.8
3.5
2.9
0.3
0.3
7.7
8.6
-
-
LIC Housing Finance
Buy
468
592
23,631
3,179
3,758
2.6
2.6
32.9
40.6
14.2
11.5
2.6
2.2
19.6
20.7
-
-
Oriental Bank
Neutral
84
-
2,709
7,643
8,373
2.4
2.4
37.2
45.4
2.3
1.9
0.2
0.2
8.2
9.4
-
-
Punjab Natl.Bank
Neutral
80
-
15,611
23,122
26,022
2.8
2.8
7.0
21.6
11.4
3.7
0.6
0.5
3.4
10.0
-
-
South Ind.Bank
Neutral
18
-
2,424
1,965
2,185
2.5
2.5
2.5
3.3
7.2
5.4
0.7
0.6
9.5
11.7
-
-
St Bk of India
Neutral
188
-
146,251
79,958
86,061
2.6
2.6
13.4
20.7
14.1
9.1
1.2
1.1
11.5
12.8
-
-
Union Bank
Neutral
118
-
8,122
12,646
14,129
2.3
2.4
31.0
39.1
3.8
3.0
0.4
0.4
9.8
11.4
-
-
Vijaya Bank
Neutral
32
-
2,998
3,536
3,827
1.9
1.9
5.5
6.7
5.8
4.8
0.5
0.4
7.8
8.8
-
-
Yes Bank
Neutral
955
-
40,180
7,190
9,011
3.2
3.3
58.2
69.7
16.4
13.7
2.9
2.5
19.2
19.6
-
-
FMCG
Asian Paints
Neutral
927
-
88,894
16,553
19,160
16.0
16.2
17.7
21.5
52.4
43.1
13.9
12.5
29.4
31.2
5.1
4.4
Britannia
Neutral
2,936
-
35,223
8,481
9,795
14.0
14.1
65.5
78.3
44.8
37.5
21.2
17.4
38.3
41.2
4.0
3.4
Stock Watch
May 13, 2016
Company Name
Reco
CMP
Target
Mkt Cap
Sales ( Čcr )
OPM(%)
EPS (Č)
PER(x)
P/BV(x)
RoE(%)
EV/Sales(x)
(Č)
Price ( Č)
( Č cr )
FY16E FY17E
FY16E
FY17E
FY16E
FY17E
FY16E
FY17E
FY16E
FY17E
FY16E
FY17E
FY16E
FY17E
FMCG
Colgate
Neutral
837
-
22,767
4,136
4,632
22.5
23.3
22.2
25.3
37.7
33.1
22.9
20.4
68.6
67.5
5.4
4.8
Dabur India
Neutral
291
-
51,209
9,370
10,265
17.6
17.3
7.3
8.1
39.7
35.9
10.3
9.4
31.7
30.6
5.3
4.8
GlaxoSmith Con*
Neutral
6,059
-
25,480
4,519
5,142
19.6
19.8
164.3
191.2
36.9
31.7
10.2
8.7
30.8
29.9
5.0
4.4
Godrej Consumer
Neutral
1,438
-
48,952
9,003
10,335
18.1
18.7
34.1
41.8
42.2
34.4
9.1
7.8
23.9
24.8
5.4
4.7
HUL
Neutral
853
-
184,616
33,299
35,497
17.1
17.1
18.9
20.0
45.1
42.7
22.9
26.3
87.6
80.8
5.4
5.1
ITC
Accumulate
319
359
256,706
36,804
38,776
37.9
37.9
12.2
12.9
26.2
24.7
7.3
6.4
27.7
25.8
6.5
6.2
Marico
Neutral
254
-
32,751
6,151
6,966
17.2
17.3
5.4
6.4
47.0
39.7
14.8
11.6
33.2
32.4
5.2
4.6
Nestle*
Neutral
5,704
-
54,994
9,393
10,507
22.2
22.3
106.8
121.8
53.4
46.8
18.8
16.9
34.8
36.7
5.5
4.9
Tata Global
Buy
119
137
7,507
8,635
9,072
9.8
9.9
5.8
7.2
20.5
16.5
1.8
1.8
6.8
7.4
0.9
0.8
Procter & Gamble
Accumulate
6,496
7,369
21,087
2,588
2,939
23.3
23.2
130.2
146.2
49.9
44.5
99.5
95.4
27.6
25.3
7.6
6.6
Hygiene
IT
HCL Tech^
Buy
716
1,038
100,989
42,038
47,503
21.2
21.5
51.5
57.7
13.9
12.4
3.0
2.3
21.5
18.8
2.0
1.6
Infosys
Accumulate
1,210
1,374
278,884
62,441
70,558
27.5
27.5
59.0
65.3
20.5
18.5
4.1
3.8
22.2
22.4
3.9
3.3
TCS
Buy
2,567
3,004
505,819
108,646
122,770
28.3
28.3
123.7
141.0
20.8
18.2
6.9
6.3
33.1
34.6
4.1
3.6
Tech Mahindra
Accumulate
481
530
46,686
26,524
29,177
16.2
17.0
28.8
33.6
16.7
14.3
3.2
2.7
19.3
19.1
1.5
1.3
Wipro
Buy
542
680
133,937
50,808
56,189
23.7
23.8
37.3
40.7
14.5
13.3
2.8
2.5
19.2
17.7
2.1
1.7
Media
D B Corp
Accumulate
330
356
6,064
2,025
2,187
27.4
27.4
17.4
18.9
19.0
17.5
4.3
3.9
22.9
23.7
2.9
2.7
HT Media
Neutral
89
-
2,070
2,495
2,673
12.9
13.2
6.8
7.2
13.1
12.4
1.0
1.0
7.5
7.8
0.4
0.3
Jagran Prakashan
Buy
173
205
5,647
2,170
2,355
27.2
26.2
8.9
9.9
19.4
17.5
4.1
3.6
20.9
20.5
2.5
2.3
Sun TV Network
Neutral
381
-
15,017
2,510
2,763
71.8
71.5
21.9
24.8
17.4
15.4
4.1
3.7
22.8
24.3
5.3
4.8
Hindustan Media
Neutral
270
-
1,982
914
1,016
21.7
21.5
21.9
23.3
12.3
11.6
2.2
1.9
18.0
16.2
1.6
1.3
Ventures
Metals & Mining
Coal India
Buy
284
380
179,353
76,167
84,130
19.9
22.3
22.4
25.8
12.7
11.0
4.6
4.5
35.5
41.0
1.7
1.5
Hind. Zinc
Neutral
168
-
70,901
14,641
14,026
50.4
50.4
17.7
16.0
9.5
10.5
1.5
1.3
16.2
13.2
2.4
2.3
Hindalco
Neutral
93
-
19,287
104,356
111,186
8.7
9.5
6.7
11.1
13.9
8.5
0.5
0.5
3.5
5.9
0.7
0.6
JSW Steel
Neutral
1,283
-
31,007
42,308
45,147
16.4
20.7
(10.3)
49.5
25.9
1.4
1.4
(1.0)
5.6
1.8
1.7
NMDC
Neutral
91
-
35,920
8,237
10,893
46.6
44.5
10.0
11.7
9.1
7.8
1.0
0.9
12.5
13.0
4.1
3.1
SAIL
Neutral
42
-
17,532
45,915
53,954
7.2
10.5
1.5
4.4
28.2
9.7
0.4
0.4
2.3
4.1
1.0
0.9
Vedanta
Neutral
103
-
30,507
71,445
81,910
26.2
26.3
12.9
19.2
8.0
5.4
0.6
0.5
7.2
8.9
0.9
0.7
Tata Steel
Neutral
331
-
32,128
126,760
137,307
8.9
11.3
6.4
23.1
52.0
14.3
1.0
1.0
2.0
7.1
0.8
0.8
Oil & Gas
Cairn India
Neutral
137
-
25,648
11,323
12,490
49.4
51.0
20.7
20.7
6.6
6.6
0.4
0.4
6.4
6.1
1.3
0.7
Stock Watch
May 13, 2016
Company Name
Reco
CMP
Target
Mkt Cap
Sales ( Čcr )
OPM(%)
EPS (Č)
PER(x)
P/BV(x)
RoE(%)
EV/Sales(x)
(Č)
Price ( Č)
( Č cr )
FY16E FY17E
FY16E
FY17E
FY16E
FY17E
FY16E
FY17E
FY16E
FY17E
FY16E
FY17E
FY16E
FY17E
Oil & Gas
GAIL
Neutral
388
-
49,192
64,856
70,933
9.1
9.6
24.0
28.9
16.2
13.4
1.4
1.3
8.8
9.6
0.9
0.8
ONGC
Neutral
207
-
176,842
154,564
145,998
36.8
37.4
20.8
22.6
10.0
9.2
0.9
0.9
10.1
9.7
1.4
1.5
Petronet LNG
Neutral
283
-
21,199
29,691
31,188
5.8
6.2
12.8
13.4
22.1
21.1
3.3
2.9
15.8
14.8
0.8
0.7
Indian Oil Corp
Accumulate
415
455
100,711
359,607
402,760
5.9
6.1
42.5
48.7
9.8
8.5
1.3
1.2
14.1
14.4
0.4
0.3
Reliance Industries
Buy
991
1,150
321,228
304,775
344,392
12.6
13.4
91.3
102.6
10.9
9.7
1.2
1.1
11.8
12.0
1.0
0.8
Pharmaceuticals
Alembic Pharma
Neutral
579
-
10,907
3,274
3,802
26.9
19.4
35.0
28.7
16.5
20.2
7.3
5.5
55.6
31.2
3.3
2.8
Aurobindo Pharma
Neutral
801
-
46,893
14,923
17,162
22.0
23.0
35.7
42.8
22.5
18.7
6.6
5.0
34.0
30.2
3.6
3.1
Aventis*
Accumulate
4,316
4,738
9,940
2,049
2,375
15.4
17.3
115.4
153.5
37.4
28.1
6.1
4.8
19.3
25.8
4.6
3.9
Cadila Healthcare
Accumulate
333
352
34,137
10,224
11,840
21.0
22.0
14.6
17.6
22.8
19.0
6.3
4.9
30.8
29.0
3.4
2.8
Cipla
Accumulate
535
605
42,957
13,979
16,447
20.2
18.6
25.7
27.5
20.8
19.4
3.4
2.9
17.6
16.1
3.1
2.6
Dr Reddy's
Buy
2,974
3,933
50,716
16,838
19,575
25.0
23.1
167.5
178.8
17.8
16.6
3.7
3.1
23.1
20.4
2.8
2.4
Dishman Pharma
Neutral
167
-
2,692
1,733
1,906
21.5
21.5
10.1
10.0
16.5
16.7
1.9
1.8
10.5
11.2
2.0
1.7
GSK Pharma*
Neutral
3,462
-
29,320
2,870
3,158
20.0
22.1
59.5
68.3
58.2
50.7
17.2
17.6
28.5
34.3
9.8
9.0
Indoco Remedies
Neutral
264
-
2,429
1,033
1,199
15.9
18.2
9.4
13.6
28.0
19.4
4.2
3.5
15.7
19.7
2.4
2.1
Ipca labs
Buy
468
750
5,902
3,363
3,909
12.9
18.6
13.4
28.0
34.9
16.7
2.5
2.2
7.4
14.0
2.1
1.8
Lupin
Neutral
1,614
-
72,727
13,092
16,561
25.0
27.0
50.4
68.3
32.0
23.6
6.6
5.2
22.8
24.7
5.2
4.0
Sun Pharma
Buy
804
950
193,414
28,163
32,610
25.8
30.7
17.4
26.9
46.2
29.9
4.4
3.8
13.0
16.6
6.3
5.2
Power
Tata Power
Neutral
71
-
19,162
35,923
37,402
22.6
22.8
4.1
5.2
17.5
13.8
1.3
1.3
7.5
9.3
1.5
1.4
NTPC
Neutral
141
-
116,550
87,271
99,297
23.5
23.5
11.8
13.3
12.0
10.6
1.3
1.3
11.5
12.2
2.4
2.1
Power Grid
Buy
144
170
75,178
20,702
23,361
86.7
86.4
12.1
13.2
11.9
10.9
1.8
1.6
15.6
15.1
8.5
7.9
Real Estate
MLIFE
Buy
466
554
1,910
826
1,133
20.1
21.8
22.6
30.7
20.6
15.2
1.2
1.1
6.0
7.4
4.2
2.9
Telecom
Bharti Airtel
Neutral
362
-
144,826
101,748
109,191
32.1
31.7
12.0
12.5
30.2
29.0
2.1
2.0
6.9
6.7
2.0
1.9
Idea Cellular
Neutral
112
-
40,290
34,282
36,941
32.0
31.5
5.9
6.2
19.0
18.1
1.7
1.6
9.9
9.3
1.7
1.7
zOthers
Abbott India
Neutral
4,731
-
10,054
2,715
3,153
14.5
14.1
134.3
152.2
35.2
31.1
8.8
7.2
27.4
25.6
3.4
2.8
Bajaj Electricals
Neutral
232
-
2,346
4,719
5,287
5.2
5.8
8.6
12.7
27.2
18.4
3.1
2.7
11.4
14.8
0.5
0.4
Finolex Cables
Neutral
292
-
4,463
2,520
2,883
12.2
12.0
12.7
14.2
23.0
20.6
3.1
2.8
13.6
13.5
1.5
1.3
Goodyear India*
Buy
509
582
1,174
1,800
1,600
11.7
11.5
58.7
52.9
8.7
9.6
1.9
1.7
24.6
18.7
0.4
0.4
Hitachi
Neutral
1,394
-
3,789
1,779
2,081
7.8
8.8
21.8
33.4
63.9
41.7
10.3
8.3
17.4
22.1
2.2
1.9
Jyothy Laboratories
Neutral
319
-
5,780
1,620
1,847
11.5
11.5
7.3
8.5
43.8
37.7
5.7
5.2
13.3
14.4
3.4
2.9
Stock Watch
May 13, 2016
Company Name
Reco
CMP
Target
Mkt Cap
Sales ( Čcr )
OPM(%)
EPS (Č)
PER(x)
P/BV(x)
RoE(%)
EV/Sales(x)
(Č)
Price ( Č)
( Č cr )
FY16E
FY17E
FY16E
FY17E
FY16E
FY17E
FY16E
FY17E
FY16E
FY17E
FY16E
FY17E
FY16E
FY17E
zOthers
MRF
Buy
33,240
45,575
14,098
20,316
14,488
21.4
21.1
5,488.0
3,798.0
6.1
8.8
2.1
1.7
41.1
21.2
0.6
0.8
Page Industries
Neutral
12,999
-
14,499
1,929
2,450
19.8
20.1
229.9
299.0
56.5
43.5
25.0
17.3
52.1
47.1
7.6
5.9
Relaxo Footwears
Neutral
509
-
6,114
1,767
2,152
12.3
12.5
19.3
25.1
26.5
20.3
6.5
5.0
27.7
27.8
3.5
2.8
Siyaram Silk Mills
Buy
1,104
1,354
1,034
1,636
1,815
11.5
11.5
89.9
104.1
12.3
10.6
2.0
1.8
17.9
17.8
0.8
0.7
Styrolution ABS India* Neutral
623
-
1,095
1,271
1,440
8.6
9.2
32.0
41.1
19.4
15.2
2.0
1.8
10.7
12.4
0.8
0.7
TVS Srichakra
Buy
2,496
3,217
1,911
2,035
2,252
15.9
15.3
248.6
268.1
10.0
9.3
4.4
3.2
43.6
33.9
1.0
0.8
HSIL
Neutral
307
-
2,219
2,123
2,384
16.1
16.5
15.0
18.9
20.4
16.3
1.6
1.5
8.0
9.4
1.4
1.2
Kirloskar Engines India
Neutral
236
-
3,416
2,403
2,554
8.6
9.9
9.2
10.5
25.7
22.5
2.5
2.4
9.7
10.7
1.1
1.0
Ltd
M M Forgings
Buy
459
546
553
511
615
21.7
21.6
43.1
55.8
10.6
8.2
1.9
1.6
19.9
21.2
1.3
1.0
Banco Products (India) Neutral
130
-
927
1,208
1,353
11.0
12.3
10.8
14.5
12.0
9.0
1.4
1.2
11.9
14.5
0.7
0.6
Competent Automobiles Neutral
151
-
93
1,040
1,137
3.2
3.1
25.7
28.0
5.9
5.4
0.9
0.8
15.0
14.3
0.1
0.1
Nilkamal
Neutral
1,272
-
1,899
1,871
2,031
10.7
10.5
63.2
69.8
20.1
18.2
3.3
2.8
17.6
16.6
1.1
0.9
Visaka Industries
Buy
128
143
203
1,020
1,120
8.7
9.1
13.9
20.1
9.2
6.4
0.6
0.6
6.4
8.7
0.4
0.4
Transport Corporation of
Neutral
260
-
1,978
2,830
3,350
8.8
9.0
14.4
18.3
18.1
14.2
2.8
2.4
15.4
17.1
0.8
0.7
India
Elecon Engineering
Neutral
63
-
688
1,359
1,482
10.3
13.7
0.8
3.9
78.7
16.2
1.3
1.2
1.6
7.8
0.9
0.8
Surya Roshni
Buy
151
201
660
2,992
3,223
8.1
8.4
14.7
18.3
10.3
8.2
1.0
0.9
9.7
11.0
0.5
0.5
MT Educare
Neutral
188
-
748
286
366
18.3
17.7
7.7
9.4
24.3
20.1
5.1
4.5
20.2
21.1
2.6
2.0
Radico Khaitan
Buy
90
156
1,193
1,517
1,635
12.7
13.4
5.8
7.1
15.4
12.6
1.3
1.2
8.6
9.6
1.3
1.2
Garware Wall Ropes
Buy
350
473
765
862
974
11.2
11.2
24.9
29.6
14.1
11.8
2.1
1.8
15.1
15.4
0.9
0.7
Wonderla Holidays
Neutral
379
-
2,141
206
308
44.0
43.6
9.0
12.9
42.1
29.4
5.8
5.2
13.7
17.8
10.3
6.8
Linc Pen & Plastics
Neutral
193
-
285
340
371
8.3
8.9
10.8
13.2
17.8
14.6
2.9
2.5
16.0
17.1
0.9
0.8
The Byke Hospitality
Neutral
156
-
625
222
287
20.5
20.5
5.6
7.6
27.7
20.6
5.2
4.3
18.9
20.8
2.8
2.2
Interglobe Aviation
Neutral
1,045
-
37,657
17,022
21,122
20.7
14.5
63.9
53.7
16.4
19.5
24.5
20.1
149.9
103.2
2.3
1.8
Coffee Day Enterprises
Neutral
264
-
5,448
2,692
2,964
17.0
18.6
-
4.7
-
55.8
3.2
3.1
0.2
5.5
2.4
2.2
Ltd
Navneet Education
Neutral
89
-
2,130
998
1,062
24.1
24.0
5.8
6.1
15.5
14.7
3.4
3.0
22.0
20.6
2.2
2.1
Navkar Corporation
Buy
176
265
2,510
365
436
38.3
37.5
5.6
5.9
31.2
29.9
2.0
1.8
6.3
6.1
7.7
6.6
UFO Moviez
Neutral
525
-
1,449
558
619
32.0
33.2
22.5
30.0
23.3
17.5
2.8
2.4
12.0
13.8
2.5
2.1
VRL Logistics
Neutral
398
-
3,634
1,725
1,902
16.5
16.7
12.2
14.6
32.7
27.3
6.8
6.0
20.8
21.9
2.2
2.0
Team Lease Serv.
Neutral
890
-
1,521
2,565
3,229
1.3
1.5
15.2
22.8
58.6
39.1
4.7
4.2
8.0
10.7
0.5
0.4
Stock Watch
May 13, 2016
Company Name
Reco
CMP
Target Mkt Cap
Sales ( Čcr )
OPM(%)
EPS (Č)
PER(x)
P/BV(x)
RoE(%)
EV/Sales(x)
(Č)
Price ( Č)
( Č cr )
FY16E FY17E FY16E FY17E FY16E FY17E FY16E FY17E FY16E FY17E FY16E FY17E FY16E FY17E
zOthers
S H Kelkar & Co.
Neutral
222
-
3,208
928
1,036
15.3
15.1
4.9
6.1
44.9
36.3
4.2
3.9
9.4
10.7
3.4
3.0
Quick Heal
Neutral
256
-
1,795
339
408
27.8
27.3
7.1
7.7
36.2
33.1
3.1
3.1
8.5
9.3
4.5
3.7
Narayana Hrudaya
Neutral
307
-
6,275
1,603
1,873
10.9
11.5
1.0
2.6
322.3
116.1
7.8
7.1
2.4
6.1
4.0
3.4
Manpasand Bever.
Neutral
537
-
2,687
540
836
19.9
19.6
10.2
16.9
52.4
31.8
4.2
3.8
8.1
12.0
4.7
3.0
Source: Company, Angel Research; Note: *December year end; #September year end; &October year end; Price as on May 12, 2016
Market Outlook
May 13, 2016
Research Team Tel: 022 - 39357800
DISCLAIMER
Angel Broking Private Limited (hereinafter referred to as “Angel”) is a registered Member of National Stock Exchange of India Limited,
Bombay Stock Exchange Limited and Metropolitian Stock Exchange of India Limited. It is also registered as a Depository Participant with
CDSL and Portfolio Manager with SEBI. It also has registration with AMFI as a Mutual Fund Distributor. Angel Broking Private Limited is a
registered entity with SEBI for Research Analyst in terms of SEBI (Research Analyst) Regulations, 2014 vide registration number
INH000000164. Angel or its associates has not been debarred/ suspended by SEBI or any other regulatory authority for accessing
/dealing in securities Market. Angel or its associates including its relatives/analyst do not hold any financial interest/beneficial ownership
of more than 1% in the company covered by Analyst. Angel or its associates/analyst has not received any compensation / managed or co
-managed public offering of securities of the company covered by Analyst during the past twelve months. Angel/analyst has not served as
an officer, director or employee of company covered by Analyst and has not been engaged in market making activity of the company
covered by Analyst.
This document is solely for the personal information of the recipient, and must not be singularly used as the basis of any investment
decision. Nothing in this document should be construed as investment or financial advice. Each recipient of this document should make
such investigations as they deem necessary to arrive at an independent evaluation of an investment in the securities of the companies
referred to in this document (including the merits and risks involved), and should consult their own advisors to determine the merits and
risks of such an investment.
Reports based on technical and derivative analysis center on studying charts of a stock's price movement, outstanding positions and
trading volume, as opposed to focusing on a company's fundamentals and, as such, may not match with a report on a company's
fundamentals.
The information in this document has been printed on the basis of publicly available information, internal data and other reliable sources
believed to be true, but we do not represent that it is accurate or complete and it should not be relied on as such, as this document is for
general guidance only. Angel Broking Pvt. Limited or any of its affiliates/ group companies shall not be in any way responsible for any
loss or damage that may arise to any person from any inadvertent error in the information contained in this report. Angel Broking Pvt.
Limited has not independently verified all the information contained within this document. Accordingly, we cannot testify, nor make any
representation or warranty, express or implied, to the accuracy, contents or data contained within this document. While Angel Broking
Pvt. Limited endeavors to update on a reasonable basis the information discussed in this material, there may be regulatory, compliance,
or other reasons that prevent us from doing so.
This document is being supplied to you solely for your information, and its contents, information or data may not be reproduced,
redistributed or passed on, directly or indirectly.
Neither Angel Broking Pvt. Limited, nor its directors, employees or affiliates shall be liable for any loss or damage that may arise from or
in connection with the use of this information.
Note: Please refer to the important ‘Stock Holding Disclosure' report on the Angel website (Research Section). Also, please refer to the
latest update on respective stocks for the disclosure status in respect of those stocks. Angel Broking Pvt. Limited and its affiliates may have
investment positions in the stocks recommended in this report.