Market Outlook
January 13, 2016
Market Cues
Domestic Indices
Chg (%)
(Pts)
(Close)
Indian markets are expected to open on a positive note tracking the SGX Nifty and
BSE Sensex
(0.6)
(143)
24,682
Global markets.
Nifty
(0.7)
(54)
7,510
The US market opened sharp gap up at the open, then all those gains melted away
Mid Cap
(0.9)
(102)
10,786
as oil dipped yet again, however late rebound in energy and biotech shares helped
Small Cap
(1.0)
(120)
11,477
push the market to a second straight day of gains on Tuesday.
Bankex
(1.8)
(320)
17,904
European markets rallied on Tuesday on easing concerns about global economic
powerhouse China despite further volatility.
Global Indices
Chg (%)
(Pts)
(Close)
Indian markets fell on Tuesday as investors remained cautious ahead of industrial
Dow Jones
0.7
118
16,516
output and consumer inflation data as well as TCS' earnings slated for release later
Nasdaq
1.0
48
4,686
in the day.
FTSE
1.0
57
5,929
News & Result Analysis
Nikkei
(2.7)
(479)
17,219
India's IIP declines, Inflation inches up
Hang Seng
(0.9)
(177)
19,712
Result Review: TCS
Shanghai Com
0.2
6
3,023
Detailed analysis on Pg2
Investor’s Ready Reckoner
Advances / Declines
BSE
NSE
Key Domestic & Global Indicators
Advances
929
578
Stock Watch: Latest investment recommendations on 150+ stocks
Declines
1,878
994
Refer P5 onwards
Unchanged
164
61
Top Picks
CMP
Target
Upside
Volumes (` Cr)
Company
Sector
Rating
(`)
(`)
(%)
BSE
2,918
Amara Raja Batteries Auto & Auto Ancillary
Buy
836
1,040
24.5
NSE
16,147
HCL Tech
IT
Buy
810
1,132
39.7
Larsen & Toubro
Construction
Buy
1,180
1,646
39.5
LIC Housing Finance Financials
Buy
491
592
20.5
Net Inflows (` Cr)
Net
Mtd
Ytd
Navkar Corporation Others
Buy
200
265
32.5
FII
(678)
(2,275)
18,575
More Top Picks on Pg4
MFs
413
719
69,282
Key Upcoming Events
Previous
Consensus
Top Gainers
Price (`)
Chg (%)
Date
Region
Event Description
Reading
Expectations
Wockpharma
1,619
3.8
Jan 13
China
Exports YoY%
(6.80)
(8.00)
Shriramcit
1,551
3.8
Jan 14
US
Initial Jobless claims
277.00
275.00
Jetairways
773
3.2
India
Monthly Wholesale Prices YoY%
(1.99)
(1.20)
Fortis
183
3.0
Jan 15
US
Industrial Production
0.50
0.50
Aplltd
683
2.9
Jan 19
US
CPI (YoY)
0.10
-
Top Losers
Price (`)
Chg (%)
Federalbnk
48
(7.7)
Unitech
6
(5.6)
J&Kbank
78
(5.6)
Gruh
244
(5.4)
Orientbank
118
(4.5)
As on January 12, 2015
Market Outlook
January 13, 2016
India's IIP declines, Inflation inches up
The Index of Industrial Production (IIP) for November contracted 3.2 per cent,
moving into negative territory for the first time in 13 months, against a 9.8 percent
growth spurt in October, official data released on Tuesday showed.
The consumer price index (CPI) based inflation for December edged up for the fifth
straight month at 5.61 per cent against 5.41 per cent in November.
Result Review
TCS (CMP: `2,324/ TP: Under review / Upside:)
TCS, posted number has been lower than expected for its 3QFY2016 results,
mainly on the top line, while the EBDITA and net profit were in line and higher
than expected respectively. Company posted a 0.3% sequential de-growth in USD
revenues to US$4,145mn V/s expectations of US$4,177mn. On, Constant
currency terms (CC), the company posted a qoq growth of 0.5%, mainly impacted
on back of the Indian business. The International business posted a 1.1% qoq
during the quarter. In rupee terms, revenues came in at `27,364cr V/s `27,538cr,
up 0.7% qoq.
In terms of geography, the North America posted a 1.4% qoq (CC) terms, UK
posted a de-growth of 0.7% (CC), while Continental Europe posted a 2.3% qoq
(CC) terms. India and Asia Pacific posted a qoq (CC) growth of (6.7) % and 0.4%
respectively. Latin America posted a qoq (CC) 13.3% during the quarter. In terms
of domains, the qoq (CC) growth in BSFI was 0.7%, Retail & Distribution was 0.3%,
Manufacturing was 2.3%, Telecom was 0.3%, Life Sciences & Healthcare was
4.1%, Hi-Tech was 2.0% and Energy & Utilities was 1.6%.
On operating front, the EBITDA margin came in at 26.6% V/s 26.4% expected a
downtick of 47bp qoq, benefiting by the currency. Consequently, PAT came in at
`6,110cr V/s `5,999cr expected, a growth of 0.9% qoq.
The employee utilization was 84.9% (excluding the trainee) and 80.9% (including
trainee), while attrition was 15.3% in IT services and 15.9% including the BPS,
down 30bps. In demand terms, the no of US$100mn+ clients increased by 1 to
34; no of US$20mn+ clients increase by 2 to 173. Overall, there were 9 key
wins-3 in North America, 3 in Europe, 2 in Latin America and 1 in UK.
On stock perspective, the stock has witnessed a strong underperformance amongst
its peers. After the underperformance the company currently trades at a very
attractive levels of 16.2xFY2017E earnings, which we believe given the ROE of the
company which is ~+35%, is very attractive. Hence current weakness should be
utilized by the investors to get into the stock with a long term view, as the business
demand and order inflow remains intact and the company is confident of maintain
its profitability, which has been the case. So we maintain our buy on the stock
(while the target on the stock is under revision).
Market Outlook
January 13, 2016
Y/E
Sales OPM
PAT
EPS ROE P/E P/BV EV/EBITDA EV/Sales
March
(` cr)
(%)
(` cr)
(`)
(%)
(x)
(x)
(x)
(x)
FY2016E
1,11,274
28.4
24,545
125.4
39.5
18.5
7.3
14.1
4.0
FY2017E
1,26,852
28.7
28,155
143.9
41.8
16.2
6.8
12.1
3.5
Quarterly Bloomberg Brokers Consensus Estimate
Infosys Ltd Consol - January 14, 2016
Particulars (` cr)
3QFY16E
3QFY15
y-o-y (%)
2QFY16
q-o-q (%)
Net sales
15,758
13,796
14.2
15,635
0.8
EBITDA
4,294
3,954
8.6
4,351
(1.3)
EBITDA margin (%)
27.2
28.7
27.8
Net profit
3,351
3,250
3.1
3,398
(1.4)
Economic and Political News
Maharashtra suspends crushing licence of 12 sugar mills
Centre sanctions `40,000cr road projects to Chhattisgarh
Govt wants skill development centre in each district: Venkaiah Naidu
Corporate News
Reliance eyes `1,800cr sales from Vimal brand in 3 years
GMR to expand Hyderabad airport passenger terminal next year
Cement sector to grow 3.8-4% in FY16 : ICRA
Market Outlook
January 13, 2016
Top Picks ★★★★★
Large Cap
Market Cap
CMP
Target
Upside
Company
Rationale
(` Cr)
(`)
(`)
(%)
To outpace battery industry growth due to better technological
Amara Raja Batteries
14,274
836
1,040
24.5
products leading to market share gains in both the automotive
OEM and replacement segments.
Earnings to grow strongly given the MHCV cyclical upturn.
Ashok Leyland
26,211
92
111
20.5
Focus on exports and LCV's provides additional growth
avenue.
The stock is trading at attractive valuations and is factoring all
HCL Tech
1,14,218
810
1,132
39.7
the bad news.
Strong visibility for a robust 20% earnings trajectory, coupled
HDFC Bank
2,65,008
1,050
1,262
20.3
with high quality of earnings on account of high quality retail
business and strategic focus on highly rated corporates.
Back on the growth trend, expect a long term growth of 14%
Infosys
2,41,191
1,050
1,306
24.4
to be a US$20bn in FY2020.
Well positioned to benefit from such expected gradual
recovery in the overall domestic capex cycle, given its presence
Larsen & Toubro
1,09,846
1,180
1,646
39.5
across various infrastructure segments, its execution
capabilities, and its strong balance sheet.
LICHF continues to grow its retail loan book at a healthy pace
with improvement in asset quality. We expect the company to
LIC Housing Finance
24,784
491
592
20.5
post a healthy loan book which is likely to reflect in a strong
earnings growth.
Source: Company, Angel Research
Mid Cap
Market Cap
CMP
Target
Upside
Company
Rationale
(` Cr)
(`)
(`)
(%)
Favourable outlook for the AC industry to augur well for
Cooling products business which is out pacing the market
Blue Star
3,326
370
439
18.7
growth. EMPPAC division's profitability to improve once
operating environment turns around.
Change in business focus towards high-margin chronic &
Garware Wall Ropes
864
395
473
19.7
lifestyle segments and increasing penetration in Europe and
US
Economic recovery to have favourable impact on advertising &
circulation revenue growth. Further, the acquisition of a radio
Jagran Prakashan
5,513
169
189
12.1
business (Radio City) would also boost the company's revenue
growth.
Massive capacity expansion along with rail advantage at ICD
Navkar Corporation
2,851
200
265
32.5
as well CFS augurs well for the company
Earnings boost on back of stable material prices and
Radico Khaitan
1,525
115
156
36.1
favourable pricing environment. Valuation discount to peers
provides additional comfort
Strong brands and distribution network would boost growth
Siyaram Silk Mills
1,124
1,199
1,354
12.9
going ahead. Stock currently trades at an inexpensive
valuation.
Structural shift in the Lighting industry towards LED lighting will
Surya Roshni
712
163
201
23.7
drive growth.
Source: Company, Angel Research
Market Outlook
January 13, 2016
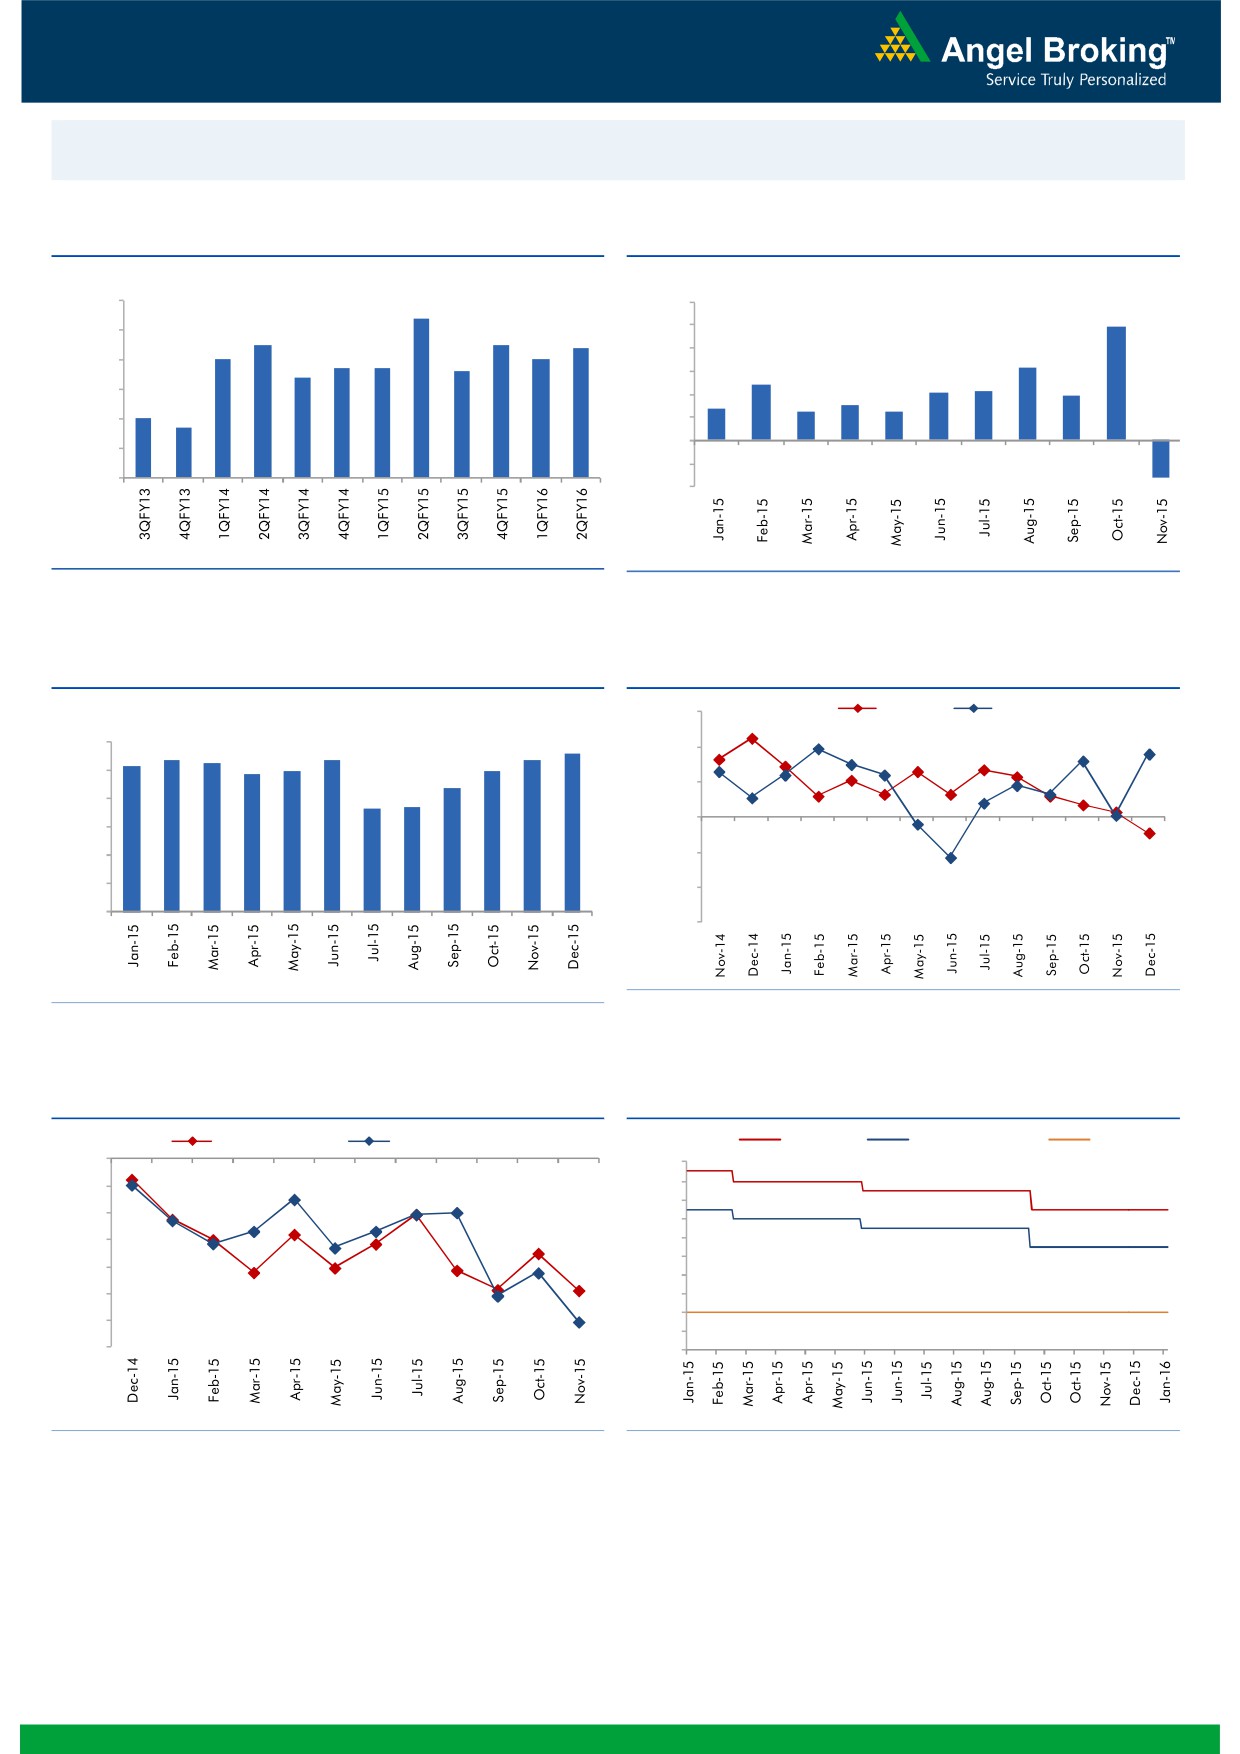
Macro watch
Exhibit 1: Quarterly GDP trends
Exhibit 2: IIP trends
(%)
(%)
9.0
8.4
12.0
9.9
7.5
7.5
10.0
8.0
7.4
7.0
7.0
6.7
6.7
8.0
6.3
6.6
7.0
6.4
6.0
4.8
4.3
4.2
3.8
6.0
3.0
4.0
2.8
2.5
2.5
5.0
4.7
5.0
2.0
-
(3.2)
4.0
(2.0)
3.0
(4.0)
Source: CSO, Angel Research
Source: MOSPI, Angel Research
Exhibit 3: Monthly CPI inflation trends
Exhibit 4: Manufacturing and services PMI
(%)
56.0
Mfg. PMI
Services PMI
5.4
5.4
5.6
6.0
5.2
5.4
5.3
54.0
4.9
5.0
5.0
5.0
4.4
52.0
3.7
3.7
4.0
50.0
3.0
2.0
48.0
1.0
46.0
-
44.0
Source: Market, Angel Research; Note: Level above 50 indicates expansion
Source: MOSPI, Angel Research
Exhibit 5: Exports and imports growth trends
Exhibit 6: Key policy rates
(%)
Exports yoy growth
Imports yoy growth
(%)
Repo rate
Reverse Repo rate
CRR
0.0
8.00
(5.0)
7.50
7.00
(10.0)
6.50
(15.0)
6.00
5.50
(20.0)
5.00
(25.0)
4.50
4.00
(30.0)
3.50
(35.0)
3.00
Source: Bloomberg, Angel Research
Source: RBI, Angel Research
Market Outlook
January 13, 2016
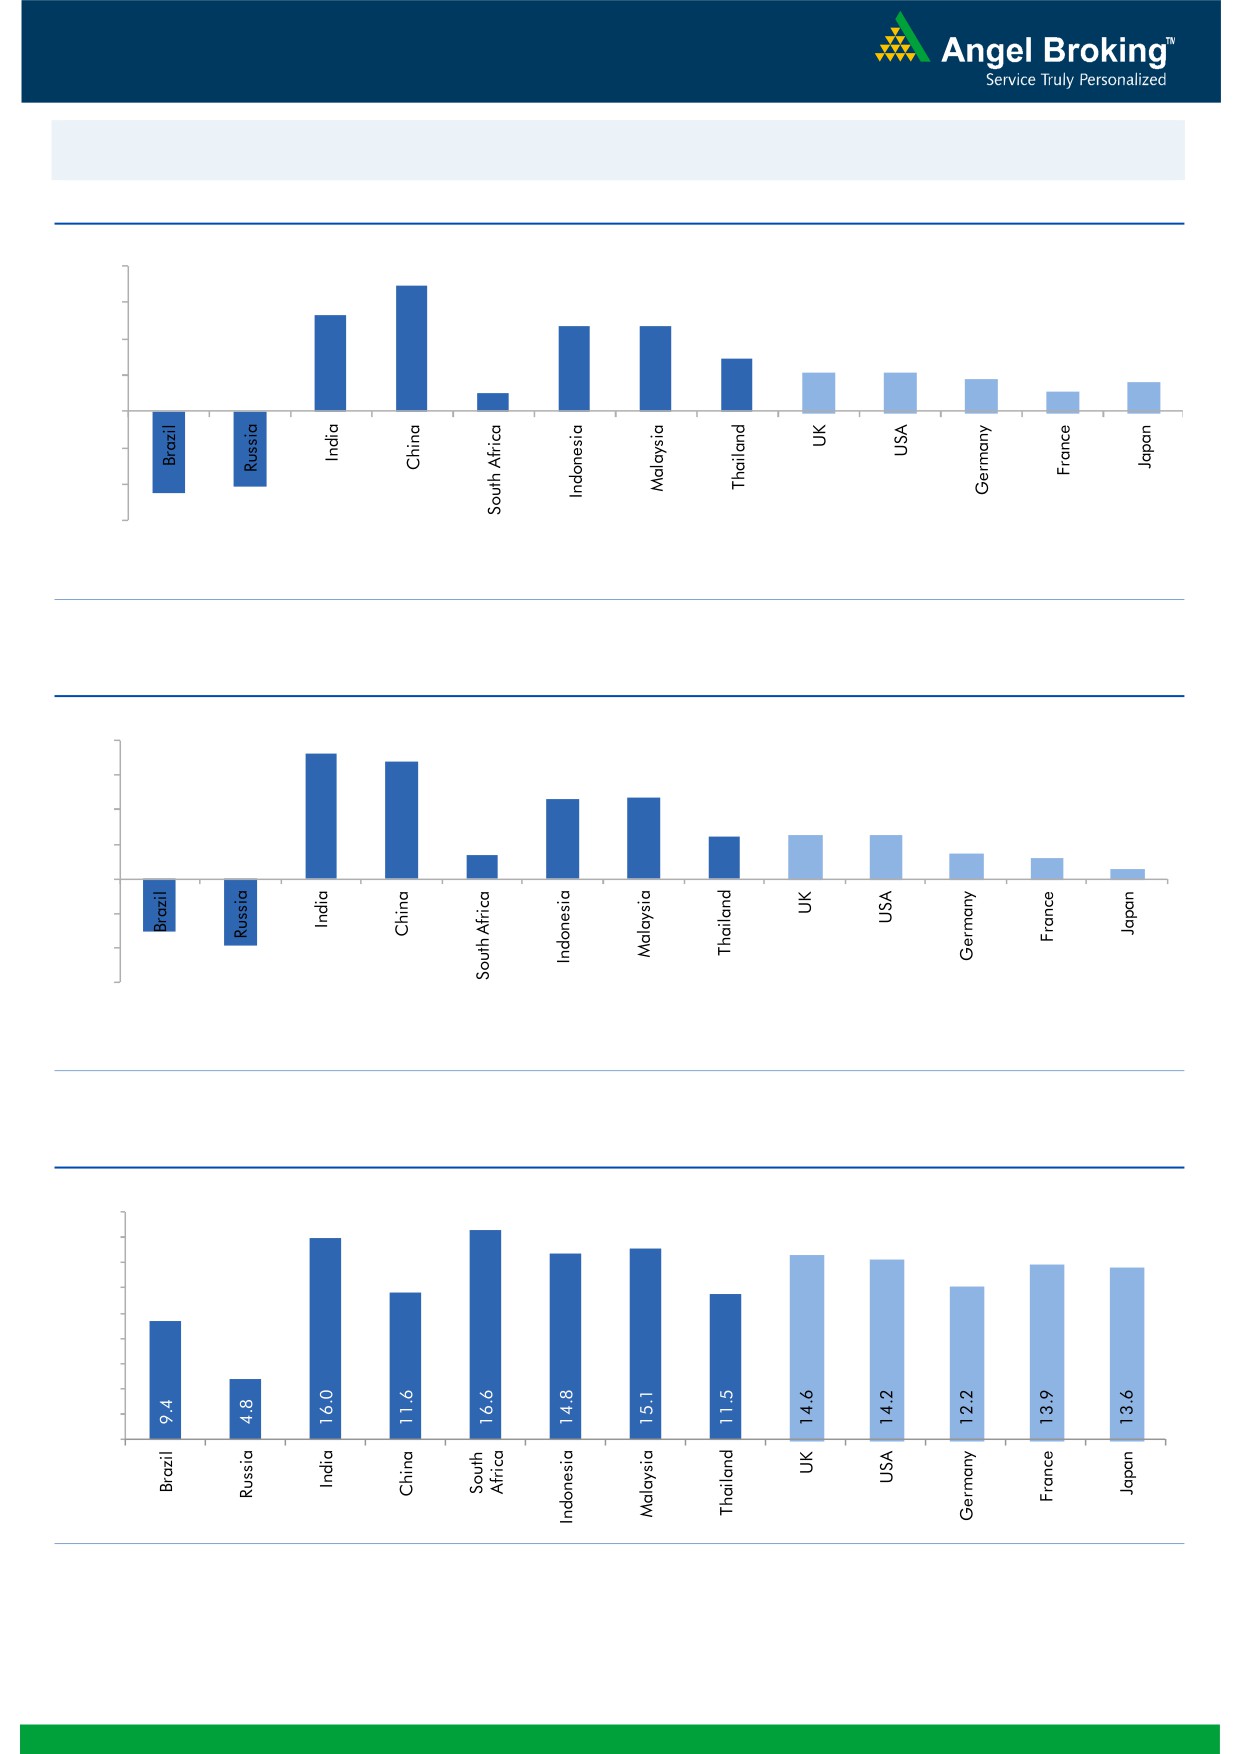
Global watch
Exhibit 1: Latest quarterly GDP Growth (%, yoy) across select developing and developed countries
(%)
8.0
6.9
6.0
5.3
4.7
4.7
4.0
2.9
2.1
2.1
1.8
2.0
1.0
1.1
1.6
-
(2.0)
(4.0)
(4.1)
(4.5)
(6.0)
Source: Bloomberg, Angel Research
Exhibit 2: 2015 GDP Growth projection by IMF (%, yoy) across select developing and developed countries
(%)
7.3
8.0
6.8
6.0
4.7
4.7
4.0
2.5
2.5
2.6
1.4
1.5
2.0
1.2
0.6
-
(2.0)
(4.0)
(3.0)
(3.8)
(6.0)
Source: IMF, Angel Research
Exhibit 3: One year forward P-E ratio across select developing and developed countries
(x)
18.0
16.0
14.0
12.0
10.0
8.0
6.0
4.0
2.0
-
Source: IMF, Angel Research
Market Outlook
January 13, 2016
Exhibit 4: Relative performance of indices across globe
Returns (%)
Country
Name of index
Closing price
1M
3M
1YR
Brazil
Bovespa
39,514
(12.6)
(17.0)
(16.8)
Russia
Micex
1,690
(2.9)
0.6
11.5
India
Nifty
7,510
(2.3)
(7.6)
(7.3)
China
Shanghai Composite
3,023
(12.5)
(8.2)
(6.5)
South Africa
Top 40
43,489
(1.5)
(9.0)
2.4
Mexico
Mexbol
41,023
(3.2)
(6.9)
(1.8)
Indonesia
LQ45
787
1.2
3.6
(12.4)
Malaysia
KLCI
1,641
(1.7)
(2.8)
(5.5)
Thailand
SET 50
786
(6.1)
(13.5)
(21.5)
USA
Dow Jones
16,516
(5.6)
(3.3)
(6.2)
UK
FTSE
5,929
(3.4)
(7.6)
(7.2)
Japan
Nikkei
17,219
(12.6)
(4.4)
(2.9)
Germany
DAX
9,985
(8.3)
(0.1)
1.7
France
CAC
4,379
(5.6)
(6.6)
(0.4)
Source: Bloomberg, Angel Research
Stock Watch
January 13, 2016
Company Name
Reco
CMP
Target
Mkt Cap
Sales ( Čcr )
OPM(%)
EPS (Č)
PER(x)
P/BV(x)
RoE(%)
EV/Sales(x)
(Č)
Price ( Č)
( Č cr )
FY16E FY17E
FY16E
FY17E
FY16E
FY17E
FY16E
FY17E
FY16E
FY17E
FY16E
FY17E
FY16E
FY17E
Agri / Agri Chemical
Rallis
Neutral
170
-
3,304
2,097
2,415
14.4
14.4
9.5
11.0
17.9
15.5
3.6
3.1
21.1
21.3
1.6
1.4
United Phosphorus
Buy
425
510
18,201
13,698
15,752
17.6
17.6
32.1
38.5
13.2
11.0
2.6
2.2
21.4
21.3
1.4
1.2
Auto & Auto Ancillary
Ashok Leyland
Buy
92
111
26,211
17,995
21,544
11.4
11.6
3.4
4.7
27.1
19.6
4.8
4.4
17.7
22.2
1.4
1.1
Bajaj Auto
Accumulate
2,342
2,728
67,783
23,695
27,298
21.3
20.4
134.6
151.5
17.4
15.5
5.5
4.7
31.8
30.6
2.5
2.1
Bharat Forge
Accumulate
815
943
18,977
7,867
8,881
20.0
20.3
34.4
41.0
23.7
19.9
4.6
3.8
21.1
20.9
2.6
2.2
Eicher Motors
Accumulate
17,067
19,036
46,343
15,379
16,498
15.6
16.6
473.2
574.8
36.1
29.7
13.3
9.9
36.7
33.2
3.0
2.7
Gabriel India
Accumulate
90
101
1,299
1,415
1,544
8.7
9.0
4.6
5.4
19.7
16.8
3.6
3.2
18.1
18.9
0.9
0.8
Hero Motocorp
Accumulate
2,470
2,774
49,314
28,561
31,559
14.7
14.7
151.1
163.2
16.3
15.1
6.3
5.4
38.7
35.6
1.6
1.4
Jamna Auto Industries Neutral
147
-
1,175
1,292
1,486
9.3
9.8
6.0
7.5
24.5
19.6
5.1
4.3
20.7
21.8
1.0
0.8
L G Balakrishnan & Bros Neutral
485
-
761
1,254
1,394
11.6
11.8
35.9
41.7
13.5
11.6
1.8
1.6
13.5
13.8
0.7
0.6
Mahindra and Mahindra Buy
1,182
1,449
73,422
39,031
44,440
13.8
13.9
57.9
67.6
20.4
17.5
3.3
2.9
16.1
16.6
1.6
1.3
Maruti
Neutral
4,270
-
128,978
57,865
68,104
16.4
16.7
176.3
225.5
24.2
18.9
4.7
4.0
19.4
21.2
2.0
1.6
Minda Industries
Neutral
863
-
1,370
2,567
2,965
8.0
8.3
46.1
57.8
18.7
14.9
3.1
2.6
16.7
17.3
0.7
0.5
Motherson Sumi
Buy
266
313
35,125
39,343
45,100
8.8
9.1
10.1
12.5
26.3
21.2
8.3
6.5
35.3
34.4
1.0
0.9
Rane Brake Lining
Accumulate
330
366
261
454
511
11.1
11.4
23.8
28.1
13.9
11.7
2.0
1.8
14.2
15.3
0.7
0.7
Setco Automotive
Neutral
39
-
517
594
741
12.7
13.7
1.7
3.2
22.8
12.1
2.4
2.1
10.4
16.9
1.3
1.1
Tata Motors
Buy
355
409
102,510
266,022
312,667
12.8
13.1
26.3
38.3
13.5
9.3
1.8
1.5
8.4
12.1
0.6
0.5
TVS Motor
Buy
290
338
13,763
11,569
13,648
7.3
8.7
10.3
16.1
28.1
18.0
7.0
5.5
24.8
30.5
1.2
1.0
Amara Raja Batteries
Buy
836
1,040
14,274
4,892
5,871
17.4
17.6
28.8
37.1
29.0
22.5
6.8
5.4
23.4
24.1
2.9
2.4
Exide Industries
Accumulate
140
162
11,887
6,950
7,784
14.4
14.8
6.6
7.3
21.2
19.2
2.7
2.4
12.6
12.8
1.5
1.3
Apollo Tyres
Accumulate
149
171
7,587
12,146
12,689
16.8
16.0
21.2
19.0
7.0
7.8
1.2
1.0
16.5
13.0
0.7
0.7
Ceat
Accumulate
1,016
1,119
4,109
6,041
6,597
14.1
13.7
99.5
111.9
10.2
9.1
2.0
1.7
19.6
18.5
0.8
0.7
JK Tyres
Neutral
104
-
2,360
7,446
7,669
15.2
14.0
19.6
18.4
5.3
5.7
1.3
1.1
25.2
19.5
0.7
0.6
Swaraj Engines
Neutral
943
-
1,171
552
630
14.2
14.7
44.6
54.1
21.1
17.4
4.9
4.5
23.2
25.6
2.0
1.7
Subros
Neutral
107
-
641
1,268
1,488
11.6
11.9
3.7
6.6
28.9
16.2
1.9
1.8
6.8
11.4
0.8
0.6
Indag Rubber
Neutral
198
-
520
283
329
17.0
17.2
13.0
15.4
15.3
12.9
3.3
2.8
21.8
21.6
1.6
1.4
Capital Goods
ACE
Neutral
45
-
441
660
839
4.7
8.2
1.0
3.9
44.6
11.4
1.4
1.2
3.2
11.3
0.8
0.7
BEML
Neutral
1,224
-
5,099
3,277
4,006
6.0
8.9
29.2
64.3
41.9
19.0
2.3
2.1
5.7
11.7
1.6
1.3
Bharat Electronics
Accumulate
1,340
1,414
32,162
7,737
8,634
16.8
17.2
54.0
61.0
24.8
22.0
3.5
3.2
39.3
45.6
3.1
2.7
Stock Watch
January 13, 2016
Company Name
Reco
CMP
Target
Mkt Cap
Sales ( Čcr )
OPM(%)
EPS (Č)
PER(x)
P/BV(x)
RoE(%)
EV/Sales(x)
(Č)
Price ( Č)
( Č cr )
FY16E
FY17E
FY16E
FY17E
FY16E
FY17E
FY16E
FY17E
FY16E
FY17E
FY16E
FY17E
FY16E
FY17E
Capital Goods
Voltas
Buy
288
353
9,513
5,363
5,963
8.0
9.1
11.0
13.8
26.1
20.8
4.0
3.5
16.2
17.9
1.8
1.6
BGR Energy
Neutral
126
-
909
3,615
3,181
9.5
9.4
16.7
12.4
7.5
10.2
0.7
0.7
10.0
7.0
0.7
0.8
BHEL
Neutral
151
-
36,836
33,722
35,272
10.8
11.7
10.5
14.2
14.3
10.6
1.1
1.0
7.0
9.0
1.2
1.1
Blue Star
Buy
370
439
3,326
3,548
3,977
6.3
6.9
13.7
17.2
27.0
21.6
6.8
4.4
26.1
25.4
1.0
0.9
Crompton Greaves
Accumulate
187
204
11,720
13,484
14,687
4.9
6.2
4.5
7.1
41.6
26.3
2.9
2.7
7.2
10.8
1.0
0.9
Inox Wind
Buy
347
458
7,704
4,980
5,943
17.0
17.5
26.6
31.6
13.1
11.0
3.9
2.9
35.0
30.0
1.7
1.4
KEC International
Neutral
138
-
3,559
8,791
9,716
6.1
6.8
5.4
8.2
25.6
16.9
2.6
2.4
10.0
14.0
0.6
0.6
Thermax
Neutral
892
-
10,626
6,413
7,525
7.4
8.5
30.5
39.3
29.2
22.7
4.5
3.9
15.0
17.0
1.6
1.3
Cement
ACC
Buy
1,283
1,630
24,078
13,151
14,757
16.4
18.3
63.9
83.4
20.1
15.4
2.6
2.4
13.3
16.1
1.7
1.4
Ambuja Cements
Buy
195
233
30,324
11,564
12,556
19.4
20.7
8.9
10.1
22.0
19.4
2.8
2.6
12.8
13.8
2.3
2.1
HeidelbergCement
Neutral
75
-
1,696
1,772
1,926
13.3
15.4
1.0
3.0
74.9
25.0
1.9
1.8
2.6
7.9
1.5
1.3
India Cements
Accumulate
98
112
3,007
4,216
4,840
18.0
19.5
4.0
9.9
24.5
9.9
1.0
0.9
4.0
9.5
1.1
0.9
JK Cement
Buy
528
744
3,688
3,661
4,742
10.1
15.8
18.0
61.0
29.3
8.7
2.1
1.9
7.5
22.9
1.6
1.2
J K Lakshmi Cement
Buy
312
430
3,671
2,947
3,616
16.7
19.9
11.5
27.2
27.1
11.5
2.6
2.2
9.8
20.8
1.7
1.3
Mangalam Cements
Neutral
195
-
521
1,053
1,347
10.5
13.3
8.4
26.0
23.2
7.5
1.0
0.9
4.3
12.5
0.9
0.6
Orient Cement
Buy
146
183
2,989
1,854
2,524
21.2
22.2
7.7
11.1
19.0
13.1
2.7
2.4
13.3
15.7
2.4
1.7
Ramco Cements
Neutral
389
-
9,270
4,036
4,545
20.8
21.3
15.1
18.8
25.8
20.7
3.2
2.8
12.9
14.3
2.8
2.4
Shree Cement^
Neutral
10,569
-
36,821
7,150
8,742
26.7
28.6
228.0
345.5
46.4
30.6
6.8
5.7
15.7
20.3
5.2
4.1
UltraTech Cement
Buy
2,671
3,282
73,287
25,021
30,023
19.1
21.6
89.0
132.0
30.0
20.2
3.5
3.0
12.2
15.9
3.0
2.5
Construction
ITNL
Neutral
87
-
2,865
7,360
8,825
34.0
35.9
7.0
9.0
12.4
9.7
0.4
0.4
3.2
3.7
3.8
3.6
KNR Constructions
Buy
541
673
1,520
937
1,470
14.3
14.0
33.5
38.6
16.1
14.0
2.5
2.1
15.4
15.4
1.7
1.1
Larsen & Toubro
Buy
1,180
1,646
109,846
65,065
77,009
11.5
11.7
61.5
65.6
19.2
18.0
1.9
1.8
13.4
14.0
1.9
1.6
Gujarat Pipavav Port
Neutral
154
-
7,426
629
684
51.0
52.2
6.4
5.9
24.0
26.0
3.2
2.9
15.9
12.7
11.8
10.6
MBL Infrastructures
Buy
214
285
887
2,313
2,797
12.2
14.6
19.0
20.0
11.3
10.7
1.2
1.1
11.3
10.6
1.1
1.0
Nagarjuna Const.
Neutral
73
-
4,056
7,892
8,842
8.8
9.1
3.0
5.3
24.3
13.8
1.2
1.1
5.0
8.5
0.8
0.6
PNC Infratech
Accumulate
532
558
2,730
1,873
2,288
13.2
13.5
24.0
32.0
22.2
16.6
2.2
1.9
12.1
12.3
1.6
1.3
Simplex Infra
Neutral
303
-
1,498
5,955
6,829
10.3
10.5
16.0
31.0
18.9
9.8
1.0
0.9
5.3
9.9
0.8
0.7
Power Mech Projects
Neutral
677
-
996
1,539
1,801
12.8
12.7
59.0
72.1
11.5
9.4
1.7
1.5
18.6
16.8
0.6
0.5
Sadbhav Engineering
Neutral
311
-
5,330
3,481
4,219
10.7
10.8
8.0
12.0
38.8
25.9
3.6
3.2
10.3
13.5
1.8
1.5
Stock Watch
January 13, 2016
Company Name
Reco
CMP
Target
Mkt Cap
Sales ( Čcr )
OPM(%)
EPS (Č)
PER(x)
P/BV(x)
RoE(%)
EV/Sales(x)
(Č)
Price ( Č)
( Č cr )
FY16E
FY17E
FY16E
FY17E
FY16E
FY17E
FY16E
FY17E
FY16E
FY17E
FY16E
FY17E
FY16E
FY17E
Construction
NBCC
Accumulate
1,000
1,089
12,005
7,382
9,506
7.7
8.6
39.8
54.4
25.1
18.4
6.1
4.8
26.7
29.1
1.4
1.0
MEP Infra
Neutral
44
-
718
1,956
1,876
28.1
30.5
1.3
3.0
34.0
14.7
7.1
4.8
21.2
32.8
1.8
1.8
SIPL
Neutral
94
-
3,316
675
1,042
62.4
64.7
-
-
3.5
4.0
-
-
16.5
11.2
Financials
Allahabad Bank
Neutral
61
-
3,681
8,569
9,392
2.8
2.9
16.3
27.5
3.8
2.2
0.4
0.3
7.6
11.9
-
-
Axis Bank
Buy
406
630
96,608
26,473
31,527
3.5
3.6
35.7
43.5
11.4
9.3
2.2
1.9
17.9
18.9
-
-
Bank of Baroda
Neutral
134
-
30,968
18,485
21,025
1.9
2.0
13.5
21.1
10.0
6.4
0.8
0.7
7.3
10.6
-
-
Bank of India
Neutral
105
-
8,283
15,972
17,271
1.9
2.0
15.3
33.4
6.8
3.1
0.3
0.3
3.6
7.6
-
-
Canara Bank
Neutral
208
-
11,273
15,441
16,945
2.0
2.1
46.6
70.4
4.5
3.0
0.4
0.3
8.0
11.2
-
-
Dena Bank
Neutral
39
-
2,523
3,440
3,840
2.1
2.3
7.3
10.0
5.4
3.9
0.4
0.3
6.1
7.9
-
-
Federal Bank
Neutral
48
-
8,286
3,477
3,999
3.0
3.0
5.0
6.2
9.6
7.7
1.0
0.9
10.6
11.9
-
-
HDFC
Neutral
1,154
-
182,201
10,358
11,852
3.3
3.3
41.1
47.0
28.1
24.5
5.4
4.9
24.7
24.9
-
-
HDFC Bank
Buy
1,050
1,262
265,008
38,309
47,302
4.3
4.3
49.3
61.1
21.3
17.2
3.7
3.2
18.5
19.7
-
-
ICICI Bank
Buy
237
354
137,662
34,279
39,262
3.3
3.3
21.0
24.4
11.3
9.7
1.9
1.6
14.4
14.7
-
-
IDBI Bank
Neutral
74
-
11,821
9,625
10,455
1.8
1.8
8.5
14.2
8.6
5.2
0.5
0.5
5.9
9.3
-
-
Indian Bank
Neutral
100
-
4,801
6,160
6,858
2.5
2.5
24.5
29.8
4.1
3.4
0.3
0.3
7.7
8.6
-
-
LIC Housing Finance
Buy
491
592
24,784
3,101
3,745
2.5
2.5
33.0
40.2
14.9
12.2
2.8
2.4
19.7
20.5
-
-
Oriental Bank
Neutral
118
-
3,528
7,643
8,373
2.4
2.4
37.2
45.4
3.2
2.6
0.3
0.3
8.2
9.4
-
-
Punjab Natl.Bank
Neutral
100
-
19,577
23,638
26,557
2.8
2.8
17.9
27.2
5.6
3.7
0.6
0.5
8.5
12.0
-
-
South Ind.Bank
Neutral
19
-
2,592
1,965
2,185
2.5
2.5
2.5
3.3
7.7
5.8
0.8
0.7
9.5
11.7
-
-
St Bk of India
Buy
200
283
155,139
82,520
93,299
2.7
2.8
20.0
24.5
10.0
8.2
1.1
1.0
11.5
12.8
-
-
Union Bank
Neutral
127
-
8,734
12,646
14,129
2.3
2.4
31.0
39.1
4.1
3.3
0.4
0.4
9.8
11.4
-
-
Vijaya Bank
Neutral
33
-
2,827
3,536
3,827
1.9
1.9
5.5
6.7
6.0
4.9
0.5
0.4
7.8
8.8
-
-
Yes Bank
Buy
673
921
28,239
7,190
9,011
3.2
3.3
58.2
69.7
11.6
9.7
2.1
1.8
19.2
19.6
-
-
FMCG
Asian Paints
Neutral
873
-
83,752
16,553
19,160
16.0
16.2
17.7
21.5
49.4
40.6
13.1
11.8
29.4
31.2
4.9
4.2
Britannia
Neutral
2,936
-
35,225
8,065
9,395
9.6
10.2
47.2
65.5
62.2
44.8
20.7
19.5
38.3
41.2
4.2
3.6
Colgate
Neutral
908
-
24,689
4,836
5,490
19.5
19.7
48.5
53.2
18.7
17.1
13.7
11.9
99.8
97.5
5.1
4.5
Dabur India
Neutral
255
-
44,832
9,370
10,265
17.1
17.2
7.3
8.1
34.7
31.5
10.5
8.5
33.7
30.6
5.0
4.5
GlaxoSmith Con*
Neutral
6,178
-
25,982
4,919
5,742
17.2
17.4
168.3
191.2
36.7
32.3
10.4
8.9
28.8
28.9
5.1
4.4
Godrej Consumer
Neutral
1,269
-
43,222
10,168
12,886
16.1
16.1
32.1
38.4
39.6
33.1
8.0
7.4
19.7
21.0
4.3
3.4
Stock Watch
January 13, 2016
Company Name
Reco
CMP
Target
Mkt Cap
Sales ( Čcr )
OPM(%)
EPS (Č)
PER(x)
P/BV(x)
RoE(%)
EV/Sales(x)
(Č)
Price ( Č)
( Č cr )
FY16E FY17E
FY16E
FY17E
FY16E
FY17E
FY16E
FY17E
FY16E
FY17E
FY16E
FY17E
FY16E
FY17E
FMCG
HUL
Neutral
820
-
177,329
34,940
38,957
17.5
17.7
20.8
24.7
39.4
33.2
43.8
35.0
110.5
114.2
4.8
4.3
ITC
Buy
315
382
253,517
41,068
45,068
37.8
37.4
13.9
15.9
22.7
19.8
7.6
6.7
34.1
33.8
5.8
5.2
Marico
Neutral
221
-
28,461
6,551
7,766
15.7
16.0
10.4
12.5
21.3
17.7
6.2
5.1
33.2
32.4
4.4
3.7
Nestle*
Buy
5,444
6,646
52,489
11,291
12,847
22.2
22.3
158.9
184.6
34.3
29.5
17.9
16.1
55.0
57.3
4.7
4.1
Tata Global
Neutral
140
-
8,804
8,635
9,072
9.8
9.9
6.5
7.6
21.5
18.4
2.1
2.1
6.8
7.4
1.0
0.9
IT
HCL Tech^
Buy
810
1,132
114,218
42,038
47,503
23.2
23.5
55.8
62.9
14.5
12.9
3.3
2.6
23.0
19.8
2.4
1.9
Infosys
Buy
1,050
1,306
241,191
60,250
66,999
27.0
28.0
56.4
63.7
18.6
16.5
3.8
3.3
20.4
19.8
3.3
2.8
TCS
Buy
2,324
3,165
457,937
111,274
126,852
28.4
28.7
125.4
143.9
18.5
16.2
7.3
6.8
39.9
42.2
3.9
3.3
Tech Mahindra
Buy
506
646
48,961
25,566
28,890
16.0
17.0
26.3
31.9
19.3
15.9
3.5
3.0
17.9
18.6
1.7
1.5
Wipro
Buy
549
719
135,625
50,808
58,713
23.7
23.8
37.3
42.3
14.7
13.0
2.8
2.5
19.0
17.9
2.3
1.8
Media
D B Corp
Accumulate
325
356
5,964
2,241
2,495
27.8
27.9
21.8
25.6
14.9
12.7
3.9
3.4
26.7
28.5
2.6
2.3
HT Media
Neutral
84
-
1,952
2,495
2,603
11.2
11.2
7.3
8.6
11.5
9.8
0.9
0.8
7.4
8.1
0.3
0.3
Jagran Prakashan
Accumulate
169
189
5,513
2,170
2,355
27.2
26.2
8.9
9.9
19.0
17.0
4.0
3.5
20.9
20.5
2.4
2.2
Sun TV Network
Neutral
413
-
16,270
2,779
3,196
70.2
70.5
22.8
27.3
18.1
15.1
4.5
4.0
26.7
28.3
5.7
5.0
Hindustan Media
Neutral
294
-
2,159
920
1,031
20.0
20.0
19.2
20.9
15.3
14.1
2.5
2.2
16.4
15.3
1.9
1.7
Ventures
Metals & Mining
Coal India
Buy
316
380
199,787
76,167
84,130
19.9
22.3
22.4
25.8
14.1
12.3
5.1
5.0
35.5
41.0
2.0
1.8
Hind. Zinc
Buy
142
175
59,788
14,641
14,026
50.4
50.4
17.7
16.0
8.0
8.8
1.2
1.1
16.2
13.2
1.7
1.5
Hindalco
Neutral
76
-
15,591
104,356
111,186
8.7
9.5
6.7
11.1
11.2
6.8
0.4
0.4
3.5
5.9
0.7
0.6
JSW Steel
Neutral
1,014
-
24,499
42,308
45,147
16.4
20.7
(10.3)
49.5
20.5
1.1
1.1
(1.0)
5.6
1.6
1.5
NMDC
Neutral
90
-
35,484
8,237
10,893
46.6
44.5
10.0
11.7
9.0
7.7
1.0
0.9
12.5
13.0
4.1
3.1
SAIL
Neutral
46
-
18,957
45,915
53,954
7.2
10.5
1.5
4.4
30.5
10.5
0.4
0.4
2.3
4.1
1.1
1.0
Vedanta
Neutral
84
-
24,978
71,445
81,910
26.2
26.3
12.9
19.2
6.5
4.4
0.5
0.4
7.2
8.9
0.8
0.6
Tata Steel
Neutral
246
-
23,926
126,760
137,307
8.9
11.3
6.4
23.1
38.7
10.7
0.8
0.8
2.0
7.1
0.8
0.7
Oil & Gas
Cairn India
Neutral
127
-
23,848
11,323
12,490
49.4
51.0
20.7
20.7
6.1
6.2
0.4
0.4
6.4
6.1
1.2
0.6
GAIL
Neutral
366
-
46,458
64,856
70,933
9.1
9.6
24.0
28.9
15.3
12.7
1.3
1.2
8.8
9.6
0.9
0.8
ONGC
Neutral
222
-
189,504
154,564
167,321
36.8
37.4
28.6
32.5
7.7
6.8
1.0
0.9
12.7
13.5
1.5
1.4
Petronet LNG
Neutral
257
-
19,305
29,691
31,188
5.8
6.2
12.8
13.4
20.1
19.2
3.0
2.7
15.8
14.8
0.7
0.7
Indian Oil Corp
Neutral
440
-
106,830
359,607
402,760
5.9
6.1
42.5
48.7
10.4
9.0
1.4
1.2
14.1
14.4
0.4
0.4
Reliance Industries
Accumulate
1,045
1,150
338,530
304,775
344,392
12.6
13.4
91.3
102.6
11.5
10.2
1.3
1.2
11.8
12.0
1.0
0.8
Stock Watch
January 13, 2016
Company Name
Reco
CMP
Target
Mkt Cap
Sales ( Čcr )
OPM(%)
EPS (Č)
PER(x)
P/BV(x)
RoE(%)
EV/Sales(x)
(Č)
Price ( Č)
( Č cr )
FY16E FY17E
FY16E
FY17E
FY16E
FY17E
FY16E
FY17E
FY16E
FY17E
FY16E
FY17E
FY16E
FY17E
Pharmaceuticals
Alembic Pharma
Neutral
680
-
12,822
2,658
3,112
24.1
20.2
24.6
23.9
27.7
28.5
9.9
7.6
42.5
30.2
4.7
4.0
Aurobindo Pharma
Neutral
841
-
49,094
14,923
17,162
22.0
23.0
35.7
42.8
23.6
19.6
6.9
5.2
34.0
30.2
3.7
3.1
Aventis*
Neutral
4,200
-
9,674
2,082
2,371
17.4
20.8
118.2
151.5
35.5
27.7
5.2
4.2
19.9
25.5
4.4
3.6
Cadila Healthcare
Accumulate
320
352
32,775
10,224
11,840
21.0
22.0
14.6
17.6
21.9
18.2
6.0
4.7
30.8
29.0
3.2
2.7
Cipla
Neutral
612
-
49,130
14,211
16,611
20.6
19.0
27.0
28.9
22.7
21.2
3.8
3.3
18.4
16.8
3.5
2.9
Dr Reddy's
Buy
2,924
3,933
49,859
16,838
19,575
25.0
23.1
167.5
178.8
17.5
16.4
3.7
3.1
23.1
20.4
3.0
2.5
Dishman Pharma
Neutral
327
-
2,637
1,733
1,906
21.5
21.5
17.0
19.9
19.2
16.4
1.9
1.7
10.5
11.2
2.1
1.8
GSK Pharma*
Neutral
3,240
-
27,442
2,870
3,158
20.0
22.1
59.5
68.3
54.5
47.4
16.1
16.5
28.5
34.3
9.2
8.4
Indoco Remedies
Neutral
307
-
2,829
1,033
1,199
15.9
18.2
9.4
13.6
32.7
22.6
4.8
4.1
15.7
19.7
2.9
2.5
Ipca labs
Buy
652
900
8,227
3,363
3,909
12.9
18.6
13.4
28.0
48.7
23.3
3.5
3.1
7.4
14.0
2.8
2.4
Lupin
Neutral
1,702
-
76,665
13,092
16,561
25.0
27.0
50.4
68.3
33.8
24.9
7.0
5.5
22.8
24.7
5.6
4.3
Sun Pharma
Buy
788
950
189,701
28,163
32,610
25.8
30.7
17.4
26.9
45.3
29.3
4.3
3.7
13.0
16.6
6.2
5.2
Power
Tata Power
Neutral
67
-
18,121
35,923
37,402
22.6
22.8
4.1
5.2
16.5
13.0
1.3
1.2
7.5
9.3
1.5
1.4
NTPC
Accumulate
145
157
119,683
87,064
98,846
23.5
23.5
11.7
13.2
12.4
11.0
1.4
1.3
11.4
12.1
2.4
2.1
Power Grid
Buy
143
170
74,602
20,702
23,361
86.7
86.4
12.1
13.2
11.8
10.8
1.7
1.5
15.6
15.1
8.5
7.9
Telecom
Bharti Airtel
Neutral
315
-
125,978
101,748
109,191
32.1
31.7
12.0
12.5
26.3
25.2
1.8
1.7
6.9
6.7
1.9
1.7
Idea Cellular
Neutral
125
-
45,131
34,282
36,941
32.0
31.5
5.9
6.2
21.3
20.2
2.0
1.8
9.9
9.3
2.0
1.9
zOthers
Abbott India
Neutral
5,527
-
11,745
2,715
3,153
14.5
14.1
134.3
152.2
41.2
36.3
10.3
8.5
27.4
25.6
4.2
3.5
Bajaj Electricals
Buy
196
290
1,977
4,719
5,287
5.2
5.8
8.6
12.7
22.9
15.5
2.6
2.3
11.4
14.8
0.4
0.4
Finolex Cables
Neutral
248
-
3,789
2,520
2,883
12.2
12.0
12.7
14.2
19.6
17.5
2.7
2.4
13.6
13.5
1.3
1.1
Goodyear India*
Buy
518
622
1,195
1,888
1,680
12.1
11.9
62.2
56.6
8.3
9.2
2.0
1.7
25.9
19.7
0.4
0.4
Hitachi
Neutral
1,186
-
3,226
1,779
2,081
7.8
8.8
21.8
33.4
54.4
35.5
8.8
7.1
17.4
22.1
2.0
1.7
Jyothy Laboratories
Neutral
303
-
5,490
1,620
1,847
11.5
11.5
7.3
8.5
41.6
35.8
5.4
5.0
13.3
14.4
3.3
2.8
MRF
Buy
38,926
45,575
16,509
20,316
14,488
21.4
21.1
5,488.0
3,798.0
7.1
10.3
2.4
2.0
41.1
21.2
0.8
1.0
Page Industries
Neutral
13,052
-
14,558
1,929
2,450
19.8
20.1
229.9
299.0
56.8
43.7
25.1
17.4
52.1
47.1
7.8
6.1
Relaxo Footwears
Neutral
481
-
5,770
1,767
2,152
12.3
12.5
19.3
25.1
25.0
19.2
6.1
4.7
27.7
27.8
3.3
2.7
Siyaram Silk Mills
Accumulate
1,199
1,354
1,124
1,636
1,815
11.5
11.5
89.9
104.1
13.3
11.5
2.2
1.9
17.9
17.8
0.8
0.8
Styrolution ABS India*
Neutral
730
-
1,284
1,271
1,440
8.6
9.2
32.0
41.1
22.8
17.8
2.3
2.1
10.7
12.4
1.0
0.8
TVS Srichakra
Buy
2,690
3,240
2,060
2,101
2,338
15.7
15.0
248.6
270.0
10.8
10.0
4.7
3.4
43.6
34.0
1.0
0.9
Stock Watch
January 13, 2016
Company Name
Reco
CMP
Target
Mkt Cap
Sales ( Čcr )
OPM(%)
EPS (Č)
PER(x)
P/BV(x)
RoE(%)
EV/Sales(x)
(Č)
Price ( Č)
( Č cr )
FY16E
FY17E
FY16E
FY17E
FY16E
FY17E
FY16E
FY17E
FY16E
FY17E
FY16E
FY17E
FY16E
FY17E
zOthers
HSIL
Neutral
289
-
2,087
2,123
2,384
16.1
16.5
15.0
18.9
19.2
15.3
1.5
1.4
8.0
9.4
1.4
1.2
Kirloskar Engines India
Neutral
239
-
3,461
2,471
2,826
8.8
10.4
9.1
13.3
26.2
18.0
2.5
2.3
9.7
13.4
1.1
0.9
Ltd
M M Forgings
Accumulate
529
614
639
511
615
21.7
21.6
43.1
55.8
12.3
9.5
2.2
1.8
19.9
21.2
1.5
1.2
Banco Products (India) Neutral
141
-
1,005
1,208
1,353
11.0
12.3
10.8
14.5
13.0
9.7
1.5
1.3
11.9
14.5
0.8
0.7
Competent Automobiles Neutral
161
-
99
1,040
1,137
3.2
3.1
25.7
28.0
6.2
5.7
0.9
0.8
15.0
14.3
0.1
0.1
Nilkamal
Neutral
1,547
-
2,309
1,910
2,083
10.5
10.3
63.3
69.2
24.4
22.4
4.0
3.4
17.6
16.5
1.2
1.0
Visaka Industries
Buy
116
144
184
1,086
1,197
9.9
10.3
21.5
28.8
5.4
4.0
0.5
0.5
9.6
11.6
0.4
0.3
Transport Corporation of
Neutral
288
-
2,187
2,830
3,350
8.8
9.0
14.4
18.3
20.0
15.7
3.1
2.7
15.4
17.1
0.9
0.8
India
Elecon Engineering
Accumulate
75
85
817
1,369
1,533
13.7
14.9
3.3
6.1
22.6
12.4
1.5
1.4
6.6
11.4
1.0
0.9
Surya Roshni
Buy
163
201
712
2,992
3,223
8.1
8.4
14.7
18.3
11.1
8.9
1.0
0.9
9.7
11.0
0.5
0.5
MT Educare
Neutral
187
-
743
286
366
18.3
17.7
7.7
9.4
24.2
19.9
5.1
4.5
20.2
21.1
2.4
1.9
Radico Khaitan
Buy
115
156
1,525
1,565
1,687
12.2
13.0
5.7
7.1
20.1
16.2
1.7
1.6
8.3
9.6
1.5
1.3
Garware Wall Ropes
Buy
395
473
864
862
974
11.2
11.2
24.9
29.6
15.9
13.4
2.4
2.1
15.1
15.4
1.0
0.9
Wonderla Holidays
Neutral
390
-
2,201
206
308
44.0
43.6
9.0
12.9
43.3
30.2
5.9
5.4
13.7
17.8
10.6
7.1
Linc Pen & Plastics
Neutral
226
-
335
340
371
8.3
8.9
10.8
13.2
21.0
17.1
3.4
2.9
16.0
17.1
1.1
1.0
The Byke Hospitality
Neutral
152
-
610
222
287
20.5
20.5
5.6
7.6
27.0
20.2
5.1
4.2
18.9
20.8
2.8
2.2
Interglobe Aviation
Neutral
1,251
-
45,068
17,022
21,122
20.7
14.5
63.9
53.7
19.6
23.3
29.3
24.0
149.9
103.2
2.7
2.2
Coffee Day Enterprises
Neutral
266
-
5,476
2,692
2,964
17.0
18.6
-
4.7
-
56.1
3.3
3.1
0.2
5.5
2.5
2.3
Ltd
Navneet Education
Neutral
90
-
2,144
998
1,062
24.1
24.0
5.8
6.1
15.7
14.8
3.5
3.0
22.0
20.6
2.3
2.2
Navkar Corporation
Buy
200
265
2,851
365
436
38.3
37.5
5.6
5.9
35.5
34.0
2.2
2.1
6.3
6.1
8.8
7.5
Source: Company, Angel Research; Note: *December year end; #September year end; &October year end; Price as on January 12, 2016
Market Outlook
January 13, 2016
Research Team Tel: 022 - 39357800
DISCLAIMER
Angel Broking Private Limited (hereinafter referred to as “Angel”) is a registered Member of National Stock Exchange of India Limited,
Bombay Stock Exchange Limited and Metropolitian Stock Exchange of India Limited. It is also registered as a Depository Participant with
CDSL and Portfolio Manager with SEBI. It also has registration with AMFI as a Mutual Fund Distributor. Angel Broking Private Limited is a
registered entity with SEBI for Research Analyst in terms of SEBI (Research Analyst) Regulations, 2014 vide registration number
INH000000164. Angel or its associates has not been debarred/ suspended by SEBI or any other regulatory authority for accessing
/dealing in securities Market. Angel or its associates including its relatives/analyst do not hold any financial interest/beneficial ownership
of more than 1% in the company covered by Analyst. Angel or its associates/analyst has not received any compensation / managed or co
-managed public offering of securities of the company covered by Analyst during the past twelve months. Angel/analyst has not served as
an officer, director or employee of company covered by Analyst and has not been engaged in market making activity of the company
covered by Analyst.
This document is solely for the personal information of the recipient, and must not be singularly used as the basis of any investment
decision. Nothing in this document should be construed as investment or financial advice. Each recipient of this document should make
such investigations as they deem necessary to arrive at an independent evaluation of an investment in the securities of the companies
referred to in this document (including the merits and risks involved), and should consult their own advisors to determine the merits and
risks of such an investment.
Reports based on technical and derivative analysis center on studying charts of a stock's price movement, outstanding positions and
trading volume, as opposed to focusing on a company's fundamentals and, as such, may not match with a report on a company's
fundamentals.
The information in this document has been printed on the basis of publicly available information, internal data and other reliable sources
believed to be true, but we do not represent that it is accurate or complete and it should not be relied on as such, as this document is for
general guidance only. Angel Broking Pvt. Limited or any of its affiliates/ group companies shall not be in any way responsible for any
loss or damage that may arise to any person from any inadvertent error in the information contained in this report. Angel Broking Pvt.
Limited has not independently verified all the information contained within this document. Accordingly, we cannot testify, nor make any
representation or warranty, express or implied, to the accuracy, contents or data contained within this document. While Angel Broking
Pvt. Limited endeavors to update on a reasonable basis the information discussed in this material, there may be regulatory, compliance,
or other reasons that prevent us from doing so.
This document is being supplied to you solely for your information, and its contents, information or data may not be reproduced,
redistributed or passed on, directly or indirectly.
Neither Angel Broking Pvt. Limited, nor its directors, employees or affiliates shall be liable for any loss or damage that may arise from or
in connection with the use of this information.
Note: Please refer to the important ‘Stock Holding Disclosure' report on the Angel website (Research Section). Also, please refer to the
latest update on respective stocks for the disclosure status in respect of those stocks. Angel Broking Pvt. Limited and its affiliates may have
investment positions in the stocks recommended in this report.