Market Outlook
April 12, 2016
Market Cues
Domestic Indices
Chg (%)
(Pts)
(Close)
Indian markets are expected to open on a flat note tracking the SGX Nifty and
BSE Sensex
1.4
348
25,022
Global Markets.
Nifty
1.5
116
7,671
After failing to sustain an early upside move, US stocks ended mostly unchanged
Mid Cap
1.1
116
10,710
yesterday. The pullback came as investors remained cautious ahead of first-quarter
Small Cap
0.6
67
10,732
company earnings. Japanese Yen showing continued strength may have also
Bankex
1.7
295
17,990
weighed on the markets.
The European markers recovered well and ended in the positive zone yesterday after
Global Indices
Chg (%)
(Pts)
(Close)
a weak start. The gains can be attributed to gain in Italian banks and as mining
Dow Jones
(0.1)
(21)
17,556
stocks gained on rising metal prices.
Nasdaq
(0.4)
(17)
4,833
Indian shares recovered early losses yesterday and closed convincingly higher, in
FTSE
(0.1)
(4)
6,200
line with global markets. Late buying in large cap stocks boosted Indian markets.
Nikkei
(0.4)
(70)
15,751
Market sentiment was also boosted on expectations of normal monsoon this year.
Hang Seng
0.3
70
20,441
News & Result Analysis
Shanghai Com
1.6
49
3,034
Tata Steel sells Scunthorpe steel plant to Greybull Capital
Tamil Nadu may follow Bihar on liqour ban
Advances / Declines
BSE
NSE
Detailed analysis on Pg2
Advances
1,503
930
Investor’s Ready Reckoner
Declines
1,107
624
Key Domestic & Global Indicators
Unchanged
118
77
Stock Watch: Latest investment recommendations on 150+ stocks
Refer Pg5 onwards
Volumes (` Cr)
BSE
3,856
Top Picks
CMP
Target
Upside
NSE
15,163
Company
Sector
Rating
(`)
(`)
(%)
Amara Raja
Auto & Auto Ancillary
Buy
891
1,040
16.8
Net Inflows (` Cr)
Net
Mtd
Ytd
HCL Tech
IT
Buy
839
1,038
23.7
FII
(33)
(1,073)
(14,041)
LIC Housing
Financials
Buy
478
592
23.9
MFs
291
(755)
63,263
Bharat Electronics
Capital Goods
Buy
1,151
1,414
22.9
Navkar Corporation Others
Buy
183
265
44.8
More Top Picks on Pg3
Top Gainers
Price (`)
Chg (%)
Justdial
817
7.4
Key Upcoming Events
Relinfra
576
6.5
Previous
Consensus
Date
Region
Event Description
Reading
Expectations
Idea
115
5.9
Apr 12 UK
CPI (YoY)
0.30
0.40
Trent
1,662
5.5
Apr 12 India
Industrial Production (YoY)
(1.50)
0.70
Boschltd
19,988
5.3
Apr 13 US
Producer Price Index (mom)
(0.6)
-
Apr 13 China
Exports YoY%
(25.40)
10.00
6.(6.(
Top Losers
Price (`)
Chg (%)
More Events on Pg4
Mrpl
68
(4.8)
Ubl
782
(4.7)
Unitdspr
2,266
(3.9)
Crisil
1,875
(3.7)
Il&Fstrans
77
(3.4)
As on April 11, 2016
Market Outlook
April 12, 2016
Tata Steel sells Scunthorpe steel plant to Greybull Capital
Tata Steel has signed an agreement to sell the loss-making 4.5MT long product
Scunthorpe steel plant to UK-based investment firm Greybull Capital for a nominal
consideration with the latter taking assets and relevant liabilities. The deal is
expected to complete within eight weeks. The Scunthorpe steel plant will be
renamed British Steel and will continue to be run by the existing management, who
will implement the turnaround plan.
As part of the deal, Greybull is arranging 400 million pounds investment and
financing package for its new business and will be approaching banks and
shareholders to fund this working capital and future investments at the plant. The
Scunthorpe steel plant employs 4,800 people with about 4,400 in the UK and
balance 400 in France.
Apart from Scunthorpe steel plant, Tata Steel has also put its 5.5MT (excluding
Scunthorpe steel plant) UK-business for sale as it intends to lower its cash drain
which has been eating into its margins significantly for quite some time now. Tata
Steel has engaged the services of KPMG LLP as the advisers to the sale process of
Tata Steel UK while Slaughter and May will be the legal advisers to the proposed
transaction.
While the sale of these assets should help reduce the losses from the European
business and improve profitability, the nominal consideration implies that Tata
steel would not be able to pare its debt with this sale, which is negative. The exact
details of the deal amount, treatment of debt and pension liabilities remain
uncertain. However, with steel margins remaining under pressure across
geographies, we retain our Neutral rating on the stock.
Tamil Nadu may follow Bihar on liquor ban
As per media reports, Tamil Nadu Chief Minister, Jayalalithaa has announced that
if re-elected, she will prohibit sale of liquor in the state (in a phased manner). The
liquor stocks have reacted negatively to this news as such political event will impact
the liquor sales. At the moment, we have a Buy recommendation on Radico
Khaitan, which has corrected by ~4% post the announcement. However, we
believe that the impact on Radico will not be as severe as Radico has strategically
defocused the sale of low margin category brands in the state of Tamil Nadu and
as a result, state’s overall contribution has declined from 6-7% in FY2015 to negligible
levels (less than 0.5%) for 9MFY2016. Moreover, Radico has shifted its focus from
regular brands to premium brands (pan India) which will boost the profitability. We
maintain our Buy recommendation on the stock with target price of `156.
Economic and Political News
RBI holds `8lk crore of government bonds, says Rajan
India, Maldives resolve to expand defence cooperation
Govt expects good Southwest monsoon this year
Corporate News
Tata Motors global sales rise 11% in March
ABNL completes 23% stake sale in Birla Sun Life for `1,664cr
Nalco, Iranian co to form task force for smelter plant
Market Outlook
April 12, 2016
Top Picks ★★★★★
Large Cap
Market Cap
CMP
Target
Upside
Company
Rationale
(` Cr)
(`)
(`)
(%)
To outpace battery industry growth due to better technological
Amara Raja Batteries
15,215
891
1,040
16.8
products leading to market share gains in both the automotive
OEM and replacement segments.
Uptick in defense capex by government when coupled with
Bharat Electronics
27,616
1,151
1,414
22.9
BELs strong market positioning, indicate that good times are
ahead for BEL.
The stock is trading at attractive valuations and is factoring all
HCL Tech
1,18,352
839
1,038
23.7
the bad news.
Strong visibility for a robust 20% earnings trajectory, coupled
HDFC Bank
2,70,478
1,070
1,262
18.0
with high quality of earnings on account of high quality retail
business and strategic focus on highly rated corporates.
Back on the growth trend, expect a long term growth of 14%
Infosys
2,72,938
1,184
1,347
13.7
to be a US$20bn in FY2020.
LICHF continues to grow its retail loan book at a healthy pace
with improvement in asset quality. We expect the company to
LIC Housing Finance
24,103
478
592
23.9
post a healthy loan book which is likely to reflect in a strong
earnings growth.
Huge bid pipeline of re-development works at Delhi and other
NBCC
11,693
974
1,089
11.8
State Governments and opportunity from Smart City, positions
NBCC to report strong growth, going forward.
Source: Company, Angel Research
Mid Cap
Market Cap
CMP
Target
Upside
Company
Rationale
(` Cr)
(`)
(`)
(%)
Favorable outlook for the AC industry to augur well for
Cooling products business which is out pacing the market
Blue Star
3,559
396
458
15.8
growth. EMPPAC division's profitability to improve once
operating environment turns around.
With a focus on the low and medium income (LMI) consumer
Dewan Housing
5,549
190
270
42.0
segment, the company has increased its presence in tier-II &
III cities where the growth opportunity is immense.
Commencement of new projects, downtrend in the interest
IL&FS Transport
2,518
77
93
21.5
rate cycle, to lead to stock re-rating
Economic recovery to have favourable impact on advertising
& circulation revenue growth. Further, the acquisition of a
Jagran Prakashan
5,170
158
189
19.5
radio business (Radio City) would also boost the company's
revenue growth.
Speedier execution and speedier sales, strong revenue visibilty
Mahindra Lifespace
1,791
437
554
26.9
in short-to-long run, attractive valuations
Massive capacity expansion along with rail advantage at ICD
Navkar Corporation
2,609
183
265
44.8
as well CFS augurs well for the company
Earnings boost on back of stable material prices and
Radico Khaitan
1,209
91
156
71.6
favourable pricing environment. Valuation discount to peers
provides additional comfort
Strong brands and distribution network would boost growth
Siyaram Silk Mills
935
997
1,354
35.8
going ahead. Stock currently trades at an inexpensive
valuation.
Source: Company, Angel Research
Market Outlook
April 12, 2016
Key Upcoming Events
Global economic events release calendar
Date
Time
Country
Event Description
Unit
Period
Bloomberg Data
Last Reported Estimated
Apr 12, 2016
2:00PM
UK
CPI (YoY)
% Change
Mar
0.30
0.40
5:30PM
India
Industrial Production YoY
% Change
Feb
(1.50)
0.70
Apr 13, 2016
US
Producer Price Index (mom)
% Change
Mar
(0.60)
--
China
Exports YoY%
% Change
Mar
(25.40)
10.00
Apr 14, 2016
6:00PM
US
Initial Jobless claims
Thousands
Apr 9
267.00
270.00
6:00PM
US
Consumer price index (mom)
% Change
Mar
(0.20)
0.20
2:30PM
Euro Zone
Euro-Zone CPI (YoY)
%
Mar F
(0.10)
(0.10)
4:30PM
UK
BOE Announces rates
% Ratio
Apr 14
0.50
0.50
Apr 15, 2016
India
Imports YoY%
% Change
Mar
(5.00)
--
India
Exports YoY%
% Change
Mar
(5.66)
--
6:45PM
US
Industrial Production
%
Mar
(0.52)
(0.10)
7:30AM
China
Industrial Production (YoY)
% Change
Mar
5.90
6.00
7:30AM
China
Real GDP (YoY)
% Change
1Q
6.80
6.70
Apr 18, 2016
12:00PM
India
Monthly Wholesale Prices YoY%
% Change
Mar
(0.91)
(0.79)
Apr 19, 2016
6:00PM
US
Housing Starts
Thousands
Mar
1,178.00
1,160.00
6:00PM
US
Building permits
Thousands
Mar
1,177.00
--
Apr 20, 2016
7:30PM
US
Existing home sales
Million
Mar
5.08
5.30
2:00PM
UK
Jobless claims change
% Change
Mar
(18.00)
--
Apr 21, 2016
7:30PM
Euro Zone
Euro-Zone Consumer Confidence
Value
Apr A
(9.70)
--
5:15PM
Euro Zone
ECB announces interest rates
%
Apr 21
--
--
Apr 22, 2016
1:00PM
Germany
PMI Services
Value
Apr P
55.10
--
1:00PM
Germany
PMI Manufacturing
Value
Apr P
50.70
--
Apr 25, 2016
7:30PM
US
New home sales
Thousands
Mar
512.00
--
Apr 26, 2016
7:30PM
US
Consumer Confidence
S.A./ 1985=100
Apr
96.20
--
Apr 27, 2016
2:00PM
UK
GDP (YoY)
% Change
1Q A
2.10
--
11:30PM
US
FOMC rate decision
%
Apr 27
0.50
0.50
Apr 28, 2016
1:25PM
Germany
Unemployment change (000's)
Thousands
Apr
--
--
6:00PM
US
GDP Qoq (Annualised)
% Change
1Q A
1.40
--
Apr 29, 2016
2:30PM
Euro Zone
Euro-Zone GDP s.a. (QoQ)
% Change
1Q A
0.30
--
May 1,, 2016
6:30AM
China
PMI Manufacturing
Value
Apr
50.20
--
May 3,, 2016
2:00PM
UK
PMI Manufacturing
Value
Apr
51.00
--
Source: Bloomberg, Angel Research
Market Outlook
April 12, 2016
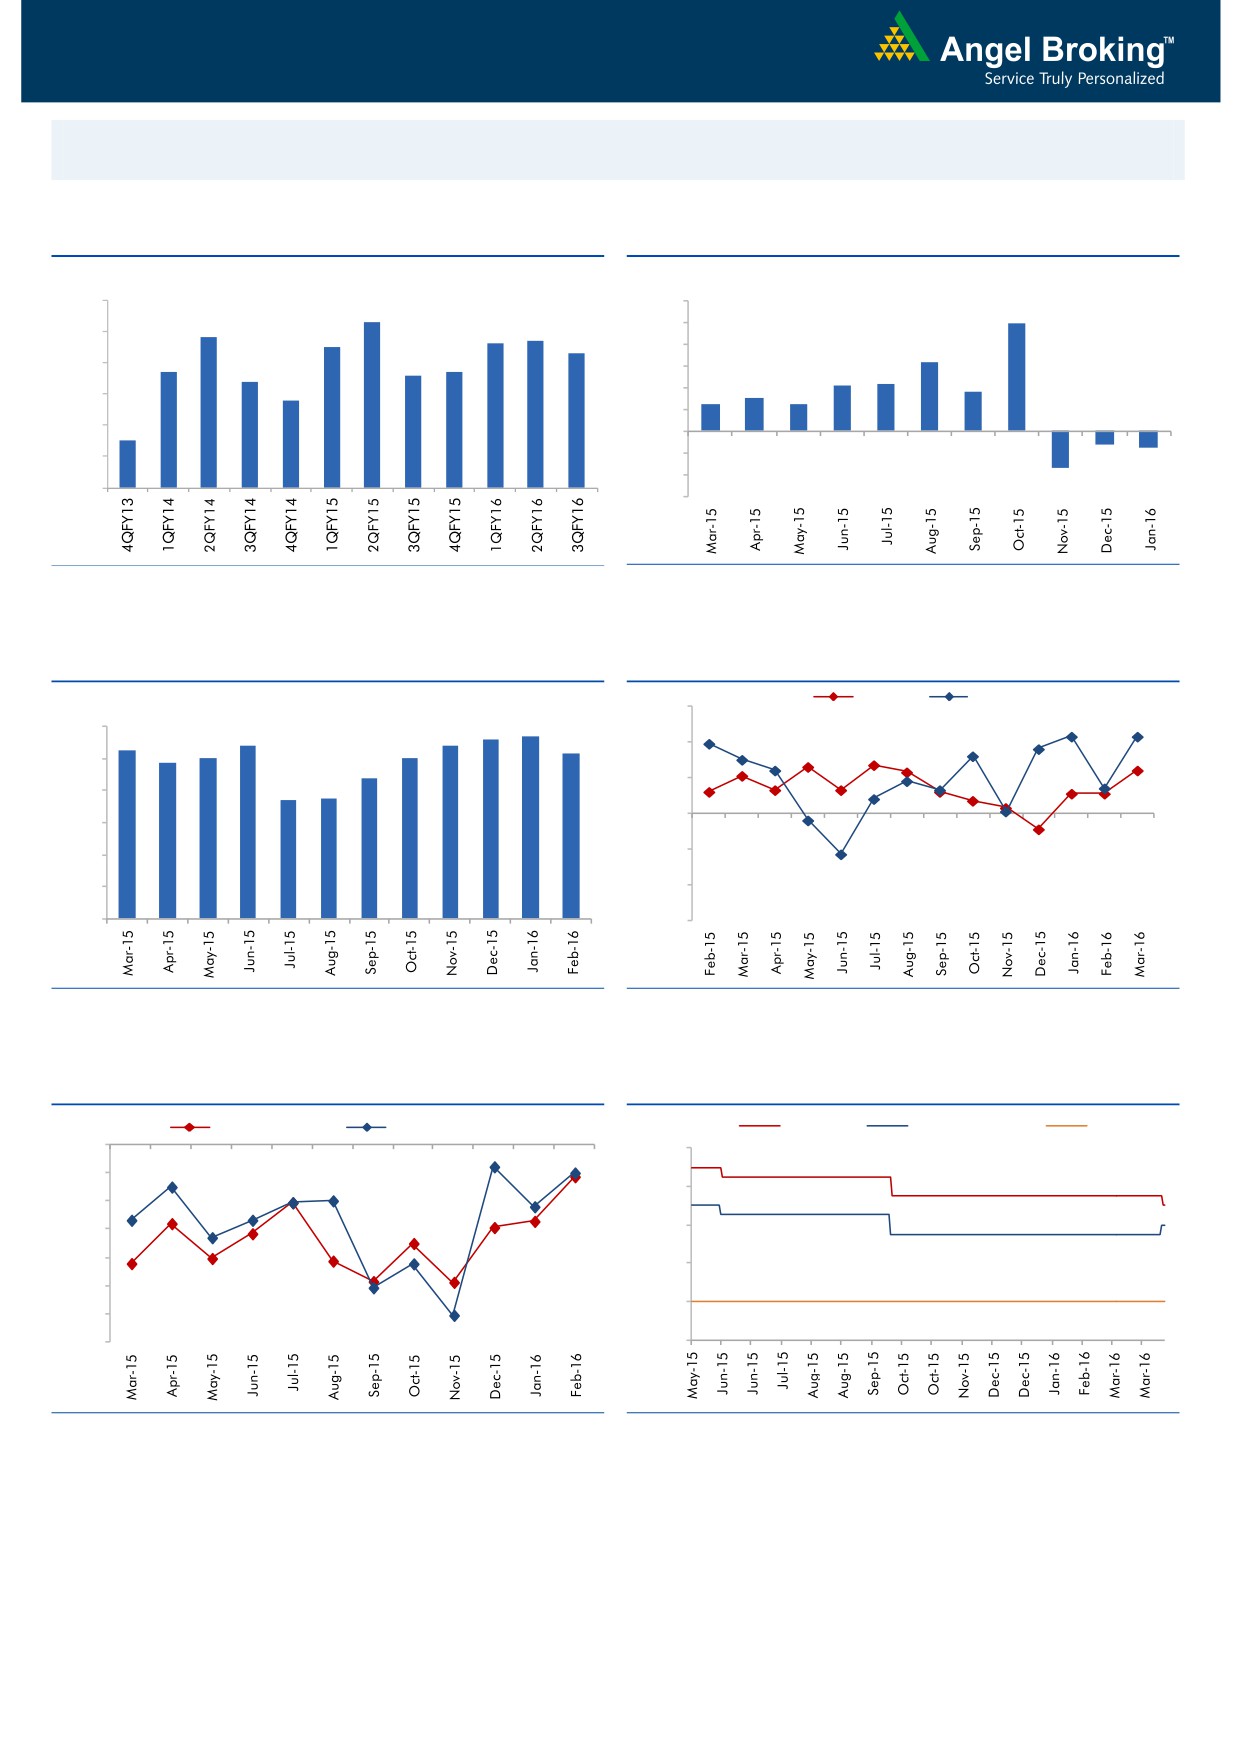
Macro watch
Exhibit 1: Quarterly GDP trends
Exhibit 2: IIP trends
(%)
(%)
9.0
12.0
8.3
9.9
7.8
7.6
7.7
10.0
8.0
7.5
7.3
8.0
6.3
6.7
6.6
6.7
7.0
6.4
6.0
4.2
4.3
3.7
5.8
3.0
4.0
2.5
2.5
6.0
2.0
5.0
4.5
-
4.0
(2.0)
(1.2)
(1.5)
(4.0)
3.0
(3.4)
(6.0)
Source: CSO, Angel Research
Source: MOSPI, Angel Research
Exhibit 3: Monthly CPI inflation trends
Exhibit 4: Manufacturing and services PMI
Mfg. PMI
Services PMI
(%)
56.0
5.6
5.7
6.0
5.4
5.4
5.3
5.2
4.9
5.0
5.0
54.0
5.0
4.4
3.7
3.7
52.0
4.0
50.0
3.0
48.0
2.0
1.0
46.0
-
44.0
Source: MOSPI, Angel Research
Source: Market, Angel Research; Note: Level above 50 indicates expansion
Exhibit 5: Exports and imports growth trends
Exhibit 6: Key policy rates
(%)
Exports yoy growth
Imports yoy growth
(%)
Repo rate
Reverse Repo rate
CRR
0.0
8.00
(5.0)
7.00
(10.0)
(15.0)
6.00
(20.0)
5.00
(25.0)
4.00
(30.0)
(35.0)
3.00
Source: Bloomberg, Angel Research
Source: RBI, Angel Research
Market Outlook
April 12, 2016
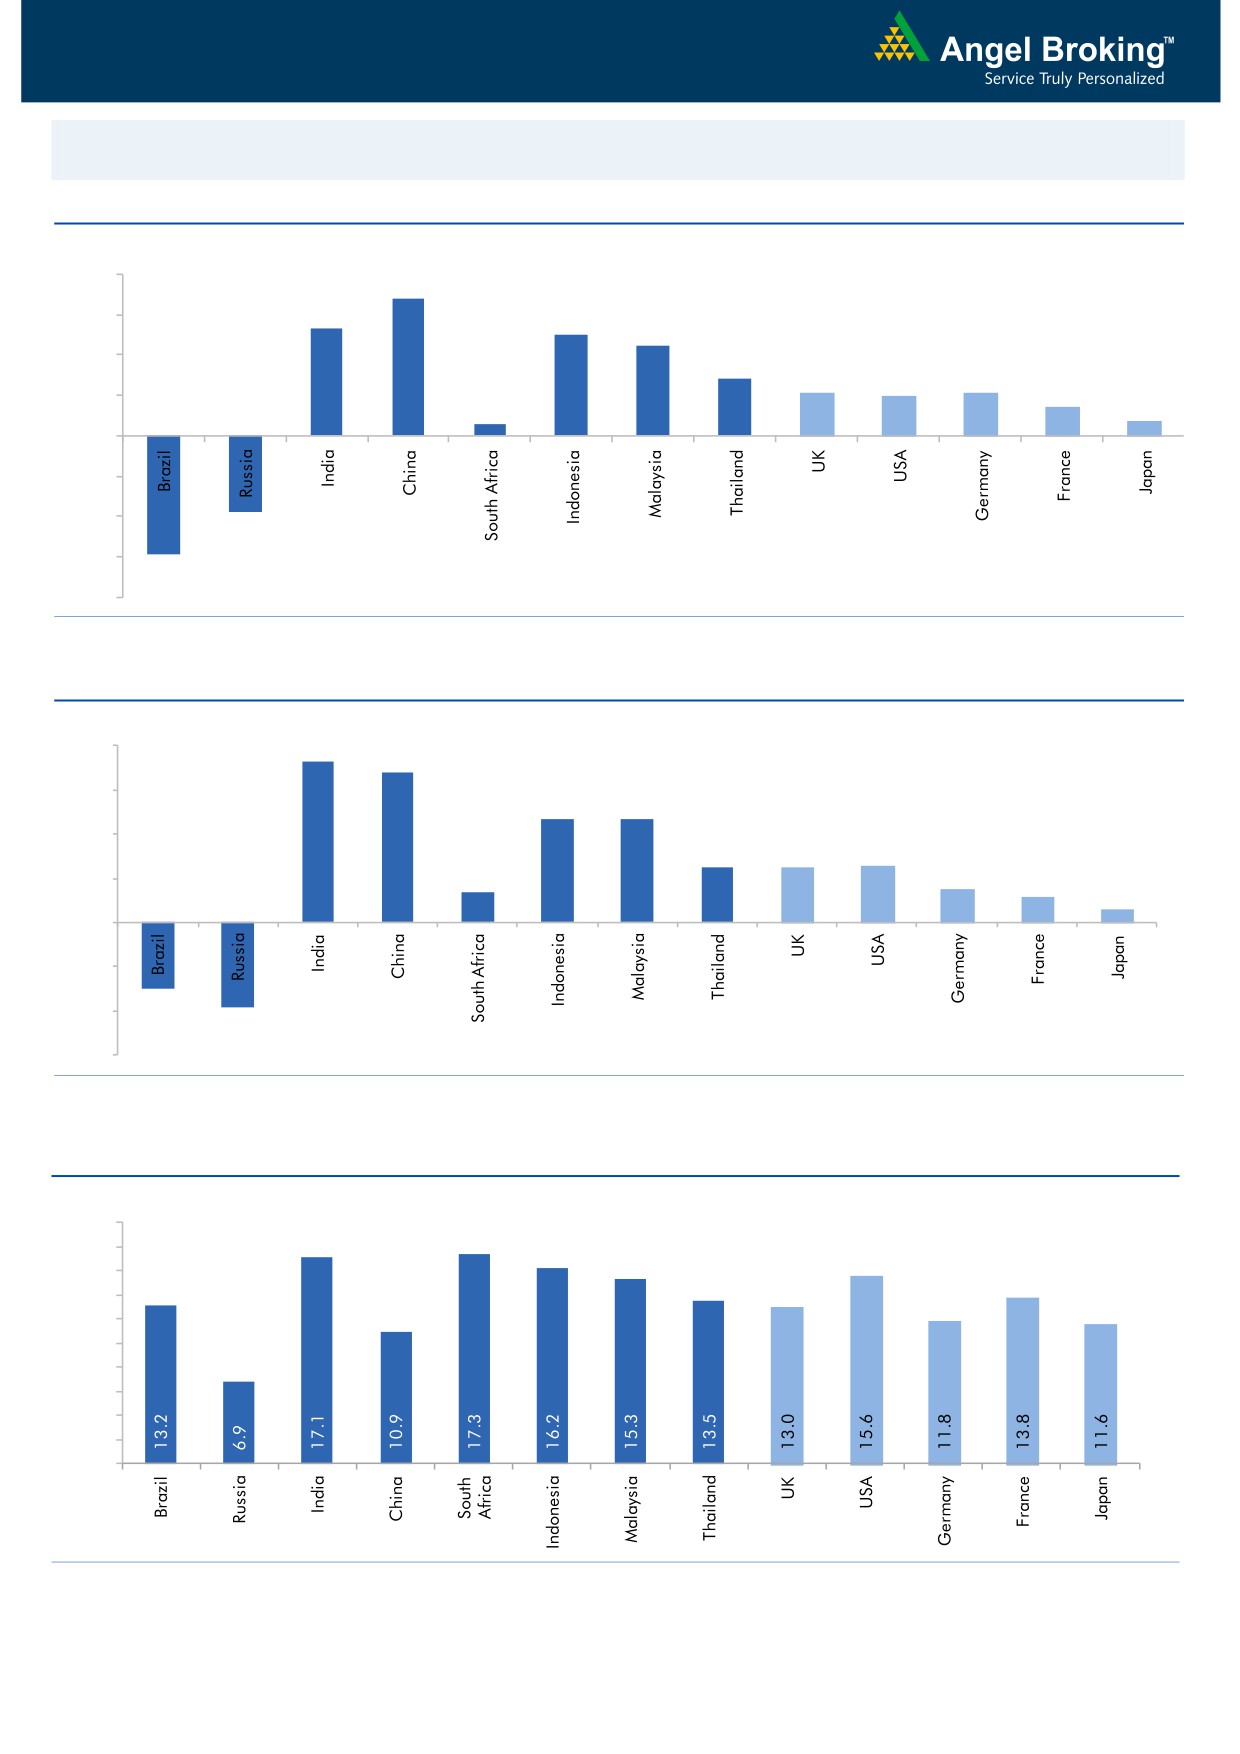
Global watch
Exhibit 1: Latest quarterly GDP Growth (%, yoy) across select developing and developed countries
(%)
8.0
6.8
6.0
5.3
5.0
4.5
4.0
2.8
2.1
2.0
2.1
1.4
2.0
0.6
0.7
-
(2.0)
(4.0)
(3.8)
(6.0)
(5.9)
(8.0)
Source: Bloomberg, Angel Research
Exhibit 2: 2015 GDP Growth projection by IMF (%, yoy) across select developing and developed countries
(%)
8.0
7.3
6.8
6.0
4.7
4.7
4.0
2.5
2.5
2.6
1.4
1.5
2.0
1.2
0.6
-
(2.0)
(3.0)
(4.0)
(3.8)
(6.0)
Source: IMF, Angel Research
Exhibit 3: One year forward P-E ratio across select developing and developed countries
(x)
20.0
18.0
16.0
14.0
12.0
10.0
8.0
6.0
4.0
2.0
-
Source: IMF, Angel Research
Market Outlook
April 12, 2016
Exhibit 4: Relative performance of indices across globe
Returns (%)
Country
Name of index
Closing price
1M
3M
1YR
Brazil
Bovespa
50,165
3.1
20.1
(4.1)
Russia
Micex
1,907
1.2
9.1
14.3
India
Nifty
7,671
2.5
(0.9)
(11.4)
China
Shanghai Composite
3,034
7.9
(7.9)
(20.9)
South Africa
Top 40
45,206
(3.0)
4.7
(3.4)
Mexico
Mexbol
44,761
(0.5)
7.4
(0.3)
Indonesia
LQ45
826
(0.9)
4.6
(14.1)
Malaysia
KLCI
1,715
1.4
2.8
(6.5)
Thailand
SET 50
869
(3.5)
11.7
(12.9)
USA
Dow Jones
17,556
3.3
6.3
(2.3)
UK
FTSE
6,200
1.2
4.9
(12.4)
Japan
Nikkei
15,751
(5.4)
(11.3)
(17.3)
Germany
DAX
9,683
(0.1)
(1.7)
(20.8)
France
CAC
4,313
(2.1)
(0.5)
(16.1)
Source: Bloomberg, Angel Research
Stock Watch
April 12, 2016
Company Name
Reco
CMP
Target
Mkt Cap
Sales ( Čcr )
OPM(%)
EPS (Č)
PER(x)
P/BV(x)
RoE(%)
EV/Sales(x)
(Č)
Price ( Č)
( Č cr )
FY16E FY17E
FY16E
FY17E
FY16E
FY17E
FY16E
FY17E
FY16E
FY17E
FY16E
FY17E
FY16E
FY17E
Agri / Agri Chemical
Rallis
Neutral
179
-
3,477
2,097
2,415
14.4
14.4
9.5
11.0
18.8
16.3
3.7
3.2
21.1
21.3
1.7
1.5
United Phosphorus
Neutral
476
-
20,380
12,500
14,375
18.3
18.3
29.8
35.9
16.0
13.3
2.9
2.5
20.0
20.3
1.7
1.4
Auto & Auto Ancillary
Ashok Leyland
Neutral
110
-
31,219
17,995
21,544
11.4
11.6
3.4
4.7
32.3
23.3
5.7
5.2
17.7
22.2
1.7
1.4
Bajaj Auto
Accumulate
2,432
2,585
70,368
22,709
25,860
20.9
20.1
129.0
143.6
18.9
16.9
5.8
5.0
30.7
29.4
2.6
2.3
Bharat Forge
Accumulate
777
875
18,088
7,351
8,318
19.9
19.7
31.2
36.5
24.9
21.3
4.5
3.8
19.3
19.2
2.6
2.3
Eicher Motors
Neutral
19,389
-
52,663
15,556
16,747
15.5
17.3
464.8
597.5
41.7
32.5
15.2
11.2
36.2
34.3
3.3
3.0
Gabriel India
Accumulate
91
101
1,311
1,415
1,544
8.7
9.0
4.6
5.4
19.8
16.9
3.6
3.2
18.1
18.9
0.9
0.8
Hero Motocorp
Neutral
2,977
-
59,438
28,244
30,532
15.5
15.9
156.7
168.5
19.0
17.7
7.6
6.4
39.9
36.4
1.9
1.8
Jamna Auto Industries Accumulate
146
160
1,163
1,281
1,473
11.2
11.5
7.6
9.2
19.2
15.8
4.8
4.0
25.4
25.2
1.0
0.8
L G Balakrishnan & Bros Neutral
480
-
753
1,254
1,394
11.6
11.8
35.9
41.7
13.4
11.5
1.8
1.6
13.5
13.8
0.7
0.6
Mahindra and Mahindra Accumulate
1,233
1,364
76,553
38,416
42,904
13.7
13.9
54.8
63.4
22.5
19.4
3.5
3.1
15.4
15.8
1.6
1.4
Maruti
Neutral
3,479
-
105,082
57,865
68,104
16.4
16.7
176.3
225.5
19.7
15.4
3.8
3.3
19.4
21.2
1.6
1.3
Minda Industries
Neutral
1,011
-
1,604
2,523
2,890
8.7
9.0
55.0
65.4
18.4
15.5
3.6
2.9
19.3
18.7
0.7
0.6
Motherson Sumi
Buy
253
313
33,419
39,343
45,100
8.8
9.1
10.1
12.5
25.0
20.2
7.9
6.2
35.3
34.4
0.9
0.8
Rane Brake Lining
Buy
376
465
298
454
511
11.5
12.0
25.2
31.0
14.9
12.1
2.2
2.0
14.9
16.6
0.8
0.7
Setco Automotive
Neutral
30
-
401
594
741
12.7
13.7
1.7
3.2
17.7
9.4
1.9
1.6
10.4
16.9
1.1
0.9
Tata Motors
Neutral
386
-
111,403
259,686
273,957
13.0
13.4
25.9
29.5
14.9
13.1
2.0
1.7
8.0
9.0
0.6
0.6
TVS Motor
Neutral
315
-
14,977
11,263
13,122
6.9
8.5
9.2
15.0
34.3
21.0
7.8
6.2
22.7
29.6
1.3
1.1
Amara Raja Batteries
Buy
891
1,040
15,215
4,892
5,871
17.4
17.6
28.8
37.1
30.9
24.0
7.2
5.8
23.4
24.1
3.1
2.5
Exide Industries
Buy
134
162
11,428
6,950
7,784
14.4
14.8
6.6
7.3
20.4
18.4
2.6
2.3
12.6
12.8
1.4
1.2
Apollo Tyres
Accumulate
168
183
8,562
12,056
12,714
17.2
16.4
23.0
20.3
7.3
8.3
1.3
1.1
17.7
13.6
0.8
0.8
Ceat
Neutral
1,073
-
4,340
6,041
6,597
14.1
13.7
99.5
111.9
10.8
9.6
2.1
1.8
19.6
18.5
0.9
0.7
JK Tyres
Neutral
83
-
1,873
7,446
7,669
15.2
14.0
19.6
18.4
4.2
4.5
1.1
0.9
25.2
19.5
0.6
0.6
Swaraj Engines
Neutral
989
-
1,228
552
630
14.2
14.7
44.6
54.1
22.2
18.3
5.2
4.7
23.2
25.6
2.1
1.8
Subros
Neutral
87
-
524
1,293
1,527
11.8
11.9
4.2
6.7
20.8
13.0
1.6
1.4
7.7
11.5
0.7
0.6
Indag Rubber
Neutral
178
-
468
283
329
17.0
17.2
13.0
15.4
13.8
11.6
3.0
2.5
21.8
21.6
1.4
1.1
Capital Goods
ACE
Neutral
40
-
398
660
839
4.7
8.2
1.0
3.9
40.2
10.3
1.3
1.1
3.2
11.3
0.8
0.6
BEML
Buy
882
1,157
3,671
3,277
4,006
6.0
8.9
36.2
64.3
24.4
13.7
1.7
1.5
5.7
11.7
1.2
0.9
Bharat Electronics
Buy
1,151
1,414
27,616
7,737
8,634
16.8
17.2
54.0
61.5
21.3
18.7
3.0
2.7
39.3
45.6
2.7
2.3
Stock Watch
April 12, 2016
Company Name
Reco
CMP
Target
Mkt Cap
Sales ( Čcr )
OPM(%)
EPS (Č)
PER(x)
P/BV(x)
RoE(%)
EV/Sales(x)
(Č)
Price ( Č)
( Č cr )
FY16E
FY17E
FY16E
FY17E
FY16E
FY17E
FY16E
FY17E
FY16E
FY17E
FY16E
FY17E
FY16E
FY17E
Capital Goods
Voltas
Buy
276
353
9,118
5,363
5,963
8.0
9.1
11.0
13.8
25.1
20.0
3.8
3.4
16.2
17.9
1.6
1.5
BGR Energy
Neutral
106
-
763
3,615
3,181
9.5
9.4
16.7
12.4
6.3
8.5
0.6
0.6
10.0
7.0
0.6
0.8
BHEL
Neutral
127
-
31,170
33,722
35,272
10.8
11.7
10.5
14.2
12.1
9.0
0.9
0.8
7.0
9.0
1.0
1.0
Blue Star
Buy
396
458
3,559
3,548
3,977
6.3
6.9
13.7
17.2
28.9
23.1
7.3
4.7
26.1
25.4
1.1
0.9
Crompton Greaves
Neutral
52
-
3,278
13,484
14,687
4.9
6.2
4.5
7.1
11.6
7.4
0.8
0.8
7.2
10.8
0.4
0.3
Greaves Cotton
Neutral
127
-
3,101
1,655
1,755
16.6
16.8
7.4
7.8
17.2
16.3
3.4
3.3
21.1
20.6
1.8
1.7
Inox Wind
Buy
245
458
5,431
4,980
5,943
17.0
17.5
26.6
31.6
9.2
7.8
2.8
2.0
35.0
30.0
1.2
1.0
KEC International
Neutral
130
-
3,329
8,791
9,716
6.1
6.8
5.4
8.2
24.0
15.8
2.4
2.2
10.0
14.0
0.6
0.6
Thermax
Neutral
746
-
8,892
6,413
7,525
7.4
8.5
30.5
39.3
24.5
19.0
3.8
3.3
15.0
17.0
1.4
1.1
VATech Wabag
Neutral
552
-
3,007
2,722
3,336
7.9
8.1
19.5
24.6
28.3
22.4
3.0
2.6
11.1
12.4
1.2
1.0
Cement
ACC
Neutral
1,448
-
27,176
13,151
14,757
16.4
18.3
63.9
83.4
22.7
17.4
2.9
2.7
13.3
16.1
1.9
1.6
Ambuja Cements
Neutral
224
-
34,762
11,564
12,556
19.4
20.7
8.9
10.1
25.2
22.2
3.2
3.0
12.8
13.8
2.7
2.4
HeidelbergCement
Neutral
98
-
2,222
1,772
1,926
13.3
15.4
1.0
3.0
98.1
32.7
2.5
2.3
2.6
7.9
1.8
1.6
India Cements
Neutral
92
-
2,823
4,216
4,840
18.0
19.5
4.0
9.9
23.0
9.3
0.9
0.9
4.0
9.5
1.0
0.8
JK Cement
Neutral
673
-
4,706
3,661
4,742
10.1
15.8
7.5
28.5
89.7
23.6
2.7
2.4
7.5
22.9
1.8
1.3
J K Lakshmi Cement
Neutral
346
-
4,070
2,947
3,616
16.7
19.9
11.5
27.2
30.1
12.7
2.9
2.5
9.8
20.8
1.8
1.4
Mangalam Cements
Neutral
240
-
642
1,053
1,347
10.5
13.3
8.4
26.0
28.6
9.3
1.2
1.1
4.3
12.5
1.0
0.7
Orient Cement
Neutral
156
-
3,196
1,854
2,524
21.2
22.2
7.7
11.1
20.3
14.1
2.9
2.5
13.3
15.7
2.5
1.7
Ramco Cements
Neutral
435
-
10,354
4,036
4,545
20.8
21.3
15.1
18.8
28.8
23.1
3.5
3.1
12.9
14.3
3.1
2.7
Shree Cement^
Neutral
12,458
-
43,400
7,150
8,742
26.7
28.6
228.0
345.5
54.6
36.1
8.0
6.8
15.7
20.3
5.8
4.7
UltraTech Cement
Neutral
3,154
-
86,547
24,669
29,265
18.2
20.6
82.0
120.0
38.5
26.3
4.1
3.6
11.3
14.7
3.6
3.0
Construction
ITNL
Buy
77
93
2,518
7,360
8,825
34.0
35.9
7.0
9.0
10.9
8.5
0.4
0.4
3.2
3.7
3.7
3.6
KNR Constructions
Buy
516
603
1,450
937
1,470
14.3
14.0
44.2
38.6
11.7
13.4
2.3
2.0
15.4
15.4
1.6
1.1
Larsen & Toubro
Accumulate
1,213
1,310
112,970
58,870
65,708
8.3
10.3
42.0
53.0
28.9
22.9
2.0
1.8
8.8
11.2
2.1
1.9
Gujarat Pipavav Port
Neutral
174
-
8,407
629
684
51.0
52.2
6.4
5.9
27.2
29.5
3.6
3.3
15.9
12.7
13.0
11.8
MBL Infrastructures
Buy
154
285
637
2,313
2,797
12.2
14.6
19.0
20.0
8.1
7.7
0.8
0.8
11.3
10.6
1.0
0.9
Nagarjuna Const.
Neutral
73
-
4,078
7,892
8,842
8.8
9.1
3.0
5.3
24.5
13.8
1.2
1.1
5.0
8.5
0.8
0.6
PNC Infratech
Accumulate
527
558
2,703
1,873
2,288
13.2
13.5
24.0
32.0
22.0
16.5
2.1
1.9
12.1
12.3
1.5
1.3
Simplex Infra
Neutral
246
-
1,216
5,955
6,829
10.3
10.5
16.0
31.0
15.4
7.9
0.8
0.7
5.3
9.9
0.7
0.6
Stock Watch
April 12, 2016
Company Name
Reco
CMP
Target
Mkt Cap
Sales ( Čcr )
OPM(%)
EPS (Č)
PER(x)
P/BV(x)
RoE(%)
EV/Sales(x)
(Č)
Price ( Č)
( Č cr )
FY16E
FY17E
FY16E
FY17E
FY16E
FY17E
FY16E
FY17E
FY16E
FY17E
FY16E
FY17E
FY16E
FY17E
Construction
Power Mech Projects
Neutral
582
-
856
1,539
1,801
12.8
12.7
59.0
72.1
9.9
8.1
1.5
1.3
18.6
16.8
0.6
0.5
Sadbhav Engineering
Accumulate
271
289
4,646
3,481
4,219
10.7
10.8
8.2
11.7
33.0
23.2
3.2
2.8
10.3
13.5
1.6
1.3
NBCC
Accumulate
974
1,089
11,693
5,816
7,382
6.9
7.7
29.6
39.8
32.9
24.5
5.9
4.7
24.1
26.7
1.7
1.3
MEP Infra
Neutral
42
-
683
1,956
1,876
28.1
30.5
1.3
3.0
32.3
14.0
6.8
4.6
21.2
32.8
1.8
1.7
SIPL
Neutral
100
-
3,522
675
1,042
62.4
64.7
-
-
3.8
4.3
-
-
16.9
11.4
Engineers India
Neutral
164
-
5,517
1,667
1,725
13.5
16.0
9.7
11.4
16.9
14.4
2.0
1.9
11.7
13.4
2.1
2.1
Financials
Allahabad Bank
Neutral
56
-
3,456
8,569
9,392
2.8
2.9
16.3
27.5
3.5
2.1
0.3
0.3
7.6
11.9
-
-
Axis Bank
Accumulate
430
494
102,438
26,473
31,527
3.5
3.6
35.7
43.5
12.0
9.9
2.0
1.7
17.9
18.9
-
-
Bank of Baroda
Neutral
149
-
34,378
18,485
21,025
1.9
2.0
13.5
21.1
11.1
7.1
0.9
0.8
7.3
10.6
-
-
Bank of India
Neutral
93
-
7,598
15,972
17,271
1.9
2.0
15.3
33.4
6.1
2.8
0.3
0.2
3.6
7.6
-
-
Canara Bank
Neutral
187
-
10,173
15,441
16,945
2.0
2.1
46.6
70.4
4.0
2.7
0.4
0.3
8.0
11.2
-
-
Dena Bank
Neutral
29
-
1,894
3,440
3,840
2.1
2.3
7.3
10.0
4.1
2.9
0.3
0.3
6.1
7.9
-
-
Dewan Housing Finance Buy
190
270
5,549
1,892
2,277
2.9
2.9
25.9
30.8
7.3
6.2
1.1
1.0
15.3
15.9
-
-
Federal Bank
Neutral
44
-
7,490
3,477
3,999
3.0
3.0
5.0
6.2
8.7
7.0
0.9
0.8
10.6
11.9
-
-
HDFC
Neutral
1,080
-
170,567
10,358
11,852
3.3
3.3
41.1
47.0
26.3
23.0
5.0
4.5
24.7
24.9
-
-
HDFC Bank
Buy
1,070
1,262
270,478
38,309
47,302
4.3
4.3
49.3
61.1
21.7
17.5
3.8
3.2
18.5
19.7
-
-
ICICI Bank
Accumulate
225
254
130,717
34,279
39,262
3.3
3.3
21.0
24.4
10.7
9.2
1.8
1.5
14.4
14.7
-
-
IDBI Bank
Neutral
68
-
14,010
9,625
10,455
1.8
1.8
8.5
14.2
8.0
4.8
0.5
0.5
5.9
9.3
-
-
Indian Bank
Neutral
99
-
4,752
6,160
6,858
2.5
2.5
24.5
29.8
4.0
3.3
0.3
0.3
7.7
8.6
-
-
LIC Housing Finance
Buy
478
592
24,103
3,101
3,745
2.5
2.5
33.0
40.2
14.5
11.9
2.7
2.3
19.7
20.5
-
-
Oriental Bank
Neutral
90
-
2,878
7,643
8,373
2.4
2.4
37.2
45.4
2.4
2.0
0.2
0.2
8.2
9.4
-
-
Punjab Natl.Bank
Neutral
83
-
16,308
23,638
26,557
2.8
2.8
17.9
27.2
4.6
3.1
0.5
0.4
8.5
12.0
-
-
South Ind.Bank
Neutral
18
-
2,363
1,965
2,185
2.5
2.5
2.5
3.3
7.0
5.3
0.7
0.6
9.5
11.7
-
-
St Bk of India
Neutral
188
-
146,057
79,958
86,061
2.6
2.6
13.4
20.7
14.1
9.1
1.1
1.1
11.5
12.8
-
-
Union Bank
Neutral
130
-
8,906
12,646
14,129
2.3
2.4
31.0
39.1
4.2
3.3
0.5
0.4
9.8
11.4
-
-
Vijaya Bank
Neutral
31
-
2,924
3,536
3,827
1.9
1.9
5.5
6.7
5.7
4.7
0.5
0.4
7.8
8.8
-
-
Yes Bank
Neutral
860
-
36,149
7,190
9,011
3.2
3.3
58.2
69.7
14.8
12.3
2.6
2.2
19.2
19.6
-
-
FMCG
Asian Paints
Neutral
860
-
82,472
16,553
19,160
16.0
16.2
17.7
21.5
48.7
40.0
12.9
11.6
29.4
31.2
4.8
4.2
Britannia
Neutral
2,656
-
31,870
8,481
9,795
14.0
14.1
65.5
78.3
40.6
33.9
19.2
15.8
38.3
41.2
3.6
3.1
Stock Watch
April 12, 2016
Company Name
Reco
CMP
Target
Mkt Cap
Sales ( Čcr )
OPM(%)
EPS (Č)
PER(x)
P/BV(x)
RoE(%)
EV/Sales(x)
(Č)
Price ( Č)
( Č cr )
FY16E FY17E
FY16E
FY17E
FY16E
FY17E
FY16E
FY17E
FY16E
FY17E
FY16E
FY17E
FY16E
FY17E
FMCG
Colgate
Neutral
815
-
22,168
4,836
5,490
19.5
19.7
48.5
53.2
16.8
15.3
12.3
10.7
99.8
97.5
4.5
3.9
Dabur India
Accumulate
252
267
44,401
9,370
10,265
17.1
17.2
7.3
8.1
34.4
31.2
10.4
8.4
33.7
30.6
4.6
4.2
GlaxoSmith Con*
Neutral
6,030
-
25,358
4,919
5,742
17.2
17.4
168.3
191.2
35.8
31.5
10.2
8.7
28.8
28.9
4.7
4.0
Godrej Consumer
Neutral
1,353
-
46,083
10,168
12,886
16.1
16.1
32.1
38.4
42.2
35.2
8.6
7.9
19.7
21.0
4.6
3.6
HUL
Neutral
863
-
186,813
34,940
38,957
17.5
17.7
20.8
24.7
41.5
35.0
46.2
36.9
110.5
114.2
5.2
4.6
ITC
Accumulate
327
359
262,741
36,804
38,776
37.9
37.9
12.2
12.9
26.8
25.3
7.4
6.5
27.7
25.8
6.7
6.4
Marico
Neutral
254
-
32,712
6,551
7,766
15.7
16.0
10.4
12.5
24.4
20.3
7.1
5.9
33.2
32.4
4.9
4.2
Nestle*
Accumulate
5,873
6,646
56,622
11,291
12,847
22.2
22.3
158.9
184.6
37.0
31.8
19.3
17.4
55.0
57.3
4.9
4.2
Tata Global
Buy
120
144
7,542
8,635
9,072
9.8
9.9
6.5
7.6
18.4
15.7
1.8
1.8
6.8
7.4
0.8
0.8
IT
HCL Tech^
Buy
839
1,038
118,352
42,038
47,503
21.2
21.5
51.5
57.7
16.3
14.5
3.5
2.7
21.5
18.8
2.4
2.0
Infosys
Accumulate
1,184
1,347
272,938
61,850
69,981
27.5
27.5
59.4
65.7
19.9
18.0
4.2
3.6
21.2
20.1
3.7
3.1
TCS
Accumulate
2,507
2,854
493,917
108,487
122,590
28.3
28.5
122.8
138.4
20.4
18.1
7.8
7.0
38.0
38.9
4.1
3.6
Tech Mahindra
Accumulate
469
530
45,371
26,524
29,177
16.2
17.0
28.8
33.6
16.3
14.0
3.1
2.7
19.3
19.1
1.5
1.3
Wipro
Buy
565
680
139,657
50,808
56,189
23.7
23.8
37.3
40.7
15.2
13.9
2.9
2.6
19.2
17.7
2.2
1.8
Media
D B Corp
Accumulate
311
356
5,722
2,241
2,495
27.8
27.9
21.8
25.6
14.3
12.2
3.7
3.3
26.7
28.5
2.5
2.2
HT Media
Neutral
80
-
1,860
2,495
2,603
11.2
11.2
7.3
8.6
11.0
9.3
0.9
0.8
7.4
8.1
0.3
0.2
Jagran Prakashan
Buy
158
189
5,170
2,170
2,355
27.2
26.2
8.9
9.9
17.8
16.0
3.7
3.3
20.9
20.5
2.3
2.1
Sun TV Network
Neutral
355
-
13,974
2,779
3,196
70.2
70.5
22.8
27.3
15.6
13.0
3.8
3.5
26.7
28.3
4.8
4.1
Hindustan Media
Neutral
250
-
1,833
920
1,031
20.0
20.0
19.2
20.9
13.0
12.0
2.1
1.8
16.4
15.3
1.5
1.3
Ventures
Metals & Mining
Coal India
Buy
281
380
177,395
76,167
84,130
19.9
22.3
22.4
25.8
12.5
10.9
4.5
4.4
35.5
41.0
1.7
1.5
Hind. Zinc
Accumulate
160
175
67,647
14,641
14,026
50.4
50.4
17.7
16.0
9.1
10.0
1.4
1.3
16.2
13.2
2.2
2.1
Hindalco
Neutral
92
-
19,070
104,356
111,186
8.7
9.5
6.7
11.1
13.7
8.4
0.5
0.5
3.5
5.9
0.7
0.6
JSW Steel
Neutral
1,301
-
31,450
42,308
45,147
16.4
20.7
(10.3)
49.5
26.3
1.5
1.4
(1.0)
5.6
1.8
1.7
NMDC
Neutral
103
-
40,698
8,237
10,893
46.6
44.5
10.0
11.7
10.3
8.8
1.2
1.0
12.5
13.0
4.7
3.6
SAIL
Neutral
44
-
18,069
45,915
53,954
7.2
10.5
1.5
4.4
29.1
10.0
0.4
0.4
2.3
4.1
1.0
0.9
Vedanta
Neutral
90
-
26,771
71,445
81,910
26.2
26.3
12.9
19.2
7.0
4.7
0.5
0.4
7.2
8.9
0.8
0.6
Tata Steel
Neutral
331
-
32,162
126,760
137,307
8.9
11.3
6.4
23.1
52.1
14.4
1.0
1.0
2.0
7.1
0.8
0.8
Oil & Gas
Cairn India
Neutral
152
-
28,414
11,323
12,490
49.4
51.0
20.7
20.7
7.3
7.3
0.5
0.5
6.4
6.1
1.6
0.9
GAIL
Neutral
352
-
44,600
64,856
70,933
9.1
9.6
24.0
28.9
14.7
12.2
1.3
1.2
8.8
9.6
0.9
0.8
Stock Watch
April 12, 2016
Company Name
Reco
CMP
Target
Mkt Cap
Sales ( Čcr )
OPM(%)
EPS (Č)
PER(x)
P/BV(x)
RoE(%)
EV/Sales(x)
(Č)
Price ( Č)
( Č cr )
FY16E FY17E
FY16E
FY17E
FY16E
FY17E
FY16E
FY17E
FY16E
FY17E
FY16E
FY17E
FY16E
FY17E
Oil & Gas
ONGC
Neutral
207
-
177,484
154,564
167,321
36.8
37.4
28.6
32.5
7.3
6.4
0.9
0.9
12.7
13.5
1.4
1.3
Petronet LNG
Neutral
244
-
18,315
29,691
31,188
5.8
6.2
12.8
13.4
19.1
18.2
2.9
2.5
15.8
14.8
0.7
0.7
Indian Oil Corp
Accumulate
416
455
101,003
359,607
402,760
5.9
6.1
42.5
48.7
9.8
8.5
1.3
1.2
14.1
14.4
0.4
0.3
Reliance Industries
Accumulate
1,040
1,150
336,950
304,775
344,392
12.6
13.4
91.3
102.6
11.4
10.1
1.3
1.2
11.8
12.0
1.0
0.9
Pharmaceuticals
Alembic Pharma
Neutral
553
-
10,416
3,274
3,802
26.9
19.4
35.0
28.7
15.8
19.3
7.0
5.3
55.6
31.2
3.2
2.6
Aurobindo Pharma
Accumulate
772
856
45,184
14,923
17,162
22.0
23.0
35.7
42.8
21.6
18.0
6.4
4.8
34.0
30.2
3.4
2.9
Aventis*
Neutral
4,414
-
10,166
2,082
2,371
17.4
20.8
118.2
151.5
37.3
29.1
5.5
4.4
19.9
25.5
4.6
3.8
Cadila Healthcare
Accumulate
317
352
32,463
10,224
11,840
21.0
22.0
14.6
17.6
21.7
18.0
6.0
4.7
30.8
29.0
3.2
2.7
Cipla
Buy
503
605
40,378
13,979
16,447
20.2
18.6
25.7
27.5
19.6
18.3
3.2
2.8
17.6
16.1
2.9
2.4
Dr Reddy's
Buy
3,029
3,933
51,648
16,838
19,575
25.0
23.1
167.5
178.8
18.1
16.9
3.8
3.2
23.1
20.4
3.0
2.5
Dishman Pharma
Neutral
334
-
2,696
1,733
1,906
21.5
21.5
17.0
19.9
19.7
16.8
2.0
1.8
10.5
11.2
2.1
1.8
GSK Pharma*
Neutral
3,668
-
31,068
2,870
3,158
20.0
22.1
59.5
68.3
61.7
53.7
18.2
18.7
28.5
34.3
10.3
9.4
Indoco Remedies
Neutral
271
-
2,501
1,033
1,199
15.9
18.2
9.4
13.6
28.9
20.0
4.3
3.6
15.7
19.7
2.5
2.2
Ipca labs
Buy
488
900
6,156
3,363
3,909
12.9
18.6
13.4
28.0
36.4
17.4
2.6
2.3
7.4
14.0
2.1
1.8
Lupin
Neutral
1,518
-
68,376
13,092
16,561
25.0
27.0
50.4
68.3
30.1
22.2
6.2
4.9
22.8
24.7
4.9
3.8
Sun Pharma
Buy
817
950
196,553
28,163
32,610
25.8
30.7
17.4
26.9
46.9
30.4
4.5
3.9
13.0
16.6
6.4
5.4
Power
Tata Power
Neutral
68
-
18,310
35,923
37,402
22.6
22.8
4.1
5.2
16.7
13.1
1.3
1.2
7.5
9.3
1.5
1.3
NTPC
Accumulate
135
146
110,984
87,271
99,297
23.5
23.5
11.8
13.3
11.5
10.1
1.3
1.2
11.5
12.2
2.3
2.0
Power Grid
Buy
142
170
74,341
20,702
23,361
86.7
86.4
12.1
13.2
11.8
10.8
1.7
1.5
15.6
15.1
8.5
7.9
Real Estate
MLIFE
Buy
437
554
1,791
697
1,011
14.9
19.3
13.8
20.1
31.6
21.7
1.2
1.1
3.8
5.3
3.9
2.6
Telecom
Bharti Airtel
Neutral
348
-
139,249
101,748
109,191
32.1
31.7
12.0
12.5
29.0
27.9
2.0
1.9
6.9
6.7
2.0
1.8
Idea Cellular
Neutral
115
-
41,514
34,282
36,941
32.0
31.5
5.9
6.2
19.5
18.6
1.8
1.6
9.9
9.3
1.8
1.7
zOthers
Abbott India
Neutral
4,614
-
9,805
2,715
3,153
14.5
14.1
134.3
152.2
34.4
30.3
8.6
7.1
27.4
25.6
3.3
2.8
Bajaj Electricals
Accumulate
212
237
2,139
4,719
5,287
5.2
5.8
8.6
12.7
24.8
16.7
2.8
2.5
11.4
14.8
0.5
0.4
Finolex Cables
Neutral
281
-
4,297
2,520
2,883
12.2
12.0
12.7
14.2
22.2
19.8
3.0
2.7
13.6
13.5
1.5
1.2
Goodyear India*
Buy
492
582
1,136
1,800
1,600
11.7
11.5
58.7
52.9
8.4
9.3
1.9
1.6
24.6
18.7
0.4
0.4
Hitachi
Neutral
1,182
-
3,213
1,779
2,081
7.8
8.8
21.8
33.4
54.2
35.4
8.8
7.1
17.4
22.1
1.9
1.6
Jyothy Laboratories
Neutral
301
-
5,447
1,620
1,847
11.5
11.5
7.3
8.5
41.3
35.5
5.3
4.9
13.3
14.4
3.2
2.8
MRF
Buy
35,826
45,575
15,194
20,316
14,488
21.4
21.1
5,488.0
3,798.0
6.5
9.4
2.2
1.8
41.1
21.2
0.7
0.9
Stock Watch
April 12, 2016
Company Name
Reco
CMP
Target
Mkt Cap
Sales ( Čcr )
OPM(%)
EPS (Č)
PER(x)
P/BV(x)
RoE(%)
EV/Sales(x)
(Č)
Price ( Č)
( Č cr )
FY16E
FY17E
FY16E
FY17E
FY16E
FY17E
FY16E
FY17E
FY16E
FY17E
FY16E
FY17E
FY16E
FY17E
zOthers
Page Industries
Neutral
12,957
-
14,453
1,929
2,450
19.8
20.1
229.9
299.0
56.4
43.3
24.9
17.3
52.1
47.1
7.5
5.9
Relaxo Footwears
Neutral
487
-
5,844
1,767
2,152
12.3
12.5
19.3
25.1
25.3
19.4
6.2
4.8
27.7
27.8
3.4
2.7
Siyaram Silk Mills
Buy
997
1,354
935
1,636
1,815
11.5
11.5
89.9
104.1
11.1
9.6
1.8
1.6
17.9
17.8
0.7
0.7
Styrolution ABS India* Neutral
590
-
1,038
1,271
1,440
8.6
9.2
32.0
41.1
18.4
14.4
1.9
1.7
10.7
12.4
0.8
0.7
TVS Srichakra
Buy
2,477
3,217
1,897
2,035
2,252
15.9
15.3
248.6
268.1
10.0
9.2
4.4
3.1
43.6
33.9
1.0
0.8
HSIL
Neutral
301
-
2,177
2,123
2,384
16.1
16.5
15.0
18.9
20.0
16.0
1.6
1.4
8.0
9.4
1.4
1.2
Kirloskar Engines India
Neutral
232
-
3,355
2,403
2,554
8.6
9.9
9.2
10.5
25.3
22.1
2.4
2.3
9.7
10.7
1.0
1.0
Ltd
M M Forgings
Buy
450
614
543
511
615
21.7
21.6
43.1
55.8
10.4
8.1
1.9
1.6
19.9
21.2
1.3
1.0
Banco Products (India) Neutral
123
-
880
1,208
1,353
11.0
12.3
10.8
14.5
11.4
8.5
1.3
1.2
11.9
14.5
0.7
0.6
Competent Automobiles Neutral
143
-
88
1,040
1,137
3.2
3.1
25.7
28.0
5.5
5.1
0.8
0.7
15.0
14.3
0.1
0.1
Nilkamal
Neutral
1,330
-
1,985
1,871
2,031
10.7
10.5
63.2
69.8
21.1
19.1
3.4
2.9
17.6
16.6
1.1
1.0
Visaka Industries
Buy
121
144
193
1,086
1,197
9.9
10.3
21.5
28.8
5.6
4.2
0.5
0.5
9.6
11.6
0.4
0.3
Transport Corporation of
Neutral
273
-
2,074
2,830
3,350
8.8
9.0
14.4
18.3
19.0
14.9
2.9
2.5
15.4
17.1
0.9
0.7
India
Elecon Engineering
Neutral
62
-
680
1,359
1,482
10.3
13.7
0.8
3.9
77.7
16.0
1.3
1.2
1.6
7.8
0.9
0.8
Surya Roshni
Buy
150
201
655
2,992
3,223
8.1
8.4
14.7
18.3
10.2
8.2
1.0
0.9
9.7
11.0
0.5
0.5
MT Educare
Neutral
181
-
720
286
366
18.3
17.7
7.7
9.4
23.4
19.3
4.9
4.3
20.2
21.1
2.4
1.8
Radico Khaitan
Buy
91
156
1,209
1,517
1,635
12.7
13.4
5.8
7.1
15.6
12.8
1.3
1.2
8.6
9.6
1.3
1.2
Garware Wall Ropes
Buy
330
473
722
862
974
11.2
11.2
24.9
29.6
13.3
11.2
2.0
1.7
15.1
15.4
0.8
0.7
Wonderla Holidays
Neutral
377
-
2,132
206
308
44.0
43.6
9.0
12.9
41.9
29.3
5.7
5.2
13.7
17.8
10.3
6.8
Linc Pen & Plastics
Neutral
190
-
280
340
371
8.3
8.9
10.8
13.2
17.6
14.4
2.8
2.5
16.0
17.1
0.9
0.8
The Byke Hospitality
Neutral
156
-
626
222
287
20.5
20.5
5.6
7.6
27.7
20.7
5.2
4.3
18.9
20.8
2.9
2.2
Interglobe Aviation
Neutral
986
-
35,520
17,022
21,122
20.7
14.5
63.9
53.7
15.4
18.4
23.1
18.9
149.9
103.2
2.1
1.7
Coffee Day Enterprises
Neutral
234
-
4,816
2,692
2,964
17.0
18.6
-
4.7
-
49.3
2.9
2.7
0.2
5.5
2.2
2.0
Ltd
Navneet Education
Neutral
84
-
1,996
998
1,062
24.1
24.0
5.8
6.1
14.6
13.8
3.2
2.8
22.0
20.6
2.1
2.0
Navkar Corporation
Buy
183
265
2,609
365
436
38.3
37.5
5.6
5.9
32.5
31.1
2.0
1.9
6.3
6.1
8.0
6.8
UFO Moviez
Neutral
491
-
1,349
558
619
32.0
33.2
22.5
30.0
21.8
16.4
2.6
2.3
12.0
13.8
2.3
1.9
VRL Logistics
Neutral
377
-
3,437
1,725
1,902
16.5
16.7
12.2
14.6
31.0
25.9
6.4
5.7
20.8
21.9
2.1
1.9
Team Lease Serv.
Neutral
864
-
1,478
2,565
3,229
1.3
1.5
15.2
22.8
57.0
38.0
4.6
4.1
8.0
10.7
0.5
0.4
S H Kelkar & Co.
Neutral
239
-
3,454
928
1,036
15.3
15.1
4.9
6.1
48.4
39.1
4.5
4.2
9.4
10.7
3.6
3.2
Stock Watch
April 12, 2016
Company Name
Reco
CMP
Target Mkt Cap
Sales ( Čcr )
OPM(%)
EPS (Č)
PER(x)
P/BV(x)
RoE(%)
EV/Sales(x)
(Č)
Price ( Č)
( Č cr )
FY16E FY17E FY16E FY17E FY16E FY17E FY16E FY17E FY16E FY17E FY16E FY17E FY16E FY17E
zOthers
Quick Heal
Neutral
226
-
1,581
339
408
27.8
27.3
7.1
7.7
31.9
29.2
2.7
2.7
8.5
9.3
3.6
3.0
Narayana Hrudaya
Neutral
300
-
6,128
1,603
1,873
10.9
11.5
1.0
2.6
314.8
113.4
7.6
7.0
2.4
6.1
4.0
3.4
Manpasand Bever.
Neutral
492
-
2,465
540
836
19.9
19.6
10.2
16.9
48.1
29.2
3.9
3.5
8.1
12.0
4.2
2.7
Source: Company, Angel Research; Note: *December year end; #September year end; &October year end; Price as on April 11, 2016
Market Outlook
April 12, 2016
Research Team Tel: 022 - 39357800
DISCLAIMER
Angel Broking Private Limited (hereinafter referred to as “Angel”) is a registered Member of National Stock Exchange of India Limited,
Bombay Stock Exchange Limited and Metropolitian Stock Exchange of India Limited. It is also registered as a Depository Participant with
CDSL and Portfolio Manager with SEBI. It also has registration with AMFI as a Mutual Fund Distributor. Angel Broking Private Limited is a
registered entity with SEBI for Research Analyst in terms of SEBI (Research Analyst) Regulations, 2014 vide registration number
INH000000164. Angel or its associates has not been debarred/ suspended by SEBI or any other regulatory authority for accessing
/dealing in securities Market. Angel or its associates including its relatives/analyst do not hold any financial interest/beneficial ownership
of more than 1% in the company covered by Analyst. Angel or its associates/analyst has not received any compensation / managed or co
-managed public offering of securities of the company covered by Analyst during the past twelve months. Angel/analyst has not served as
an officer, director or employee of company covered by Analyst and has not been engaged in market making activity of the company
covered by Analyst.
This document is solely for the personal information of the recipient, and must not be singularly used as the basis of any investment
decision. Nothing in this document should be construed as investment or financial advice. Each recipient of this document should make
such investigations as they deem necessary to arrive at an independent evaluation of an investment in the securities of the companies
referred to in this document (including the merits and risks involved), and should consult their own advisors to determine the merits and
risks of such an investment.
Reports based on technical and derivative analysis center on studying charts of a stock's price movement, outstanding positions and
trading volume, as opposed to focusing on a company's fundamentals and, as such, may not match with a report on a company's
fundamentals.
The information in this document has been printed on the basis of publicly available information, internal data and other reliable sources
believed to be true, but we do not represent that it is accurate or complete and it should not be relied on as such, as this document is for
general guidance only. Angel Broking Pvt. Limited or any of its affiliates/ group companies shall not be in any way responsible for any
loss or damage that may arise to any person from any inadvertent error in the information contained in this report. Angel Broking Pvt.
Limited has not independently verified all the information contained within this document. Accordingly, we cannot testify, nor make any
representation or warranty, express or implied, to the accuracy, contents or data contained within this document. While Angel Broking
Pvt. Limited endeavors to update on a reasonable basis the information discussed in this material, there may be regulatory, compliance,
or other reasons that prevent us from doing so.
This document is being supplied to you solely for your information, and its contents, information or data may not be reproduced,
redistributed or passed on, directly or indirectly.
Neither Angel Broking Pvt. Limited, nor its directors, employees or affiliates shall be liable for any loss or damage that may arise from or
in connection with the use of this information.
Note: Please refer to the important ‘Stock Holding Disclosure' report on the Angel website (Research Section). Also, please refer to the
latest update on respective stocks for the disclosure status in respect of those stocks. Angel Broking Pvt. Limited and its affiliates may have
investment positions in the stocks recommended in this report.