Market Outlook
July 11, 2016
Market Cues
Domestic Indices
Chg (%)
(Pts)
(Close)
Indian markets are expected to open positive tracking SGX Nifty and global markets,
BSE Sensex
(0.3)
(75)
27,127
with US markets losing on strong hold on Friday.
Nifty
(0.2)
(15)
8,323
The US markets closed on a strong note with the Dow Jones gaining by 250 points
Mid Cap
0.1
13
11,880
and Nasdaq by 80 points. Strong job data propelled the stock markets up. On
Small Cap
(0.2)
(21)
11,977
Friday the US Labor department said nonfarm payroll employment surged up by 2,
Bankex
(0.3)
(62)
20,634
87,000 jobs in June, which was much higher than economists expectations of 1,
80,000 jobs.
Global Indices
Chg (%)
(Pts)
(Close)
European markets also closed on a strong note after news of better than US job
Dow Jones
1.4
250
18,147
data came in. After a lackluster opening banks and auto share witnessed decent
Nasdaq
1.6
80
4,957
buying and helped in overall gain for the markets.
FTSE
0.9
57
6,590
Indian markets closed down on Friday after showing strength in the last few trading
Nikkei
(1.1)
(169)
15,107
session. Auto and Pharma stocks saw some buying interest; however Telecom stocks
Hang Seng
(0.7)
(143)
20,564
were under selling pressure. Overall advance decline ration was in favor of declines.
Shanghai Com
(1.0)
(29)
2,988
With results season kicking the markets will closely watch the outcomes for the
1QFY17 outcomes.
Advances / Declines
BSE
NSE
News Analysis
Advances
1,154
617
Cadila Healthcare-USFDA Update.
Detailed analysis on Pg2
Declines
1,580
988
Unchanged
142
60
Investor’s Ready Reckoner
Key Domestic & Global Indicators
Volumes (` Cr)
Stock Watch: Latest investment recommendations on 150+ stocks
BSE
3,131
Refer Pg6 onwards
NSE
16,602
Top Picks
CMP
Target
Upside
Company
Sector
Rating
Net Inflows (` Cr)
Net
Mtd
Ytd
(`)
(`)
(%)
FII
(434)
(253)
19,291
Amara Raja
Auto/Auto Ancillary
Buy
846
1,076
27.2
MFs
(147)
151
9,495
HCL Tech
IT
Buy
722
1,000
38.6
LIC Housing
Financials
Buy
511
592
15.7
Bharat Electronics
Capital Goods
Accumulate
1,258
1,414
12.4
Top Gainers
Price (`)
Chg (%)
Navkar Corporation Others
Buy
215
265
23.5
Bfutilitie
569
6.7
More Top Picks on Pg3
Cadilahc
359
4.8
Il&Fstrans
85
4.8
Key Upcoming Events
Previous
Consensus
Coromandel
239
4.7
Date
Region
Event Description
Reading
Expectations
Tubeinvest
516
4.1
July 12 China
Consumer price Index (YoY)
2.0
1.8
July 13 India
Imports YoY%
(13.2)
--
Top Losers
Price (`)
Chg (%)
July 13 India
Intial Jobless claims
254.0
--
Jpinfratec
10
(6.6)
July 13 India
Exports YoY%
(0.8)
--
6.(
More Events on Pg4
Jpassociat
11
(5.6)
Punjlloyd
22
(4.2)
Jppower
6
(3.6)
Unitech
7
(3.5)
As on July 08, 2016
Market Outlook
July 11, 2016
Cadila Healthcare USFDA Update.
Company's Moraiya manufacturing facility has received an Establishment
Inspection Report (EIR) from the USFDA. This receipt of EIR only indicates closure of
the inspection points (483s) raised based on the inspection carried out between
August 28, 2014 and September 05, 2014. What is "closed" is the initial review
that resulted in the warning letter issuance. Though this is a positive step towards
the resolution of the warning letter issued by the USFDA, it does not in itself
indicate resolution of the warning letter. The company is in constant follow up with
the USFDA for resolution of the warning letter. The development is in the positive
direction and though we are not changing our estimates, we maintain our buy on
the stock with a price target of `400.
Economic and Political News
IMF cuts euro zone growth outlook to 1.6% vs 1.7% on Brexit
PAYTM Payments Bank looking at a Pre Diwali take off
Govt’s Tax collections up by 28% in Q1FY17 to `3.24 lakh cr
Maharastra mulls fund to speed up infrastructure projects
US Congress introduces bill to prevent Indian IT Firms from hiring H-1 B,L1
visa holder
Telecom ministry clears Airtel-Aircel 4G Spectrum trading deal
Bharti Airtel to extend 4G foot print to 19 circles in 3-4 months.
Corporate News
JSW Steel eyes iron ore mines in Karnataka, other states
LUx Industries eyes `2,000cr turn over in five years
Odisha Pollution Board gives DLF more time to bild IT park.
Market Outlook
July 11, 2016
Top Picks ★★★★★
Large Cap
Market Cap
CMP
Target
Upside
Company
Rationale
(` Cr)
(`)
(`)
(%)
To outpace battery industry growth due to better technological
Amara Raja Batteries
14,446
846
1076
27.2
products leading to market share gains in both the
automotive OEM and replacement segments.
Uptick in defense capex by government, coupled with BELs
Bharat Electronics
30,177
1,258
1414
12.4
strong market positioning, indicate good times ahead for BEL.
HCL Tech
101,821
722
1000
38.6
Stock is trading at attractive valuations & factors all bad news.
Strong visibility for a robust 20% earnings trajectory, coupled
HDFC Bank
297,159
1,172
1262
7.7
with high quality of earnings on account of high quality retail
business and strategic focus on highly rated corporates.
Back on the growth trend, expect a long term growth of 14%
Infosys
266,158
1,159
18.6
18.6
to be a US$20bn in FY2020.
Continues to grow its retail loan book at healthy pace with
improvement in asset quality. Expect LICHF to post a healthy
LIC Housing Finance
25,806
511
592
15.7
loan book which is likely to reflect in a strong earnings
growth.
Huge bid pipeline of re-development works at Delhi and
NBCC
13,198
220
242
10.1
other State Governments and opportunity from Smart City,
positions NBCC to report strong growth, going forward.
Strong market positioning within the domestic AC markets to
Voltas
10,408
315
407
29.4
continue, EMP business set to revive
Source: Company, Angel Research
Mid Cap
Market Cap
CMP
Target
Upside
Company
Rationale
(` Cr)
(`)
(`)
(%)
Among the top 4 players in the consumer durables segment.
Bajaj Electricals
2,504
248
268
8.2
Improved profitability backed by turn around in E&P segment.
Strong order book lends earnings visibility.
Favourable outlook for AC industry to augur well for Cooling
Blue Star
3,886
432
495
14.6
products business. EMPPAC division's profitability to improve
once operating environment turns around.
With a focus on the low and medium income (LMI) consumer
Dewan Housing
6,250
214
270
26.1
segment, the company has increased its presence in tier-II & III
cities where the growth opportunity is immense.
Strong loan growth backed by diversified loan portfolio and
Equitas Holdings
6,079
181
235
29.7
adequate CAR. ROE & ROA likely to remain decent as risk of
dilution remains low. Attractive valuations considering growth.
Expectations of above average monsoon augurs well for
Goodyear India
1,211
525
631
20.2
Goodyear India as it derives ~50% of its turnover from farm
tyre segment.
Commencement of new projects, downtrend in the interest rate
IL&FS Transport
2,809
85
93
8.9
cycle, to lead to stock re-rating
Economic recovery to have favourable impact on advertising &
Jagran Prakashan
6,015
184
205
11.4
circulation revenue growth. Further, the acquisition of a radio business
(Radio City) would also boost the company's revenue growth.
Speedier execution and speedier sales, strong revenue visibility
Mahindra Lifespace
1,902
463
554
19.5
in short-to-long run, attractive valuations
Massive capacity expansion along with rail advantage at ICD
Navkar Corporation
3,060
215
265
23.5
as well CFS augurs well for the company
Earnings boost on back of stable material prices and
Radico Khaitan
1,261
95
125
31.9
favourable pricing environment. Valuation discount to peers
provides additional comfort
Strong brands and distribution network would boost growth
Siyaram Silk Mills
1,000
1,067
1,347
26.2
going ahead. Stock currently trades at an inexpensive
valuation.
Source: Company, Angel Research
Market Outlook
July 11, 2016
Key Upcoming Events
Global economic events release calendar
Bloomberg Data
Date
Time
Country
Event Description
Unit
Period
Last Reported
Estimated
Jul 12, 2016
7:00 AM
China Consumer Price Index (YoY)
% Change
Jun
2.00
1.80
Jul 13, 2016
India
Imports YoY%
% Change
Jun
-13.20
6:00 PM
US
Initial Jobless claims
Thousands
Jul 9
254.00
India
Exports YoY%
% Change
Jun
-0.80
Jul 14, 2016
China Exports YoY%
% Change
Jun
-4.10
(5.00)
4:30 PM
UK BOE Announces rates
% Ratio
Jul 14
0.50
0.25
US
Producer Price Index (mom)
% Change
Jun
0.50
12:00 PM
India
Monthly Wholesale Prices YoY%
% Change
Jun
0.79
July 15, 2016
2:30 PM Euro Zone Euro-Zone CPI (YoY)
% Jun F
0.10
0.10
6:00 PM
US
Consumer price index (mom)
% Change
Jun
0.20
0.20
6:45 PM
US
Industrial Production
%
Jun
-0.42
0.20
7:30 AM
China Industrial Production (YoY)
% Change
Jun
6.00
5.90
7:30 AM
China Real GDP (YoY)
% Change
2Q
6.70
6.60
Jul 19, 2016
6:00 PM
US
Housing Starts
Thousands
Jun
1,164.00
1,170.00
2:00 PM
UK CPI (YoY)
% Change
Jun
0.30
6:00 PM
US
Building permits
Thousands
Jun
1,136.00
1,143.00
Jul 20, 2016
2:00 PM
UK Jobless claims change
% Change
Jun
(0.40)
Jul 21, 2016
7:30 PM
US
Existing home sales
Million
Jun
5.53
5.46
5:15 PM Euro Zone ECB announces interest rates
% Jul 21
-
Source: Bloomberg, Angel Research
Market Outlook
July 11, 2016
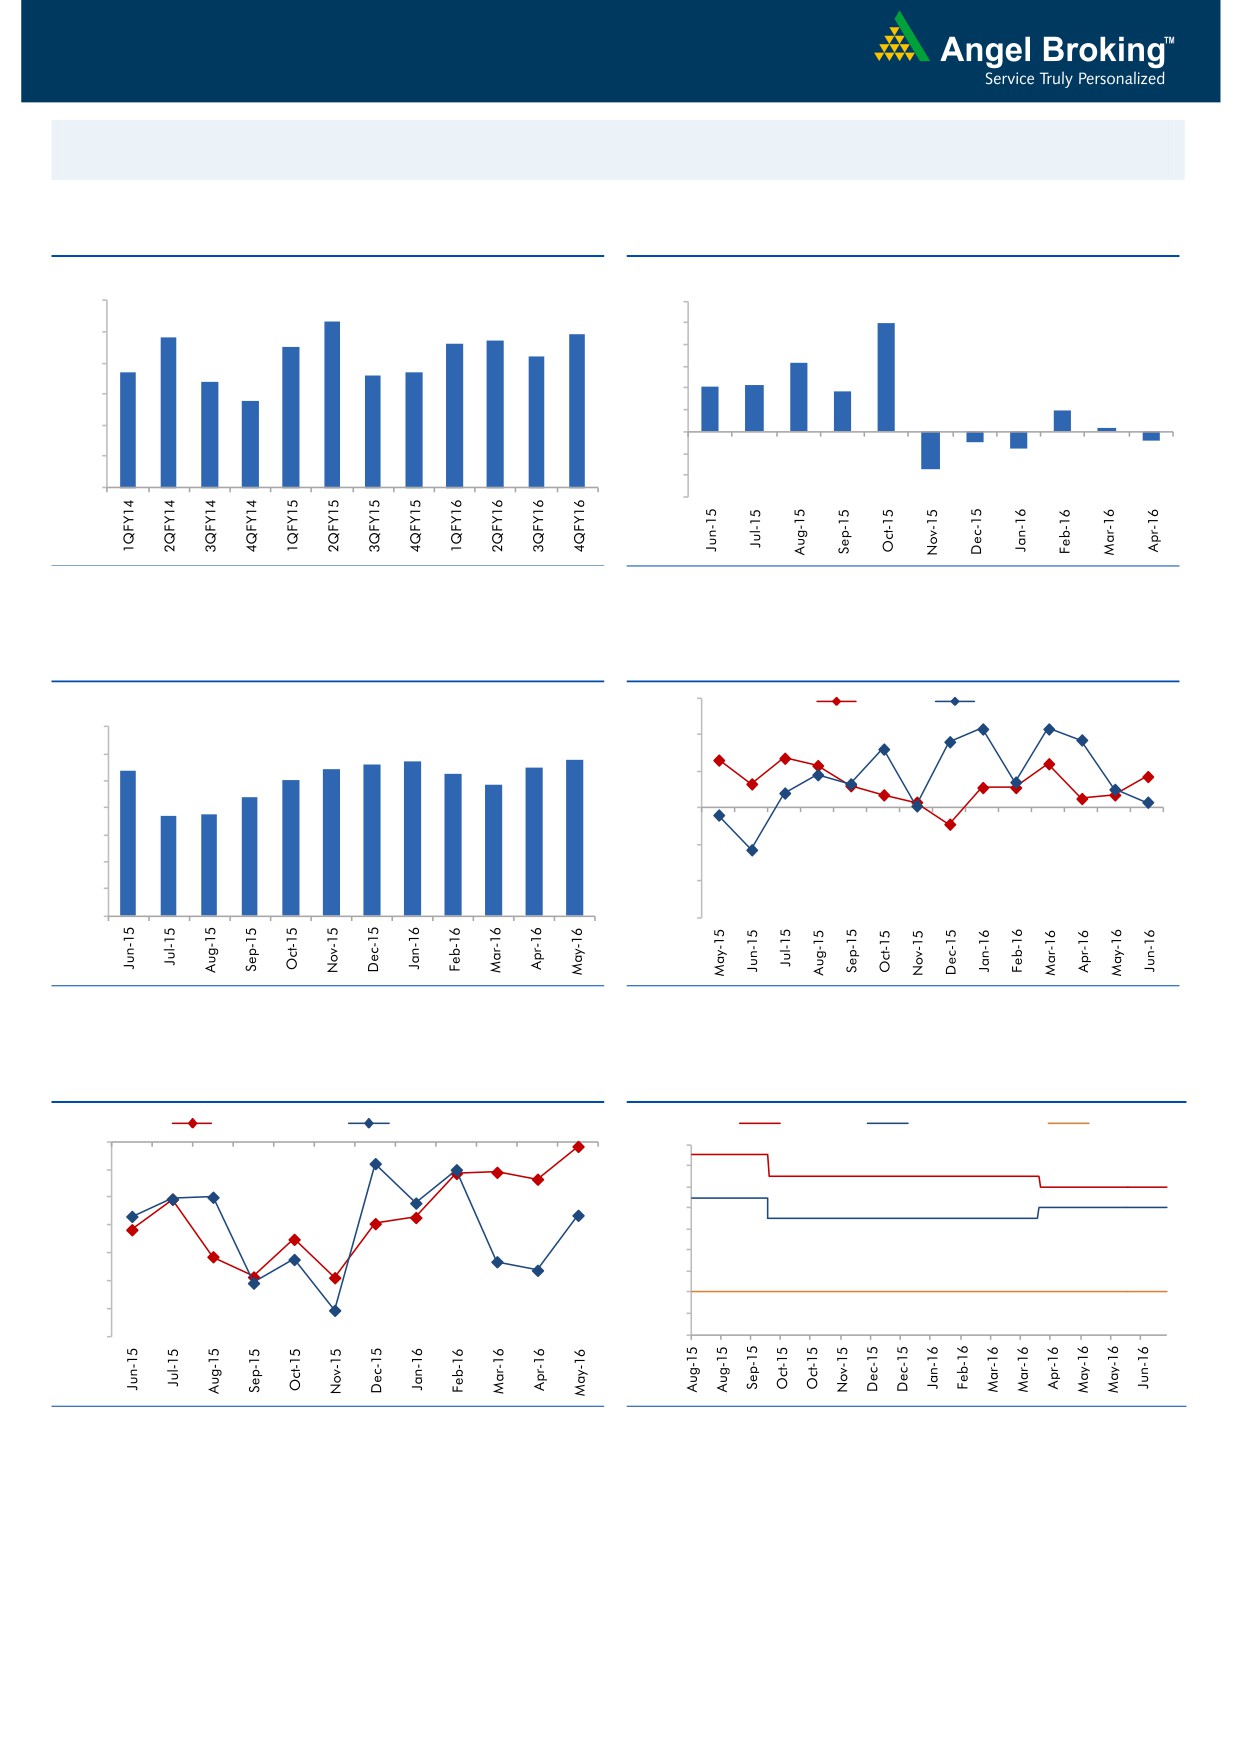
Macro watch
Exhibit 1: Quarterly GDP trends
Exhibit 2: IIP trends
(%)
(%)
9.0
12.0
8.3
9.9
7.8
7.7
7.9
10.0
8.0
7.5
7.6
7.2
8.0
6.3
6.7
6.6
6.7
7.0
6.4
6.0
4.2
4.3
3.7
5.8
4.0
6.0
2.0
2.0
0.3
5.0
-
4.0
(2.0)
(0.9)
(0.8)
(1.6)
(4.0)
3.0
(3.4)
(6.0)
Source: CSO, Angel Research
Source: MOSPI, Angel Research
Exhibit 3: Monthly CPI inflation trends
Exhibit 4: Manufacturing and services PMI
56.0
Mfg. PMI
Services PMI
(%)
7.0
54.0
5.6
5.7
5.8
5.4
5.4
5.5
6.0
5.3
5.0
4.8
52.0
5.0
4.4
3.7
3.7
4.0
50.0
3.0
48.0
2.0
46.0
1.0
-
44.0
Source: MOSPI, Angel Research
Source: Market, Angel Research; Note: Level above 50 indicates expansion
Exhibit 5: Exports and imports growth trends
Exhibit 6: Key policy rates
(%)
Exports yoy growth
Imports yoy growth
(%)
Repo rate
Reverse Repo rate
CRR
0.0
7.50
(5.0)
7.00
6.50
(10.0)
6.00
(15.0)
5.50
(20.0)
5.00
4.50
(25.0)
4.00
(30.0)
3.50
(35.0)
3.00
Source: Bloomberg, Angel Research
Source: RBI, Angel Research
Market Outlook
July 11, 2016
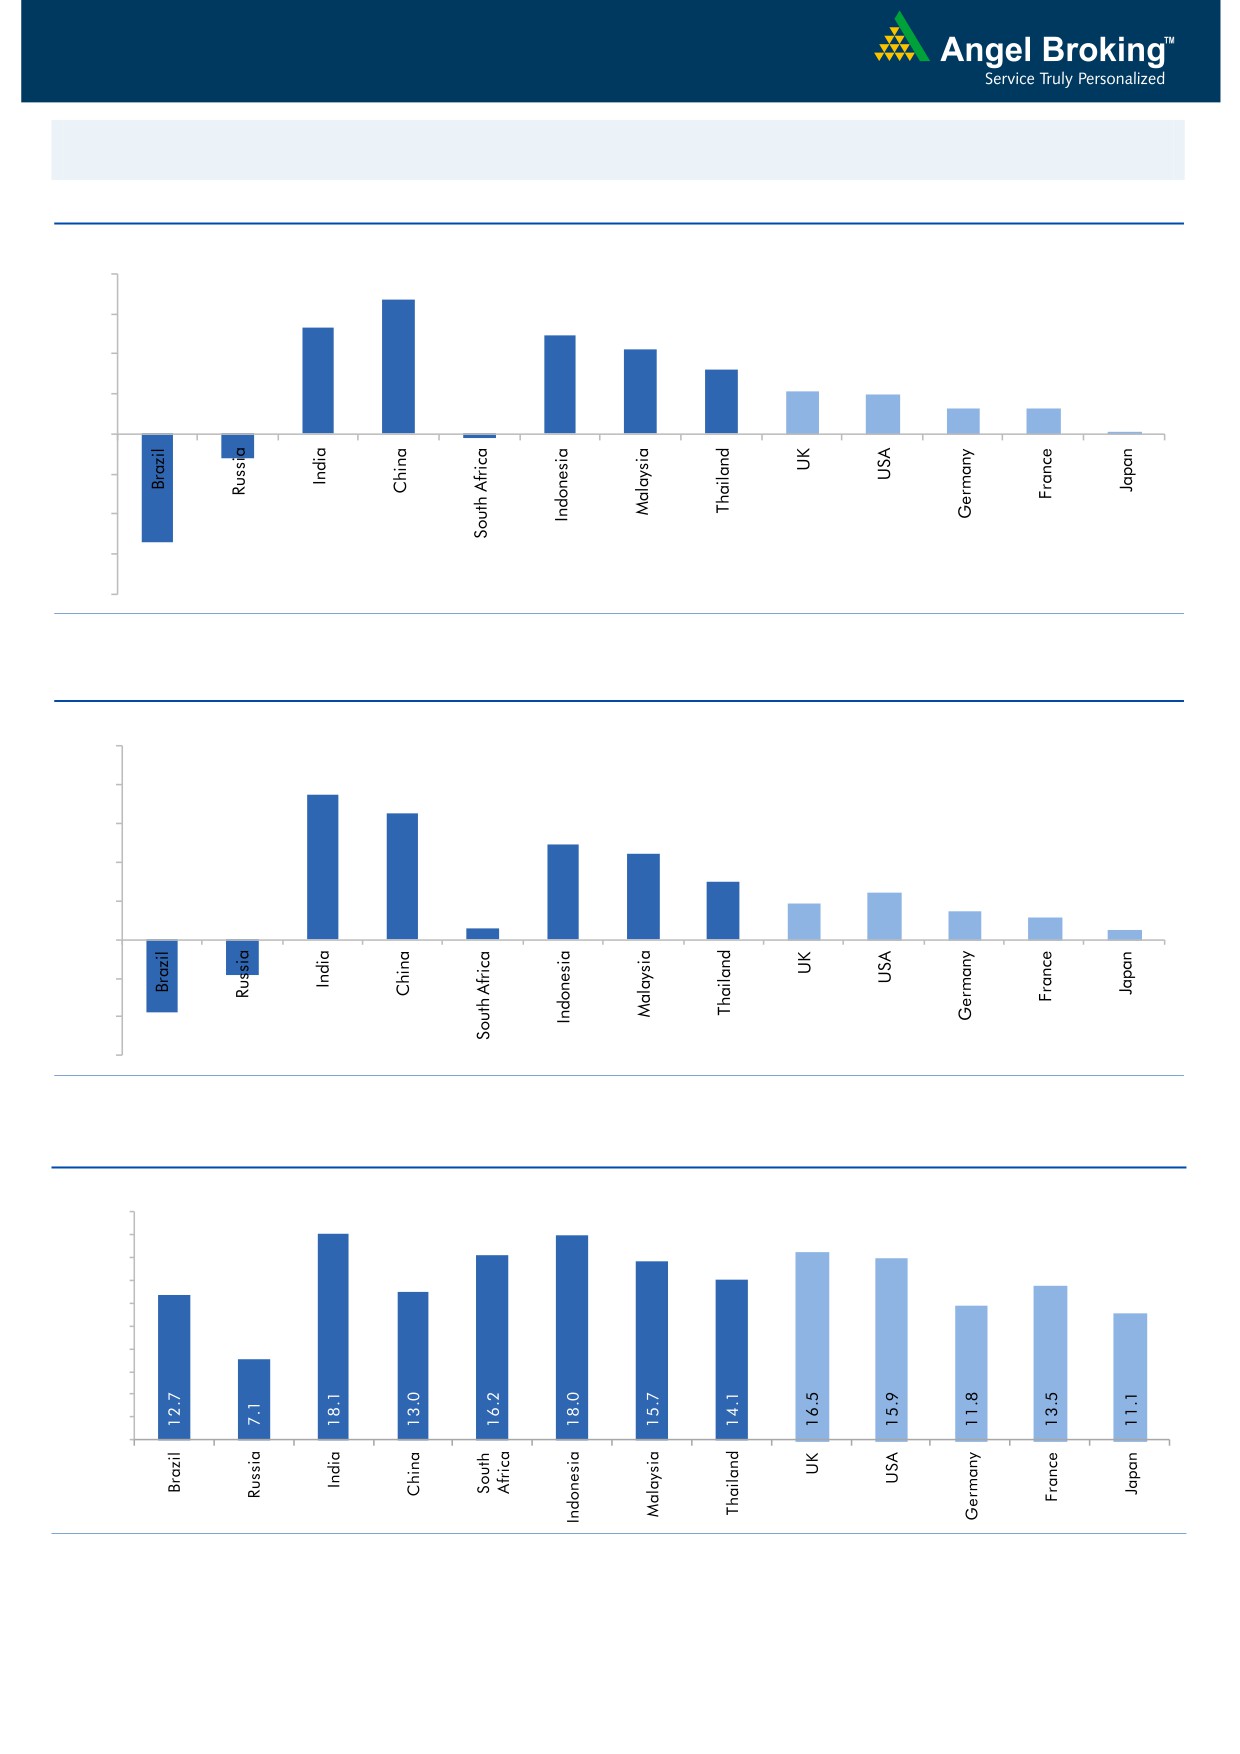
Global watch
Exhibit 1: Latest quarterly GDP Growth (%, yoy) across select developing and developed countries
(%)
8.0
6.7
6.0
5.3
4.9
4.2
4.0
3.2
2.1
2.0
2.0
1.3
1.3
0.1
-
(2.0)
(4.0)
(1.2)
(6.0)
(0.2)
(5.4)
(8.0)
Source: Bloomberg, Angel Research
Exhibit 2: 2016 GDP Growth projection by IMF (%, yoy) across select developing and developed countries
(%)
10.0
7.5
8.0
6.5
6.0
4.9
4.4
4.0
3.0
2.4
1.9
1.5
2.0
1.1
0.6
0.5
(3.8)
(1.8)
-
(2.0)
(4.0)
(6.0)
Source: IMF, Angel Research
Exhibit 3: One year forward P-E ratio across select developing and developed countries
(x)
20.0
18.0
16.0
14.0
12.0
10.0
8.0
6.0
4.0
2.0
-
Source: IMF, Angel Research
Market Outlook
July 11, 2016
Exhibit 4: Relative performance of indices across globe
Returns (%)
Country
Name of index
Closing price
1M
3M
1YR
Brazil
Bovespa
53,141
2.9
9.5
0.1
Russia
Micex
1,894
(2.9)
2.0
18.8
India
Nifty
8,323
0.7
9.5
(1.4)
China
Shanghai Composite
2,988
2.7
0.2
(25.6)
South Africa
Top 40
44,921
(6.5)
(0.4)
0.5
Mexico
Mexbol
45,744
(1.1)
2.2
1.8
Indonesia
LQ45
851
5.5
3.9
2.7
Malaysia
KLCI
1,645
0.5
(4.3)
(3.6)
Thailand
SET 50
916
(0.6)
2.3
(8.0)
USA
Dow Jones
18,147
1.2
3.4
2.2
UK
FTSE
6,591
4.6
7.4
(2.2)
Japan
Nikkei
15,107
(10.2)
(4.0)
(25.3)
Germany
DAX
9,630
(5.7)
0.1
(16.4)
France
CAC
4,191
(5.8)
(2.8)
(18.2)
Source: Bloomberg, Angel Research
Stock Watch
July 11, 2016
Company Name
Reco
CMP
Target
Mkt Cap
Sales ( Čcr )
OPM(%)
EPS (Č)
PER(x)
P/BV(x)
RoE(%)
EV/Sales(x)
(Č)
Price ( Č)
( Č cr )
FY16E FY17E
FY16E
FY17E
FY16E
FY17E
FY16E
FY17E
FY16E
FY17E
FY16E
FY17E
FY16E
FY17E
Agri / Agri Chemical
Rallis
Neutral
211
-
4,104
1,612
1,911
13.3
13.3
7.4
9.5
28.5
22.2
4.6
4.1
16.7
18.4
2.6
2.2
United Phosphorus
Buy
552
684
23,646
13,083
15,176
18.5
18.5
31.5
37.4
17.5
14.8
3.5
2.9
21.4
21.4
2.0
1.7
Auto & Auto Ancillary
Ashok Leyland
Buy
94
111
26,723
17,995
21,544
11.4
11.6
3.4
4.7
27.6
20.0
4.8
4.5
17.7
22.2
1.4
1.2
Bajaj Auto
Neutral
2,606
-
75,422
22,709
25,860
20.9
20.1
129.0
143.6
20.2
18.2
6.2
5.3
30.7
29.4
2.9
2.5
Bharat Forge
Buy
738
875
17,178
7,351
8,318
19.9
19.7
31.2
36.5
23.7
20.2
4.2
3.6
19.3
19.2
2.5
2.2
Eicher Motors
Neutral
19,461
-
52,858
15,556
16,747
15.5
17.3
464.8
597.5
41.9
32.6
15.3
11.3
36.2
34.3
3.3
3.0
Gabriel India
Neutral
98
-
1,411
1,415
1,544
8.7
9.0
4.6
5.4
21.4
18.2
3.9
3.4
18.1
18.9
1.0
0.9
Hero Motocorp
Neutral
3,160
-
63,105
28,244
30,532
15.5
15.9
156.7
168.5
20.2
18.8
8.1
6.8
39.9
36.4
2.1
1.9
Jamna Auto Industries Neutral
166
-
1,324
1,281
1,473
11.2
11.5
7.6
9.2
21.8
18.0
5.5
4.5
25.4
25.2
1.1
0.9
L G Balakrishnan & Bros Neutral
499
-
783
1,254
1,394
11.6
11.8
35.9
41.7
13.9
12.0
1.9
1.7
13.5
13.8
0.7
0.7
Mahindra and Mahindra Neutral
1,451
-
90,130
38,416
42,904
13.7
13.9
54.8
63.4
26.5
22.9
4.1
3.6
15.4
15.8
2.0
1.7
Maruti
Neutral
4,155
-
125,516
57,865
68,104
16.4
16.7
176.3
225.5
23.6
18.4
4.6
3.9
19.4
21.2
1.9
1.6
Minda Industries
Neutral
1,162
-
1,843
2,523
2,890
8.7
9.0
55.0
65.4
21.1
17.8
4.1
3.3
19.3
18.7
0.8
0.7
Motherson Sumi
Accumulate
278
313
36,759
39,343
45,100
8.8
9.1
10.1
12.5
27.5
22.2
8.7
6.8
35.3
34.4
1.0
0.9
Rane Brake Lining
Accumulate
414
465
328
454
511
11.5
12.0
25.2
31.0
16.4
13.4
2.5
2.2
14.9
16.6
0.9
0.8
Setco Automotive
Neutral
49
-
659
594
741
12.7
13.7
1.7
3.2
29.0
15.4
3.0
2.6
10.4
16.9
1.6
1.3
Tata Motors
Neutral
465
-
134,313
259,686
273,957
13.0
13.4
25.9
29.5
18.0
15.8
2.4
2.1
8.0
9.0
0.7
0.7
TVS Motor
Accumulate
298
330
14,134
11,263
13,122
6.9
8.5
9.2
15.0
32.3
19.8
7.4
5.9
22.7
29.6
1.2
1.0
Amara Raja Batteries
Buy
846
1,076
14,446
4,690
5,429
17.5
17.5
28.5
35.3
29.7
23.9
6.9
5.6
23.1
25.9
3.1
2.6
Exide Industries
Neutral
173
-
14,726
6,950
7,784
14.4
14.8
6.6
7.3
26.3
23.7
3.3
3.0
12.6
12.8
1.8
1.6
Apollo Tyres
Buy
150
183
7,651
12,056
12,714
17.2
16.4
23.0
20.3
6.5
7.4
1.2
1.0
17.7
13.6
0.7
0.7
Ceat
Buy
851
1,119
3,441
6,041
6,597
14.1
13.7
99.5
111.9
8.6
7.6
1.7
1.4
19.6
18.5
0.7
0.6
JK Tyres
Neutral
92
-
2,078
7,446
7,669
15.2
14.0
19.6
18.4
4.7
5.0
1.2
1.0
25.2
19.5
0.7
0.6
Swaraj Engines
Neutral
1,158
-
1,439
552
630
14.2
14.7
44.6
54.1
26.0
21.4
6.0
5.5
23.2
25.6
2.5
2.1
Subros
Neutral
95
-
570
1,293
1,527
11.8
11.9
4.2
6.7
22.6
14.2
1.7
1.6
7.7
11.5
0.8
0.6
Indag Rubber
Neutral
188
-
494
283
329
17.0
17.2
13.0
15.4
14.5
12.2
3.2
2.6
21.8
21.6
1.5
1.2
Capital Goods
ACE
Neutral
46
-
456
660
839
4.7
8.2
1.0
3.9
46.1
11.8
1.4
1.3
3.2
11.3
0.8
0.7
BEML
Buy
885
1,157
3,687
3,277
4,006
6.0
8.9
36.2
64.3
24.5
13.8
1.7
1.5
5.7
11.7
1.2
0.9
Bharat Electronics
Accumulate
1,258
1,414
30,199
7,295
8,137
20.0
16.8
56.5
58.7
22.3
21.4
3.3
3.0
42.1
44.6
3.3
2.9
Stock Watch
July 11, 2016
Company Name
Reco
CMP
Target
Mkt Cap
Sales ( Čcr )
OPM(%)
EPS (Č)
PER(x)
P/BV(x)
RoE(%)
EV/Sales(x)
(Č)
Price ( Č)
( Č cr )
FY16E
FY17E
FY16E
FY17E
FY16E
FY17E
FY16E
FY17E
FY16E
FY17E
FY16E
FY17E
FY16E
FY17E
Capital Goods
Voltas
Buy
315
407
10,408
5,857
6,511
7.5
7.9
11.7
12.9
26.9
24.4
4.4
3.9
17.1
16.7
1.8
1.6
BGR Energy
Neutral
125
-
900
3,615
3,181
9.5
9.4
16.7
12.4
7.5
10.1
0.7
0.7
10.0
7.0
0.7
0.8
BHEL
Neutral
138
-
33,740
33,722
35,272
10.8
11.7
10.5
14.2
13.1
9.7
1.0
0.9
7.0
9.0
1.1
1.0
Blue Star
Accumulate
432
495
3,886
3,770
4,351
5.7
6.4
11.4
17.2
37.8
25.2
5.9
5.5
18.4
23.1
1.1
0.9
Crompton Greaves
Neutral
71
-
4,444
13,484
14,687
4.9
6.2
4.5
7.1
15.8
10.0
1.1
1.0
7.2
10.8
0.5
0.4
Greaves Cotton
Neutral
137
-
3,344
1,655
1,755
16.6
16.8
7.4
7.8
18.5
17.6
3.7
3.5
21.1
20.6
2.0
1.8
Inox Wind
Buy
238
286
5,286
4,406
5,605
15.5
15.7
20.4
24.8
11.7
9.6
2.7
2.0
27.9
25.9
1.4
1.1
KEC International
Neutral
145
-
3,716
8,791
9,716
6.1
6.8
5.4
8.2
26.8
17.6
2.7
2.5
10.0
14.0
0.6
0.6
Thermax
Neutral
897
-
10,693
6,413
7,525
7.4
8.5
30.5
39.3
29.4
22.8
4.5
3.9
15.0
17.0
1.6
1.4
VATech Wabag
Buy
589
681
3,211
2,722
3,336
7.9
8.1
19.5
24.6
30.2
23.9
3.2
2.8
11.1
12.4
1.3
1.0
Cement
ACC
Neutral
1,598
-
30,005
13,151
14,757
16.4
18.3
63.9
83.4
25.0
19.2
3.2
3.0
13.3
16.1
2.1
1.8
Ambuja Cements
Neutral
258
-
39,985
11,564
12,556
19.4
20.7
8.9
10.1
29.0
25.5
3.6
3.4
12.8
13.8
3.1
2.8
HeidelbergCement
Neutral
114
-
2,575
1,772
1,926
13.3
15.4
1.0
3.0
113.7
37.9
2.9
2.7
2.6
7.9
2.0
1.8
India Cements
Neutral
117
-
3,605
4,216
4,840
18.0
19.5
4.0
9.9
29.3
11.9
1.2
1.1
4.0
9.5
1.2
1.0
JK Cement
Neutral
710
-
4,963
3,661
4,742
10.1
15.8
7.5
28.5
94.6
24.9
2.9
2.5
7.5
22.9
1.8
1.4
J K Lakshmi Cement
Neutral
398
-
4,678
2,947
3,616
16.7
19.9
11.5
27.2
34.6
14.6
3.3
2.8
9.8
20.8
2.0
1.6
Mangalam Cements
Neutral
297
-
793
1,053
1,347
10.5
13.3
8.4
26.0
35.4
11.4
1.5
1.4
4.3
12.5
1.1
0.8
Orient Cement
Neutral
179
-
3,676
1,854
2,524
21.2
22.2
7.7
11.1
23.3
16.2
3.4
2.9
13.3
15.7
2.7
1.9
Ramco Cements
Neutral
578
-
13,762
4,036
4,545
20.8
21.3
15.1
18.8
38.3
30.8
4.7
4.2
12.9
14.3
3.9
3.4
Shree Cement^
Neutral
15,638
-
54,478
7,150
8,742
26.7
28.6
228.0
345.5
68.6
45.3
10.1
8.5
15.7
20.3
7.4
6.0
UltraTech Cement
Neutral
3,399
-
93,294
24,669
29,265
18.2
20.6
82.0
120.0
41.5
28.3
4.5
3.9
11.3
14.7
3.8
3.3
Construction
ITNL
Accumulate
85
93
2,809
7,360
8,682
34.0
32.2
7.0
8.6
12.2
9.9
0.4
0.4
3.2
2.5
3.7
3.6
KNR Constructions
Accumulate
561
603
1,576
937
1,470
14.3
14.0
44.2
38.6
12.7
14.5
2.5
2.2
15.4
15.4
1.8
1.1
Larsen & Toubro
Accumulate
1,532
1,700
142,760
58,870
65,708
8.3
10.3
42.0
53.0
36.5
28.9
2.5
2.3
8.8
11.2
2.6
2.4
Gujarat Pipavav Port
Neutral
176
-
8,489
629
684
51.0
52.2
6.4
5.9
27.4
29.8
3.6
3.3
15.9
12.7
13.1
11.9
MBL Infrastructures
Buy
139
285
578
2,313
2,797
12.2
14.6
19.0
20.0
7.3
7.0
0.8
0.7
11.3
10.6
1.0
0.9
Nagarjuna Const.
Neutral
75
-
4,153
7,892
8,842
8.8
9.1
3.0
5.3
24.9
14.1
1.3
1.2
5.0
8.5
0.8
0.6
PNC Infratech
Accumulate
572
647
2,933
1,873
2,288
13.2
13.5
24.0
32.0
23.8
17.9
2.3
2.1
12.1
12.3
1.7
1.4
Simplex Infra
Neutral
306
-
1,512
5,955
6,829
10.3
10.5
16.0
31.0
19.1
9.9
1.0
0.9
5.3
9.9
0.8
0.6
Stock Watch
July 11, 2016
Company Name
Reco
CMP
Target
Mkt Cap
Sales ( Čcr )
OPM(%)
EPS (Č)
PER(x)
P/BV(x)
RoE(%)
EV/Sales(x)
(Č)
Price ( Č)
( Č cr )
FY16E
FY17E
FY16E
FY17E
FY16E
FY17E
FY16E
FY17E
FY16E
FY17E
FY16E
FY17E
FY16E
FY17E
Construction
Power Mech Projects
Neutral
559
-
823
1,539
1,801
12.8
12.7
59.0
72.1
9.5
7.8
1.4
1.2
18.6
16.8
0.5
0.5
Sadbhav Engineering
Neutral
294
-
5,035
3,186
3,598
10.2
10.3
8.0
9.0
36.7
32.6
3.4
3.0
9.4
9.9
1.9
1.7
NBCC
Accumulate
220
242
13,194
5,838
7,428
6.0
7.9
5.2
8.2
42.3
26.8
1.3
1.1
21.9
28.2
2.1
1.5
MEP Infra
Neutral
45
-
734
1,956
1,876
28.1
30.5
1.3
3.0
34.7
15.1
7.3
4.9
21.2
32.8
1.8
1.8
SIPL
Neutral
103
-
3,612
675
1,042
62.4
64.7
-
-
3.8
4.4
-
-
17.0
11.5
Engineers India
Neutral
206
-
6,954
1,667
1,725
13.5
16.0
9.7
11.4
21.3
18.1
2.5
2.4
11.7
13.4
3.0
3.0
Financials
Allahabad Bank
Neutral
78
-
5,618
8,569
9,392
2.8
2.9
16.3
27.5
4.8
2.8
0.5
0.4
7.6
11.9
-
-
Axis Bank
Neutral
546
-
130,424
26,204
29,738
3.6
3.5
34.5
35.4
15.8
15.4
2.5
2.2
16.8
14.9
-
-
Bank of Baroda
Neutral
155
-
35,668
18,802
21,088
2.0
2.2
(7.4)
13.0
11.9
1.2
1.0
(4.2)
7.3
-
-
Bank of India
Neutral
108
-
10,092
15,972
17,271
1.9
2.0
15.3
33.4
7.1
3.2
0.3
0.3
3.6
7.6
-
-
Canara Bank
Neutral
226
-
12,291
15,441
16,945
2.0
2.1
46.6
70.4
4.9
3.2
0.4
0.4
8.0
11.2
-
-
Dena Bank
Neutral
41
-
2,764
3,440
3,840
2.1
2.3
7.3
10.0
5.7
4.1
0.4
0.4
6.1
7.9
-
-
Dewan Housing Finance Buy
214
270
6,250
1,828
2,225
2.9
3.0
24.9
29.7
8.6
7.2
1.3
1.2
15.1
16.1
-
-
Equitas Holdings
Buy
181
235
6,079
679
1,076
12.4
11.7
6.2
6.7
29.3
27.1
3.7
2.7
13.3
12.5
-
-
Federal Bank
Neutral
61
-
10,472
3,279
3,787
2.8
2.9
3.9
5.5
15.5
11.0
1.3
1.2
8.4
10.8
-
-
HDFC
Neutral
1,283
-
202,822
10,358
11,852
3.3
3.3
41.1
47.0
31.2
27.3
6.0
5.4
24.7
24.9
-
-
HDFC Bank
Accumulate
1,172
1,262
296,771
38,606
47,696
4.4
4.5
48.8
61.4
24.0
19.1
4.1
3.6
18.7
20.0
-
-
ICICI Bank
Neutral
242
-
140,508
34,279
39,262
3.3
3.3
21.0
24.4
11.5
9.9
1.9
1.6
14.4
14.7
-
-
IDBI Bank
Neutral
75
-
15,369
9,625
10,455
1.8
1.8
8.5
14.2
8.8
5.3
0.5
0.5
5.9
9.3
-
-
Indian Bank
Neutral
150
-
7,197
6,160
6,858
2.5
2.5
24.5
29.8
6.1
5.0
0.5
0.4
7.7
8.6
-
-
LIC Housing Finance
Buy
511
592
25,806
3,179
3,758
2.6
2.6
32.9
40.6
15.6
12.6
2.9
2.4
19.6
20.7
-
-
Oriental Bank
Neutral
119
-
4,116
7,643
8,373
2.4
2.4
37.2
45.4
3.2
2.6
0.3
0.3
8.2
9.4
-
-
Punjab Natl.Bank
Neutral
118
-
23,092
23,122
26,022
2.8
2.8
7.0
21.6
16.8
5.5
0.9
0.8
3.4
10.0
-
-
South Ind.Bank
Neutral
23
-
3,052
1,965
2,185
2.5
2.5
2.5
3.3
9.1
6.8
0.9
0.8
9.5
11.7
-
-
St Bk of India
Neutral
218
-
169,539
79,958
86,061
2.6
2.6
13.4
20.7
16.3
10.6
1.3
1.2
11.5
12.8
-
-
Union Bank
Neutral
130
-
8,913
12,646
14,129
2.3
2.4
31.0
39.1
4.2
3.3
0.5
0.4
9.8
11.4
-
-
Vijaya Bank
Neutral
41
-
4,125
3,536
3,827
1.9
1.9
5.5
6.7
7.5
6.2
0.6
0.6
7.8
8.8
-
-
Yes Bank
Neutral
1,119
-
47,114
7,190
9,011
3.2
3.3
58.2
69.7
19.2
16.1
3.4
2.9
19.2
19.6
-
-
FMCG
Asian Paints
Neutral
1,011
-
96,965
15,534
17,445
17.7
16.8
18.4
19.6
55.0
51.6
19.5
18.3
34.6
35.6
6.1
5.4
Stock Watch
July 11, 2016
Company Name
Reco
CMP
Target
Mkt Cap
Sales ( Čcr )
OPM(%)
EPS (Č)
PER(x)
P/BV(x)
RoE(%)
EV/Sales(x)
(Č)
Price ( Č)
( Č cr )
FY16E FY17E
FY16E
FY17E
FY16E
FY17E
FY16E
FY17E
FY16E
FY17E
FY16E
FY17E
FY16E
FY17E
FMCG
Britannia
Neutral
2,812
-
33,737
8,481
9,795
14.0
14.1
65.5
78.3
42.9
35.9
20.3
16.7
38.3
41.2
3.9
3.4
Colgate
Neutral
946
-
25,716
4,136
4,632
22.5
23.3
22.2
25.3
42.6
37.4
25.9
23.1
68.6
67.5
6.1
5.4
Dabur India
Neutral
312
-
54,912
9,370
10,265
17.6
17.3
7.3
8.1
42.6
38.5
11.0
10.1
31.7
30.6
5.7
5.2
GlaxoSmith Con*
Neutral
6,114
-
25,714
4,519
5,142
19.6
19.8
164.3
191.2
37.2
32.0
10.3
8.8
30.8
29.9
5.1
4.5
Godrej Consumer
Neutral
1,643
-
55,960
9,003
10,335
18.1
18.7
34.1
41.8
48.2
39.3
10.4
8.9
23.9
24.8
6.4
5.6
HUL
Neutral
920
-
199,154
33,299
35,497
17.1
17.1
18.9
20.0
48.7
46.0
42.7
37.2
87.6
80.8
5.8
5.4
ITC
Neutral
246
-
296,761
36,837
39,726
38.8
38.7
8.2
9.0
30.2
27.4
8.4
7.4
27.8
26.9
7.5
7.0
Marico
Neutral
264
-
34,041
6,151
6,966
17.2
17.3
5.4
6.4
48.9
41.2
15.3
12.1
33.2
32.4
5.4
4.8
Nestle*
Neutral
6,420
-
61,903
9,393
10,507
22.2
22.3
106.8
121.8
60.1
52.7
21.1
19.0
34.8
36.7
6.4
5.7
Tata Global
Neutral
133
-
8,369
8,635
9,072
9.8
9.9
5.8
7.2
22.9
18.4
2.0
2.0
6.8
7.4
1.0
0.9
Procter & Gamble
Buy
6,350
7,369
20,613
2,588
2,939
23.3
23.2
130.2
146.2
48.8
43.4
97.2
93.3
27.6
25.3
7.5
6.5
Hygiene
IT
HCL Tech^
Buy
722
1,000
101,821
37,061
30,781
21.5
20.5
51.4
40.0
14.0
18.0
3.6
2.6
20.1
20.3
2.5
2.7
Infosys
Buy
1,159
1,374
266,159
62,441
70,558
27.5
27.5
59.0
65.3
19.6
17.8
3.9
3.6
22.2
22.4
3.7
3.2
TCS
Buy
2,426
3,004
477,927
108,646
122,770
28.3
28.3
123.7
141.0
19.6
17.2
6.5
5.9
33.1
34.6
3.9
3.4
Tech Mahindra
Buy
502
700
48,773
26,494
30,347
16.3
17.0
32.2
37.5
15.6
13.4
3.4
2.9
21.7
21.8
1.6
1.3
Wipro
Buy
562
680
138,854
50,808
56,189
23.7
23.8
37.3
40.7
15.1
13.8
2.9
2.6
19.2
17.7
2.2
1.8
Media
D B Corp
Neutral
384
-
7,062
2,025
2,187
27.4
27.4
17.4
18.9
22.1
20.4
5.0
4.5
22.9
23.7
3.5
3.2
HT Media
Neutral
83
-
1,931
2,495
2,673
12.9
13.2
6.8
7.2
12.2
11.5
1.0
0.9
7.5
7.8
0.4
0.3
Jagran Prakashan
Accumulate
184
205
6,015
2,107
2,355
33.5
28.0
10.1
10.8
18.3
17.0
4.3
3.7
23.3
21.7
2.9
2.6
Sun TV Network
Neutral
379
-
14,940
2,510
2,763
71.8
71.5
21.9
24.8
17.3
15.3
4.1
3.7
22.8
24.3
5.4
4.9
Hindustan Media
Neutral
274
-
2,010
914
1,016
21.7
21.5
21.9
23.3
12.5
11.8
2.3
1.9
18.0
16.2
1.6
1.4
Ventures
Metals & Mining
Coal India
Buy
312
380
196,849
76,167
84,130
19.9
22.3
22.4
25.8
13.9
12.1
5.0
4.9
35.5
41.0
1.9
1.7
Hind. Zinc
Neutral
187
-
78,866
14,641
14,026
50.4
50.4
17.7
16.0
10.6
11.7
1.6
1.5
16.2
13.2
3.0
2.9
Hindalco
Neutral
127
-
26,194
104,356
111,186
8.7
9.5
6.7
11.1
18.9
11.5
0.7
0.7
3.5
5.9
0.8
0.7
JSW Steel
Neutral
1,474
-
35,633
42,308
45,147
16.4
20.7
(10.3)
49.5
29.8
1.6
1.6
(1.0)
5.6
1.9
1.8
NMDC
Neutral
95
-
37,526
8,237
10,893
46.6
44.5
10.0
11.7
9.5
8.1
1.1
0.9
12.5
13.0
4.3
3.3
SAIL
Neutral
47
-
19,226
45,915
53,954
7.2
10.5
1.5
4.4
30.9
10.6
0.5
0.4
2.3
4.1
1.1
0.9
Vedanta
Neutral
143
-
42,425
71,445
81,910
26.2
26.3
12.9
19.2
11.1
7.5
0.8
0.7
7.2
8.9
1.0
0.8
Tata Steel
Neutral
319
-
30,943
126,760
137,307
8.9
11.3
6.4
23.1
50.1
13.8
1.0
1.0
2.0
7.1
0.8
0.8
Stock Watch
July 11, 2016
Company Name
Reco
CMP
Target
Mkt Cap
Sales ( Čcr )
OPM(%)
EPS (Č)
PER(x)
P/BV(x)
RoE(%)
EV/Sales(x)
(Č)
Price ( Č)
( Č cr )
FY16E FY17E
FY16E
FY17E
FY16E
FY17E
FY16E
FY17E
FY16E
FY17E
FY16E
FY17E
FY16E
FY17E
Oil & Gas
Cairn India
Neutral
145
-
27,270
11,323
12,490
49.4
51.0
20.7
20.7
7.0
7.0
0.5
0.4
6.4
6.1
1.5
0.8
GAIL
Neutral
375
-
47,625
64,856
70,933
9.1
9.6
24.0
28.9
15.7
13.0
1.3
1.3
8.8
9.6
0.9
0.8
ONGC
Neutral
224
-
191,301
154,564
145,998
36.8
37.4
20.8
22.6
10.8
9.9
1.0
1.0
10.1
9.7
1.5
1.6
Petronet LNG
Neutral
293
-
21,938
29,691
31,188
5.8
6.2
12.8
13.4
22.9
21.8
3.4
3.0
15.8
14.8
0.8
0.8
Indian Oil Corp
Neutral
468
-
113,725
359,607
402,760
5.9
6.1
42.5
48.7
11.0
9.6
1.5
1.3
14.1
14.4
0.4
0.4
Reliance Industries
Neutral
980
-
317,792
304,775
344,392
12.6
13.4
91.3
102.6
10.7
9.6
1.2
1.1
11.8
12.0
1.0
0.8
Pharmaceuticals
Alembic Pharma
Neutral
599
-
11,290
3,145
3,483
31.9
16.2
38.2
18.7
15.7
32.0
7.1
6.0
57.9
20.1
3.5
3.2
Aurobindo Pharma
Neutral
778
-
45,535
13,651
15,702
21.7
21.7
33.9
38.4
23.0
20.3
6.4
5.0
32.5
27.7
3.6
3.2
Aventis*
Neutral
4,593
-
10,579
2,049
2,375
15.4
17.3
115.4
153.5
39.8
29.9
6.5
5.1
19.3
25.8
4.9
4.1
Cadila Healthcare
Accumulate
359
400
36,783
9,469
11,246
21.2
22.0
14.9
17.1
24.1
21.0
6.9
5.4
28.8
26.6
3.9
3.2
Cipla
Neutral
520
-
41,765
13,372
15,378
16.4
17.4
18.8
21.6
27.7
24.1
3.5
3.1
13.3
13.7
3.1
3.0
Dr Reddy's
Neutral
3,556
-
60,636
15,471
17,479
24.6
24.6
138.2
152.4
25.7
23.3
4.7
4.0
19.7
18.7
3.9
3.4
Dishman Pharma
Neutral
136
-
2,197
1,733
1,906
21.5
21.5
10.1
10.0
13.5
13.6
1.6
1.4
10.5
11.2
1.8
1.5
GSK Pharma*
Neutral
3,479
-
29,471
2,741
3,528
16.5
18.9
44.2
60.1
78.7
57.9
17.4
17.2
21.2
29.9
10.4
8.1
Indoco Remedies
Neutral
286
-
2,635
977
1,112
14.9
18.2
9.0
13.2
31.8
21.7
4.5
3.9
15.1
19.2
2.8
2.5
Ipca labs
Buy
470
613
5,928
2,844
3,799
10.6
15.3
10.6
17.3
44.3
27.2
2.6
2.4
5.9
9.1
2.2
1.7
Lupin
Accumulate
1,637
1,809
73,816
13,702
15,912
23.7
26.4
50.5
58.1
32.4
28.2
6.7
5.5
22.9
21.4
5.9
4.7
Sun Pharma
Buy
779
944
187,373
27,744
31,129
26.0
30.0
22.0
28.0
35.4
27.8
5.1
4.3
18.3
18.7
6.6
5.7
Power
Tata Power
Neutral
73
-
19,798
35,923
37,402
22.6
22.8
4.1
5.2
18.1
14.2
1.4
1.3
7.5
9.3
1.5
1.4
NTPC
Neutral
153
-
126,444
87,271
99,297
23.5
23.5
11.8
13.3
13.1
11.5
1.5
1.4
11.5
12.2
2.5
2.2
Power Grid
Neutral
165
-
86,321
20,702
23,361
86.7
86.4
12.1
13.2
13.7
12.5
2.0
1.8
15.6
15.1
9.1
8.4
Real Estate
MLIFE
Buy
463
554
1,902
826
1,011
20.1
21.9
22.7
30.7
20.4
15.1
1.2
1.1
6.0
7.4
4.2
3.2
Telecom
Bharti Airtel
Neutral
355
-
141,908
101,748
109,191
32.1
31.7
12.0
12.5
29.6
28.4
2.0
1.9
6.9
6.7
2.0
1.8
Idea Cellular
Neutral
102
-
36,692
34,282
36,941
32.0
31.5
5.9
6.2
17.3
16.4
1.6
1.4
9.9
9.3
1.6
1.6
zOthers
Abbott India
Neutral
4,740
-
10,072
2,715
3,153
14.5
14.1
134.3
152.2
35.3
31.1
8.8
7.3
27.4
25.6
3.4
2.9
Bajaj Electricals
Accumulate
248
268
2,504
4,612
5,351
5.6
5.7
9.5
12.4
26.2
20.0
3.3
2.9
12.5
14.4
0.5
0.5
Finolex Cables
Neutral
374
-
5,726
2,520
2,883
12.2
12.0
12.7
14.2
29.6
26.4
4.0
3.6
13.6
13.5
2.0
1.7
Goodyear India*
Buy
525
631
1,211
1,750
1,598
11.3
10.4
53.7
49.4
9.8
10.6
2.1
1.8
23.0
18.2
0.5
0.4
Hitachi
Neutral
1,360
-
3,697
1,779
2,081
7.8
8.8
21.8
33.4
62.4
40.7
10.1
8.1
17.4
22.1
2.1
1.8
Stock Watch
July 11, 2016
Company Name
Reco
CMP
Target
Mkt Cap
Sales ( Čcr )
OPM(%)
EPS (Č)
PER(x)
P/BV(x)
RoE(%)
EV/Sales(x)
(Č)
Price ( Č)
( Č cr )
FY16E
FY17E
FY16E
FY17E
FY16E
FY17E
FY16E
FY17E
FY16E
FY17E
FY16E
FY17E
FY16E
FY17E
zOthers
Jyothy Laboratories
Neutral
296
-
5,369
1,620
1,847
11.5
11.5
7.3
8.5
40.7
35.0
5.3
4.9
13.3
14.4
3.2
2.7
MRF
Buy
35,278
45,575
14,962
20,316
14,488
21.4
21.1
5,488.0
3,798.0
6.4
9.3
2.2
1.8
41.1
21.2
0.7
0.9
Page Industries
Neutral
13,326
-
14,864
1,929
2,450
19.8
20.1
229.9
299.0
58.0
44.6
25.6
17.8
52.1
47.1
7.7
6.1
Relaxo Footwears
Neutral
483
-
5,796
1,767
2,152
12.3
12.5
19.3
25.1
25.1
19.3
6.2
4.7
27.7
27.8
3.3
2.7
Siyaram Silk Mills
Buy
1,067
1,347
1,000
1,619
1,799
11.6
11.6
93.5
104.9
11.4
10.2
2.0
1.7
17.1
16.4
0.9
0.8
Styrolution ABS India* Neutral
648
-
1,140
1,271
1,440
8.6
9.2
32.0
41.1
20.2
15.8
2.1
1.9
10.7
12.4
0.9
0.8
TVS Srichakra
Buy
2,389
2,932
1,829
2,035
2,252
15.9
15.3
248.6
268.1
9.6
8.9
4.2
3.0
43.6
33.9
0.9
0.8
HSIL
Accumulate
277
310
1,999
2,123
2,384
16.1
16.5
15.0
18.9
18.4
14.7
1.4
1.3
8.0
9.4
1.3
1.1
Kirloskar Engines India
Neutral
268
-
3,873
2,403
2,554
8.6
9.9
9.2
10.5
29.2
25.5
2.8
2.7
9.7
10.7
1.3
1.2
Ltd
M M Forgings
Buy
423
546
511
511
615
21.7
21.6
43.1
55.8
9.8
7.6
1.8
1.5
19.9
21.2
1.2
0.9
Banco Products (India) Neutral
156
-
1,115
1,208
1,353
11.0
12.3
10.8
14.5
14.5
10.8
1.7
1.5
11.9
14.5
0.9
0.8
Competent Automobiles Neutral
148
-
91
1,040
1,137
3.2
3.1
25.7
28.0
5.8
5.3
0.9
0.8
15.0
14.3
0.1
0.1
Nilkamal
Neutral
1,213
-
1,810
1,871
2,031
10.7
10.5
63.2
69.8
19.2
17.4
3.1
2.7
17.6
16.6
1.0
0.9
Visaka Industries
Neutral
157
-
249
1,020
1,120
8.7
9.1
13.9
20.1
11.3
7.8
0.7
0.7
6.4
8.7
0.5
0.4
Transport Corporation of
Neutral
334
-
2,554
2,830
3,350
8.8
9.0
14.4
18.3
23.2
18.2
3.6
3.1
15.4
17.1
1.0
0.9
India
Elecon Engineering
Neutral
64
-
693
1,359
1,482
10.3
13.7
0.8
3.9
79.2
16.3
1.3
1.3
1.6
7.8
0.9
0.8
Surya Roshni
Buy
167
201
732
2,992
3,223
8.1
8.4
14.7
18.3
11.4
9.1
1.1
1.0
9.7
11.0
0.5
0.5
MT Educare
Neutral
163
-
648
286
366
18.3
17.7
7.7
9.4
21.1
17.4
4.4
3.9
20.2
21.1
2.2
1.6
Radico Khaitan
Buy
95
125
1,261
1,543
1,659
12.6
13.0
5.8
6.3
16.4
15.0
1.4
1.3
8.5
8.6
1.3
1.2
Garware Wall Ropes
Buy
392
460
858
828
898
11.2
10.3
28.3
29.0
13.9
13.5
2.3
2.0
16.8
14.9
1.0
0.9
Wonderla Holidays
Neutral
398
-
2,247
206
308
44.0
43.6
9.0
12.9
44.2
30.8
6.0
5.5
13.7
17.8
10.8
7.2
Linc Pen & Plastics
Neutral
247
-
365
344
382
9.1
9.1
12.4
13.1
19.9
18.9
3.6
3.2
18.0
16.7
1.2
1.0
The Byke Hospitality
Neutral
158
-
632
222
287
20.5
20.5
5.6
7.6
28.0
20.9
5.3
4.3
18.9
20.8
2.9
2.2
Interglobe Aviation
Neutral
1,014
-
36,537
17,022
21,122
20.7
14.5
63.9
53.7
15.9
18.9
23.8
19.5
149.9
103.2
2.2
1.7
Coffee Day Enterprises
Neutral
252
-
5,184
2,692
2,964
17.0
18.6
-
4.7
-
53.1
3.1
2.9
0.2
5.5
2.3
2.2
Ltd
Navneet Education
Neutral
100
-
2,383
998
1,062
24.1
24.0
5.8
6.1
17.4
16.4
3.8
3.4
22.0
20.6
2.5
2.3
Navkar Corporation
Buy
215
265
3,060
347
408
43.2
42.9
6.7
6.8
32.2
31.7
2.4
2.2
7.3
6.9
9.3
8.4
UFO Moviez
Neutral
541
-
1,492
558
619
32.0
33.2
22.5
30.0
24.0
18.0
2.9
2.5
12.0
13.8
2.5
2.1
VRL Logistics
Neutral
315
-
2,871
1,725
1,902
16.5
16.7
12.2
14.6
25.9
21.6
5.4
4.7
20.8
21.9
1.8
1.6
Stock Watch
July 11, 2016
Company Name
Reco
CMP
Target Mkt Cap
Sales ( Čcr )
OPM(%)
EPS (Č)
PER(x)
P/BV(x)
RoE(%)
EV/Sales(x)
(Č)
Price ( Č)
( Č cr )
FY16E FY17E FY16E FY17E FY16E FY17E FY16E FY17E FY16E FY17E FY16E FY17E FY16E FY17E
zOthers
Team Lease Serv.
Neutral
1,110
-
1,898
2,565
3,229
1.3
1.5
15.2
22.8
73.2
48.8
5.9
5.2
8.0
10.7
0.6
0.5
S H Kelkar & Co.
Neutral
228
-
3,296
928
1,036
15.3
15.1
4.9
6.1
46.2
37.3
4.3
4.0
9.4
10.7
3.5
3.1
Quick Heal
Neutral
288
-
2,015
339
408
27.8
27.3
7.1
7.7
40.7
37.2
3.4
3.5
8.5
9.3
4.9
4.1
Narayana Hrudaya
Neutral
306
-
6,253
1,603
1,873
10.9
11.5
1.0
2.6
321.2
115.7
7.7
7.1
2.4
6.1
4.0
3.4
Manpasand Bever.
Neutral
618
-
3,094
540
836
19.9
19.6
10.2
16.9
60.4
36.6
4.9
4.4
8.1
12.0
5.4
3.4
Parag Milk Foods
Accumulate
319
336
2,686
1,645
1,919
9.0
9.3
6.7
9.5
47.5
33.8
6.2
5.3
13.1
15.5
1.9
1.6
Source: Company, Angel Research; Note: *December year end; #September year end; &October year end; Price as on July 08, 2016
Market Outlook
July 11, 2016
Research Team Tel: 022 - 39357800
DISCLAIMER
Angel Broking Private Limited (hereinafter referred to as “Angel”) is a registered Member of National Stock Exchange of India Limited,
Bombay Stock Exchange Limited and Metropolitian Stock Exchange of India Limited. It is also registered as a Depository Participant with
CDSL and Portfolio Manager with SEBI. It also has registration with AMFI as a Mutual Fund Distributor. Angel Broking Private Limited is a
registered entity with SEBI for Research Analyst in terms of SEBI (Research Analyst) Regulations, 2014 vide registration number
INH000000164. Angel or its associates has not been debarred/ suspended by SEBI or any other regulatory authority for accessing
/dealing in securities Market. Angel or its associates including its relatives/analyst do not hold any financial interest/beneficial ownership
of more than 1% in the company covered by Analyst. Angel or its associates/analyst has not received any compensation / managed or co
-managed public offering of securities of the company covered by Analyst during the past twelve months. Angel/analyst has not served as
an officer, director or employee of company covered by Analyst and has not been engaged in market making activity of the company
covered by Analyst.
This document is solely for the personal information of the recipient, and must not be singularly used as the basis of any investment
decision. Nothing in this document should be construed as investment or financial advice. Each recipient of this document should make
such investigations as they deem necessary to arrive at an independent evaluation of an investment in the securities of the companies
referred to in this document (including the merits and risks involved), and should consult their own advisors to determine the merits and
risks of such an investment.
Reports based on technical and derivative analysis center on studying charts of a stock's price movement, outstanding positions and
trading volume, as opposed to focusing on a company's fundamentals and, as such, may not match with a report on a company's
fundamentals.
The information in this document has been printed on the basis of publicly available information, internal data and other reliable sources
believed to be true, but we do not represent that it is accurate or complete and it should not be relied on as such, as this document is for
general guidance only. Angel Broking Pvt. Limited or any of its affiliates/ group companies shall not be in any way responsible for any
loss or damage that may arise to any person from any inadvertent error in the information contained in this report. Angel Broking Pvt.
Limited has not independently verified all the information contained within this document. Accordingly, we cannot testify, nor make any
representation or warranty, express or implied, to the accuracy, contents or data contained within this document. While Angel Broking
Pvt. Limited endeavors to update on a reasonable basis the information discussed in this material, there may be regulatory, compliance,
or other reasons that prevent us from doing so.
This document is being supplied to you solely for your information, and its contents, information or data may not be reproduced,
redistributed or passed on, directly or indirectly.
Neither Angel Broking Pvt. Limited, nor its directors, employees or affiliates shall be liable for any loss or damage that may arise from or
in connection with the use of this information.
Note: Please refer to the important ‘Stock Holding Disclosure' report on the Angel website (Research Section). Also, please refer to the
latest update on respective stocks for the disclosure status in respect of those stocks. Angel Broking Pvt. Limited and its affiliates may have
investment positions in the stocks recommended in this report.