Market Outlook
April 11, 2016
Market Cues
Domestic Indices
Chg (%)
(Pts)
(Close)
Indian markets are expected to open on a Flat to marginally Negative note tracking
BSE Sensex
(0.0)
(12)
24,674
the SGX Nifty and most Asian Markets.
Nifty
0.1
9
7,555
After its early highs, the U.S. markets witnessed a pullback throughout the lackluster
Mid Cap
0.6
68
10,594
trading session on Friday. The markets however managed to close moderately
Small Cap
0.6
67
10,664
higher. The choppy trading came as investor kept an eye on developments in the
Bankex
0.2
38
17,695
currency market.
European equities rose in early trading and ended Friday’s trading session in the
Global Indices
Chg (%)
(Pts)
(Close)
positive zone as firmer prices of metals and crude oil boosted resource-related
Dow Jones
0.2
35
17,577
stocks. Better than expected German export data also added to the positive
Nasdaq
0.0
2
4,851
sentiment.
FTSE
1.1
68
6,204
Indian markets closed little changed on Friday as traders took a pause before
Nikkei
0.5
72
15,822
quarterly results which will be coming in this week.
Hang Seng
0.5
104
20,370
News & Result Analysis
Shanghai Com
(0.8)
(23)
2,985
Sun Pharma gets USFDA nod for eye inflammation drug
Society of Indian Auto Manufacturers (SIAM), projects 6-8% growth for FY17
Advances / Declines
BSE
NSE
Detailed analysis on Pg2
Advances
1,494
954
Investor’s Ready Reckoner
Declines
1,041
590
Key Domestic & Global Indicators
Unchanged
167
73
Stock Watch: Latest investment recommendations on 150+ stocks
Refer Pg5 onwards
Volumes (` Cr)
BSE
1,957
Top Picks
CMP
Target
Upside
NSE
12,950
Company
Sector
Rating
(`)
(`)
(%)
Amara Raja
Auto & Auto Ancillary
Buy
863
1,040
20.5
Net Inflows (` Cr)
Net
Mtd
Ytd
HCL Tech
IT
Buy
832
1,038
24.8
FII
(515)
(1,040)
(13,550)
LIC Housing
Financials
Buy
477
592
24.1
MFs
(233)
(444)
64,251
Bharat Electronics
Capital Goods
Buy
1,168
1,414
21.1
Navkar Corporation Others
Buy
179
265
48.0
More Top Picks on Pg4
Top Gainers
Price (`)
Chg (%)
Jindalstel
67
10.6
Key Upcoming Events
Welcorp
105
6.4
Previous
Consensus
Date
Region
Event Description
Reading
Expectations
Manappuram
38
6.0
Apr 11 China
Consumer Price Index (YoY)
2.30
2.40
Indiacem
92
5.8
Apr 12 UK
CPI (YoY)
0.30
-
Polaris
193
5.3
Apr 12 India
Industrial Production (YoY)
(1.50)
-
Apr 13 US
Producer Price Index (mom)
(0.6)
-
6.(6.(
Top Losers
Price (`)
Chg (%)
More Events on Pg4
Ipcalab
499
(10.6)
Sobha
267
(3.5)
Beml
887
(3.3)
Tv18Brdcst
37
(3.3)
Jpassociat
8
(2.9)
As on April 08, 2016
Market Outlook
April 11, 2016
Sun Pharma gets USFDA nod for eye inflammation drug
As per exchange notification, company has announced that its wholly owned
subsidiaries has received approval from USFDA for its New Drug Application
(NDA) related to BromSite™ (bromfenac ophthalmic solution) 0.075% for the
treatment of postoperative inflammation and prevention of ocular pain in patients
undergoing cataract surgery. BromSite™ is developed by InSite Vision, which Sun
Pharma acquired in November 2015 and is likely to commercialize BromSite™
through its newly formed, US-based division, Sun Ophthalmics, in the second half
of 2016.
Sun Ophthalmics targets to provide eye care practitioners products that enhance
their practice patterns and treatment options. With BromSite’s approval and
additional late-stage candidates in its pipeline, Sun Ophthalmics is strongly
positioned to offer a range of beneficial products and establish itself as a
respected and trusted partner. We maintain our Buy rating on the stock.
Society of Indian Auto Manufacturers (SIAM), projects
6-8%
growth for FY17
SIAM has reduced its FY17 target for growth in the industry from 11% to 6-8%. The
substantial reduction in the growth expectations comes after taking the consensus
view of the industry players. A slew of new launches and discounts helped the
auto industry growing by 7.24% in FY14. However, an unfavorable environment
around diesel vehicles and higher taxation in the form of infrastructure cess
ranging from 1-4%, can result in lower than expected growth in the passenger
vehicle sales in FY17 said the industry body. SIAM said the earlier projections were
based on the host of new models launched by the players.
In budget FY17 the Government introduced the infrastructure cess of 1-4%,
depending on types of the vehicles. Further the uncertainty relating to the ban of
diesel vehicles above 2000 CC in the National Capital Region was also a big
concern. Additional tax is not only likely to result in negative sentiment for buyers,
but even fresh capacity expansions by the industry can also take a hit. Some OEMs
have also expressed their concern over the frequent change in tax structure in the
industry and believe automobile has become one of the highest taxed
manufactured products in the country.
However, we believe expectations of normal monsoon and reduction in the interest
rates will attract rural buyers in FY17 and that is expected to compensate the
slowdown in the urban area to some extent. Further the huge budgetary allocation
towards the rural economy will help tractors sales improving in FY17. Hence we
believe given all the above conditions Mahindra & Mahindra could emerge as a
major beneficiary. At the CMP of `1,233 the stock is trading at 22.5 x and 19.5x
its FY16 and FY17E EPS respectively. We have an Accumulate rating on the stock.
Additionally, tyre Company with significant presence in the farm segment like
Goodyear India also can benefit from expectation of better monsoons, and
positive outlook on tractor sales. At CMP of `491, the stock trades at 8.4x and
9.3x its FY16 and FY17E earnings respectively. We maintain our Buy rating on the
stock.
Market Outlook
April 11, 2016
Economic and Political News
Major ports add record 94mn tonne capacity: Gadkari
India's foreign exchange reserves surge to record high of $360bn
Piyush Goyal promises electricity to all UP households by 2019
Centre releases `12,230cr for MGNREGA
Corporate News
Airtel to buy Aircel's airwaves in eight circles for `3,500cr
JSPL wins court case over iron ore mine
NMDC sales, production down in FY16
Market Outlook
April 11, 2016
Top Picks ★★★★★
Large Cap
Market Cap
CMP
Target
Upside
Company
Rationale
(` Cr)
(`)
(`)
(%)
To outpace battery industry growth due to better technological
Amara Raja Batteries
14,741
863
1,040
20.5
products leading to market share gains in both the automotive
OEM and replacement segments.
Uptick in defense capex by government when coupled with
Bharat Electronics
28,024
1,168
1,414
21.1
BELs strong market positioning, indicate that good times are
ahead for BEL.
The stock is trading at attractive valuations and is factoring all
HCL Tech
1,17,301
832
1,038
24.8
the bad news.
Strong visibility for a robust 20% earnings trajectory, coupled
HDFC Bank
2,67,684
1,059
1,262
19.2
with high quality of earnings on account of high quality retail
business and strategic focus on highly rated corporates.
Back on the growth trend, expect a long term growth of 14%
Infosys
2,69,009
1,167
1,347
15.4
to be a US$20bn in FY2020.
LICHF continues to grow its retail loan book at a healthy pace
with improvement in asset quality. We expect the company to
LIC Housing Finance
24,057
477
592
24.1
post a healthy loan book which is likely to reflect in a strong
earnings growth.
Huge bid pipeline of re-development works at Delhi and other
NBCC
11,430
953
1,089
14.3
State Governments and opportunity from Smart City, positions
NBCC to report strong growth, going forward.
Source: Company, Angel Research
Mid Cap
Market Cap
CMP
Target
Upside
Company
Rationale
(` Cr)
(`)
(`)
(%)
Favorable outlook for the AC industry to augur well for
Cooling products business which is out pacing the market
Blue Star
3,569
397
458
15.4
growth. EMPPAC division's profitability to improve once
operating environment turns around.
With a focus on the low and medium income (LMI) consumer
Dewan Housing
5,506
189
270
43.1
segment, the company has increased its presence in tier-II &
III cities where the growth opportunity is immense.
Commencement of new projects, downtrend in the interest
IL&FS Transport
2,605
79
93
17.4
rate cycle, to lead to stock re-rating
Economic recovery to have favourable impact on advertising
& circulation revenue growth. Further, the acquisition of a
Jagran Prakashan
5,129
157
189
20.5
radio business (Radio City) would also boost the company's
revenue growth.
Speedier execution and speedier sales, strong revenue visibilty
Mahindra Lifespace
1,826
445
554
24.5
in short-to-long run, attractive valuations
Massive capacity expansion along with rail advantage at ICD
Navkar Corporation
2,553
179
265
48.0
as well CFS augurs well for the company
Earnings boost on back of stable material prices and
Radico Khaitan
1,261
95
156
64.6
favourable pricing environment. Valuation discount to peers
provides additional comfort
Strong brands and distribution network would boost growth
Siyaram Silk Mills
939
1,002
1,354
35.2
going ahead. Stock currently trades at an inexpensive
valuation.
Source: Company, Angel Research
Market Outlook
April 11, 2016
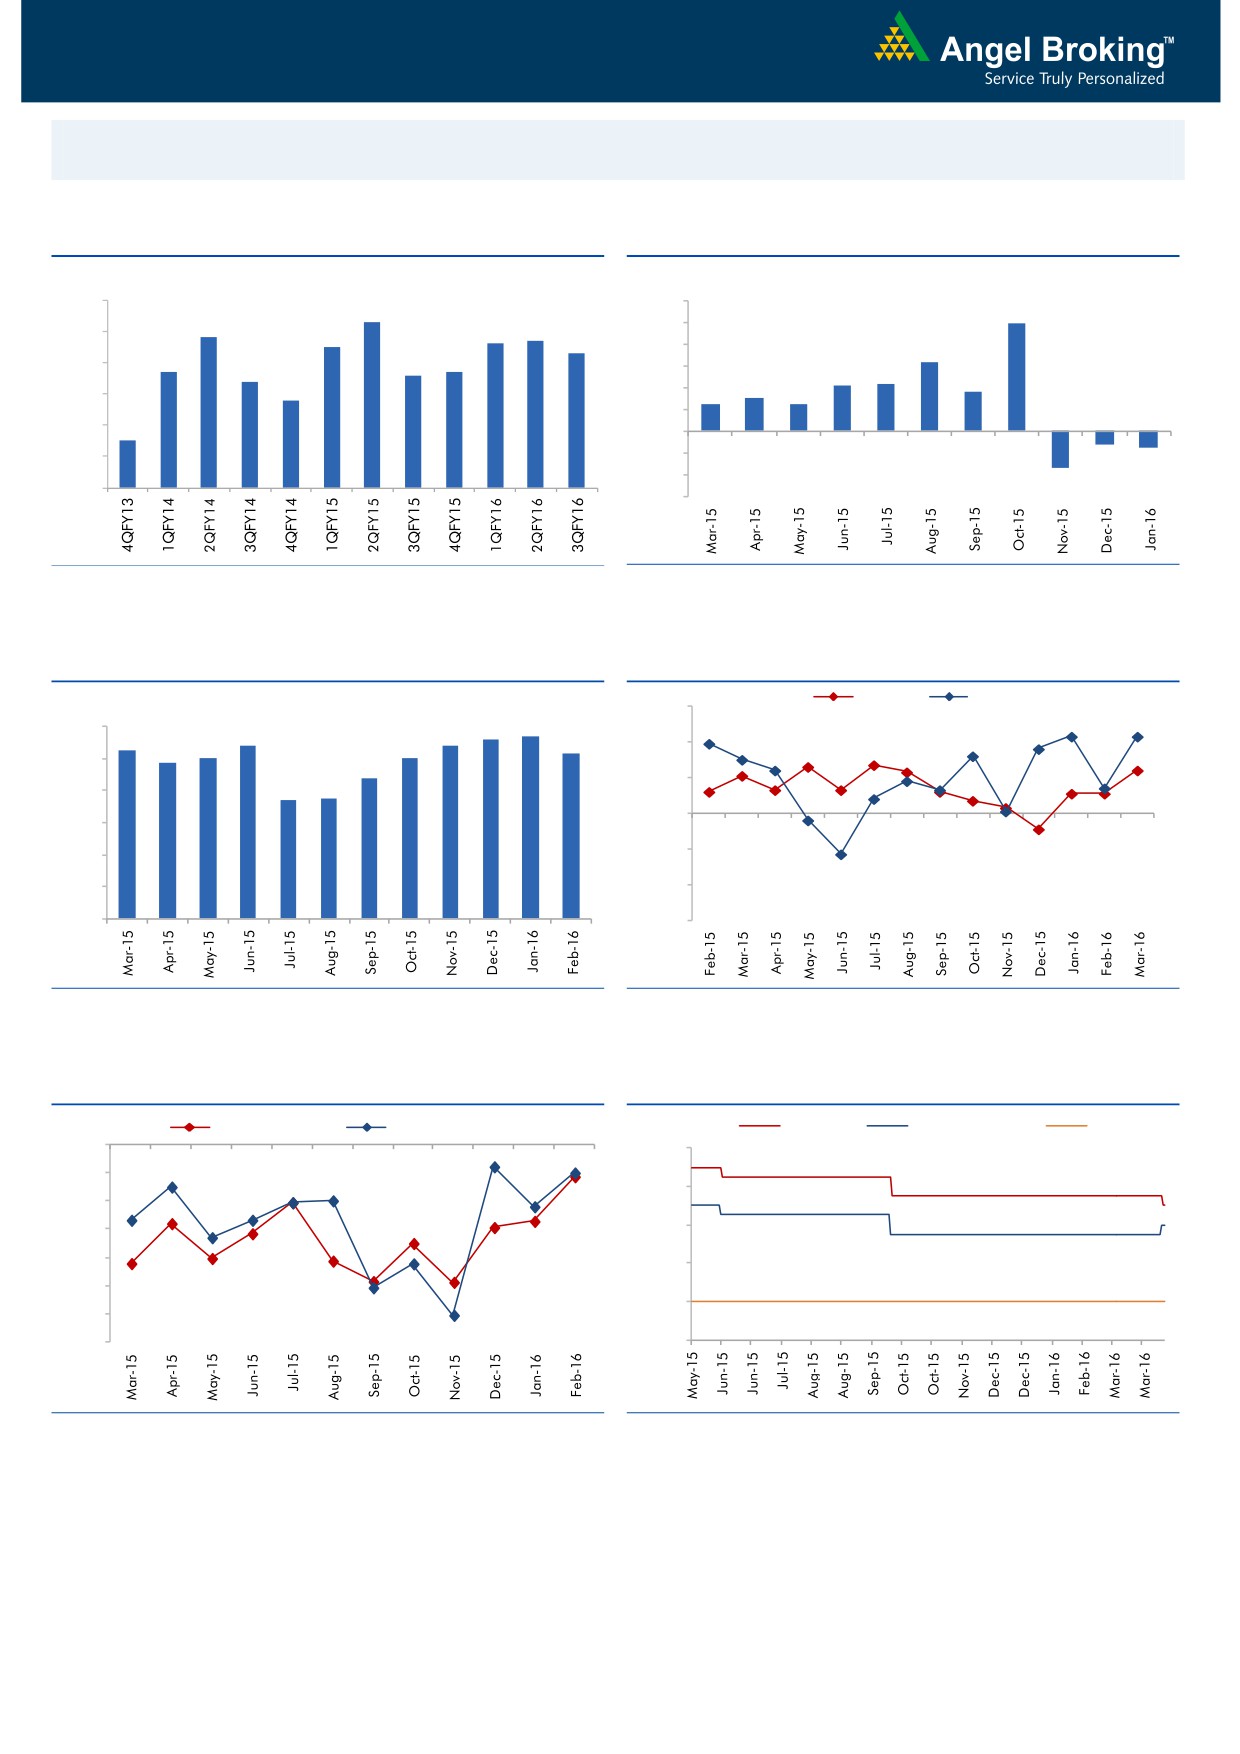
Macro watch
Exhibit 1: Quarterly GDP trends
Exhibit 2: IIP trends
(%)
(%)
9.0
12.0
8.3
9.9
7.8
7.6
7.7
10.0
8.0
7.5
7.3
8.0
6.3
6.7
6.6
6.7
7.0
6.4
6.0
4.2
4.3
3.7
5.8
3.0
4.0
2.5
2.5
6.0
2.0
5.0
4.5
-
4.0
(2.0)
(1.2)
(1.5)
(4.0)
3.0
(3.4)
(6.0)
Source: CSO, Angel Research
Source: MOSPI, Angel Research
Exhibit 3: Monthly CPI inflation trends
Exhibit 4: Manufacturing and services PMI
Mfg. PMI
Services PMI
(%)
56.0
5.6
5.7
6.0
5.4
5.4
5.3
5.2
4.9
5.0
5.0
54.0
5.0
4.4
3.7
3.7
52.0
4.0
50.0
3.0
48.0
2.0
1.0
46.0
-
44.0
Source: MOSPI, Angel Research
Source: Market, Angel Research; Note: Level above 50 indicates expansion
Exhibit 5: Exports and imports growth trends
Exhibit 6: Key policy rates
(%)
Exports yoy growth
Imports yoy growth
(%)
Repo rate
Reverse Repo rate
CRR
0.0
8.00
(5.0)
7.00
(10.0)
(15.0)
6.00
(20.0)
5.00
(25.0)
4.00
(30.0)
(35.0)
3.00
Source: Bloomberg, Angel Research
Source: RBI, Angel Research
Market Outlook
April 11, 2016
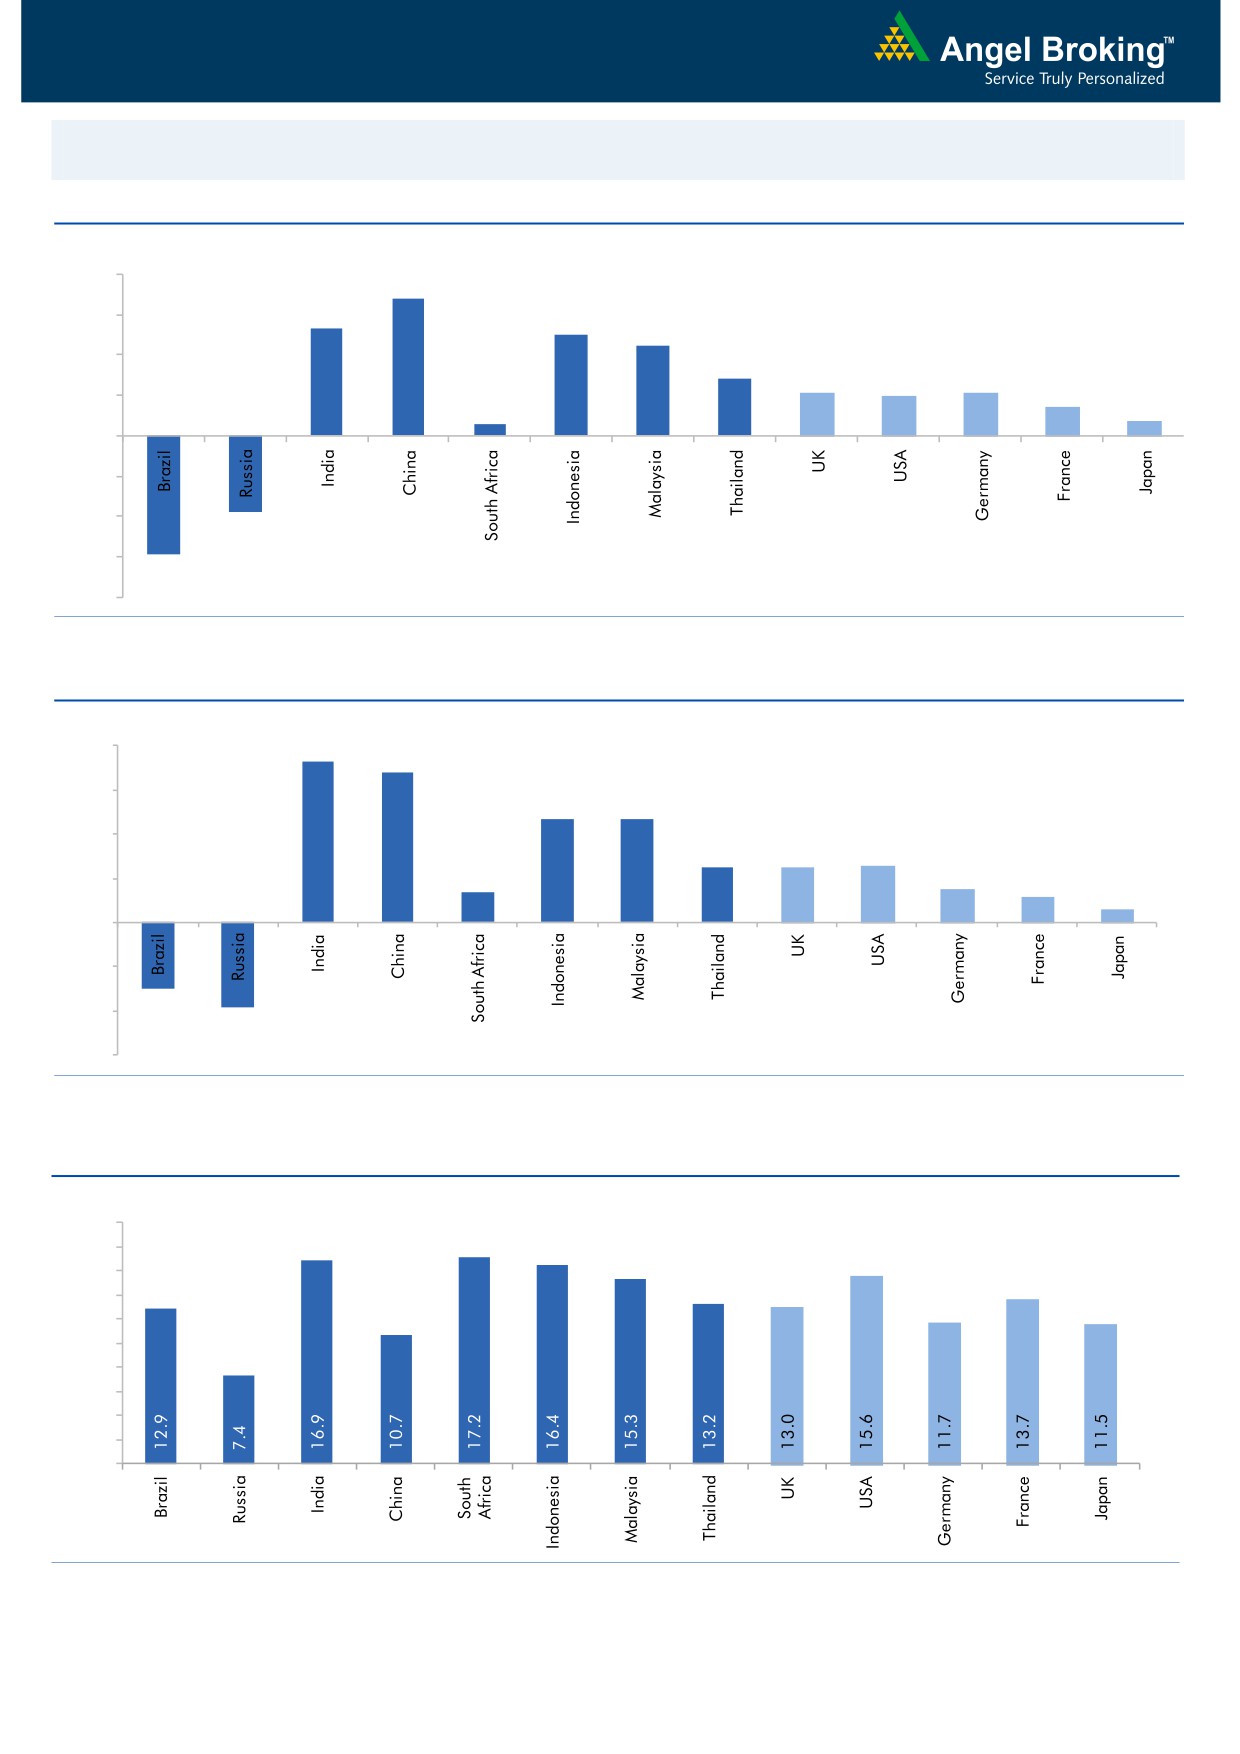
Global watch
Exhibit 1: Latest quarterly GDP Growth (%, yoy) across select developing and developed countries
(%)
8.0
6.8
6.0
5.3
5.0
4.5
4.0
2.8
2.1
2.0
2.1
1.4
2.0
0.6
0.7
-
(2.0)
(4.0)
(3.8)
(6.0)
(5.9)
(8.0)
Source: Bloomberg, Angel Research
Exhibit 2: 2015 GDP Growth projection by IMF (%, yoy) across select developing and developed countries
(%)
8.0
7.3
6.8
6.0
4.7
4.7
4.0
2.5
2.5
2.6
1.4
1.5
2.0
1.2
0.6
-
(2.0)
(3.0)
(4.0)
(3.8)
(6.0)
Source: IMF, Angel Research
Exhibit 3: One year forward P-E ratio across select developing and developed countries
(x)
20.0
18.0
16.0
14.0
12.0
10.0
8.0
6.0
4.0
2.0
-
Source: IMF, Angel Research
Market Outlook
April 11, 2016
Exhibit 4: Relative performance of indices across globe
Returns (%)
Country
Name of index
Closing price
1M
3M
1YR
Brazil
Bovespa
50,293
2.4
18.6
(1.7)
Russia
Micex
1,877
(0.3)
7.0
11.5
India
Nifty
7,555
0.9
(2.9)
(12.8)
China
Shanghai Composite
2,985
5.7
(8.2)
(20.6)
South Africa
Top 40
45,252
(2.1)
2.5
(3.0)
Mexico
Mexbol
44,859
0.0
6.7
(0.1)
Indonesia
LQ45
840
(0.3)
4.7
(10.4)
Malaysia
KLCI
1,718
1.9
3.2
(6.2)
Thailand
SET 50
871
(2.0)
14.3
(12.4)
USA
Dow Jones
17,577
3.6
4.0
(2.7)
UK
FTSE
6,204
0.4
4.2
(12.2)
Japan
Nikkei
15,822
(5.7)
(13.0)
(17.6)
Germany
DAX
9,622
(1.6)
(3.6)
(22.0)
France
CAC
4,303
(3.1)
(2.3)
(17.6)
Source: Bloomberg, Angel Research
Stock Watch
April 11, 2016
Company Name
Reco
CMP
Target
Mkt Cap
Sales ( Čcr )
OPM(%)
EPS (Č)
PER(x)
P/BV(x)
RoE(%)
EV/Sales(x)
(Č)
Price ( Č)
( Č cr )
FY16E FY17E
FY16E
FY17E
FY16E
FY17E
FY16E
FY17E
FY16E
FY17E
FY16E
FY17E
FY16E
FY17E
Agri / Agri Chemical
Rallis
Neutral
170
-
3,311
2,097
2,415
14.4
14.4
9.5
11.0
17.9
15.5
3.6
3.1
21.1
21.3
1.6
1.4
United Phosphorus
Neutral
460
-
19,733
12,500
14,375
18.3
18.3
29.8
35.9
15.5
12.8
2.9
2.4
20.0
20.3
1.7
1.4
Auto & Auto Ancillary
Ashok Leyland
Neutral
107
-
30,451
17,995
21,544
11.4
11.6
3.4
4.7
31.5
22.8
5.5
5.1
17.7
22.2
1.7
1.3
Bajaj Auto
Accumulate
2,391
2,585
69,178
22,709
25,860
20.9
20.1
129.0
143.6
18.5
16.7
5.7
4.9
30.7
29.4
2.6
2.2
Bharat Forge
Accumulate
771
875
17,957
7,351
8,318
19.9
19.7
31.2
36.5
24.7
21.1
4.4
3.7
19.3
19.2
2.6
2.2
Eicher Motors
Neutral
19,181
-
52,098
15,556
16,747
15.5
17.3
464.8
597.5
41.3
32.1
15.1
11.1
36.2
34.3
3.3
3.0
Gabriel India
Accumulate
90
101
1,297
1,415
1,544
8.7
9.0
4.6
5.4
19.6
16.7
3.6
3.2
18.1
18.9
0.9
0.8
Hero Motocorp
Neutral
2,920
-
58,315
28,244
30,532
15.5
15.9
156.7
168.5
18.6
17.3
7.4
6.3
39.9
36.4
1.9
1.7
Jamna Auto Industries Accumulate
146
160
1,167
1,281
1,473
11.2
11.5
7.6
9.2
19.2
15.9
4.9
4.0
25.4
25.2
1.0
0.8
L G Balakrishnan & Bros Neutral
464
-
728
1,254
1,394
11.6
11.8
35.9
41.7
12.9
11.1
1.8
1.5
13.5
13.8
0.7
0.6
Mahindra and Mahindra Accumulate
1,233
1,364
76,587
38,416
42,904
13.7
13.9
54.8
63.4
22.5
19.5
3.5
3.1
15.4
15.8
1.6
1.4
Maruti
Neutral
3,429
-
103,579
57,865
68,104
16.4
16.7
176.3
225.5
19.5
15.2
3.8
3.2
19.4
21.2
1.6
1.3
Minda Industries
Neutral
1,009
-
1,600
2,523
2,890
8.7
9.0
55.0
65.4
18.3
15.4
3.5
2.9
19.3
18.7
0.7
0.6
Motherson Sumi
Buy
244
313
32,248
39,343
45,100
8.8
9.1
10.1
12.5
24.1
19.5
7.6
6.0
35.3
34.4
0.9
0.8
Rane Brake Lining
Buy
378
465
299
454
511
11.5
12.0
25.2
31.0
15.0
12.2
2.2
2.0
14.9
16.6
0.8
0.7
Setco Automotive
Neutral
31
-
415
594
741
12.7
13.7
1.7
3.2
18.3
9.7
1.9
1.7
10.4
16.9
1.1
0.9
Tata Motors
Neutral
372
-
107,462
259,686
273,957
13.0
13.4
25.9
29.5
14.4
12.6
1.9
1.6
8.0
9.0
0.6
0.6
TVS Motor
Accumulate
313
330
14,877
11,263
13,122
6.9
8.5
9.2
15.0
34.0
20.9
7.8
6.2
22.7
29.6
1.3
1.1
Amara Raja Batteries
Buy
863
1,040
14,741
4,892
5,871
17.4
17.6
28.8
37.1
30.0
23.3
7.0
5.6
23.4
24.1
3.0
2.4
Exide Industries
Buy
134
162
11,428
6,950
7,784
14.4
14.8
6.6
7.3
20.4
18.4
2.6
2.3
12.6
12.8
1.4
1.2
Apollo Tyres
Accumulate
168
183
8,549
12,056
12,714
17.2
16.4
23.0
20.3
7.3
8.3
1.3
1.1
17.7
13.6
0.8
0.8
Ceat
Neutral
1,081
-
4,372
6,041
6,597
14.1
13.7
99.5
111.9
10.9
9.7
2.1
1.8
19.6
18.5
0.9
0.8
JK Tyres
Neutral
83
-
1,871
7,446
7,669
15.2
14.0
19.6
18.4
4.2
4.5
1.1
0.9
25.2
19.5
0.6
0.6
Swaraj Engines
Neutral
900
-
1,118
552
630
14.2
14.7
44.6
54.1
20.2
16.6
4.7
4.3
23.2
25.6
1.9
1.6
Subros
Neutral
88
-
525
1,293
1,527
11.8
11.9
4.2
6.7
20.8
13.1
1.6
1.4
7.7
11.5
0.7
0.6
Indag Rubber
Neutral
172
-
450
283
329
17.0
17.2
13.0
15.4
13.3
11.1
2.9
2.4
21.8
21.6
1.3
1.1
Capital Goods
ACE
Neutral
38
-
373
660
839
4.7
8.2
1.0
3.9
37.7
9.7
1.2
1.1
3.2
11.3
0.7
0.6
BEML
Buy
887
1,157
3,695
3,277
4,006
6.0
8.9
36.2
64.3
24.5
13.8
1.7
1.5
5.7
11.7
1.2
0.9
Bharat Electronics
Buy
1,168
1,414
28,024
7,737
8,634
16.8
17.2
54.0
61.5
21.6
19.0
3.1
2.7
39.3
45.6
2.7
2.3
Stock Watch
April 11, 2016
Company Name
Reco
CMP
Target
Mkt Cap
Sales ( Čcr )
OPM(%)
EPS (Č)
PER(x)
P/BV(x)
RoE(%)
EV/Sales(x)
(Č)
Price ( Č)
( Č cr )
FY16E
FY17E
FY16E
FY17E
FY16E
FY17E
FY16E
FY17E
FY16E
FY17E
FY16E
FY17E
FY16E
FY17E
Capital Goods
Voltas
Buy
272
353
9,000
5,363
5,963
8.0
9.1
11.0
13.8
24.7
19.7
3.8
3.3
16.2
17.9
1.6
1.4
BGR Energy
Neutral
105
-
758
3,615
3,181
9.5
9.4
16.7
12.4
6.3
8.5
0.6
0.6
10.0
7.0
0.6
0.8
BHEL
Neutral
122
-
29,971
33,722
35,272
10.8
11.7
10.5
14.2
11.7
8.6
0.9
0.8
7.0
9.0
1.0
0.9
Blue Star
Buy
397
458
3,569
3,548
3,977
6.3
6.9
13.7
17.2
29.0
23.1
7.3
4.7
26.1
25.4
1.1
0.9
Crompton Greaves
Neutral
51
-
3,178
13,484
14,687
4.9
6.2
4.5
7.1
11.3
7.1
0.8
0.7
7.2
10.8
0.4
0.3
Greaves Cotton
Neutral
127
-
3,094
1,655
1,755
16.6
16.8
7.4
7.8
17.1
16.2
3.4
3.3
21.1
20.6
1.8
1.7
Inox Wind
Buy
245
458
5,430
4,980
5,943
17.0
17.5
26.6
31.6
9.2
7.7
2.8
2.0
35.0
30.0
1.2
1.0
KEC International
Neutral
125
-
3,206
8,791
9,716
6.1
6.8
5.4
8.2
23.1
15.2
2.3
2.1
10.0
14.0
0.6
0.5
Thermax
Neutral
747
-
8,896
6,413
7,525
7.4
8.5
30.5
39.3
24.5
19.0
3.8
3.3
15.0
17.0
1.4
1.1
VATech Wabag
Neutral
545
-
2,970
2,722
3,336
7.9
8.1
19.5
24.6
27.9
22.2
2.9
2.6
11.1
12.4
1.2
1.0
Cement
ACC
Neutral
1,439
-
27,022
13,151
14,757
16.4
18.3
63.9
83.4
22.5
17.3
2.9
2.7
13.3
16.1
1.9
1.6
Ambuja Cements
Neutral
225
-
34,933
11,564
12,556
19.4
20.7
8.9
10.1
25.3
22.3
3.2
3.0
12.8
13.8
2.7
2.4
HeidelbergCement
Neutral
98
-
2,217
1,772
1,926
13.3
15.4
1.0
3.0
97.9
32.6
2.5
2.3
2.6
7.9
1.8
1.6
India Cements
Neutral
92
-
2,814
4,216
4,840
18.0
19.5
4.0
9.9
22.9
9.3
0.9
0.9
4.0
9.5
1.0
0.8
JK Cement
Neutral
664
-
4,644
3,661
4,742
10.1
15.8
7.5
28.5
88.5
23.3
2.7
2.4
7.5
22.9
1.7
1.3
J K Lakshmi Cement
Neutral
338
-
3,975
2,947
3,616
16.7
19.9
11.5
27.2
29.4
12.4
2.8
2.4
9.8
20.8
1.8
1.4
Mangalam Cements
Neutral
244
-
652
1,053
1,347
10.5
13.3
8.4
26.0
29.1
9.4
1.2
1.1
4.3
12.5
1.0
0.7
Orient Cement
Neutral
154
-
3,148
1,854
2,524
21.2
22.2
7.7
11.1
20.0
13.8
2.9
2.5
13.3
15.7
2.4
1.7
Ramco Cements
Neutral
443
-
10,541
4,036
4,545
20.8
21.3
15.1
18.8
29.3
23.6
3.6
3.2
12.9
14.3
3.1
2.7
Shree Cement^
Neutral
12,198
-
42,496
7,150
8,742
26.7
28.6
228.0
345.5
53.5
35.3
7.9
6.6
15.7
20.3
5.7
4.6
UltraTech Cement
Neutral
3,159
-
86,693
24,669
29,265
18.2
20.6
82.0
120.0
38.5
26.3
4.1
3.6
11.3
14.7
3.6
3.0
Construction
ITNL
Buy
79
93
2,605
7,360
8,825
34.0
35.9
7.0
9.0
11.3
8.8
0.4
0.4
3.2
3.7
3.7
3.6
KNR Constructions
Buy
520
603
1,463
937
1,470
14.3
14.0
44.2
38.6
11.8
13.5
2.4
2.0
15.4
15.4
1.6
1.1
Larsen & Toubro
Accumulate
1,191
1,310
110,907
58,870
65,708
8.3
10.3
42.0
53.0
28.4
22.5
2.0
1.8
8.8
11.2
2.1
1.9
Gujarat Pipavav Port
Neutral
177
-
8,567
629
684
51.0
52.2
6.4
5.9
27.7
30.0
3.7
3.4
15.9
12.7
13.3
12.0
MBL Infrastructures
Buy
156
285
645
2,313
2,797
12.2
14.6
19.0
20.0
8.2
7.8
0.9
0.8
11.3
10.6
1.0
0.9
Nagarjuna Const.
Neutral
73
-
4,044
7,892
8,842
8.8
9.1
3.0
5.3
24.3
13.7
1.2
1.1
5.0
8.5
0.8
0.6
PNC Infratech
Accumulate
529
558
2,712
1,873
2,288
13.2
13.5
24.0
32.0
22.0
16.5
2.1
1.9
12.1
12.3
1.6
1.3
Simplex Infra
Neutral
241
-
1,194
5,955
6,829
10.3
10.5
16.0
31.0
15.1
7.8
0.8
0.7
5.3
9.9
0.7
0.6
Stock Watch
April 11, 2016
Company Name
Reco
CMP
Target
Mkt Cap
Sales ( Čcr )
OPM(%)
EPS (Č)
PER(x)
P/BV(x)
RoE(%)
EV/Sales(x)
(Č)
Price ( Č)
( Č cr )
FY16E
FY17E
FY16E
FY17E
FY16E
FY17E
FY16E
FY17E
FY16E
FY17E
FY16E
FY17E
FY16E
FY17E
Construction
Power Mech Projects
Neutral
576
-
848
1,539
1,801
12.8
12.7
59.0
72.1
9.8
8.0
1.5
1.2
18.6
16.8
0.6
0.5
Sadbhav Engineering
Accumulate
272
289
4,659
3,481
4,219
10.7
10.8
8.2
11.7
33.1
23.2
3.2
2.8
10.3
13.5
1.6
1.3
NBCC
Accumulate
953
1,089
11,430
5,816
7,382
6.9
7.7
29.6
39.8
32.2
23.9
5.8
4.6
24.1
26.7
1.7
1.3
MEP Infra
Neutral
42
-
686
1,956
1,876
28.1
30.5
1.3
3.0
32.5
14.1
6.8
4.6
21.2
32.8
1.8
1.7
SIPL
Neutral
103
-
3,617
675
1,042
62.4
64.7
-
-
3.9
4.4
-
-
17.0
11.5
Engineers India
Neutral
162
-
5,470
1,667
1,725
13.5
16.0
9.7
11.4
16.7
14.2
2.0
1.9
11.7
13.4
2.1
2.1
Financials
Allahabad Bank
Neutral
54
-
3,299
8,569
9,392
2.8
2.9
16.3
27.5
3.3
2.0
0.3
0.2
7.6
11.9
-
-
Axis Bank
Buy
422
494
100,436
26,473
31,527
3.5
3.6
35.7
43.5
11.8
9.7
2.0
1.7
17.9
18.9
-
-
Bank of Baroda
Neutral
143
-
32,973
18,485
21,025
1.9
2.0
13.5
21.1
10.6
6.8
0.8
0.7
7.3
10.6
-
-
Bank of India
Neutral
91
-
7,451
15,972
17,271
1.9
2.0
15.3
33.4
6.0
2.7
0.3
0.2
3.6
7.6
-
-
Canara Bank
Neutral
183
-
9,912
15,441
16,945
2.0
2.1
46.6
70.4
3.9
2.6
0.3
0.3
8.0
11.2
-
-
Dena Bank
Neutral
29
-
1,881
3,440
3,840
2.1
2.3
7.3
10.0
4.0
2.9
0.3
0.3
6.1
7.9
-
-
Dewan Housing Finance Buy
189
270
5,506
1,892
2,277
2.9
2.9
25.9
30.8
7.3
6.1
1.1
1.0
15.3
15.9
-
-
Federal Bank
Neutral
43
-
7,430
3,477
3,999
3.0
3.0
5.0
6.2
8.6
6.9
0.9
0.8
10.6
11.9
-
-
HDFC
Neutral
1,079
-
170,473
10,358
11,852
3.3
3.3
41.1
47.0
26.3
22.9
5.0
4.5
24.7
24.9
-
-
HDFC Bank
Buy
1,059
1,262
267,684
38,309
47,302
4.3
4.3
49.3
61.1
21.5
17.3
3.7
3.2
18.5
19.7
-
-
ICICI Bank
Accumulate
221
254
128,740
34,279
39,262
3.3
3.3
21.0
24.4
10.6
9.1
1.8
1.5
14.4
14.7
-
-
IDBI Bank
Neutral
67
-
13,825
9,625
10,455
1.8
1.8
8.5
14.2
7.9
4.7
0.5
0.4
5.9
9.3
-
-
Indian Bank
Neutral
99
-
4,748
6,160
6,858
2.5
2.5
24.5
29.8
4.0
3.3
0.3
0.3
7.7
8.6
-
-
LIC Housing Finance
Buy
477
592
24,057
3,101
3,745
2.5
2.5
33.0
40.2
14.5
11.9
2.7
2.3
19.7
20.5
-
-
Oriental Bank
Neutral
87
-
2,604
7,643
8,373
2.4
2.4
37.2
45.4
2.3
1.9
0.2
0.2
8.2
9.4
-
-
Punjab Natl.Bank
Neutral
82
-
16,013
23,638
26,557
2.8
2.8
17.9
27.2
4.6
3.0
0.5
0.4
8.5
12.0
-
-
South Ind.Bank
Neutral
17
-
2,350
1,965
2,185
2.5
2.5
2.5
3.3
7.0
5.3
0.7
0.6
9.5
11.7
-
-
St Bk of India
Neutral
183
-
142,136
79,958
86,061
2.6
2.6
13.4
20.7
13.7
8.9
1.1
1.0
11.5
12.8
-
-
Union Bank
Neutral
126
-
8,648
12,646
14,129
2.3
2.4
31.0
39.1
4.1
3.2
0.4
0.4
9.8
11.4
-
-
Vijaya Bank
Neutral
31
-
2,919
3,536
3,827
1.9
1.9
5.5
6.7
5.7
4.7
0.5
0.4
7.8
8.8
-
-
Yes Bank
Neutral
850
-
35,737
7,190
9,011
3.2
3.3
58.2
69.7
14.6
12.2
2.6
2.2
19.2
19.6
-
-
FMCG
Asian Paints
Neutral
852
-
81,748
16,553
19,160
16.0
16.2
17.7
21.5
48.2
39.6
12.8
11.5
29.4
31.2
4.8
4.1
Britannia
Neutral
2,686
-
32,226
8,481
9,795
14.0
14.1
65.5
78.3
41.0
34.3
19.4
15.9
38.3
41.2
3.7
3.2
Stock Watch
April 11, 2016
Company Name
Reco
CMP
Target
Mkt Cap
Sales ( Čcr )
OPM(%)
EPS (Č)
PER(x)
P/BV(x)
RoE(%)
EV/Sales(x)
(Č)
Price ( Č)
( Č cr )
FY16E FY17E
FY16E
FY17E
FY16E
FY17E
FY16E
FY17E
FY16E
FY17E
FY16E
FY17E
FY16E
FY17E
FMCG
Colgate
Neutral
819
-
22,287
4,836
5,490
19.5
19.7
48.5
53.2
16.9
15.4
12.4
10.8
99.8
97.5
4.5
4.0
Dabur India
Accumulate
250
267
43,935
9,370
10,265
17.1
17.2
7.3
8.1
34.1
30.8
10.3
8.4
33.7
30.6
4.6
4.2
GlaxoSmith Con*
Neutral
5,981
-
25,154
4,919
5,742
17.2
17.4
168.3
191.2
35.5
31.3
10.1
8.6
28.8
28.9
4.7
4.0
Godrej Consumer
Neutral
1,374
-
46,781
10,168
12,886
16.1
16.1
32.1
38.4
42.8
35.8
8.7
8.0
19.7
21.0
4.7
3.7
HUL
Neutral
850
-
183,935
34,940
38,957
17.5
17.7
20.8
24.7
40.9
34.4
45.5
36.3
110.5
114.2
5.1
4.5
ITC
Accumulate
321
359
258,597
36,804
38,776
37.9
37.9
12.2
12.9
26.3
24.9
7.3
6.4
27.7
25.8
6.6
6.3
Marico
Neutral
252
-
32,538
6,551
7,766
15.7
16.0
10.4
12.5
24.3
20.2
7.1
5.9
33.2
32.4
4.9
4.1
Nestle*
Accumulate
5,962
6,646
57,486
11,291
12,847
22.2
22.3
158.9
184.6
37.5
32.3
19.6
17.6
55.0
57.3
4.9
4.3
Tata Global
Buy
118
144
7,428
8,635
9,072
9.8
9.9
6.5
7.6
18.1
15.5
1.8
1.7
6.8
7.4
0.8
0.8
IT
HCL Tech^
Buy
832
1,038
117,301
42,038
47,503
21.2
21.5
51.5
57.7
16.2
14.4
3.5
2.7
21.5
18.8
2.4
1.9
Infosys
Buy
1,167
1,347
269,009
61,850
69,981
27.5
27.5
59.4
65.7
19.7
17.8
4.2
3.6
21.2
20.1
3.6
3.1
TCS
Buy
2,429
2,854
478,558
108,487
122,590
28.3
28.5
122.8
138.4
19.8
17.6
7.5
6.8
38.0
38.9
4.0
3.5
Tech Mahindra
Buy
456
530
44,127
26,524
29,177
16.2
17.0
28.8
33.6
15.8
13.6
3.1
2.6
19.3
19.1
1.4
1.2
Wipro
Buy
547
680
135,123
50,808
56,189
23.7
23.8
37.3
40.7
14.7
13.4
2.8
2.6
19.2
17.7
2.1
1.8
Media
D B Corp
Buy
309
356
5,678
2,241
2,495
27.8
27.9
21.8
25.6
14.2
12.1
3.7
3.3
26.7
28.5
2.5
2.2
HT Media
Neutral
76
-
1,769
2,495
2,603
11.2
11.2
7.3
8.6
10.4
8.8
0.8
0.7
7.4
8.1
0.2
0.2
Jagran Prakashan
Buy
157
189
5,129
2,170
2,355
27.2
26.2
8.9
9.9
17.6
15.9
3.7
3.2
20.9
20.5
2.3
2.1
Sun TV Network
Neutral
356
-
14,025
2,779
3,196
70.2
70.5
22.8
27.3
15.6
13.0
3.9
3.5
26.7
28.3
4.8
4.2
Hindustan Media
Neutral
250
-
1,836
920
1,031
20.0
20.0
19.2
20.9
13.0
12.0
2.1
1.8
16.4
15.3
1.5
1.3
Ventures
Metals & Mining
Coal India
Buy
281
380
177,174
76,167
84,130
19.9
22.3
22.4
25.8
12.5
10.9
4.5
4.4
35.5
41.0
1.7
1.5
Hind. Zinc
Accumulate
160
175
67,690
14,641
14,026
50.4
50.4
17.7
16.0
9.1
10.0
1.4
1.3
16.2
13.2
2.2
2.1
Hindalco
Neutral
88
-
18,141
104,356
111,186
8.7
9.5
6.7
11.1
13.1
7.9
0.5
0.5
3.5
5.9
0.7
0.6
JSW Steel
Neutral
1,273
-
30,781
42,308
45,147
16.4
20.7
(10.3)
49.5
25.7
1.4
1.4
(1.0)
5.6
1.8
1.7
NMDC
Neutral
102
-
40,420
8,237
10,893
46.6
44.5
10.0
11.7
10.3
8.7
1.1
1.0
12.5
13.0
4.7
3.6
SAIL
Neutral
43
-
17,615
45,915
53,954
7.2
10.5
1.5
4.4
28.3
9.7
0.4
0.4
2.3
4.1
1.0
0.9
Vedanta
Neutral
87
-
25,926
71,445
81,910
26.2
26.3
12.9
19.2
6.8
4.6
0.5
0.4
7.2
8.9
0.8
0.6
Tata Steel
Neutral
322
-
31,297
126,760
137,307
8.9
11.3
6.4
23.1
50.7
14.0
1.0
1.0
2.0
7.1
0.8
0.8
Oil & Gas
Cairn India
Neutral
149
-
27,917
11,323
12,490
49.4
51.0
20.7
20.7
7.2
7.2
0.5
0.4
6.4
6.1
1.5
0.9
GAIL
Neutral
348
-
44,156
64,856
70,933
9.1
9.6
24.0
28.9
14.5
12.1
1.2
1.2
8.8
9.6
0.9
0.8
Stock Watch
April 11, 2016
Company Name
Reco
CMP
Target
Mkt Cap
Sales ( Čcr )
OPM(%)
EPS (Č)
PER(x)
P/BV(x)
RoE(%)
EV/Sales(x)
(Č)
Price ( Č)
( Č cr )
FY16E FY17E
FY16E
FY17E
FY16E
FY17E
FY16E
FY17E
FY16E
FY17E
FY16E
FY17E
FY16E
FY17E
Oil & Gas
ONGC
Neutral
206
-
176,286
154,564
167,321
36.8
37.4
28.6
32.5
7.2
6.3
0.9
0.8
12.7
13.5
1.3
1.3
Petronet LNG
Neutral
240
-
18,008
29,691
31,188
5.8
6.2
12.8
13.4
18.8
17.9
2.8
2.5
15.8
14.8
0.7
0.6
Indian Oil Corp
Accumulate
413
455
100,189
359,607
402,760
5.9
6.1
42.5
48.7
9.7
8.5
1.3
1.2
14.1
14.4
0.4
0.3
Reliance Industries
Accumulate
1,038
1,150
336,302
304,775
344,392
12.6
13.4
91.3
102.6
11.4
10.1
1.3
1.2
11.8
12.0
1.0
0.9
Pharmaceuticals
Alembic Pharma
Neutral
553
-
10,423
3,274
3,802
26.9
19.4
35.0
28.7
15.8
19.3
7.0
5.3
55.6
31.2
3.2
2.6
Aurobindo Pharma
Accumulate
757
856
44,324
14,923
17,162
22.0
23.0
35.7
42.8
21.2
17.7
6.2
4.7
34.0
30.2
3.3
2.9
Aventis*
Neutral
4,363
-
10,047
2,082
2,371
17.4
20.8
118.2
151.5
36.9
28.8
5.4
4.3
19.9
25.5
4.5
3.7
Cadila Healthcare
Accumulate
321
352
32,826
10,224
11,840
21.0
22.0
14.6
17.6
22.0
18.2
6.0
4.7
30.8
29.0
3.3
2.7
Cipla
Buy
506
605
40,615
13,979
16,447
20.2
18.6
25.7
27.5
19.7
18.4
3.2
2.8
17.6
16.1
2.9
2.4
Dr Reddy's
Buy
3,036
3,933
51,771
16,838
19,575
25.0
23.1
167.5
178.8
18.1
17.0
3.8
3.2
23.1
20.4
3.0
2.5
Dishman Pharma
Neutral
333
-
2,688
1,733
1,906
21.5
21.5
17.0
19.9
19.6
16.7
2.0
1.8
10.5
11.2
2.1
1.8
GSK Pharma*
Neutral
3,680
-
31,169
2,870
3,158
20.0
22.1
59.5
68.3
61.8
53.9
18.2
18.8
28.5
34.3
10.4
9.5
Indoco Remedies
Neutral
273
-
2,516
1,033
1,199
15.9
18.2
9.4
13.6
29.0
20.1
4.3
3.7
15.7
19.7
2.5
2.2
Ipca labs
Buy
499
900
6,300
3,363
3,909
12.9
18.6
13.4
28.0
37.3
17.8
2.7
2.3
7.4
14.0
2.2
1.9
Lupin
Neutral
1,541
-
69,424
13,092
16,561
25.0
27.0
50.4
68.3
30.6
22.6
6.3
5.0
22.8
24.7
5.0
3.8
Sun Pharma
Buy
812
950
195,373
28,163
32,610
25.8
30.7
17.4
26.9
46.7
30.2
4.4
3.8
13.0
16.6
6.4
5.3
Power
Tata Power
Neutral
66
-
17,796
35,923
37,402
22.6
22.8
4.1
5.2
16.2
12.8
1.2
1.2
7.5
9.3
1.4
1.3
NTPC
Accumulate
132
146
108,469
87,271
99,297
23.5
23.5
11.8
13.3
11.2
9.9
1.3
1.2
11.5
12.2
2.3
2.0
Power Grid
Buy
141
170
73,713
20,702
23,361
86.7
86.4
12.1
13.2
11.7
10.7
1.7
1.5
15.6
15.1
8.5
7.9
Real Estate
MLIFE
Buy
445
554
1,826
697
1,011
14.9
19.3
13.8
20.1
32.3
22.1
1.2
1.2
3.8
5.3
3.9
2.7
Telecom
Bharti Airtel
Neutral
334
-
133,633
101,748
109,191
32.1
31.7
12.0
12.5
27.9
26.7
1.9
1.8
6.9
6.7
1.9
1.8
Idea Cellular
Neutral
109
-
39,210
34,282
36,941
32.0
31.5
5.9
6.2
18.5
17.6
1.7
1.5
9.9
9.3
1.7
1.6
zOthers
Abbott India
Neutral
4,659
-
9,901
2,715
3,153
14.5
14.1
134.3
152.2
34.7
30.6
8.7
7.1
27.4
25.6
3.4
2.8
Bajaj Electricals
Accumulate
214
237
2,162
4,719
5,287
5.2
5.8
8.6
12.7
25.0
16.9
2.9
2.5
11.4
14.8
0.5
0.4
Finolex Cables
Neutral
281
-
4,304
2,520
2,883
12.2
12.0
12.7
14.2
22.2
19.8
3.0
2.7
13.6
13.5
1.5
1.2
Goodyear India*
Buy
491
582
1,133
1,800
1,600
11.7
11.5
58.7
52.9
8.4
9.3
1.9
1.6
24.6
18.7
0.4
0.4
Hitachi
Neutral
1,175
-
3,194
1,779
2,081
7.8
8.8
21.8
33.4
53.9
35.1
8.7
7.0
17.4
22.1
1.9
1.6
Jyothy Laboratories
Neutral
298
-
5,397
1,620
1,847
11.5
11.5
7.3
8.5
40.9
35.2
5.3
4.9
13.3
14.4
3.2
2.7
MRF
Buy
35,460
45,575
15,039
20,316
14,488
21.4
21.1
5,488.0
3,798.0
6.5
9.3
2.2
1.8
41.1
21.2
0.7
0.9
Stock Watch
April 11, 2016
Company Name
Reco
CMP
Target
Mkt Cap
Sales ( Čcr )
OPM(%)
EPS (Č)
PER(x)
P/BV(x)
RoE(%)
EV/Sales(x)
(Č)
Price ( Č)
( Č cr )
FY16E
FY17E
FY16E
FY17E
FY16E
FY17E
FY16E
FY17E
FY16E
FY17E
FY16E
FY17E
FY16E
FY17E
zOthers
Page Industries
Neutral
12,833
-
14,314
1,929
2,450
19.8
20.1
229.9
299.0
55.8
42.9
24.6
17.1
52.1
47.1
7.5
5.8
Relaxo Footwears
Neutral
471
-
5,651
1,767
2,152
12.3
12.5
19.3
25.1
24.5
18.8
6.0
4.6
27.7
27.8
3.3
2.6
Siyaram Silk Mills
Buy
1,002
1,354
939
1,636
1,815
11.5
11.5
89.9
104.1
11.1
9.6
1.8
1.6
17.9
17.8
0.7
0.7
Styrolution ABS India* Neutral
577
-
1,015
1,271
1,440
8.6
9.2
32.0
41.1
18.0
14.1
1.8
1.7
10.7
12.4
0.8
0.7
TVS Srichakra
Buy
2,496
3,217
1,911
2,035
2,252
15.9
15.3
248.6
268.1
10.0
9.3
4.4
3.2
43.6
33.9
1.0
0.8
HSIL
Neutral
299
-
2,160
2,123
2,384
16.1
16.5
15.0
18.9
19.9
15.8
1.5
1.4
8.0
9.4
1.4
1.2
Kirloskar Engines India
Neutral
236
-
3,406
2,403
2,554
8.6
9.9
9.2
10.5
25.6
22.5
2.5
2.4
9.7
10.7
1.1
1.0
Ltd
M M Forgings
Buy
450
614
543
511
615
21.7
21.6
43.1
55.8
10.4
8.1
1.9
1.6
19.9
21.2
1.3
1.0
Banco Products (India) Neutral
113
-
805
1,208
1,353
11.0
12.3
10.8
14.5
10.4
7.8
1.2
1.1
11.9
14.5
0.6
0.5
Competent Automobiles Neutral
145
-
89
1,040
1,137
3.2
3.1
25.7
28.0
5.6
5.2
0.8
0.7
15.0
14.3
0.1
0.1
Nilkamal
Neutral
1,275
-
1,903
1,871
2,031
10.7
10.5
63.2
69.8
20.2
18.3
3.3
2.8
17.6
16.6
1.1
0.9
Visaka Industries
Buy
115
144
183
1,086
1,197
9.9
10.3
21.5
28.8
5.4
4.0
0.5
0.5
9.6
11.6
0.4
0.3
Transport Corporation of
Neutral
274
-
2,084
2,830
3,350
8.8
9.0
14.4
18.3
19.1
15.0
2.9
2.6
15.4
17.1
0.9
0.7
India
Elecon Engineering
Neutral
62
-
676
1,359
1,482
10.3
13.7
0.8
3.9
77.3
15.9
1.3
1.2
1.6
7.8
0.9
0.8
Surya Roshni
Buy
143
201
628
2,992
3,223
8.1
8.4
14.7
18.3
9.8
7.8
0.9
0.8
9.7
11.0
0.5
0.5
MT Educare
Neutral
175
-
695
286
366
18.3
17.7
7.7
9.4
22.6
18.6
4.8
4.2
20.2
21.1
2.3
1.8
Radico Khaitan
Buy
95
156
1,261
1,517
1,635
12.7
13.4
5.8
7.1
16.3
13.3
1.4
1.3
8.6
9.6
1.3
1.2
Garware Wall Ropes
Buy
330
473
722
862
974
11.2
11.2
24.9
29.6
13.3
11.2
2.0
1.7
15.1
15.4
0.8
0.7
Wonderla Holidays
Neutral
376
-
2,123
206
308
44.0
43.6
9.0
12.9
41.8
29.1
5.7
5.2
13.7
17.8
10.2
6.8
Linc Pen & Plastics
Neutral
190
-
281
340
371
8.3
8.9
10.8
13.2
17.6
14.4
2.8
2.5
16.0
17.1
0.9
0.8
The Byke Hospitality
Neutral
154
-
618
222
287
20.5
20.5
5.6
7.6
27.3
20.4
5.2
4.2
18.9
20.8
2.8
2.2
Interglobe Aviation
Neutral
954
-
34,389
17,022
21,122
20.7
14.5
63.9
53.7
14.9
17.8
22.4
18.3
149.9
103.2
2.1
1.6
Coffee Day Enterprises
Neutral
235
-
4,834
2,692
2,964
17.0
18.6
-
4.7
-
49.5
2.9
2.7
0.2
5.5
2.2
2.0
Ltd
Navneet Education
Neutral
84
-
2,009
998
1,062
24.1
24.0
5.8
6.1
14.7
13.9
3.2
2.9
22.0
20.6
2.1
2.0
Navkar Corporation
Buy
179
265
2,553
365
436
38.3
37.5
5.6
5.9
31.8
30.5
2.0
1.9
6.3
6.1
7.8
6.7
UFO Moviez
Neutral
470
-
1,292
558
619
32.0
33.2
22.5
30.0
20.9
15.7
2.5
2.2
12.0
13.8
2.2
1.8
VRL Logistics
Neutral
379
-
3,455
1,725
1,902
16.5
16.7
12.2
14.6
31.1
26.0
6.5
5.7
20.8
21.9
2.2
1.9
Team Lease Serv.
Neutral
881
-
1,506
2,565
3,229
1.3
1.5
15.2
22.8
58.0
38.7
4.6
4.1
8.0
10.7
0.5
0.4
S H Kelkar & Co.
Neutral
236
-
3,410
928
1,036
15.3
15.1
4.9
6.1
47.8
38.6
4.5
4.1
9.4
10.7
3.6
3.2
Stock Watch
April 11, 2016
Company Name
Reco
CMP
Target Mkt Cap
Sales ( Čcr )
OPM(%)
EPS (Č)
PER(x)
P/BV(x)
RoE(%)
EV/Sales(x)
(Č)
Price ( Č)
( Č cr )
FY16E FY17E FY16E FY17E FY16E FY17E FY16E FY17E FY16E FY17E FY16E FY17E FY16E FY17E
zOthers
Quick Heal
Neutral
215
-
1,508
339
408
27.8
27.3
7.1
7.7
30.5
27.8
2.6
2.6
8.5
9.3
3.4
2.8
Narayana Hrudaya
Neutral
295
-
6,018
1,603
1,873
10.9
11.5
1.0
2.6
309.1
111.3
7.4
6.8
2.4
6.1
3.9
3.3
Manpasand Bever.
Neutral
458
-
2,291
540
836
19.9
19.6
10.2
16.9
44.7
27.1
3.6
3.3
8.1
12.0
3.9
2.5
Source: Company, Angel Research; Note: *December year end; #September year end; &October year end; Price as on April 08, 2016
Market Outlook
April 11, 2016
Research Team Tel: 022 - 39357800
DISCLAIMER
Angel Broking Private Limited (hereinafter referred to as “Angel”) is a registered Member of National Stock Exchange of India Limited,
Bombay Stock Exchange Limited and Metropolitian Stock Exchange of India Limited. It is also registered as a Depository Participant with
CDSL and Portfolio Manager with SEBI. It also has registration with AMFI as a Mutual Fund Distributor. Angel Broking Private Limited is a
registered entity with SEBI for Research Analyst in terms of SEBI (Research Analyst) Regulations, 2014 vide registration number
INH000000164. Angel or its associates has not been debarred/ suspended by SEBI or any other regulatory authority for accessing
/dealing in securities Market. Angel or its associates including its relatives/analyst do not hold any financial interest/beneficial ownership
of more than 1% in the company covered by Analyst. Angel or its associates/analyst has not received any compensation / managed or co
-managed public offering of securities of the company covered by Analyst during the past twelve months. Angel/analyst has not served as
an officer, director or employee of company covered by Analyst and has not been engaged in market making activity of the company
covered by Analyst.
This document is solely for the personal information of the recipient, and must not be singularly used as the basis of any investment
decision. Nothing in this document should be construed as investment or financial advice. Each recipient of this document should make
such investigations as they deem necessary to arrive at an independent evaluation of an investment in the securities of the companies
referred to in this document (including the merits and risks involved), and should consult their own advisors to determine the merits and
risks of such an investment.
Reports based on technical and derivative analysis center on studying charts of a stock's price movement, outstanding positions and
trading volume, as opposed to focusing on a company's fundamentals and, as such, may not match with a report on a company's
fundamentals.
The information in this document has been printed on the basis of publicly available information, internal data and other reliable sources
believed to be true, but we do not represent that it is accurate or complete and it should not be relied on as such, as this document is for
general guidance only. Angel Broking Pvt. Limited or any of its affiliates/ group companies shall not be in any way responsible for any
loss or damage that may arise to any person from any inadvertent error in the information contained in this report. Angel Broking Pvt.
Limited has not independently verified all the information contained within this document. Accordingly, we cannot testify, nor make any
representation or warranty, express or implied, to the accuracy, contents or data contained within this document. While Angel Broking
Pvt. Limited endeavors to update on a reasonable basis the information discussed in this material, there may be regulatory, compliance,
or other reasons that prevent us from doing so.
This document is being supplied to you solely for your information, and its contents, information or data may not be reproduced,
redistributed or passed on, directly or indirectly.
Neither Angel Broking Pvt. Limited, nor its directors, employees or affiliates shall be liable for any loss or damage that may arise from or
in connection with the use of this information.
Note: Please refer to the important ‘Stock Holding Disclosure' report on the Angel website (Research Section). Also, please refer to the
latest update on respective stocks for the disclosure status in respect of those stocks. Angel Broking Pvt. Limited and its affiliates may have
investment positions in the stocks recommended in this report.