Market Outlook
September 10, 2015
Dealer’s Diary
Domestic Indices
Chg (%)
(Pts)
(Close)
BSE Sensex
1.6
402
25,720
Indian markets are expected to open on a negative note tracking the SGX Nifty and
global markets.
Nifty
1.7
130
7,819
MID CAP
1.9
199
10,434
After initially registering sharp rise, the US market pulled back and ended in the
SMALL CAP
1.8
193
10,675
negative zone as traders were unwilling to partake in buying owing to lack of major
BSE HC
0.5
79
16,902
economic data release.
BSE PSU
1.8
120
6,648
The European markets ended Wednesday’s session in the green with markets
BANKEX
1.7
317
19,019
feeding off on strong rally in the Asian markets. The markets reversed from their
AUTO
2.9
499
17,576
respective intraday highs after UK’s industrial production dropped 0.4% in July.
METAL
3.5
252
7,366
The Indian markets rose strongly on Wednesday, mainly on the back of positive
OIL & GAS
1.4
121
8,663
movement across global markets. The surge in world stock markets amid signs of
BSE IT
1.4
151
11,062
stability in China spurred gains in rupee for the second consecutive session
Global Indices
Chg (%)
(Pts)
(Close)
Dow Jones
(1.4)
(239)
16,254
News & Result Analysis
NASDAQ
(1.2)
(55)
4,757
Cabinet clears gold bond, monetisation schemes
Refer detailed news analysis on the following page
FTSE
1.3
83
6,229
Nikkei
7.7
1,343
18,771
Markets Today
Hang Sang
4.1
872
22,131
The trend deciding level for the day is 25,698 / 7,810 levels. If NIFTY trades above
Straits Times
1.5
43
2,928
this level during the first half-an-hour of trade then we may witness a further rally up
Shanghai Com
2.3
73
3,243
to 25,842 - 25,965 / 7,855 - 7,891 levels. However, if NIFTY trades below
25,698 / 7,810 levels for the first half-an-hour of trade then it may correct towards
Indian ADR
Chg (%)
(Pts)
(Close)
25,575 - 25,431 / 7,773 - 7,728 levels
INFY
(1.0)
(0.2)
$17.3
Indices
S2
S1
PIVOT
R1
R2
WIT
(2.4)
(0.3)
$11.5
SENSEX
25,431
25,575
25,698
25,842
25,965
IBN
(0.4)
(0.0)
$8.4
NIFTY
7,728
7,773
7,810
7,855
7,891
HDB
(0.0)
(0.0)
$56.9
Net Inflows (September 08, 2015)
Advances / Declines
BSE
NSE
` cr
Purch
Sales
Net
MTD
YTD
Advances
1,982
1,245
FII
2,970
3,604
(635)
(5,096)
118,664
Declines
728
284
MFs
1,107
520
587
3,149
73,797
Unchanged
101
49
FII Derivatives (September 09, 2015)
Volumes (` cr)
` cr
Purch
Sales
Net
Open Interest
Index Futures
3,630
3,241
389
21,528
BSE
2,953
Stock Futures
3,370
2,354
1,016
45,667
NSE
17,185
Gainers / Losers
Gainer
Loser
Company
Price (`)
chg (%)
Company
Price (`)
chg (%)
GITANJALI
38
11.9
SUNASIAN
156
(5.0)
MARUTI
62
11.6
PMCFIN
2
(4.9)
AMTEKAUTO
30
11.3
MANAPPURAM
21
(4.1)
MCLEODRUSS
167
10.0
TORNTPHARM
1,490
(3.4)
NMDC
104
9.2
DBCORP
302
(3.3)
Market Outlook
September 10, 2015
Cabinet clears gold bond, monetisation schemes
The Cabinet approved Gold Bond and Gold Monetisation schemes to reduce the
metal's demand in physical form and fish out idle gold lying with households and
other entities. The Gold Bond scheme will have an annual cap of 500 grams per
person and such bonds would be issued for a period of 5-7 years. People holding
idle gold can deposit it in banks for either short, medium or long term. This would
result in idle gold moving into the system for more effective use and could reduce
imports.
Economic and Political News
Govt clears deck for spectrum trading
Cabinet clears gold bond, monetization schemes
Fragile PSBs to merge with strong peers if worries persist: FM
Corporate News
TVS Motor and Sundaram Clayton together to invest `800 cr
Adani, HCL, MRF, ITC and others commit over `30,000 cr in Tamil Nadu
RINL's sales volume, exports grow in August
Market Outlook
September 10, 2015
Top Picks
Large Cap
Market Cap
CMP
Target
Upside
Company
Sector
Rating
(` Cr)
(`)
(`)
(%)
Aurobindo
Pharma
41,797
Buy
716
872
21.8
Axis Bank
Financials
1,15,498
Buy
486
701
44.3
ICICI Bank
Financials
1,53,506
Buy
264
370
39.9
Infosys
IT
2,50,022
Buy
1,089
1,306
20.0
Inox Wind
Capital Goods
8,707
Buy
392
505
28.7
LIC HFL
Financials
21,607
Buy
428
570
33.1
Power Grid
Power
65,918
Buy
126
170
34.9
TCS
IT
4,99,603
Buy
2,551
3,168
24.2
Tech Mahindra IT
51,221
Buy
533
646
21.3
Yes Bank
Financials
29,940
Buy
716
953
33.2
Sun Pharma
Pharma
2,02,141 Accumulate
840
950
13.1
Source: Angel Research, Bloomberg
Mid Cap
Market Cap
CMP
Target
Upside
Company
Sector
Rating
(` Cr)
(`)
(`)
(%)
Bajaj Electricals
Others
2,473
Buy
245
341
39.1
Garware Wall RopesOthers
613
Buy
280
390
39.2
JK Tyre
Auto Ancillary
2,335
Buy
103
129
25.3
MBL Infrastructures Construction
1,011
Buy
244
360
47.7
Minda Industries
Auto Ancillary
806
Buy
508
652
28.3
MT Educare
Others
500
Buy
126
169
34.6
Radico Khaitan
Others
1,163
Buy
87
112
28.1
Surya Roshni
Others
513
Buy
117
183
56.2
Tree House
Others
1,629
Buy
385
449
16.6
Source: Angel Research, Bloomberg
Market Outlook
September 10, 2015
Global economic events release calendar
Date
Time
Country Event Description
Unit
Period
Bloomberg Data
Last Reported Estimated
September 10, 2015
6:00PM
US
Initial Jobless claims
Thousands
Sep 5
282.00
275.00
September 11, 2015
India
Imports YoY%
% Change
Aug
(10.28)
--
India
Exports YoY%
% Change
Aug
(10.30)
--
September 10, 2015
7:00AM
China
Consumer Price Index (YoY)
% Change
Aug
1.60
1.80
4:30PM
UK
BOE Announces rates
% Ratio
Sep 10
0.50
0.50
September 11, 2015
5:30PM
India
Industrial Production YoY
% Change
Jul
3.80
3.60
September 13, 2015
11:00AM
China
Industrial Production (YoY)
% Change
Aug
6.00
6.30
September 14, 2015
12:00PM
India
Monthly Wholesale Prices YoY%
% Change
Aug
(4.05)
(4.40)
September 15, 2015
6:45PM
US
Industrial Production
%
Aug
0.56
(0.20)
2:00PM
UK
CPI (YoY)
% Change
Aug
0.10
--
September 16, 2015
2:00PM
UK
Jobless claims change
% Change
Aug
(4.90)
--
2:30PM
Euro Zone Euro-Zone CPI (YoY)
%
Aug F
0.20
--
6:00PM
US
Consumer price index (mom)
% Change
Aug
0.10
--
September 17, 2015
6:00PM
US
Building permits
Thousands
Aug
1,130.00
1,135.00
6:00PM
US
Housing Starts
Thousands
Aug
1,206.00
1,145.00
11:30PM
US
FOMC rate decision
%
Sep 17
0.25
0.50
September 21, 2015
7:30PM
US
Existing home sales
Million
Aug
5.59
--
September 22, 2015
7:30PM
Euro Zone Euro-Zone Consumer Confidence
Value
Sep A
(6.90)
--
September 23, 2015
1:00PM
Germany PMI Services
Value
Sep P
54.90
--
1:00PM
Germany PMI Manufacturing
Value
Sep P
53.30
--
September 24, 2015
7:30PM
US
New home sales
Thousands
Aug
507.00
--
September 25, 2015
6:00PM
US
GDP Qoq (Annualised)
% Change
2Q T
3.70
--
September 29, 2015
7:30PM
US
Consumer Confidence
S.A./ 1985=100
Sep
101.54
--
11:00AM
India
RBI Reverse Repo rate
%
Sep 29
6.25
--
11:00AM
India
RBI Repo rate
%
Sep 29
7.25
--
11:00AM
India
RBI Cash Reserve ratio
%
Sep 29
4.00
--
September 30, 2015
1:25PM
Germany Unemployment change (000's)
Thousands
Sep
(7.00)
--
2:00PM
UK
GDP (YoY)
% Change
2Q F
2.60
--
October 1, 2015
6:30AM
China
PMI Manufacturing
Value
Sep
49.70
--
2:00PM
UK
PMI Manufacturing
Value
Sep
51.50
--
October 2, 2015
6:00PM
US
Change in Nonfarm payrolls
Thousands
Sep
173.00
--
6:00PM
US
Unnemployment rate
%
Sep
5.10
--
6:00PM
US
Unnemployment rate
%
Sep
5.10
--
Source: Bloomberg, Angel Research
Market Outlook
September 10, 2015
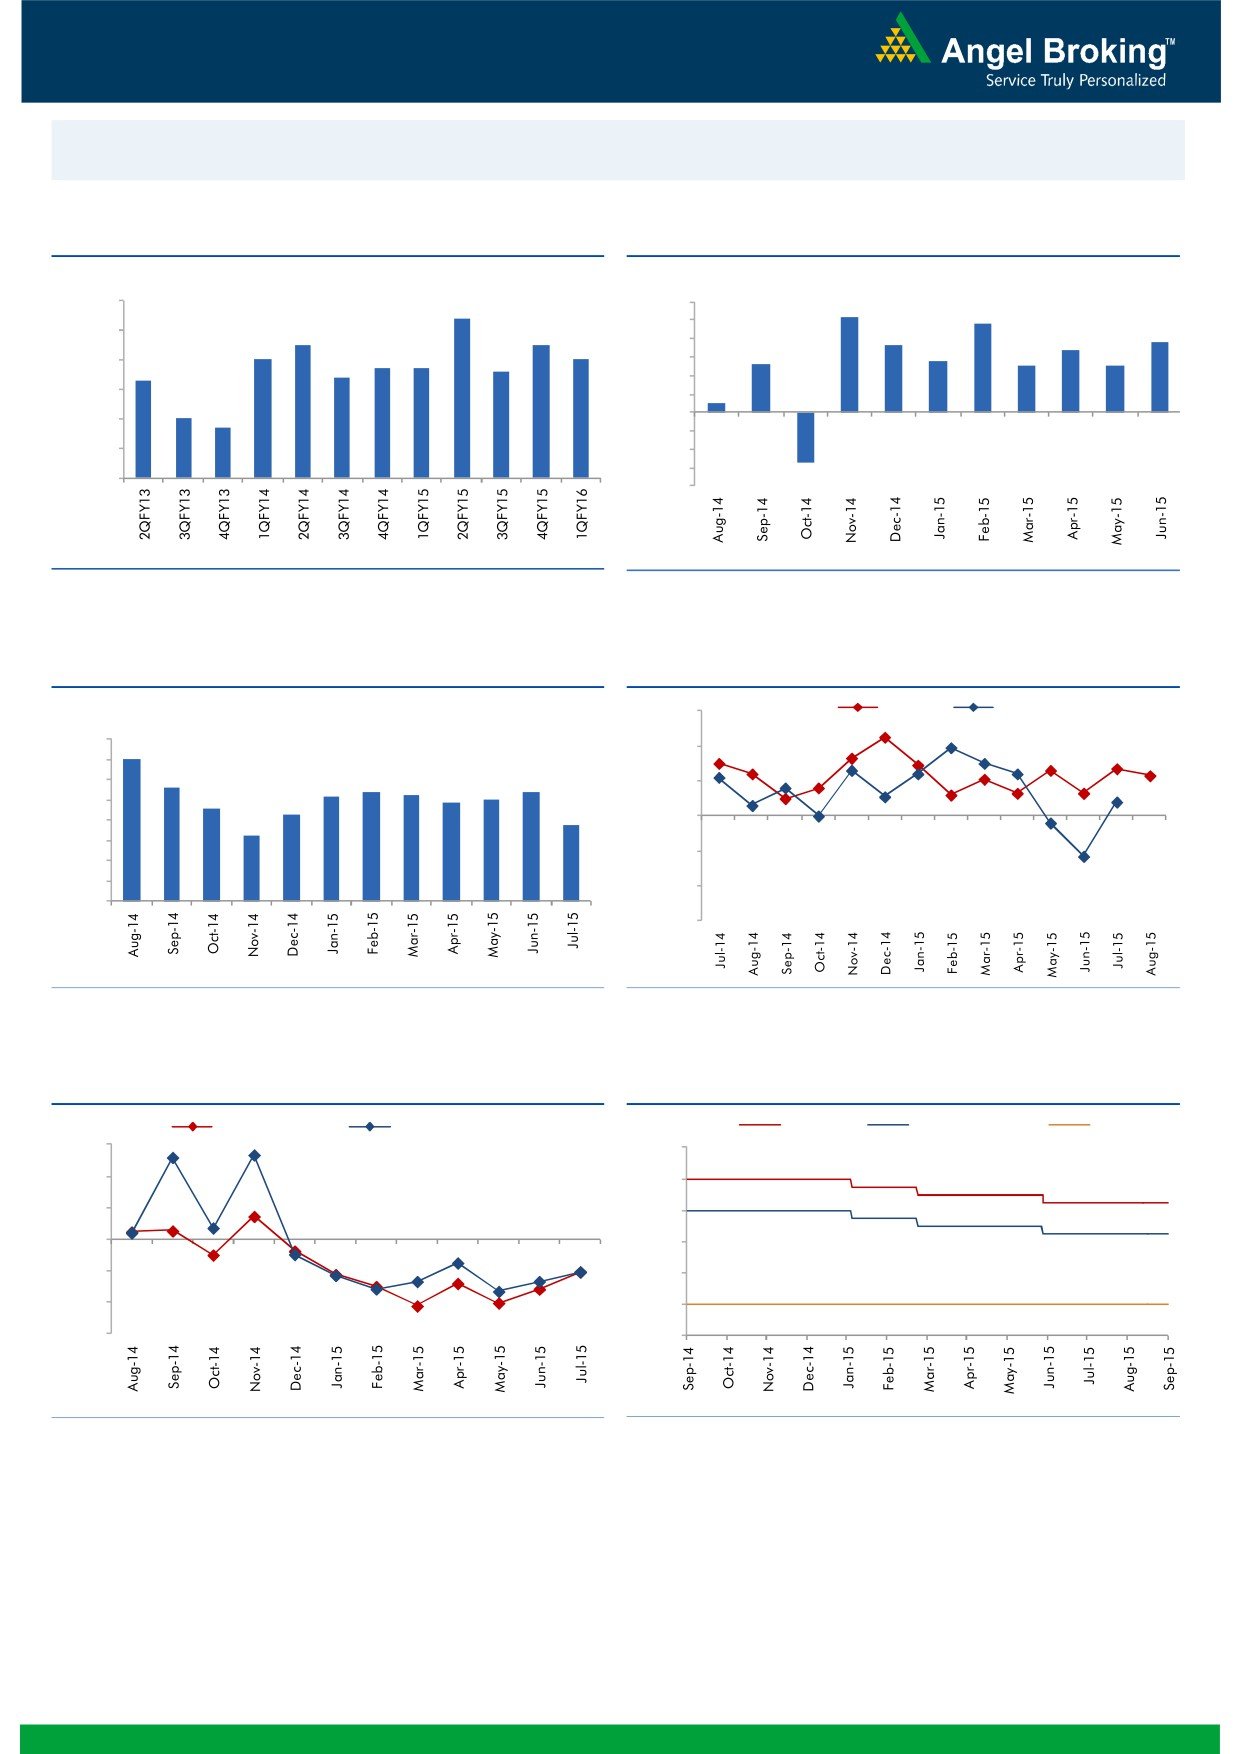
Macro watch
Exhibit 1: Quarterly GDP trends
Exhibit 2: IIP trends
(%)
(%)
9.0
8.4
6.0
5.2
4.8
7.5
7.5
5.0
3.8
8.0
3.6
3.4
7.0
7.0
4.0
2.8
6.7
6.7
2.6
2.5
2.5
7.0
6.3
6.4
6.6
3.0
2.0
6.0
0.5
1.0
5.0
4.7
-
5.0
(1.0)
4.0
(2.0)
(3.0)
3.0
(2.7)
(4.0)
Source: CSO, Angel Research
Source: MOSPI, Angel Research
Exhibit 3: Monthly CPI inflation trends
Exhibit 4: Manufacturing and services PMI
(%)
56.0
Mfg. PMI
Services PMI
8.0
7.0
54.0
7.0
5.6
5.4
6.0
5.2
5.4
5.3
5.0
52.0
4.6
4.9
5.0
4.3
3.8
4.0
3.3
50.0
3.0
48.0
2.0
1.0
46.0
-
44.0
Source: MOSPI, Angel Research
Source: Market, Angel Research; Note: Level above 50 indicates expansion
Exhibit 5: Exports and imports growth trends
Exhibit 6: Key policy rates
(%)
Exports yoy growth
Imports yoy growth
(%)
Repo rate
Reverse Repo rate
CRR
30.0
9.00
20.0
8.00
10.0
7.00
0.0
6.00
(10.0)
5.00
(20.0)
4.00
(30.0)
3.00
Source: Bloomberg, Angel Research
Source: RBI, Angel Research
Market Outlook
September 10, 2015
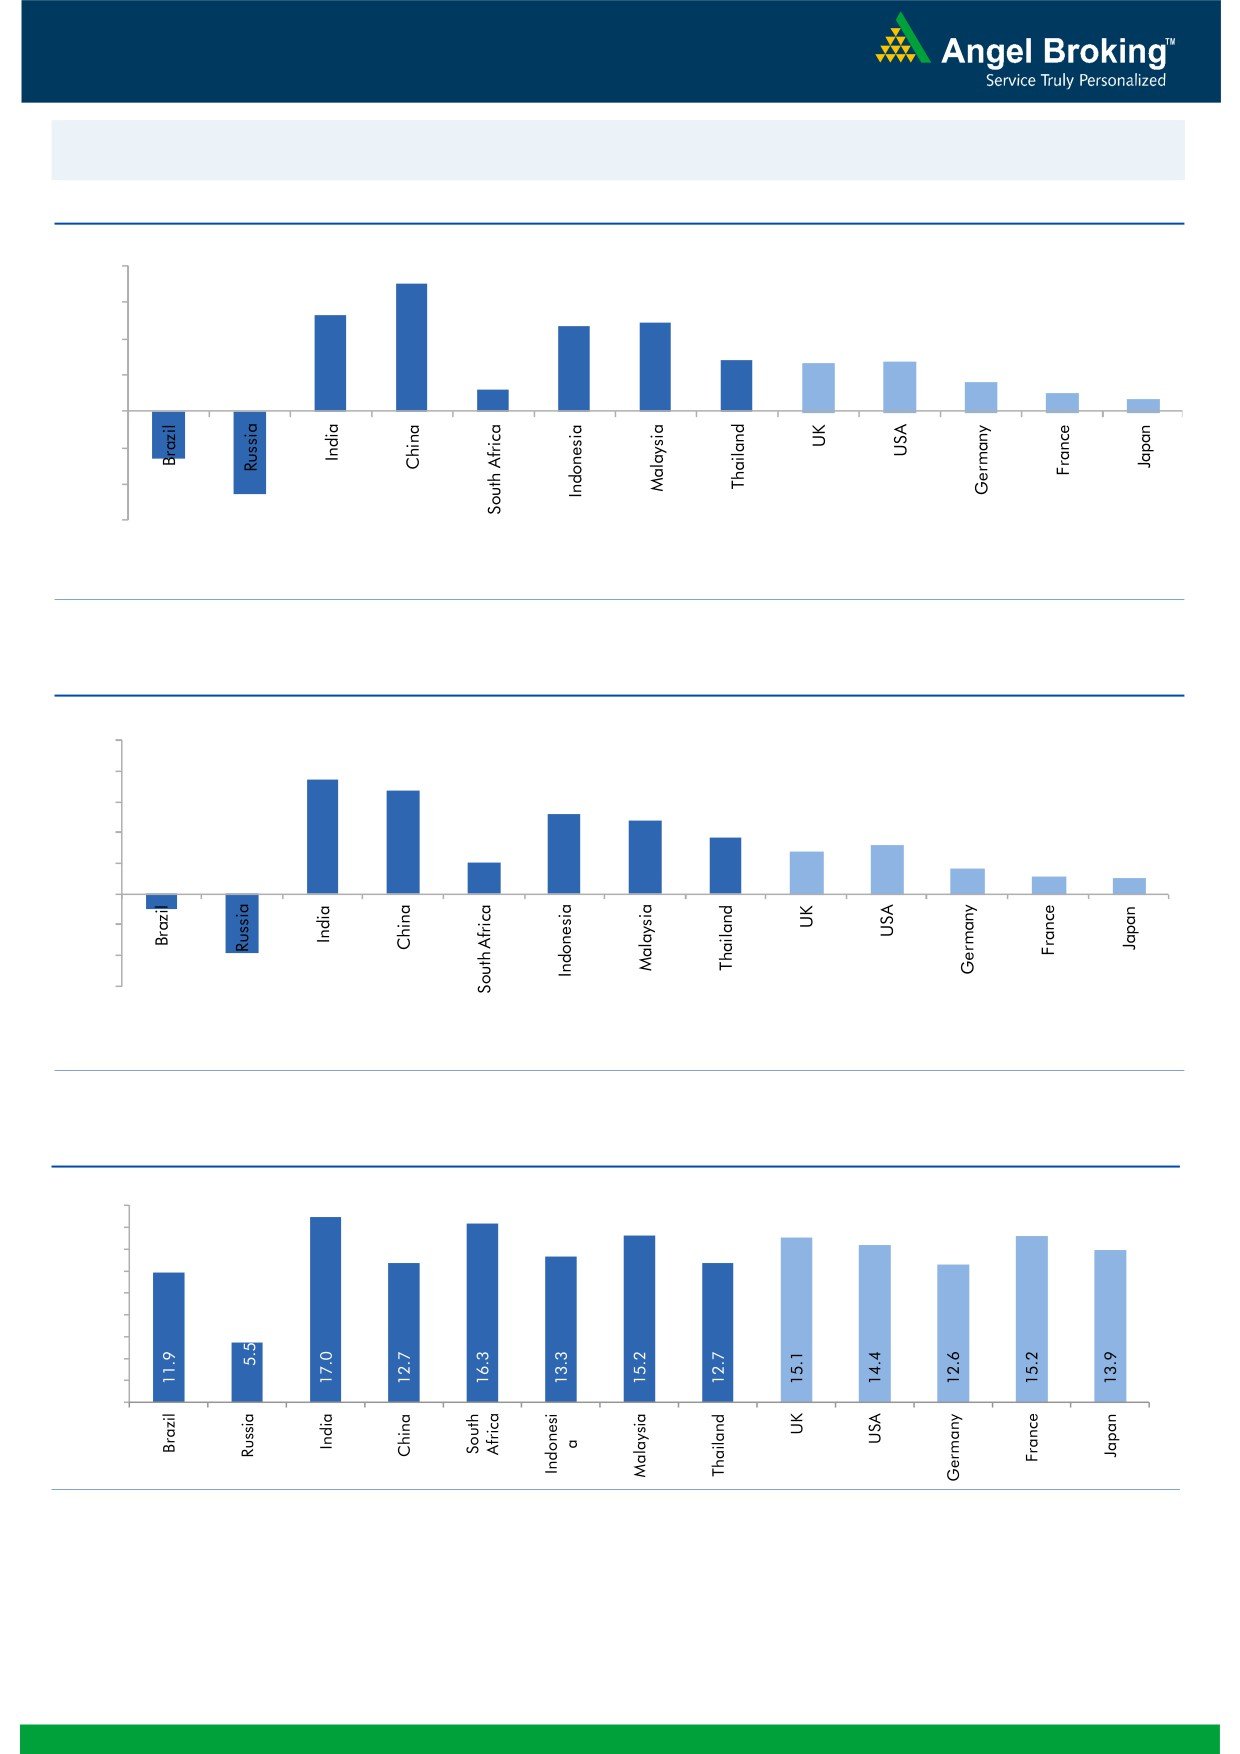
Global watch
Exhibit 1: Latest quarterly GDP Growth (%, yoy) across select developing and developed countries
(%)
8.0
7.0
6.0
5.3
4.9
4.7
4.0
2.8
2.6
2.7
1.6
2.0
1.2
1.0
0.7
(2.6)
(4.6)
-
(2.0)
(4.0)
(6.0)
Source: Bloomberg, Angel Research
Exhibit 2: 2015 GDP Growth projection by IMF (%, yoy) across select developing and developed countries
(%)
10.0
7.5
8.0
6.8
5.2
6.0
4.8
3.7
3.1
4.0
2.7
2.0
1.6
1.2
1.0
2.0
(3.8)
(1.0)
-
(2.0)
(4.0)
(6.0)
Source: IMF, Angel Research
Exhibit 3: One year forward P-E ratio across select developing and developed countries
(x)
18.0
16.0
14.0
12.0
10.0
8.0
6.0
4.0
2.0
-
Source: Bloomberg, Angel Research
Market Outlook
September 10, 2015
Exhibit 4: Relative performance of indices across globe
Returns (%)
Country
Name of index
Closing price
1M
3M
1YR
Brazil
Bovespa
46,657
(4.0)
(11.7)
(23.3)
Russia
Micex
1,722
1.2
4.2
17.6
India
Nifty
7,819
(8.3)
(1.8)
(3.6)
China
Shanghai Composite
3,243
(14.6)
(37.5)
44.2
South Africa
Top 40
44,249
(4.7)
(2.5)
(4.2)
Mexico
Mexbol
42,755
(5.7)
(4.2)
(6.9)
Indonesia
LQ45
732
(10.9)
(18.4)
(18.7)
Malaysia
KLCI
1,603
(4.7)
(7.3)
(14.2)
Thailand
SET 50
910
(2.7)
(8.4)
(12.9)
USA
Dow Jones
16,254
(6.4)
(8.5)
(4.8)
UK
FTSE
6,229
(7.3)
(8.8)
(8.4)
Japan
Nikkei
18,771
(9.8)
(6.4)
21.3
Germany
DAX
10,303
(11.2)
(9.1)
6.1
France
CAC
4,665
(10.2)
(6.2)
5.3
Source: Bloomberg, Angel Research
Market Outlook
September 10, 2015
Stock Watch
Company Name
Reco
CMP
Target
Mkt Cap
Sales ( Čcr )
OPM(%)
EPS (Č)
PER(x)
P/BV(x)
RoE(%)
EV/Sales(x)
(Č)
Price ( Č)
( Č cr )
FY16E FY17E
FY16E
FY17E
FY16E
FY17E
FY16E
FY17E
FY16E
FY17E
FY16E
FY17E
FY16E
FY17E
Agri / Agri Chemical
Rallis
Neutral
209
-
4,060
2,075
2,394
14.4
14.4
9.5
11.0
22.0
19.0
4.4
3.8
21.1
21.3
2.0
1.7
United Phosphorus
Neutral
520
-
22,285
13,698
15,752
17.6
17.6
32.1
38.5
16.2
13.5
3.2
2.6
21.4
21.3
1.7
1.4
Auto & Auto Ancillary
Ashok Leyland
Accumulate
87
97
24,887
18,186
21,529
10.8
11.2
3.3
4.5
26.5
19.4
4.5
4.2
17.3
21.6
1.3
1.1
Bajaj Auto
Accumulate
2,269
2,438
65,659
23,544
27,245
19.8
19.8
127.0
143.4
17.9
15.8
5.4
4.7
30.3
29.4
2.3
2.0
Eicher Motors
Buy
17,967
22,859
48,768
11,681
15,550
15.3
16.9
358.5
564.3
50.1
31.8
15.1
11.2
29.8
34.9
4.1
3.0
Hero Motocorp
Accumulate
2,348
2,672
46,882
28,500
32,764
14.1
14.3
146.9
167.0
16.0
14.1
6.0
5.1
37.8
36.5
1.5
1.3
L G Balakrishnan & Bros Neutral
456
-
716
1,254
1,394
11.6
11.8
35.9
41.7
12.7
11.0
1.7
1.5
13.5
13.8
0.7
0.6
Mahindra and Mahindra Buy
1,171
1,383
72,711
38,337
43,069
13.0
13.4
52.9
63.5
22.1
18.4
3.3
2.9
15.0
15.9
1.5
1.3
Maruti
Accumulate
4,300
4,735
129,882
58,102
68,587
16.7
16.9
182.0
225.5
23.6
19.1
4.7
4.0
19.9
21.0
2.0
1.6
Minda Industries
Buy
508
652
806
2,567
2,965
7.3
8.0
38.8
54.3
13.1
9.4
1.9
1.6
14.4
16.8
0.4
0.3
Rane Brake Lining
Buy
289
366
229
454
511
11.1
11.4
23.8
28.1
12.1
10.3
1.7
1.6
14.2
15.3
0.6
0.6
Setco Automotive
Neutral
226
-
603
594
741
12.7
13.7
8.4
15.8
26.9
14.3
2.8
2.4
10.4
16.9
1.5
1.2
Tata Motors
Accumulate
345
391
99,580
264,038
297,882
13.8
13.9
34.5
38.9
10.0
8.9
1.7
1.4
17.6
16.8
0.5
0.5
TVS Motor
Neutral
226
-
10,732
11,702
13,713
6.8
7.7
10.1
14.5
22.4
15.6
5.5
4.4
24.5
28.3
0.9
0.8
Amara Raja Batteries
Neutral
948
-
16,195
5,101
6,224
17.8
17.6
31.1
39.2
30.5
24.2
7.6
6.0
24.8
24.8
3.1
2.5
Exide Industries
Accumulate
150
159
12,716
7,363
8,247
13.7
14.5
6.6
7.7
22.7
19.4
2.9
2.6
12.6
13.3
1.5
1.3
Apollo Tyres
Neutral
178
-
9,078
12,576
12,978
16.8
16.1
22.3
19.9
8.0
9.0
1.4
1.2
17.2
13.4
0.8
0.8
Ceat
Neutral
1,139
-
4,607
6,041
6,597
14.3
14.2
101.5
116.6
11.2
9.8
2.2
1.9
20.0
19.1
0.9
0.8
JK Tyres
Buy
103
129
2,335
7,446
7,669
15.2
14.0
19.6
18.4
5.3
5.6
1.3
1.1
25.2
19.5
0.7
0.6
Swaraj Engines
Accumulate
860
912
1,069
593
677
14.5
14.8
51.2
60.8
16.8
14.2
3.9
3.5
23.3
24.8
1.7
1.4
Subros
Neutral
78
-
467
1,268
1,488
11.6
11.9
3.7
6.6
21.1
11.8
1.4
1.3
6.8
11.4
0.7
0.6
Indag Rubber
Neutral
172
-
451
283
329
17.0
17.2
13.0
15.4
13.3
11.1
2.9
2.4
21.8
21.6
1.3
1.1
Capital Goods
ACE
Neutral
36
-
357
660
839
4.7
8.2
1.0
3.9
36.1
9.3
1.1
1.0
3.2
11.3
0.7
0.5
BEML
Neutral
1,225
-
5,102
3,277
4,006
6.0
8.9
29.2
64.3
42.0
19.1
2.3
2.1
5.7
11.7
1.6
1.3
BGR Energy
Neutral
106
-
765
3,615
3,181
9.5
9.4
16.7
12.4
6.4
8.6
0.6
0.6
10.0
7.0
0.6
0.8
BHEL
Neutral
213
-
52,097
33,722
35,272
10.8
11.7
10.5
14.2
20.3
15.0
1.5
1.4
7.0
9.0
1.6
1.6
Blue Star
Accumulate
345
387
3,105
3,649
4,209
5.0
5.9
9.2
14.7
37.7
23.4
6.8
6.4
9.1
17.5
0.9
0.8
Crompton Greaves
Buy
166
204
10,407
13,484
14,687
4.9
6.2
4.5
7.1
36.9
23.4
2.6
2.4
7.2
10.8
0.9
0.8
Inox Wind
Buy
392
505
8,707
4,980
5,943
17.0
17.5
26.6
31.6
14.8
12.4
4.4
3.2
35.0
30.0
1.9
1.5
Market Outlook
September 10, 2015
Stock Watch
Company Name
Reco
CMP
Target
Mkt Cap
Sales ( Čcr )
OPM(%)
EPS (Č)
PER(x)
P/BV(x)
RoE(%)
EV/Sales(x)
(Č)
Price ( Č)
( Č cr )
FY16E
FY17E
FY16E
FY17E
FY16E
FY17E
FY16E
FY17E
FY16E
FY17E
FY16E
FY17E
FY16E
FY17E
Capital Goods
KEC International
Neutral
139
-
3,580
8,791
9,716
6.1
6.8
5.4
8.2
25.8
17.0
2.6
2.4
10.0
14.0
0.6
0.6
Thermax
Neutral
925
-
11,018
6,413
7,525
7.4
8.5
30.5
39.3
30.3
23.5
4.7
4.1
15.0
17.0
1.7
1.4
Cement
ACC
Accumulate
1,382
1,548
25,947
11,856
14,092
14.5
17.8
47.6
76.1
29.0
18.2
3.0
2.7
10.6
15.7
2.0
1.7
Ambuja Cements
Accumulate
213
233
32,993
10,569
12,022
20.7
22.2
8.7
10.7
24.4
19.9
3.1
2.9
13.0
15.2
2.7
2.4
India Cements
Buy
72
112
2,198
4,716
5,133
15.9
16.9
3.7
7.5
19.3
9.5
0.7
0.7
3.8
7.3
0.8
0.7
JK Cement
Buy
628
767
4,389
4,056
4,748
14.5
17.0
22.6
41.1
27.8
15.3
2.5
2.2
9.3
15.3
1.5
1.3
J K Lakshmi Cement
Buy
365
430
4,290
2,947
3,616
16.7
19.9
11.5
27.2
31.7
13.4
3.0
2.6
9.8
20.8
1.9
1.5
Mangalam Cements
Neutral
214
-
570
1,053
1,347
10.5
13.3
8.4
26.0
25.4
8.2
1.1
1.0
4.3
12.5
0.9
0.7
Orient Cement
Accumulate
167
183
3,417
1,854
2,524
21.2
22.2
7.7
11.1
21.7
15.0
3.1
2.7
13.3
15.7
2.6
1.8
Ramco Cements
Accumulate
332
350
7,914
4,036
4,545
20.8
21.3
15.1
18.8
22.0
17.7
2.7
2.4
12.9
14.3
2.5
2.1
Shree Cement^
Neutral
10,620
-
36,997
7,150
8,742
26.7
28.6
228.0
345.5
46.6
30.7
6.9
5.8
15.7
20.3
4.9
4.0
UltraTech Cement
Accumulate
2,983
3,282
81,866
27,562
31,548
20.4
22.3
111.9
143.3
26.7
20.8
3.8
3.3
15.2
16.8
3.0
2.6
Construction
ITNL
Neutral
92
-
2,276
7,360
8,825
34.0
35.9
1.0
5.0
92.3
18.5
0.4
0.4
0.3
1.4
3.7
3.6
KNR Constructions
Neutral
525
-
1,476
915
1,479
14.3
13.9
20.3
37.2
25.9
14.1
2.4
2.1
9.6
15.6
1.7
1.1
Larsen & Toubro
Buy
1,592
2,013
148,203
68,920
82,446
10.9
11.5
57.0
73.0
27.9
21.8
2.6
2.4
13.6
15.5
2.4
2.0
Gujarat Pipavav Port
Neutral
182
-
8,787
721
784
53.1
53.6
8.2
9.1
22.1
20.0
3.6
2.9
20.0
18.3
11.7
10.4
MBL Infrastructures
Buy
244
360
1,011
2,313
2,797
12.2
14.6
19.0
20.0
12.8
12.2
1.3
1.2
11.3
10.6
1.1
1.0
Nagarjuna Const.
Neutral
63
-
3,511
7,892
8,842
8.3
9.1
2.4
5.3
26.3
11.9
1.1
1.0
4.2
8.6
0.7
0.6
PNC Infratech
Neutral
480
-
2,464
1,798
2,132
13.2
13.5
22.0
30.0
21.8
16.0
2.0
1.8
11.5
11.4
1.5
1.2
Simplex Infra
Neutral
271
-
1,341
6,241
7,008
10.4
10.7
20.0
36.0
13.6
7.5
1.1
1.0
6.8
11.1
0.7
0.6
Financials
Allahabad Bank
Neutral
77
-
4,417
8,438
9,521
2.8
2.8
21.9
27.0
3.5
2.9
0.4
0.3
10.2
11.5
-
-
Axis Bank
Buy
486
701
115,498
26,941
32,298
3.5
3.6
37.4
46.4
13.0
10.5
2.6
2.3
18.7
20.0
-
-
Bank of Baroda
Neutral
180
-
39,906
19,027
21,737
1.9
2.0
16.9
24.5
10.7
7.4
1.0
0.9
9.1
12.1
-
-
Bank of India
Neutral
135
-
8,996
16,438
18,706
1.9
2.0
19.2
40.9
7.1
3.3
0.4
0.3
4.5
9.1
-
-
Canara Bank
Neutral
265
-
13,660
15,491
17,269
2.0
2.0
61.6
70.9
4.3
3.7
0.5
0.4
10.5
11.1
-
-
Dena Bank
Neutral
40
-
2,267
3,498
3,977
2.1
2.3
7.8
10.7
5.2
3.8
0.4
0.3
6.5
8.4
-
-
Federal Bank
Neutral
60
-
10,241
3,527
4,135
3.0
3.1
5.2
6.7
11.5
8.9
1.2
1.1
10.8
12.7
-
-
HDFC
Neutral
1,187
-
187,045
10,883
12,799
3.5
3.4
43.0
50.6
27.6
23.5
5.5
4.9
25.9
26.7
-
-
HDFC Bank
Buy
1,016
1,255
255,620
38,059
46,851
4.4
4.5
50.0
62.7
20.3
16.2
3.6
3.0
18.8
20.2
-
-
Market Outlook
September 10, 2015
Stock Watch
Company Name
Reco
CMP
Target
Mkt Cap
Sales ( Čcr )
OPM(%)
EPS (Č)
PER(x)
P/BV(x)
RoE(%)
EV/Sales(x)
(Č)
Price ( Č)
( Č cr )
FY16E
FY17E
FY16E
FY17E
FY16E
FY17E
FY16E
FY17E
FY16E
FY17E
FY16E
FY17E
FY16E
FY17E
Financials
ICICI Bank
Buy
264
370
153,506
35,810
41,871
3.4
3.5
22.0
26.2
12.0
10.1
2.1
1.8
15.0
15.6
-
-
IDBI Bank
Neutral
56
-
9,046
9,860
10,978
1.8
1.9
9.3
15.6
6.1
3.6
0.4
0.4
6.4
10.1
-
-
Indian Bank
Neutral
128
-
6,124
6,267
7,171
2.4
2.5
25.4
32.1
5.0
4.0
0.4
0.4
8.0
9.3
-
-
LIC Housing Finance
Buy
428
570
21,607
2,934
3,511
2.3
2.3
30.9
36.8
13.9
11.6
2.2
1.9
16.8
17.5
-
-
Oriental Bank
Neutral
127
-
3,816
7,730
8,595
2.4
2.5
38.8
47.4
3.3
2.7
0.3
0.3
8.6
9.8
-
-
Punjab Natl.Bank
Neutral
135
-
25,092
23,446
26,624
2.8
2.9
17.8
27.5
7.6
4.9
0.8
0.6
8.5
12.1
-
-
South Ind.Bank
Neutral
21
-
2,835
1,930
2,215
2.4
2.4
2.6
3.6
8.1
5.8
0.8
0.7
9.9
12.5
-
-
St Bk of India
Buy
232
307
175,196
83,847
96,307
2.8
2.8
20.1
25.1
11.5
9.2
1.3
1.1
11.5
13.1
-
-
Union Bank
Neutral
170
-
10,824
12,755
14,439
2.3
2.4
31.5
39.9
5.4
4.3
0.6
0.5
9.9
11.6
-
-
Vijaya Bank
Neutral
36
-
3,054
3,594
3,969
1.8
1.9
5.8
7.1
6.1
5.0
0.5
0.5
8.2
9.3
-
-
Yes Bank
Buy
716
953
29,940
7,204
9,078
3.2
3.2
57.8
69.5
12.4
10.3
2.2
1.9
19.6
22.6
-
-
FMCG
Asian Paints
Neutral
821
-
78,707
16,553
19,160
16.0
16.2
17.7
21.5
46.4
38.2
12.3
11.1
29.4
31.2
4.6
4.0
Britannia
Neutral
2,880
-
34,558
8,065
9,395
9.6
10.2
47.2
65.5
61.0
44.0
20.3
19.2
38.3
41.2
4.1
3.5
Colgate
Accumulate
1,836
2,022
24,974
4,836
5,490
19.5
19.7
48.5
53.2
37.9
34.5
27.8
24.2
99.8
97.5
5.1
4.5
Dabur India
Neutral
275
-
48,330
9,370
10,265
17.1
17.2
7.3
8.1
37.5
34.0
11.3
9.2
33.7
30.6
5.1
4.6
GlaxoSmith Con*
Neutral
5,924
-
24,915
4,919
5,742
17.2
17.4
168.3
191.2
35.2
31.0
10.0
8.5
28.8
28.9
4.6
3.9
Godrej Consumer
Neutral
1,165
-
39,655
10,168
12,886
16.1
16.1
32.1
38.4
36.3
30.3
7.4
6.8
19.7
21.0
4.0
3.1
HUL
Neutral
803
-
173,790
34,940
38,957
17.5
17.7
20.8
24.7
38.6
32.5
43.0
34.3
110.5
114.2
4.8
4.3
ITC
Buy
314
409
252,096
41,068
45,068
37.8
37.4
13.9
15.9
22.6
19.8
7.6
6.7
34.1
33.8
5.8
5.2
Marico
Neutral
395
-
25,458
6,551
7,766
15.7
16.0
10.4
12.5
38.0
31.6
11.0
9.2
33.2
32.4
3.8
3.2
Nestle*
Accumulate
5,969
6,646
57,555
11,291
12,847
22.2
22.3
158.9
184.6
37.6
32.3
19.6
17.7
55.0
57.3
4.9
4.3
Tata Global
Buy
124
152
7,798
8,635
9,072
9.8
9.9
6.5
7.6
19.0
16.3
1.9
1.8
6.8
7.4
0.8
0.8
IT
HCL Tech^
Buy
944
1,132
132,709
42,038
47,503
23.5
23.5
56.4
62.9
16.7
15.0
3.9
3.0
23.2
19.8
2.8
2.2
Infosys
Buy
1,089
1,306
250,022
60,250
66,999
28.0
28.0
58.3
63.7
18.7
17.1
3.9
3.4
20.9
19.7
3.5
3.0
TCS
Buy
2,551
3,168
499,603
108,420
123,559
28.8
28.7
127.2
143.9
20.1
17.7
8.0
7.4
39.9
41.8
4.2
3.6
Tech Mahindra
Buy
533
646
51,221
25,566
28,890
16.0
17.0
26.3
31.9
20.3
16.7
3.6
3.1
17.9
18.6
1.8
1.5
Wipro
Buy
561
719
138,549
52,414
58,704
23.7
23.8
38.4
42.3
14.6
13.3
2.9
2.6
19.5
18.0
2.2
1.8
Media
D B Corp
Buy
302
356
5,554
2,241
2,495
27.8
27.9
21.8
25.6
13.9
11.8
3.6
3.2
26.7
28.5
2.4
2.2
HT Media
Neutral
77
-
1,793
2,495
2,603
11.2
11.2
7.3
8.6
10.6
9.0
0.8
0.8
7.4
8.1
0.2
0.2
Market Outlook
September 10, 2015
Stock Watch
Company Name
Reco
CMP
Target
Mkt Cap
Sales ( Čcr )
OPM(%)
EPS (Č)
PER(x)
P/BV(x)
RoE(%)
EV/Sales(x)
(Č)
Price ( Č)
( Č cr )
FY16E FY17E
FY16E
FY17E
FY16E
FY17E
FY16E
FY17E
FY16E
FY17E
FY16E
FY17E
FY16E
FY17E
Media
Jagran Prakashan
Buy
132
156
4,307
1,939
2,122
26.0
26.0
8.3
9.2
15.9
14.3
2.7
2.4
17.5
17.1
2.2
2.0
Sun TV Network
Neutral
372
-
14,640
2,779
3,196
70.2
70.5
22.8
27.3
16.3
13.6
4.0
3.6
26.7
28.3
5.0
4.3
Hindustan Media
Buy
224
292
1,647
920
1,031
20.0
20.0
19.2
20.9
11.7
10.8
1.9
1.7
16.4
15.3
1.3
1.2
Ventures
Metals & Mining
Coal India
Buy
339
400
213,967
72,015
78,415
21.2
21.5
21.7
25.3
15.6
13.4
5.3
5.2
33.1
39.1
2.2
2.1
Hind. Zinc
Neutral
135
-
57,021
15,258
16,495
44.2
45.6
17.6
19.2
7.7
7.0
1.2
1.1
15.9
15.3
1.4
1.0
Hindalco
Neutral
79
-
16,231
104,356
111,186
8.7
9.5
6.7
11.1
11.7
7.1
0.4
0.4
3.5
5.9
0.7
0.6
JSW Steel
Neutral
982
-
23,726
48,125
53,595
18.8
21.0
46.9
97.5
20.9
10.1
1.0
0.9
4.4
9.5
1.3
1.2
NMDC
Neutral
104
-
41,332
8,237
10,893
46.6
44.5
10.0
11.7
10.5
8.9
1.2
1.0
12.5
13.0
4.8
3.7
SAIL
Neutral
54
-
22,364
45,915
53,954
7.2
10.5
1.5
4.4
36.0
12.4
0.5
0.5
2.3
4.1
1.1
1.0
Vedanta
Neutral
100
-
29,617
71,445
81,910
26.2
26.3
12.9
19.2
7.8
5.2
0.5
0.5
7.2
8.9
0.9
0.7
Tata Steel
Neutral
239
-
23,236
136,805
149,228
11.3
11.9
26.4
36.8
9.1
6.5
0.7
0.7
6.0
8.0
0.7
0.6
Oil & Gas
Cairn India
Neutral
150
-
28,067
11,323
12,490
49.4
51.0
20.7
20.7
7.2
7.3
0.5
0.4
6.4
6.1
1.6
0.9
GAIL
Neutral
294
-
37,281
64,856
70,933
9.1
9.6
24.0
28.9
12.3
10.2
1.1
1.0
8.8
9.6
0.8
0.7
ONGC
Neutral
231
-
197,290
154,564
167,321
36.8
37.4
28.6
32.5
8.1
7.1
1.0
0.9
12.7
13.5
1.5
1.4
Petronet LNG
Buy
180
210
13,478
39,007
40,785
3.8
4.2
9.2
11.0
19.6
16.4
2.2
2.0
11.6
12.7
0.4
0.4
Indian Oil Corp
Accumulate
403
455
97,749
359,607
402,760
5.9
6.1
42.5
48.7
9.5
8.3
1.3
1.1
14.1
14.4
0.4
0.3
Reliance Industries
Accumulate
873
930
282,731
313,085
362,904
13.1
13.8
78.4
92.9
11.1
9.4
1.2
1.1
10.8
11.6
1.4
1.2
Pharmaceuticals
Alembic Pharma
Neutral
679
-
12,792
2,601
3,115
21.2
20.2
20.8
23.9
32.6
28.4
10.5
7.9
37.2
31.8
4.9
4.1
Aurobindo Pharma
Buy
716
872
41,797
14,923
17,162
23.0
23.0
38.2
43.6
18.7
16.4
5.8
4.3
36.0
30.2
3.1
2.7
Aventis*
Neutral
3,989
-
9,186
2,156
2,455
15.1
16.8
109.7
133.9
36.4
29.8
5.0
4.1
18.4
22.5
4.0
3.3
Cadila Healthcare
Neutral
1,796
-
36,769
10,224
11,840
20.0
21.0
71.0
85.6
25.3
21.0
6.8
5.3
30.1
28.5
3.7
3.1
Cipla
Neutral
657
-
52,788
14,359
16,884
21.3
19.7
28.4
30.5
23.1
21.6
4.1
3.5
19.3
17.5
3.7
3.0
Dr Reddy's
Neutral
4,038
-
68,843
17,903
20,842
22.7
22.8
160.5
189.5
25.2
21.3
5.1
4.2
22.2
21.7
3.8
3.2
Dishman Pharma
Accumulate
257
290
2,072
1,716
1,888
20.2
20.2
16.3
21.6
15.8
11.9
1.5
1.3
9.7
11.7
1.4
1.1
GSK Pharma*
Neutral
3,316
-
28,088
2,870
3,158
20.0
22.1
59.5
68.3
55.7
48.6
16.4
16.9
28.5
34.3
9.3
8.5
Indoco Remedies
Neutral
336
-
3,094
1,088
1,262
18.2
18.2
13.1
15.5
25.6
21.7
5.0
4.2
21.2
21.1
2.9
2.5
Ipca labs
Accumulate
740
800
9,331
3,507
4,078
17.6
18.6
25.8
32.0
28.7
23.1
3.7
3.2
13.8
14.9
2.9
2.5
Lupin
Neutral
1,835
-
82,586
14,864
17,244
26.9
26.9
62.1
71.1
29.6
25.8
7.2
5.7
27.4
24.6
5.3
4.4
Sun Pharma
Accumulate
840
950
202,141
28,163
32,610
25.8
30.7
17.4
26.9
48.3
31.2
4.6
4.0
13.0
16.6
6.6
5.5
Market Outlook
September 10, 2015
Stock Watch
Company Name
Reco
CMP
Target
Mkt Cap
Sales ( Čcr )
OPM(%)
EPS (Č)
PER(x)
P/BV(x)
RoE(%)
EV/Sales(x)
(Č)
Price ( Č)
( Č cr )
FY16E FY17E
FY16E
FY17E
FY16E
FY17E
FY16E
FY17E
FY16E
FY17E
FY16E
FY17E
FY16E
FY17E
Power
Tata Power
Neutral
59
-
16,011
35,923
37,402
22.6
22.8
4.1
5.2
14.6
11.5
1.1
1.0
7.5
9.3
1.4
1.3
NTPC
Buy
121
157
99,646
87,064
98,846
23.5
23.5
11.7
13.2
10.3
9.2
1.2
1.1
11.4
12.1
2.2
1.9
Power Grid
Buy
126
170
65,918
20,702
23,361
86.7
86.4
12.1
13.2
10.4
9.5
1.5
1.4
15.6
15.1
8.1
7.6
Telecom
Bharti Airtel
Neutral
355
-
141,988
101,748
109,191
32.1
31.7
12.0
12.5
29.6
28.4
2.0
1.9
6.9
6.7
2.0
1.8
Idea Cellular
Neutral
149
-
53,702
34,282
36,941
32.0
31.5
5.9
6.2
25.3
24.1
2.3
2.1
9.9
9.3
2.1
2.0
zOthers
Abbott India
Neutral
5,374
-
11,419
2,715
3,153
14.5
14.1
134.3
152.2
40.0
35.3
10.0
8.2
27.4
25.6
3.9
3.3
Bajaj Electricals
Buy
245
341
2,473
4,719
5,287
5.2
5.8
8.6
12.7
28.7
19.4
3.3
2.9
11.4
14.8
0.5
0.5
Finolex Cables
Neutral
244
-
3,726
2,728
3,036
10.8
11.0
14.4
16.8
16.9
14.5
2.6
2.2
15.2
15.3
1.1
0.9
Goodyear India*
Buy
519
655
1,197
1,953
1,766
12.4
12.0
67.4
59.6
7.7
8.7
1.9
1.6
27.7
20.2
0.4
0.4
Hitachi
Neutral
1,320
-
3,588
1,806
2,112
9.0
9.2
28.6
29.1
46.1
45.4
11.5
9.3
28.1
22.6
2.1
1.8
Jyothy Laboratories
Neutral
310
-
5,616
1,620
1,847
11.5
11.5
7.3
8.5
42.6
36.6
5.5
5.1
13.3
14.4
3.3
2.8
MRF
Accumulate
39,493
43,575
16,749
20,727
14,841
19.3
18.6
4,905.8
3,351.9
8.1
11.8
2.6
2.1
37.6
19.6
0.8
1.0
Page Industries
Neutral
13,576
-
15,142
1,929
2,450
19.8
20.1
229.9
299.0
59.1
45.4
26.1
18.1
52.1
47.1
7.9
6.2
Relaxo Footwears
Neutral
493
-
5,919
1,767
2,152
12.3
12.5
19.3
25.1
25.6
19.7
6.3
4.8
27.7
27.8
3.4
2.8
Siyaram Silk Mills
Buy
1,001
1,221
938
1,653
1,873
11.7
12.2
99.3
122.1
10.1
8.2
1.8
1.5
19.5
20.2
0.7
0.6
Styrolution ABS India*
Neutral
743
-
1,307
1,271
1,440
8.6
9.2
32.0
41.1
23.2
18.1
2.4
2.1
10.7
12.4
1.0
0.9
Tree House
Buy
385
449
1,629
259
324
56.8
56.8
17.0
21.7
22.6
17.8
2.3
2.1
10.1
11.5
6.2
5.1
TVS Srichakra
Buy
2,487
3,210
1,904
2,127
2,388
15.2
14.9
237.7
267.5
10.5
9.3
4.5
3.2
51.7
39.8
1.0
0.8
HSIL
Buy
244
434
1,766
2,085
2,436
18.5
18.6
21.7
28.9
11.3
8.5
1.1
1.0
10.0
12.1
1.0
0.8
Kirloskar Engines India
Accumulate
280
297
4,048
2,634
3,252
10.1
12.0
10.9
17.4
25.7
16.1
2.9
2.6
11.4
16.8
1.2
0.9
Ltd
M M Forgings
Buy
565
797
682
563
671
22.1
22.9
51.0
66.5
11.1
8.5
2.3
1.8
23.1
24.1
1.4
1.1
Banco Products (India)
Neutral
118
-
841
1,208
1,353
11.0
12.3
10.8
14.5
10.9
8.1
1.3
1.1
11.9
14.5
0.7
0.6
Competent Automobiles Neutral
144
-
88
1,007
1,114
3.1
3.1
23.7
28.2
6.1
5.1
0.9
0.7
13.9
14.6
0.1
0.1
Nilkamal
Accumulate
877
1,005
1,309
1,948
2,147
10.6
10.3
60.0
67.0
14.6
13.1
2.3
2.0
16.8
16.1
0.7
0.6
Visaka Industries
Buy
132
166
209
1,158
1,272
8.6
9.5
23.7
32.7
5.6
4.0
0.6
0.5
10.1
12.5
0.4
0.3
Transport Corporation of
Buy
236
293
1,792
2,830
3,350
8.8
9.0
14.4
18.3
16.4
12.9
2.5
2.2
15.4
17.1
0.8
0.7
India
Elecon Engineering
Buy
70
87
758
1,452
1,596
14.0
14.7
4.4
6.2
15.8
11.2
1.3
1.2
8.6
11.2
0.8
0.7
Surya Roshni
Buy
117
183
513
2,992
3,223
8.3
8.5
14.7
18.3
8.0
6.4
0.7
0.7
9.8
11.0
0.5
0.4
MT Educare
Buy
126
169
500
286
366
18.3
17.7
7.7
9.4
16.3
13.4
3.4
3.0
20.2
21.1
1.6
1.2
Market Outlook
September 10, 2015
Stock Watch
Company Name
Reco
CMP
Target Mkt Cap
Sales ( Čcr )
OPM(%)
EPS (Č)
PER(x)
P/BV(x)
RoE(%)
EV/Sales(x)
(Č)
Price ( Č)
( Č cr )
FY16E FY17E FY16E FY17E FY16E FY17E FY16E FY17E FY16E FY17E FY16E FY17E FY16E FY17E
zOthers
Radico Khaitan
Buy
87
112
1,163
1,565
1,687
11.9
12.4
5.4
6.6
16.2
13.3
1.3
1.2
8.0
9.0
1.2
1.2
Garware Wall Ropes
Buy
280
390
613
875
983
10.4
10.6
23.1
27.8
12.1
10.1
1.7
1.5
14.1
14.8
0.7
0.6
Wonderla Holidays
Buy
271
322
1,533
206
308
44.0
43.6
9.0
12.9
30.2
21.0
4.1
3.7
13.7
17.8
7.3
4.9
Linc Pen & Plastics
Buy
155
185
230
340
371
8.3
8.9
10.8
13.2
14.4
11.8
2.3
2.0
16.0
17.1
0.7
0.6
Source: Company, Angel Research; Note: *December year end; #September year end; &October year end; Price as on September 09, 2015
Market Outlook
September 10, 2015
Research Team Tel: 022 - 39357800
DISCLAIMER
Angel Broking Private Limited (hereinafter referred to as “Angel”) is a registered Member of National Stock Exchange of India Limited,
Bombay Stock Exchange Limited and MCX Stock Exchange Limited. It is also registered as a Depository Participant with CDSL and
Portfolio Manager with SEBI. It also has registration with AMFI as a Mutual Fund Distributor. Angel Broking Private Limited is a registered
entity with SEBI for Research Analyst in terms of SEBI (Research Analyst) Regulations, 2014 vide registration number INH000000164.
Angel or its associates has not been debarred/ suspended by SEBI or any other regulatory authority for accessing /dealing in securities
Market. Angel or its associates including its relatives/analyst do not hold any financial interest/beneficial ownership of more than 1% in
the company covered by Analyst. Angel or its associates/analyst has not received any compensation / managed or co-managed public
offering of securities of the company covered by Analyst during the past twelve months. Angel/analyst has not served as an officer,
director or employee of company covered by Analyst and has not been engaged in market making activity of the company covered by
Analyst.
This document is solely for the personal information of the recipient, and must not be singularly used as the basis of any investment
decision. Nothing in this document should be construed as investment or financial advice. Each recipient of this document should make
such investigations as they deem necessary to arrive at an independent evaluation of an investment in the securities of the companies
referred to in this document (including the merits and risks involved), and should consult their own advisors to determine the merits and
risks of such an investment.
Reports based on technical and derivative analysis center on studying charts of a stock's price movement, outstanding positions and
trading volume, as opposed to focusing on a company's fundamentals and, as such, may not match with a report on a company's
fundamentals.
The information in this document has been printed on the basis of publicly available information, internal data and other reliable sources
believed to be true, but we do not represent that it is accurate or complete and it should not be relied on as such, as this document is for
general guidance only. Angel Broking Pvt. Limited or any of its affiliates/ group companies shall not be in any way responsible for any
loss or damage that may arise to any person from any inadvertent error in the information contained in this report. Angel Broking Pvt.
Limited has not independently verified all the information contained within this document. Accordingly, we cannot testify, nor make any
representation or warranty, express or implied, to the accuracy, contents or data contained within this document. While Angel Broking
Pvt. Limited endeavors to update on a reasonable basis the information discussed in this material, there may be regulatory, compliance,
or other reasons that prevent us from doing so.
This document is being supplied to you solely for your information, and its contents, information or data may not be reproduced,
redistributed or passed on, directly or indirectly.
Neither Angel Broking Pvt. Limited, nor its directors, employees or affiliates shall be liable for any loss or damage that may arise from or
in connection with the use of this information.
Note: Please refer to the important ‘Stock Holding Disclosure' report on the Angel website (Research Section). Also, please refer to the
latest update on respective stocks for the disclosure status in respect of those stocks. Angel Broking Pvt. Limited and its affiliates may have
investment positions in the stocks recommended in this report.