Market Outlook
March 10, 2016
Market Cues
Domestic Indices
Chg (%)
(Pts)
(Close)
Indian markets are expected to open in the green tracking the SGX Nifty and weak
BSE Sensex
0.5
135
24,794
Asian cues.
Nifty
0.6
47
7,532
Mid Cap
0.9
96
10,296
US markets closed marginally higher led by recovery in oil prices. Crude priced
Small Cap
0.0
4
10,314
inched up after the EIA said that crude oil inventories increased by 3.9 million
barrels in the week ended March 4th, in line with consensus estimate. Overall
Bankex
0.9
147
17,408
trading activity however remained subdued.
Global Indices
Chg (%)
(Pts)
(Close)
European markets opened higher on the back of rising crude oil prices and stimulus
hopes ahead of the ECB meet today. However, cautiousness ahead of the meet
Dow Jones
0.2
36
17,000
resulted in the gains being paired in the second half and markets closing marginally
Nasdaq
0.5
26
4,674
higher.
FTSE
0.3
21
6,146
Indian markets recovered during the course of the day after opening in the red as oil
Nikkei
(0.8)
(141)
16,642
and metal prices recovered after sharp overnight losses and recovery in European
Hang Seng
(0.1)
(15)
19,996
markets.
Shanghai Com
(1.3)
(39)
2,863
News & Result Analysis
Advances / Declines
BSE
NSE
Container Corporation of India (Offer for Sale) - Neutral
ICICI Bank Asset Quality to be under pressure beyond FY16 - Moodys
Advances
1,376
853
Detailed analysis on Pg2
Declines
1,235
687
Unchanged
121
71
Investor’s Ready Reckoner
Key Domestic & Global Indicators
Volumes (` Cr)
Stock Watch: Latest investment recommendations on 150+ stocks
BSE
2,676
Refer Pg10 onwards
NSE
18,232
Top Picks
CMP
Target
Upside
Company
Sector
Rating
Net Inflows (` Cr)
Net
Mtd
Ytd
(`)
(`)
(%)
Amara Raja Batteries Auto & Auto Ancillary
Buy
905
1,040
14.9
FII
774
7,491
(26,031)
HCL Tech
IT
Buy
817
1,038
27.1
MFs
(781)
(1,929)
80,619
LIC Housing Finance Financials
Buy
461
592
28.4
Bharat Electronics
Capital Goods
Buy
1,095
1,414
29.1
Top Gainers
Price (`)
Chg (%)
Navkar Corporation Others
Buy
165
265
61.1
Crompgreav
152
8.8
More Top Picks on Pg9
Relinfra
516
6.9
Sjvn
30
6.2
Key Upcoming Events
Previous
Consensus
Ashokley
97
5.7
Date
Region
Event Description
Reading
Expectations
Bajajelec
186
5.5
Mar 10 US
Initial Jobless Claims
278
275
India
Imports YoY%
(11.00)
--
Top Losers
Price (`)
Chg (%)
India
Exports YoY%
(13.60)
--
Eurozone
ECB announces interest rates
0.05
0.05
Mindtree
684
(11.6)
6.(
Naukri
788
(4.3)
Hathway
37
(4.3)
Niittech
455
(2.9)
Jublfood
1,149
(2.8)
As on March 9, 2016
Market Outlook
March 10, 2016
Offer for Sale Note | Logistics
Container Corporation of India
NEUTRAL
Issue Open: March 10, 2016
Issue Close: March 10, 2016
Container Corporation of India (CONCOR) is largest and uncontested market
Issue Details
leader in logistics solutions space having a network of 63 inland container
Face Value: `10
depots/container freight stations (ICD/CFS). It enjoys ~75% market share in the
rail container handling business.
Present Eq. Paid-up Capital: `195cr
Scale and Pan India Presence: CONCOR possesses an unfair advantage in terms
Offer for Sale (OFS) Size: 0.97cr Shares
of size and presence of its business in comparison to other private container train
Post Eq. Paid-up Capital: `195cr
operators (CTOs). CONCOR’s behemoth position is largely owing to its
monopolistic position for the longest time along with its ability to secure land at
OFS Issue size (amount): ~`1,165cr
strategic locations, on attractive terms. In comparison, the private CTOs have
Offer For Sale (OFS) Floor Price: `1,195
been unable to emulate CONCOR’s success as setting up the infrastructure is
both capital intensive as well as is contingent on various regulatory approvals
Retail Discount: 5%
ranging from land allocation to rail linkages.
OFS Floor Price (Retail): `1,135
Dedicated Freight Corridor will be a key long term trigger: Currently, roads
Post-issue implied market cap: `23,310cr
account for ~70% of total domestic container traffic while rail accounts for the
balance. This imbalance in favour of roads is largely on account of poor rail
Promoters holding Pre-Issue: 61.8%
infrastructure for freight. With the Dedicated Freight Corridor (DFC) completion
Promoters holding Post-Issue: 56.8%
expected by FY2019, we expect railways to gain volumes from road and expect
CONCOR to be a direct beneficiary on this account as it is the largest player with
pan India presence.
Post Issue Shareholding Pattern
Improvement in EXIM Volumes: Container volumes have a direct correlation with
Promoters Group
56.8
EXIM. With expected improvement in EXIM, and improving containerisation levels
MF/Banks/Indian
in India, CONCOR stands to be benefit owing to its vast network. Additionally,
43.2
FIs/FIIs/Public & Others
JNPT which is India’s largest container handling port is performing at peak
capacity and is in process of expanding is capacity in anticipation of EXIM led
growing container volumes.
Valuations and outlook: We believe that any improvement in EXIM volumes will
benefit CONCOR due to strong presence in rail linked ICDs across India. Further,
government is more focused on projects like DFC and passage of key bills like
goods and services tax (GST) which would boost CONCOR’s growth and
profitability. However, the company has reported weak nine month financial
numbers (reported PAT de-growth of ~14%) owing to near-term slowdown in
EXIM volumes and temporary shutdown at Pipavav Port. Further, market share
loss to private CTOs and road players (light-weight cargo) due to their competitive
offering (lower diesel cost vs. hike in haulage charges) has impacted volume
growth. Considering weak growth in near term, we believe that stock which is
currently trading at 24.8x on TTM basis is slightly expensive. Thus we recommend
Neutral on this OFS.
Key financials (Consolidated)
Y/E March (` cr)
FY2012
FY2013
FY2014
FY2015
Net Sales
4,101
4,445
5,317
6,149
% chg
-
8.4
19.6
15.7
Net Profit
866
931
945
1,054
Amarjeet S Maurya
% chg
-
7.4
1.4
11.4
022 - 4000 3600 Ext: 6831
OPM (%)
25.0
23.6
21.7
16.8
EPS (`)
44.4
47.7
48.4
54.1
P/E (x)
26.8
24.9
24.6
22.0
P/BV (x)
4.2
3.7
3.4
3.1
Milan Desai
RoE (%)
15.6
15.0
13.8
14.0
022 - 4000 3600 Ext: 6846
EV/Sales (x)
4.9
4.5
3.8
3.2
Source: Company, Angel Research; Valuation Ratios on OFS price of ` 1,195
Market Outlook
March 10, 2016
Company Background
CONCOR is an undisputed market leader in the inland rail transportation space
having the network of 63 ICDs/CFSs spread across India. Of the 63 ICD/CFS, 15
are for domestic containers, 13 for export-import containers, and the balance are
a mixture of both. In addition to providing inland transport by rail for containers, it
has also expanded to cover management of Ports, air cargo complexes and
established cold-chain. For FY2015, the company handled 3.11mn Twenty Foot
Equivalent Unit (TEUs) of which, international business accounted for 2.62mn TEUs
and domestic accounted for 489,000 TEUs.
Issue details
The Promoter (Government of India) proposes to sell 97,48,710 equity shares of
face value of `10/ representing 5% of the total paid up equity share capital of the
company. CONCOR has fixed the OFS floor price at `1,195 per share. Retail
shareholders will get a discount of 5%, implying a floor price of `1,135. 20% of
the issue is reserved for retail investors.
Exhibit 1: Shareholding Pattern
Pre-Issue
Post-Issue
Particulars
No. of shares
(%)
No. of shares
(%)
Promoter and promoter group
12,04,82,495
61.8
11,07,33,785
56.8
Total public holding
7,44,91,696
38.2
8,42,40,406
43.2
Total
19,49,74,191
100
19,49,74,191
100
Source: Company, Angel Research
Market Outlook
March 10, 2016
Profit & Loss Statement (Consolidated)
Y/E March (` cr)
FY2012
FY2013
FY2014
FY2015
Total operating income
4,101
4,445
5,317
6,149
% chg
8.4
19.6
15.7
Total Expenditure
3,077
3,395
4,164
5,116
Personnel Expenses
102
109
146
198
Others Expenses
2,976
3,286
4,018
4,919
EBITDA
1,023
1,050
1,152
1,033
% chg
2.5
9.8
(10.4)
(% of Net Sales)
25.0
23.6
21.7
16.8
Depreciation& Amortisation
162
176
236
42
EBIT
861
873
917
991
% chg
1.4
5.0
8.1
(% of Net Sales)
21.0
19.6
17.2
16.1
Interest & other Charges
5
3
22
18
Other Income
314
333
358
345
(% of PBT)
26.8
27.7
28.6
26.2
Share in profit of Associates
-
-
-
-
Recurring PBT
1,170
1,203
1,252
1,318
Tax
304
272
307
264
(% of PBT)
26.0
22.6
24.5
20.0
PAT (reported)
866
931
945
1,054
% chg
7.4
1.4
11.4
(% of Net Sales)
21.1
20.9
17.8
17.1
Basic EPS (`)
44.4
47.7
48.4
54.1
Fully Diluted EPS (`)
44.4
47.7
48.4
54.1
% chg
7.5
1.5
11.7
Market Outlook
March 10, 2016
Balance Sheet (Consolidated)
Y/E March (` cr)
FY2012
FY2013
FY2014
FY2015
SOURCES OF FUNDS
Equity Share Capital
130
130
195
195
Reserves& Surplus
5,425
6,090
6,663
7,322
Shareholders’ Funds
5,555
6,220
6,858
7,517
Minority Interest
-
-
28
91
Total Loans
58
38
207
189
Deferred Tax Liability
262
296
326
231
Total Liabilities
5,875
6,555
7,418
8,028
APPLICATION OF FUNDS
Gross Block
3,586
4,078
5,125
5,960
Less: Acc. Depreciation
1,127
1,295
1,756
2,283
Net Block
2,459
2,783
3,369
3,676
Capital Work-in-Progress
104
188
240
395
Investments
245
369
484
488
Current Assets
3,701
3,893
4,176
4,437
Inventories
37
55
19
51
Sundry Debtors
30
28
62
65
Cash
2,758
2,946
2,774
2,949
Loans & Advances
471
481
550
655
Other Assets
405
382
771
717
Current liabilities
651
701
870
991
Net Current Assets
3,049
3,192
3,305
3,446
Deferred Tax Asset
18
22
20
24
Mis. Exp. not written off
-
-
-
-
Total Assets
5,875
6,555
7,418
8,028
Cash flow Statement (Consolidated)
Y/E March (` cr)
FY2012
FY2013
FY2014
FY2015E
Profit before tax
1,169
1,203
1,253
1,320
Depreciation
162
176
236
411
Change in Working Capital
(107)
42
(265)
106
Interest / Dividend (Net)
(254)
(298)
(291)
(305)
Direct taxes paid
(200)
(214)
(260)
(365)
Others
1
1
(0)
0
Cash Flow from Operations
772
910
673
1,167
(Inc.)/ Dec. in Fixed Assets
(323)
(567)
(666)
(653)
(Inc.)/ Dec. in Investments
245
124
115
5
Cash Flow from Investing
(79)
(442)
(552)
(648)
Issue of Equity
-
-
-
-
Inc./(Dec.) in loans
11
(20)
(51)
(17)
Dividend Paid (Incl. Tax)
(234)
(257)
(309)
(313)
Interest / Dividend (Net)
(5)
(3)
(24)
(19)
Others
(4)
-
91
6
Cash Flow from Financing
(232)
(280)
(293)
(343)
Inc./(Dec.) in Cash
461
188
(172)
175
Opening Cash balances
2,296
2,758
2,946
2,774
Closing Cash balances
2,758
2,946
2,774
2,949
Market Outlook
March 10, 2016
Key Ratios
Y/E March
FY2012
FY2013
FY2014
FY2015
Valuation Ratio (x)
P/E (on FDEPS)
26.8
24.9
24.6
22.0
P/CEPS
22.6
21.0
19.7
21.2
P/BV
4.2
3.7
3.4
3.1
Dividend yield (%)
0.9
1.0
1.1
1.1
EV/Sales
4.9
4.5
3.8
3.2
EV/EBITDA
19.8
19.0
17.5
19.3
EV / Total Assets
3.1
2.7
2.4
2.2
Per Share Data (`)
EPS (Basic)
44.4
47.7
48.4
54.1
EPS (fully diluted)
44.4
47.7
48.4
54.1
Cash EPS
52.7
56.8
60.6
56.2
DPS
11.0
11.7
12.5
13.6
Book Value
284.9
319.0
351.7
385.5
Returns (%)
ROCE
15.3
14.0
13.0
12.9
Angel ROIC (Pre-tax)
33.0
29.7
24.1
23.2
ROE
15.6
15.0
13.8
14.0
Turnover ratios (x)
Asset Turnover (Gross Block)
1.7
1.6
1.6
1.7
Inventory / Sales (days)
3
5
1
3
Receivables (days)
3
2
4
4
Payables (days)
11
14
13
13
Working capital cycle (ex-cash) (days)
(5)
(7)
(8)
(6)
Market Outlook
March 10, 2016
Moody’s Says ICICI Banks corporate asset quality to be under
pressure beyond FY16 also. Our view core strength still positive:
Moody’s rating has said ICICI Bank’s asset quality from the corporate segment will
continue to be under pressure after FY16 also. The bank has exposure to some of
the big tickets accounts having low operating cash flow and weak debt serving
ability. However, Moody’s affirmed ratings for the bank’s financial instruments,
including local and foreign currency deposits at “Baa3/P3” and senior unsecured
medium term note (MTN) programme at (P)Baa3. The outlook on all the long term
ratings, where applicable, is positive.
On the positive side, Moody’s said that ICICI Bank’s core operating profitability
has seen significant improvement over the past few year. The banks pre-provision
income / average assets rose from 1.91% in FY09 to 3.18% in FY15, while its core
operating profitability was driven by structural improvement in its funding profile,
as well as higher net interest margins (NIM) and better cost to income ratio.
Even if NPLs increased sharply, the bank can rebuild its loan loss reserve levels
over a reasonable period of time by providing for higher credit costs. Credit
Cost/PPP for the bank for 9MFY16 was 28% indicating that the bank had the
capacity to support much higher level of credit cost if required, said Moody’s.
The asset quality of the bank has been under pressure for last few year and higher
so in last few quarters. The Reserve Bank’s of India’s asset quality review has
resulted in a sharp rise in the Gross Non Performing Assets for the bank during the
3QFY16, when it went up to 4.72% from 3.77% in Q2FY16 and Net Non
Performing assets went up to 2.28% from 1.65%. In Absolute terms the GNPAs
went up to `21,149cr from `15,857cr, while Net NPAs went up to `9,907cr from
`6,759 cr. The rise in Gross NPAs and Net NPAs at 33% and 46% respectively,
was one of the highest ever in a single quarter. Slippages for the bank during the
3QFY16 was one of the highest at `6544cr (annualized slippage ratio of 6.8%) vs.
`2,242cr in 2QFY16. The bank is likely to see stress on the book in the 4QFY2016
also, as the bank has recognized only part of the accounts identified as weak in
the RBI’s asset quality review.
At the CMP of `216 the stock is trading at 1.7x its FY16 Book Value while on FY17
Book value it is trading at 1.5x. Though some concern over asset quality continues
to be there, the bank is well placed with Capital Adequecy Ratio of 15.77% at the
end of 3QFY16. Based on the inherent strength of the bank we maintain BUY on
the stock and retain our target price of `254 over one year time frame.
Economic and Political News
Shipping ministry to sign MoUs worth `73,000cr for 109 projects
Ten coal blocks under consideration for commercial mining by May 2016
Corporate News
PNC Infratech bags `869cr road project in Uttar Pradesh
DLF readies Bhubaneswar project for commercial ops
Suzlon to set up 3,000MW power project in Telangana
Bajaj likely to export 'V' from next fiscal
Market Outlook
March 10, 2016
Top Picks ★★★★★
Large Cap
Market Cap
CMP
Target
Upside
Company
Rationale
(` Cr)
(`)
(`)
(%)
To outpace battery industry growth due to better technological
Amara Raja Batteries
15,464
905
1,040
14.9
products leading to market share gains in both the automotive
OEM and replacement segments.
Earnings to grow strongly given the MHCV cyclical upturn.
Ashok Leyland
27,648
97
111
14.3
Focus on exports and LCV's provides additional growth
avenue.
Uptick in defense capex by government when coupled with
Bharat Electronics
26,280
1,095
1,414
29.1
BELs strong market positioning, indicate that good times are
ahead for BEL.
The stock is trading at attractive valuations and is factoring all
HCL Tech
1,15,144
817
1,038
27.1
the bad news.
Strong visibility for a robust 20% earnings trajectory, coupled
HDFC Bank
2,59,152
1,026
1,262
23.0
with high quality of earnings on account of high quality retail
business and strategic focus on highly rated corporates.
Back on the growth trend, expect a long term growth of 14%
Infosys
2,70,695
1,179
1,347
14.3
to be a US$20bn in FY2020.
LICHF continues to grow its retail loan book at a healthy pace
with improvement in asset quality. We expect the company to
LIC Housing Finance
23,262
461
592
28.4
post a healthy loan book which is likely to reflect in a strong
earnings growth.
Huge bid pipeline of re-development works at Delhi and other
NBCC
11,177
931
1,089
16.9
State Governments and opportunity from Smart City, positions
NBCC to report strong growth, going forward.
New launches to enable outpace industry growth; margins
TVS Motors
13,521
285
330
16.0
expansion to boost earnings.
Source: Company, Angel Research
Mid Cap
Market Cap
CMP
Target
Upside
Company
Rationale
(` Cr)
(`)
(`)
(%)
Favourable outlook for the AC industry to augur well for
Cooling products business which is out pacing the market
Blue Star
3,031
337
439
30.3
growth. EMPPAC division's profitability to improve once
operating environment turns around.
Economic recovery to have favourable impact on advertising &
circulation revenue growth. Further, the acquisition of a radio
Jagran Prakashan
5,064
155
189
22.0
business (Radio City) would also boost the company's revenue
growth.
Massive capacity expansion along with rail advantage at ICD
Navkar Corporation
2,346
165
265
61.1
as well CFS augurs well for the company
Earnings boost on back of stable material prices and
Radico Khaitan
1,357
102
156
52.9
favourable pricing environment. Valuation discount to peers
provides additional comfort
Strong brands and distribution network would boost growth
Siyaram Silk Mills
935
997
1,354
35.8
going ahead. Stock currently trades at an inexpensive
valuation.
Source: Company, Angel Research
Market Outlook
March 10, 2016
Key Upcoming Events
Global economic events release calendar
Date
Time
Country
Event Description
Unit
Period
Bloomberg Data
Last Reported Estimated
Mar 10, 2016 7:00PM
US
Initial Jobless claims
Thousands
Mar 5
278.00
275.00
7:00AM
China
Consumer Price Index (YoY)
% Change
Feb
1.80
1.80
India
Imports YoY%
% Change
Feb
(11.00)
--
India
Exports YoY%
% Change
Feb
(13.60)
--
6:15PM
Euro Zone
ECB announces interest rates
%
Mar 10
0.05
0.05
Mar 11, 2016 5:30PM
India
Industrial Production YoY
% Change
Jan
(1.30)
0.40
Mar 14, 2016 12:00PM
India
Monthly Wholesale Prices YoY%
% Change
Feb
(0.90)
(0.27)
Mar 15, 2016
US
Producer Price Index (mom)
% Change
Feb
(0.50)
--
Mar 16, 2016 6:00PM
US
Consumer price index (mom)
% Change
Feb
--
(0.20)
6:00PM
US
Housing Starts
Thousands
Feb
1,099.00
1,139.00
6:00PM
US
Building permits
Thousands
Feb
1,202.00
1,203.00
3:00PM
UK
Jobless claims change
% Change
Feb
(14.80)
--
6:45PM
US
Industrial Production
%
Feb
0.92
(0.10)
11:30PM
US
FOMC rate decision
%
Mar 16
0.50
0.50
Mar 17, 2016 3:30PM
Euro Zone
Euro-Zone CPI (YoY)
%
Feb F
(0.20)
--
5:30PM
UK
BOE Announces rates
% Ratio
Mar 17
0.50
0.50
Mar 21, 2016 7:30PM
US
Existing home sales
Million
Feb
5.47
--
Mar 22, 2016 3:00PM
UK
CPI (YoY)
% Change
Feb
0.30
--
Mar 23, 2016 8:30PM
Euro Zone
Euro-Zone Consumer Confidence
Value
Mar A
(8.80)
--
7:30PM
US
New home sales
Thousands
Feb
494.00
--
Mar 24, 2016 2:00PM
Germany
PMI Manufacturing
Value
Mar P
50.50
--
2:00PM
Germany
PMI Services
Value
Mar P
55.30
--
Mar 25, 2016 6:00PM
US
GDP Qoq (Annualised)
% Change
4Q T
1.00
--
Mar 29, 2016 7:30PM
US
Consumer Confidence
S.A./ 1985=100
Mar
92.20
--
Mar 31, 2016 1:25PM
Germany
Unemployment change (000's)
Thousands
Mar
(10.00)
--
2:00PM
UK
GDP (YoY)
% Change
4Q F
1.90
--
Apr 1, 2016
2:00PM
UK
PMI Manufacturing
Value
Mar
50.80
--
6:30AM
China
PMI Manufacturing
Value
Mar
49.00
--
6:00PM
US
Change in Nonfarm payrolls
Thousands
Mar
242.00
--
6:00PM
US
Unnemployment rate
%
Mar
4.90
--
Apr 5, 2016
11:00AM
India
RBI Reverse Repo rate
%
Apr 5
5.75
--
11:00AM
India
RBI Repo rate
%
Apr 5
6.75
--
11:00AM
India
RBI Cash Reserve ratio
%
Apr 5
4.00
--
Apr 13, 2016
China
Exports YoY%
% Change
Mar
(25.40)
--
Apr 15, 2016
7:30AM
China
Industrial Production (YoY)
% Change
Mar
5.90
--
7:30AM
China
Real GDP (YoY)
% Change
1Q
6.80
--
Source: Bloomberg, Angel Research
Market Outlook
March 10, 2016
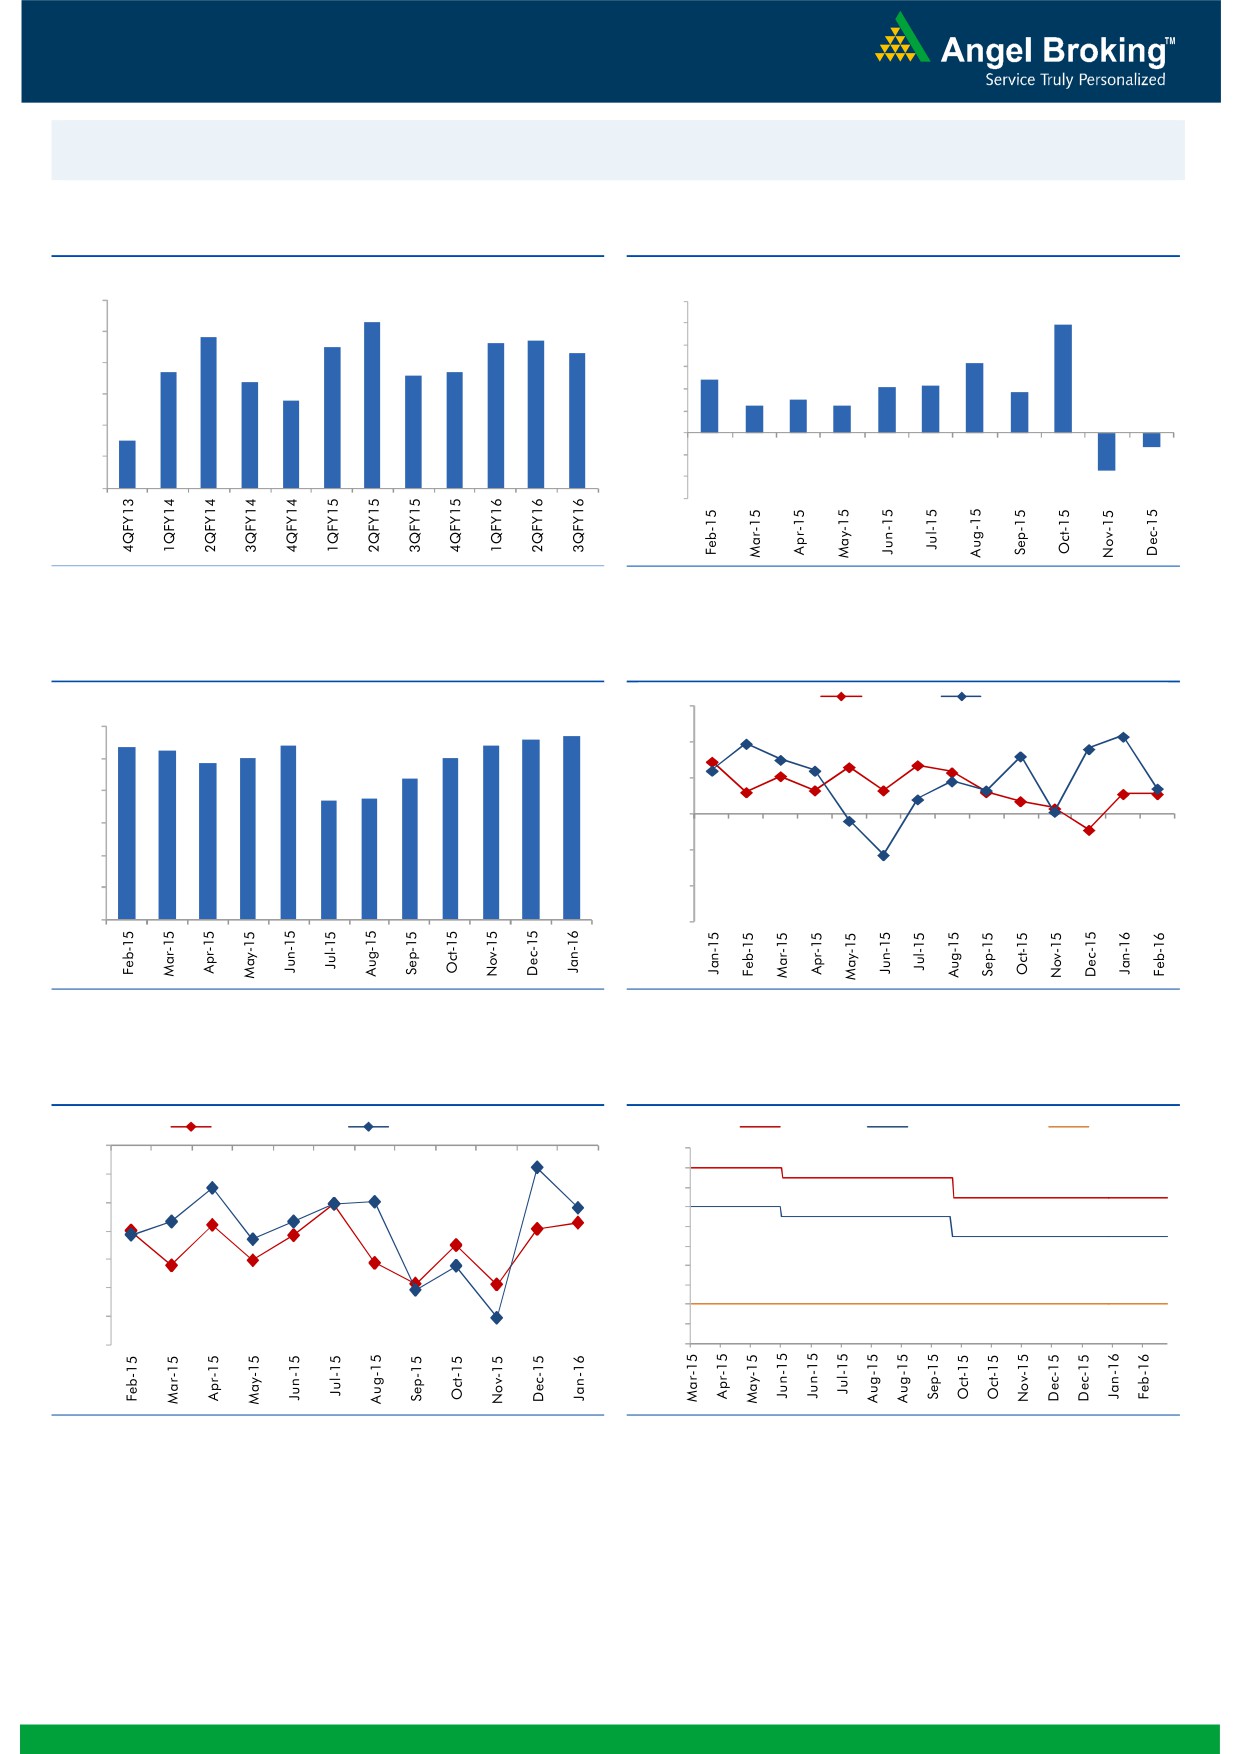
Macro watch
Exhibit 1: Quarterly GDP trends
Exhibit 2: IIP trends
(%)
(%)
9.0
12.0
8.3
9.9
7.8
7.7
10.0
8.0
7.5
7.6
7.3
8.0
6.3
6.7
6.6
6.7
7.0
6.4
4.8
6.0
4.2
4.3
3.7
5.8
4.0
2.5
3.0
2.5
6.0
2.0
5.0
4.5
-
4.0
(2.0)
(1.3)
(4.0)
3.0
(3.4)
(6.0)
Source: CSO, Angel Research
Source: MOSPI, Angel Research
Exhibit 3: Monthly CPI inflation trends
Exhibit 4: Manufacturing and services PMI
Mfg. PMI
Services PMI
(%)
56.0
5.6
5.7
6.0
5.4
5.4
5.4
5.3
4.9
5.0
5.0
54.0
5.0
4.4
52.0
3.7
3.7
4.0
50.0
3.0
48.0
2.0
1.0
46.0
-
44.0
Source: MOSPI, Angel Research
Source: Market, Angel Research; Note: Level above 50 indicates expansion
Exhibit 5: Exports and imports growth trends
Exhibit 6: Key policy rates
(%)
Exports yoy growth
Imports yoy growth
(%)
Repo rate
Reverse Repo rate
CRR
0.0
8.00
7.50
(5.0)
7.00
(10.0)
6.50
(15.0)
6.00
5.50
(20.0)
5.00
(25.0)
4.50
4.00
(30.0)
3.50
(35.0)
3.00
Source: Bloomberg, Angel Research
Source: RBI, Angel Research
Market Outlook
March 10, 2016
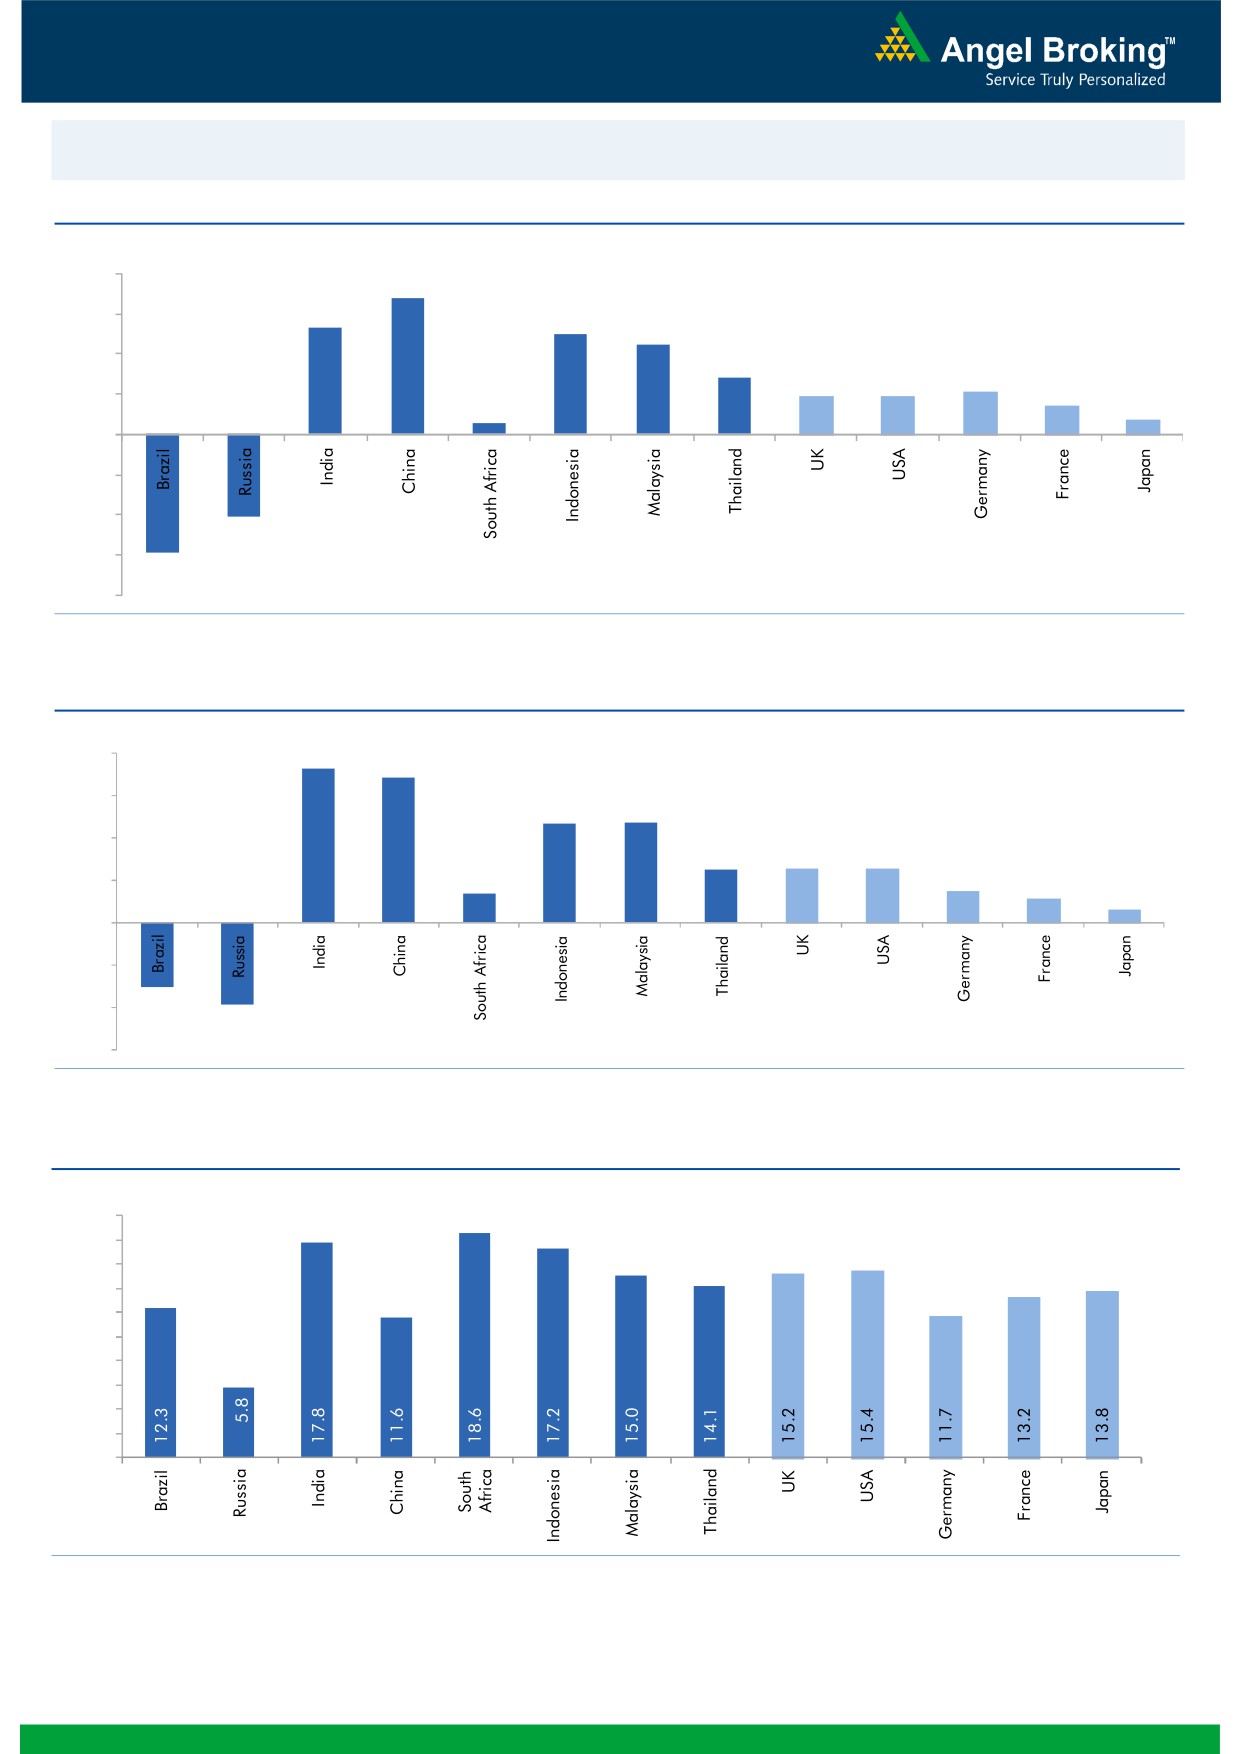
Global watch
Exhibit 1: Latest quarterly GDP Growth (%, yoy) across select developing and developed countries
(%)
8.0
6.8
6.0
5.3
5.0
4.5
4.0
2.8
1.9
1.9
2.1
1.4
2.0
0.6
0.7
-
(2.0)
(4.0)
(4.1)
(6.0)
(5.9)
(8.0)
Source: Bloomberg, Angel Research
Exhibit 2: 2015 GDP Growth projection by IMF (%, yoy) across select developing and developed countries
(%)
8.0
7.3
6.8
6.0
4.7
4.7
4.0
2.5
2.5
2.6
1.4
1.5
2.0
1.2
0.6
-
(2.0)
(3.0)
(4.0)
(3.8)
(6.0)
Source: IMF, Angel Research
Exhibit 3: One year forward P-E ratio across select developing and developed countries
(x)
20.0
18.0
16.0
14.0
12.0
10.0
8.0
6.0
4.0
2.0
-
Source: IMF, Angel Research
Market Outlook
March 10, 2016
Exhibit 4: Relative performance of indices across globe
Returns (%)
Country
Name of index
Closing price
1M
3M
1YR
Brazil
Bovespa
48,665
19.2
8.0
(4.6)
Russia
Micex
1,883
5.3
6.4
8.9
India
Nifty
7,532
0.6
(3.0)
(15.6)
China
Shanghai Composite
2,863
4.1
(20.2)
(12.3)
South Africa
Top 40
45,618
3.7
1.6
(1.2)
Mexico
Mexbol
44,493
4.0
4.3
3.5
Indonesia
LQ45
839
(1.2)
6.2
(11.9)
Malaysia
KLCI
1,686
1.8
0.2
(7.4)
Thailand
SET 50
900
8.7
4.5
(14.3)
USA
Dow Jones
17,000
4.9
(4.7)
(3.6)
UK
FTSE
6,146
8.0
(1.2)
(9.1)
Japan
Nikkei
16,642
(1.1)
(16.5)
(11.6)
Germany
DAX
9,723
8.3
(9.6)
(17.6)
France
CAC
4,426
8.8
(5.5)
(12.0)
Source: Bloomberg, Angel Research
Stock Watch
March 10, 2016
Company Name
Reco
CMP
Target
Mkt Cap
Sales ( Čcr )
OPM(%)
EPS (Č)
PER(x)
P/BV(x)
RoE(%)
EV/Sales(x)
(Č)
Price ( Č)
( Č cr )
FY16E FY17E
FY16E
FY17E
FY16E
FY17E
FY16E
FY17E
FY16E
FY17E
FY16E
FY17E
FY16E
FY17E
Agri / Agri Chemical
Rallis
Neutral
154
-
2,999
2,097
2,415
14.4
14.4
9.5
11.0
16.2
14.0
3.2
2.8
21.1
21.3
1.5
1.3
United Phosphorus
Accumulate
435
480
18,661
12,500
14,375
18.3
18.3
29.8
35.9
14.6
12.1
2.7
2.3
20.0
20.3
1.6
1.3
Auto & Auto Ancillary
Ashok Leyland
Accumulate
97
111
27,648
17,995
21,544
11.4
11.6
3.4
4.7
28.6
20.7
5.0
4.6
17.7
22.2
1.5
1.2
Bajaj Auto
Accumulate
2,314
2,585
66,955
22,709
25,860
20.9
20.1
129.0
143.6
17.9
16.1
5.5
4.7
30.7
29.4
2.5
2.2
Bharat Forge
Accumulate
825
875
19,213
7,351
8,318
19.9
19.7
31.2
36.5
26.5
22.6
4.7
4.0
19.3
19.2
2.8
2.4
Eicher Motors
Neutral
19,934
-
54,142
15,556
16,747
15.5
17.3
464.8
597.5
42.9
33.4
15.7
11.5
36.2
34.3
3.4
3.1
Gabriel India
Accumulate
89
101
1,283
1,415
1,544
8.7
9.0
4.6
5.4
19.4
16.5
3.5
3.1
18.1
18.9
0.9
0.8
Hero Motocorp
Neutral
2,817
-
56,251
28,244
30,532
15.5
15.9
156.7
168.5
18.0
16.7
7.2
6.1
39.9
36.4
1.8
1.7
Jamna Auto Industries Buy
137
160
1,098
1,281
1,473
11.2
11.5
7.6
9.2
18.1
14.9
4.6
3.8
25.4
25.2
0.9
0.8
L G Balakrishnan & Bros Neutral
426
-
669
1,254
1,394
11.6
11.8
35.9
41.7
11.9
10.2
1.6
1.4
13.5
13.8
0.6
0.6
Mahindra and Mahindra Accumulate
1,235
1,364
76,708
38,416
42,904
13.7
13.9
54.8
63.4
22.5
19.5
3.5
3.1
15.4
15.8
1.6
1.4
Maruti
Neutral
3,577
-
108,068
57,865
68,104
16.4
16.7
176.3
225.5
20.3
15.9
3.9
3.4
19.4
21.2
1.6
1.3
Minda Industries
Accumulate
941
1,047
1,492
2,523
2,890
8.7
9.0
55.0
65.4
17.1
14.4
3.3
2.7
19.3
18.7
0.7
0.6
Motherson Sumi
Buy
243
313
32,122
39,343
45,100
8.8
9.1
10.1
12.5
24.0
19.4
7.6
6.0
35.3
34.4
0.9
0.8
Rane Brake Lining
Buy
362
465
286
454
511
11.5
12.0
25.2
31.0
14.4
11.7
2.1
1.9
14.9
16.6
0.8
0.7
Setco Automotive
Neutral
32
-
422
594
741
12.7
13.7
1.7
3.2
18.6
9.9
2.0
1.7
10.4
16.9
1.2
1.0
Tata Motors
Accumulate
348
371
100,403
259,686
273,957
13.0
13.4
25.9
29.5
13.4
11.8
1.8
1.5
8.0
9.0
0.6
0.6
TVS Motor
Buy
285
330
13,521
11,263
13,122
6.9
8.5
9.2
15.0
30.9
19.0
7.1
5.6
22.7
29.6
1.2
1.0
Amara Raja Batteries
Accumulate
905
1,040
15,464
4,892
5,871
17.4
17.6
28.8
37.1
31.4
24.4
7.3
5.9
23.4
24.1
3.1
2.5
Exide Industries
Buy
132
162
11,258
6,950
7,784
14.4
14.8
6.6
7.3
20.1
18.1
2.5
2.3
12.6
12.8
1.3
1.2
Apollo Tyres
Accumulate
172
183
8,735
12,056
12,714
17.2
16.4
23.0
20.3
7.5
8.5
1.3
1.2
17.7
13.6
0.8
0.8
Ceat
Neutral
1,084
-
4,385
6,041
6,597
14.1
13.7
99.5
111.9
10.9
9.7
2.1
1.8
19.6
18.5
0.9
0.8
JK Tyres
Neutral
81
-
1,837
7,446
7,669
15.2
14.0
19.6
18.4
4.1
4.4
1.0
0.9
25.2
19.5
0.6
0.6
Swaraj Engines
Accumulate
855
919
1,062
552
630
14.2
14.7
44.6
54.1
19.2
15.8
4.5
4.1
23.2
25.6
1.8
1.5
Subros
Neutral
88
-
530
1,293
1,527
11.8
11.9
4.2
6.7
21.1
13.2
1.6
1.4
7.7
11.5
0.7
0.6
Indag Rubber
Neutral
164
-
430
283
329
17.0
17.2
13.0
15.4
12.6
10.6
2.8
2.3
21.8
21.6
1.2
1.0
Capital Goods
ACE
Neutral
38
-
376
660
839
4.7
8.2
1.0
3.9
38.0
9.7
1.2
1.1
3.2
11.3
0.7
0.6
BEML
Accumulate
1,058
1,157
4,405
3,277
4,006
6.0
8.9
36.2
64.3
29.2
16.5
2.0
1.8
5.7
11.7
1.4
1.1
Bharat Electronics
Buy
1,095
1,414
26,280
7,737
8,634
16.8
17.2
54.0
61.5
20.3
17.8
2.9
2.6
39.3
45.6
2.5
2.1
Stock Watch
March 10, 2016
Company Name
Reco
CMP
Target
Mkt Cap
Sales ( Čcr )
OPM(%)
EPS (Č)
PER(x)
P/BV(x)
RoE(%)
EV/Sales(x)
(Č)
Price ( Č)
( Č cr )
FY16E
FY17E
FY16E
FY17E
FY16E
FY17E
FY16E
FY17E
FY16E
FY17E
FY16E
FY17E
FY16E
FY17E
Capital Goods
Voltas
Buy
243
353
8,045
5,363
5,963
8.0
9.1
11.0
13.8
22.1
17.6
3.4
3.0
16.2
17.9
1.4
1.3
BGR Energy
Neutral
103
-
741
3,615
3,181
9.5
9.4
16.7
12.4
6.2
8.3
0.6
0.6
10.0
7.0
0.6
0.8
BHEL
Neutral
108
-
26,348
33,722
35,272
10.8
11.7
10.5
14.2
10.3
7.6
0.8
0.7
7.0
9.0
0.9
0.8
Blue Star
Buy
337
439
3,031
3,548
3,977
6.3
6.9
13.7
17.2
24.6
19.6
6.2
4.0
26.1
25.4
0.9
0.8
Crompton Greaves
Neutral
152
-
9,517
13,484
14,687
4.9
6.2
4.5
7.1
33.7
21.4
2.4
2.2
7.2
10.8
0.8
0.8
Greaves Cotton
Neutral
127
-
3,095
1,655
1,755
16.6
16.8
7.4
7.8
17.1
16.3
3.4
3.3
21.1
20.6
1.8
1.7
Inox Wind
Buy
282
458
6,264
4,980
5,943
17.0
17.5
26.6
31.6
10.6
8.9
3.2
2.3
35.0
30.0
1.4
1.1
KEC International
Neutral
115
-
2,963
8,791
9,716
6.1
6.8
5.4
8.2
21.3
14.1
2.1
2.0
10.0
14.0
0.6
0.5
Thermax
Neutral
754
-
8,987
6,413
7,525
7.4
8.5
30.5
39.3
24.7
19.2
3.8
3.3
15.0
17.0
1.4
1.1
Cement
ACC
Neutral
1,245
-
23,372
13,151
14,757
16.4
18.3
63.9
83.4
19.5
14.9
2.5
2.3
13.3
16.1
1.6
1.4
Ambuja Cements
Neutral
204
-
31,705
11,564
12,556
19.4
20.7
8.9
10.1
23.0
20.2
2.9
2.7
12.8
13.8
2.4
2.2
HeidelbergCement
Neutral
71
-
1,604
1,772
1,926
13.3
15.4
1.0
3.0
70.8
23.6
1.8
1.7
2.6
7.9
1.5
1.3
India Cements
Neutral
77
-
2,365
4,216
4,840
18.0
19.5
4.0
9.9
19.3
7.8
0.8
0.7
4.0
9.5
0.9
0.7
JK Cement
Accumulate
548
605
3,832
3,661
4,742
10.1
15.8
7.5
28.5
73.1
19.2
2.2
2.0
7.5
22.9
1.5
1.1
J K Lakshmi Cement
Neutral
298
-
3,511
2,947
3,616
16.7
19.9
11.5
27.2
25.9
11.0
2.5
2.1
9.8
20.8
1.6
1.3
Mangalam Cements
Neutral
183
-
489
1,053
1,347
10.5
13.3
8.4
26.0
21.8
7.0
0.9
0.9
4.3
12.5
0.8
0.6
Orient Cement
Neutral
138
-
2,824
1,854
2,524
21.2
22.2
7.7
11.1
17.9
12.4
2.6
2.2
13.3
15.7
2.3
1.6
Ramco Cements
Neutral
374
-
8,901
4,036
4,545
20.8
21.3
15.1
18.8
24.8
19.9
3.0
2.7
12.9
14.3
2.7
2.3
Shree Cement^
Neutral
11,109
-
38,700
7,150
8,742
26.7
28.6
228.0
345.5
48.7
32.2
7.2
6.0
15.7
20.3
5.2
4.1
UltraTech Cement
Neutral
2,991
-
82,088
24,669
29,265
18.2
20.6
82.0
120.0
36.5
24.9
3.9
3.4
11.3
14.7
3.4
2.9
Construction
ITNL
Neutral
74
-
2,424
7,360
8,825
34.0
35.9
7.0
9.0
10.5
8.2
0.4
0.3
3.2
3.7
3.7
3.6
KNR Constructions
Buy
521
603
1,465
937
1,470
14.3
14.0
44.2
38.6
11.8
13.5
2.4
2.0
15.4
15.4
1.6
1.1
Larsen & Toubro
Accumulate
1,213
1,310
112,984
58,870
65,708
8.3
10.3
42.0
53.0
28.9
22.9
2.0
1.8
8.8
11.2
2.1
1.9
Gujarat Pipavav Port
Neutral
157
-
7,583
629
684
51.0
52.2
6.4
5.9
24.5
26.6
3.2
3.0
15.9
12.7
11.7
10.6
MBL Infrastructures
Buy
139
285
577
2,313
2,797
12.2
14.6
19.0
20.0
7.3
7.0
0.8
0.7
11.3
10.6
1.0
0.9
Nagarjuna Const.
Neutral
70
-
3,878
7,892
8,842
8.8
9.1
3.0
5.3
23.3
13.2
1.2
1.1
5.0
8.5
0.7
0.6
PNC Infratech
Accumulate
491
558
2,518
1,873
2,288
13.2
13.5
24.0
32.0
20.5
15.3
2.0
1.8
12.1
12.3
1.5
1.2
Simplex Infra
Neutral
218
-
1,078
5,955
6,829
10.3
10.5
16.0
31.0
13.6
7.0
0.7
0.7
5.3
9.9
0.7
0.6
Power Mech Projects
Neutral
561
-
825
1,539
1,801
12.8
12.7
59.0
72.1
9.5
7.8
1.4
1.2
18.6
16.8
0.5
0.5
Stock Watch
March 10, 2016
Company Name
Reco
CMP
Target
Mkt Cap
Sales ( Čcr )
OPM(%)
EPS (Č)
PER(x)
P/BV(x)
RoE(%)
EV/Sales(x)
(Č)
Price ( Č)
( Č cr )
FY16E
FY17E
FY16E
FY17E
FY16E
FY17E
FY16E
FY17E
FY16E
FY17E
FY16E
FY17E
FY16E
FY17E
Construction
Sadbhav Engineering
Buy
242
289
4,151
3,481
4,219
10.7
10.8
8.2
11.7
29.5
20.7
2.8
2.5
10.3
13.5
1.5
1.2
NBCC
Buy
931
1,089
11,177
5,816
7,382
6.9
7.7
29.6
39.8
31.5
23.4
5.7
4.5
24.1
26.7
1.7
1.3
MEP Infra
Neutral
40
-
647
1,956
1,876
28.1
30.5
1.3
3.0
30.6
13.3
6.4
4.3
21.2
32.8
1.8
1.7
SIPL
Neutral
91
-
3,203
675
1,042
62.4
64.7
-
-
3.4
3.9
-
-
16.4
11.1
Financials
Allahabad Bank
Neutral
52
-
3,117
8,569
9,392
2.8
2.9
16.3
27.5
3.2
1.9
0.3
0.2
7.6
11.9
-
-
Axis Bank
Buy
417
494
99,310
26,473
31,527
3.5
3.6
35.7
43.5
11.7
9.6
2.0
1.7
17.9
18.9
-
-
Bank of Baroda
Neutral
143
-
32,949
18,485
21,025
1.9
2.0
13.5
21.1
10.6
6.8
0.8
0.7
7.3
10.6
-
-
Bank of India
Neutral
94
-
7,656
15,972
17,271
1.9
2.0
15.3
33.4
6.2
2.8
0.3
0.2
3.6
7.6
-
-
Canara Bank
Neutral
180
-
9,779
15,441
16,945
2.0
2.1
46.6
70.4
3.9
2.6
0.3
0.3
8.0
11.2
-
-
Dena Bank
Neutral
28
-
1,820
3,440
3,840
2.1
2.3
7.3
10.0
3.9
2.8
0.3
0.2
6.1
7.9
-
-
Federal Bank
Neutral
49
-
8,409
3,477
3,999
3.0
3.0
5.0
6.2
9.8
7.8
1.0
0.9
10.6
11.9
-
-
HDFC
Neutral
1,131
-
178,630
10,358
11,852
3.3
3.3
41.1
47.0
27.5
24.1
5.2
4.8
24.7
24.9
-
-
HDFC Bank
Buy
1,026
1,262
259,152
38,309
47,302
4.3
4.3
49.3
61.1
20.8
16.8
3.6
3.1
18.5
19.7
-
-
ICICI Bank
Buy
216
254
125,737
34,279
39,262
3.3
3.3
21.0
24.4
10.3
8.9
1.7
1.5
14.4
14.7
-
-
IDBI Bank
Neutral
68
-
12,939
9,625
10,455
1.8
1.8
8.5
14.2
8.0
4.8
0.5
0.5
5.9
9.3
-
-
Indian Bank
Neutral
103
-
4,923
6,160
6,858
2.5
2.5
24.5
29.8
4.2
3.4
0.3
0.3
7.7
8.6
-
-
LIC Housing Finance
Buy
461
592
23,262
3,101
3,745
2.5
2.5
33.0
40.2
14.0
11.5
2.6
2.2
19.7
20.5
-
-
Oriental Bank
Neutral
91
-
2,739
7,643
8,373
2.4
2.4
37.2
45.4
2.5
2.0
0.2
0.2
8.2
9.4
-
-
Punjab Natl.Bank
Neutral
83
-
16,249
23,638
26,557
2.8
2.8
17.9
27.2
4.6
3.0
0.5
0.4
8.5
12.0
-
-
South Ind.Bank
Neutral
18
-
2,390
1,965
2,185
2.5
2.5
2.5
3.3
7.1
5.4
0.7
0.6
9.5
11.7
-
-
St Bk of India
Neutral
183
-
142,408
79,958
86,061
2.6
2.6
13.4
20.7
13.7
8.9
1.1
1.0
11.5
12.8
-
-
Union Bank
Neutral
127
-
8,703
12,646
14,129
2.3
2.4
31.0
39.1
4.1
3.2
0.4
0.4
9.8
11.4
-
-
Vijaya Bank
Neutral
32
-
2,732
3,536
3,827
1.9
1.9
5.5
6.7
5.8
4.8
0.5
0.4
7.8
8.8
-
-
Yes Bank
Neutral
789
-
33,173
7,190
9,011
3.2
3.3
58.2
69.7
13.6
11.3
2.4
2.1
19.2
19.6
-
-
FMCG
Asian Paints
Neutral
877
-
84,122
16,553
19,160
16.0
16.2
17.7
21.5
49.6
40.8
13.2
11.9
29.4
31.2
4.9
4.2
Britannia
Neutral
2,835
-
34,019
8,481
9,795
14.0
14.1
65.5
78.3
43.3
36.2
20.5
16.8
38.3
41.2
3.9
3.4
Colgate
Neutral
824
-
22,403
4,836
5,490
19.5
19.7
48.5
53.2
17.0
15.5
12.5
10.8
99.8
97.5
4.5
4.0
Dabur India
Accumulate
245
267
43,161
9,370
10,265
17.1
17.2
7.3
8.1
33.5
30.3
10.1
8.2
33.7
30.6
4.5
4.1
GlaxoSmith Con*
Accumulate
5,649
6,118
23,755
4,919
5,742
17.2
17.4
168.3
191.2
33.6
29.5
9.5
8.1
28.8
28.9
4.4
3.7
Stock Watch
March 10, 2016
Company Name
Reco
CMP
Target
Mkt Cap
Sales ( Čcr )
OPM(%)
EPS (Č)
PER(x)
P/BV(x)
RoE(%)
EV/Sales(x)
(Č)
Price ( Č)
( Č cr )
FY16E FY17E
FY16E
FY17E
FY16E
FY17E
FY16E
FY17E
FY16E
FY17E
FY16E
FY17E
FY16E
FY17E
FMCG
Godrej Consumer
Neutral
1,259
-
42,866
10,168
12,886
16.1
16.1
32.1
38.4
39.2
32.8
8.0
7.4
19.7
21.0
4.3
3.4
HUL
Neutral
841
-
181,906
34,940
38,957
17.5
17.7
20.8
24.7
40.4
34.0
45.0
35.9
110.5
114.2
5.0
4.5
ITC
Accumulate
320
359
257,184
36,804
38,776
37.9
37.9
12.2
12.9
26.2
24.8
7.3
6.4
27.7
25.8
6.6
6.2
Marico
Neutral
239
-
30,842
6,551
7,766
15.7
16.0
10.4
12.5
23.0
19.1
6.7
5.6
33.2
32.4
4.6
3.9
Nestle*
Buy
5,204
6,646
50,171
11,291
12,847
22.2
22.3
158.9
184.6
32.7
28.2
17.1
15.4
55.0
57.3
4.3
3.7
Tata Global
Buy
117
144
7,375
8,635
9,072
9.8
9.9
6.5
7.6
18.0
15.4
1.8
1.7
6.8
7.4
0.8
0.8
IT
HCL Tech^
Buy
817
1,038
115,144
42,038
47,503
21.2
21.5
51.5
57.7
15.9
14.2
3.4
2.7
21.5
18.8
2.4
1.9
Infosys
Accumulate
1,179
1,347
270,695
61,850
69,981
27.5
27.5
59.4
65.7
19.8
17.9
4.2
3.6
21.2
20.1
3.7
3.1
TCS
Buy
2,356
2,854
464,272
108,487
122,590
28.3
28.5
122.8
138.4
19.2
17.0
7.3
6.6
38.0
38.9
3.9
3.4
Tech Mahindra
Accumulate
464
530
44,911
26,524
29,177
16.2
17.0
28.8
33.6
16.1
13.8
3.1
2.6
19.3
19.1
1.5
1.3
Wipro
Buy
538
680
133,029
50,808
56,189
23.7
23.8
37.3
40.7
14.4
13.2
2.8
2.5
19.2
17.7
2.1
1.7
Media
D B Corp
Accumulate
321
356
5,899
2,241
2,495
27.8
27.9
21.8
25.6
14.8
12.5
3.9
3.4
26.7
28.5
2.6
2.3
HT Media
Neutral
81
-
1,876
2,495
2,603
11.2
11.2
7.3
8.6
11.0
9.4
0.9
0.8
7.4
8.1
0.3
0.2
Jagran Prakashan
Buy
155
189
5,064
2,170
2,355
27.2
26.2
8.9
9.9
17.4
15.7
3.7
3.2
20.9
20.5
2.2
2.1
Sun TV Network
Neutral
345
-
13,600
2,779
3,196
70.2
70.5
22.8
27.3
15.1
12.6
3.7
3.4
26.7
28.3
4.6
4.0
Hindustan Media
Neutral
262
-
1,924
920
1,031
20.0
20.0
19.2
20.9
13.7
12.6
2.2
1.9
16.4
15.3
1.6
1.4
Ventures
Metals & Mining
Coal India
Buy
323
380
203,703
76,167
84,130
19.9
22.3
22.4
25.8
14.4
12.5
5.2
5.1
35.5
41.0
2.0
1.8
Hind. Zinc
Neutral
172
-
72,760
14,641
14,026
50.4
50.4
17.7
16.0
9.8
10.8
1.5
1.4
16.2
13.2
2.6
2.5
Hindalco
Neutral
81
-
16,768
104,356
111,186
8.7
9.5
6.7
11.1
12.1
7.3
0.4
0.4
3.5
5.9
0.7
0.6
JSW Steel
Neutral
1,180
-
28,521
42,308
45,147
16.4
20.7
(10.3)
49.5
23.8
1.3
1.3
(1.0)
5.6
1.7
1.6
NMDC
Neutral
93
-
36,872
8,237
10,893
46.6
44.5
10.0
11.7
9.4
8.0
1.0
0.9
12.5
13.0
4.3
3.3
SAIL
Neutral
42
-
17,491
45,915
53,954
7.2
10.5
1.5
4.4
28.1
9.7
0.4
0.4
2.3
4.1
1.0
0.9
Vedanta
Neutral
88
-
26,045
71,445
81,910
26.2
26.3
12.9
19.2
6.8
4.6
0.5
0.4
7.2
8.9
0.8
0.6
Tata Steel
Neutral
295
-
28,695
126,760
137,307
8.9
11.3
6.4
23.1
46.4
12.8
0.9
0.9
2.0
7.1
0.8
0.8
Oil & Gas
Cairn India
Neutral
137
-
25,629
11,323
12,490
49.4
51.0
20.7
20.7
6.6
6.6
0.4
0.4
6.4
6.1
1.3
0.7
GAIL
Neutral
350
-
44,409
64,856
70,933
9.1
9.6
24.0
28.9
14.6
12.1
1.3
1.2
8.8
9.6
0.9
0.8
ONGC
Neutral
205
-
175,473
154,564
167,321
36.8
37.4
28.6
32.5
7.2
6.3
0.9
0.8
12.7
13.5
1.3
1.3
Petronet LNG
Neutral
246
-
18,458
29,691
31,188
5.8
6.2
12.8
13.4
19.3
18.3
2.9
2.6
15.8
14.8
0.7
0.7
Indian Oil Corp
Buy
390
455
94,629
359,607
402,760
5.9
6.1
42.5
48.7
9.2
8.0
1.2
1.1
14.1
14.4
0.4
0.3
Stock Watch
March 10, 2016
Company Name
Reco
CMP
Target
Mkt Cap
Sales ( Čcr )
OPM(%)
EPS (Č)
PER(x)
P/BV(x)
RoE(%)
EV/Sales(x)
(Č)
Price ( Č)
( Č cr )
FY16E FY17E
FY16E
FY17E
FY16E
FY17E
FY16E
FY17E
FY16E
FY17E
FY16E
FY17E
FY16E
FY17E
Oil & Gas
Reliance Industries
Accumulate
1,042
1,150
337,604
304,775
344,392
12.6
13.4
91.3
102.6
11.4
10.2
1.3
1.2
11.8
12.0
1.0
0.9
Pharmaceuticals
Alembic Pharma
Neutral
630
-
11,868
3,274
3,802
26.9
19.4
35.0
28.7
18.0
21.9
8.0
6.0
55.6
31.2
3.6
3.0
Aurobindo Pharma
Buy
717
856
41,908
14,923
17,162
22.0
23.0
35.7
42.8
20.1
16.7
5.9
4.4
34.0
30.2
3.2
2.7
Aventis*
Neutral
4,402
-
10,138
2,082
2,371
17.4
20.8
118.2
151.5
37.2
29.1
5.5
4.4
19.9
25.5
4.5
3.8
Cadila Healthcare
Neutral
344
-
35,227
10,224
11,840
21.0
22.0
14.6
17.6
23.6
19.6
6.5
5.1
30.8
29.0
3.5
2.9
Cipla
Accumulate
530
605
42,575
13,979
16,447
20.2
18.6
25.7
27.5
20.6
19.3
3.4
2.9
17.6
16.1
3.0
2.5
Dr Reddy's
Buy
3,219
3,933
54,891
16,838
19,575
25.0
23.1
167.5
178.8
19.2
18.0
4.0
3.4
23.1
20.4
3.2
2.7
Dishman Pharma
Neutral
373
-
3,008
1,733
1,906
21.5
21.5
17.0
19.9
21.9
18.7
2.2
2.0
10.5
11.2
2.3
1.9
GSK Pharma*
Neutral
3,238
-
27,429
2,870
3,158
20.0
22.1
59.5
68.3
54.4
47.4
16.1
16.5
28.5
34.3
9.1
8.3
Indoco Remedies
Neutral
285
-
2,629
1,033
1,199
15.9
18.2
9.4
13.6
30.4
21.0
4.5
3.8
15.7
19.7
2.6
2.3
Ipca labs
Buy
548
900
6,916
3,363
3,909
12.9
18.6
13.4
28.0
40.9
19.6
2.9
2.6
7.4
14.0
2.4
2.0
Lupin
Neutral
1,827
-
82,313
13,092
16,561
25.0
27.0
50.4
68.3
36.3
26.8
7.5
5.9
22.8
24.7
6.0
4.6
Sun Pharma
Accumulate
860
950
206,998
28,163
32,610
25.8
30.7
17.4
26.9
49.4
32.0
4.7
4.1
13.0
16.6
6.8
5.7
Power
Tata Power
Neutral
59
-
15,863
35,923
37,402
22.6
22.8
4.1
5.2
14.5
11.4
1.1
1.0
7.5
9.3
1.4
1.3
NTPC
Buy
126
146
104,223
87,271
99,297
23.5
23.5
11.8
13.3
10.8
9.5
1.2
1.1
11.5
12.2
2.2
2.0
Power Grid
Buy
140
170
73,007
20,702
23,361
86.7
86.4
12.1
13.2
11.6
10.6
1.7
1.5
15.6
15.1
8.5
7.9
Telecom
Bharti Airtel
Neutral
335
-
133,953
101,748
109,191
32.1
31.7
12.0
12.5
27.9
26.8
1.9
1.8
6.9
6.7
2.0
1.8
Idea Cellular
Neutral
106
-
38,237
34,282
36,941
32.0
31.5
5.9
6.2
18.0
17.1
1.7
1.5
9.9
9.3
1.7
1.6
zOthers
Abbott India
Neutral
4,923
-
10,461
2,715
3,153
14.5
14.1
134.3
152.2
36.7
32.3
9.2
7.5
27.4
25.6
3.6
3.0
Bajaj Electricals
Buy
186
237
1,879
4,719
5,287
5.2
5.8
8.6
12.7
21.7
14.7
2.5
2.2
11.4
14.8
0.4
0.4
Finolex Cables
Neutral
231
-
3,537
2,520
2,883
12.2
12.0
12.7
14.2
18.3
16.3
2.5
2.2
13.6
13.5
1.1
1.0
Goodyear India*
Buy
479
582
1,105
1,800
1,600
11.7
11.5
58.7
52.9
8.2
9.1
1.8
1.6
24.6
18.7
0.4
0.4
Hitachi
Neutral
1,146
-
3,117
1,779
2,081
7.8
8.8
21.8
33.4
52.6
34.3
8.5
6.9
17.4
22.1
1.8
1.5
Jyothy Laboratories
Neutral
281
-
5,090
1,620
1,847
11.5
11.5
7.3
8.5
38.6
33.2
5.0
4.6
13.3
14.4
3.0
2.6
MRF
Buy
34,367
45,575
14,576
20,316
14,488
21.4
21.1
5,488.0
3,798.0
6.3
9.1
2.1
1.7
41.1
21.2
0.7
0.9
Page Industries
Neutral
11,141
-
12,427
1,929
2,450
19.8
20.1
229.9
299.0
48.5
37.3
21.4
14.9
52.1
47.1
6.5
5.1
Relaxo Footwears
Neutral
400
-
4,802
1,767
2,152
12.3
12.5
19.3
25.1
20.8
16.0
5.1
3.9
27.7
27.8
2.8
2.3
Siyaram Silk Mills
Buy
997
1,354
935
1,636
1,815
11.5
11.5
89.9
104.1
11.1
9.6
1.8
1.6
17.9
17.8
0.7
0.7
Styrolution ABS India*
Neutral
572
-
1,005
1,271
1,440
8.6
9.2
32.0
41.1
17.8
13.9
1.8
1.6
10.7
12.4
0.8
0.7
Stock Watch
March 10, 2016
Company Name
Reco
CMP
Target
Mkt Cap
Sales ( Čcr )
OPM(%)
EPS (Č)
PER(x)
P/BV(x)
RoE(%)
EV/Sales(x)
(Č)
Price ( Č)
( Č cr )
FY16E
FY17E
FY16E
FY17E
FY16E
FY17E
FY16E
FY17E
FY16E
FY17E
FY16E
FY17E
FY16E
FY17E
zOthers
TVS Srichakra
Buy
2,251
3,217
1,723
2,035
2,252
15.9
15.3
248.6
268.1
9.1
8.4
4.0
2.8
43.6
33.9
0.9
0.7
HSIL
Accumulate
279
302
2,019
2,123
2,384
16.1
16.5
15.0
18.9
18.6
14.8
1.4
1.3
8.0
9.4
1.3
1.1
Kirloskar Engines India
Neutral
210
-
3,036
2,403
2,554
8.6
9.9
9.2
10.5
22.9
20.0
2.2
2.1
9.7
10.7
0.9
0.8
Ltd
M M Forgings
Buy
426
614
514
511
615
21.7
21.6
43.1
55.8
9.9
7.6
1.8
1.5
19.9
21.2
1.2
0.9
Banco Products (India) Neutral
100
-
717
1,208
1,353
11.0
12.3
10.8
14.5
9.3
6.9
1.1
1.0
11.9
14.5
0.6
0.5
Competent Automobiles Neutral
125
-
77
1,040
1,137
3.2
3.1
25.7
28.0
4.9
4.5
0.7
0.6
15.0
14.3
0.1
0.1
Nilkamal
Neutral
1,095
-
1,633
1,871
2,031
10.7
10.5
63.2
69.8
17.3
15.7
2.8
2.4
17.6
16.6
0.9
0.8
Visaka Industries
Buy
108
144
171
1,086
1,197
9.9
10.3
21.5
28.8
5.0
3.7
0.5
0.4
9.6
11.6
0.4
0.3
Transport Corporation of
Neutral
274
-
2,088
2,830
3,350
8.8
9.0
14.4
18.3
19.1
15.0
2.9
2.6
15.4
17.1
0.9
0.7
India
Elecon Engineering
Neutral
56
-
606
1,359
1,482
10.3
13.7
0.8
3.9
69.2
14.3
1.1
1.1
1.6
7.8
0.8
0.7
Surya Roshni
Buy
138
201
606
2,992
3,223
8.1
8.4
14.7
18.3
9.4
7.5
0.9
0.8
9.7
11.0
0.5
0.4
MT Educare
Neutral
156
-
623
286
366
18.3
17.7
7.7
9.4
20.3
16.7
4.3
3.7
20.2
21.1
2.1
1.6
Radico Khaitan
Buy
102
156
1,357
1,517
1,635
12.7
13.4
5.8
7.1
17.5
14.3
1.5
1.4
8.6
9.6
1.4
1.3
Garware Wall Ropes
Buy
295
473
646
862
974
11.2
11.2
24.9
29.6
11.9
10.0
1.8
1.5
15.1
15.4
0.8
0.6
Wonderla Holidays
Neutral
373
-
2,107
206
308
44.0
43.6
9.0
12.9
41.4
28.9
5.7
5.1
13.7
17.8
10.1
6.7
Linc Pen & Plastics
Neutral
188
-
278
340
371
8.3
8.9
10.8
13.2
17.4
14.2
2.8
2.4
16.0
17.1
0.9
0.8
The Byke Hospitality
Neutral
156
-
625
222
287
20.5
20.5
5.6
7.6
27.6
20.6
5.2
4.3
18.9
20.8
2.8
2.2
Interglobe Aviation
Neutral
813
-
29,290
17,022
21,122
20.7
14.5
63.9
53.7
12.7
15.1
19.1
15.6
149.9
103.2
1.8
1.4
Coffee Day Enterprises
Neutral
231
-
4,760
2,692
2,964
17.0
18.6
-
4.7
-
48.8
2.8
2.7
0.2
5.5
2.2
2.0
Ltd
Navneet Education
Neutral
81
-
1,938
998
1,062
24.1
24.0
5.8
6.1
14.1
13.4
3.1
2.7
22.0
20.6
2.0
1.9
Navkar Corporation
Buy
165
265
2,346
365
436
38.3
37.5
5.6
5.9
29.2
28.0
1.8
1.7
6.3
6.1
7.2
6.2
Source: Company, Angel Research; Note: *December year end; #September year end; &October year end; Price as on March 09, 2016
Market Outlook
March 10, 2016
Research Team Tel: 022 - 39357800
DISCLAIMER
Angel Broking Private Limited (hereinafter referred to as “Angel”) is a registered Member of National Stock Exchange of India Limited,
Bombay Stock Exchange Limited and Metropolitian Stock Exchange of India Limited. It is also registered as a Depository Participant with
CDSL and Portfolio Manager with SEBI. It also has registration with AMFI as a Mutual Fund Distributor. Angel Broking Private Limited is a
registered entity with SEBI for Research Analyst in terms of SEBI (Research Analyst) Regulations, 2014 vide registration number
INH000000164. Angel or its associates has not been debarred/ suspended by SEBI or any other regulatory authority for accessing
/dealing in securities Market. Angel or its associates including its relatives/analyst do not hold any financial interest/beneficial ownership
of more than 1% in the company covered by Analyst. Angel or its associates/analyst has not received any compensation / managed or co
-managed public offering of securities of the company covered by Analyst during the past twelve months. Angel/analyst has not served as
an officer, director or employee of company covered by Analyst and has not been engaged in market making activity of the company
covered by Analyst.
This document is solely for the personal information of the recipient, and must not be singularly used as the basis of any investment
decision. Nothing in this document should be construed as investment or financial advice. Each recipient of this document should make
such investigations as they deem necessary to arrive at an independent evaluation of an investment in the securities of the companies
referred to in this document (including the merits and risks involved), and should consult their own advisors to determine the merits and
risks of such an investment.
Reports based on technical and derivative analysis center on studying charts of a stock's price movement, outstanding positions and
trading volume, as opposed to focusing on a company's fundamentals and, as such, may not match with a report on a company's
fundamentals.
The information in this document has been printed on the basis of publicly available information, internal data and other reliable sources
believed to be true, but we do not represent that it is accurate or complete and it should not be relied on as such, as this document is for
general guidance only. Angel Broking Pvt. Limited or any of its affiliates/ group companies shall not be in any way responsible for any
loss or damage that may arise to any person from any inadvertent error in the information contained in this report. Angel Broking Pvt.
Limited has not independently verified all the information contained within this document. Accordingly, we cannot testify, nor make any
representation or warranty, express or implied, to the accuracy, contents or data contained within this document. While Angel Broking
Pvt. Limited endeavors to update on a reasonable basis the information discussed in this material, there may be regulatory, compliance,
or other reasons that prevent us from doing so.
This document is being supplied to you solely for your information, and its contents, information or data may not be reproduced,
redistributed or passed on, directly or indirectly.
Neither Angel Broking Pvt. Limited, nor its directors, employees or affiliates shall be liable for any loss or damage that may arise from or
in connection with the use of this information.
Note: Please refer to the important ‘Stock Holding Disclosure' report on the Angel website (Research Section). Also, please refer to the
latest update on respective stocks for the disclosure status in respect of those stocks. Angel Broking Pvt. Limited and its affiliates may have
investment positions in the stocks recommended in this report.