Market Outlook
February 10, 2016
`
Market Cues
Domestic Indices
Chg (%)
(Pts)
(Close)
Indian markets are likely to open weak tracking the SGX Nifty. SGX Nifty was down
BSE Sensex
(1.1)
(266)
24,021
70 points.
Nifty
(1.2)
(89)
7,298
US markets eventually ended in red after a lackluster performance as traders kept a
Mid Cap
(1.9)
(197)
10,114
close eye on the price of crude oil, which saw considerable volatility on the day.
Small Cap
(1.3)
(141)
10,426
Traders may also have been looking ahead to remarks by Janet Yellen, who is
Bankex
(1.2)
(210)
16,863
scheduled to testify before the House Financial Services Committee today. The
Energy Information Administration (EIA) is also due to release its weekly oil
inventories report today, potentially driving the price of crude oil.
Global Indices
Chg (%)
(Pts)
(Close)
Dow Jones
(0.1)
(13)
16,014
The European markets ended in negative territory, extending their losing streak to a
seventh session. Concerns about global growth prospects continue to plague the
Nasdaq
(0.3)
(15)
4,269
markets. Bank stocks also continued to get hammered due to concerns over troubled
FTSE
(1.0)
(57)
5,632
loans.
Nikkei
(5.4)
(919)
16,085
Indian shares followed global peers lower on Tuesday as concerns over oil price
Hang Seng
0.5
105
19,288
volatility, slowing global growth and speculation over the Federal Reserve raising
Shanghai Com
(0.6)
(18)
2,763
rates further in March sent investors fleeing riskier assets.
Advances / Declines
BSE
NSE
News & Result Analysis
Result Review: Dr Reddys Labs, Aurobindo Pharmaceuticals, Punjab National
Advances
779
363
Bank
Declines
1,831
1,178
Result Preview: Cipla
Unchanged
108
84
Detailed analysis on Pg2
Investor’s Ready Reckoner
Volumes (` Cr)
Key Domestic & Global Indicators
BSE
2,199
Stock Watch: Latest investment recommendations on 150+ stocks
NSE
14,857
Refer P6 onwards
Net Inflows (` Cr)
Net
Mtd
Ytd
Top Picks
CMP
Target
Upside
FII
(39)
(663)
(10,803)
Company
Sector
Rating
(`)
(`)
(%)
MFs
(3)
(783)
78,659
Amara Raja Batteries Auto & Auto Ancillary
Buy
866
1,040
20.1
HCL Tech
IT
Buy
812
1,038
27.9
Top Gainers
Price (`)
Chg (%)
Larsen & Toubro
Construction
Buy
1,114
1,646
47.7
Lupin
1,904
4.7
LIC Housing Finance Financials
Buy
425
592
39.3
Jppower
6
4.4
Navkar Corporation Others
Buy
185
265
43.2
More Top Picks on Pg5
Gppl
158
3.4
Sunpharma
854
2.2
Key Upcoming Events
Srf
1,157
2.0
Previous
Consensus
Date
Region
Event Description
Reading
Expectations
Feb 10 India
Exports YoY% (% Change)
(14.70)
--
Top Losers
Price (`)
Chg (%)
Feb 10 India
Imports YoY% (% Change)
(3.90)
--
Denabank
31
(12.1)
Feb 12 India
Industrial Production YoY (% Change)
(3.20)
--
Mothersumi
241
(11.1)
Feb 12 Euro Zone
Euro Zone GDP
0.30
0.30
Justdial
502
(7.9)
Pnb
88
(6.9)
Star
1,032
(6.9)
As on February 09, 2016
Market Outlook
February 10, 2016
Result Review
Dr Reddys Labs (CMP: `2,960 / TP: `3,933/ Upside: 32.9%)
Dr Reddys Labs, posted results below expectations both on top and bottom-line.
For 3QFY2016, the company posted sales of `3968cr V/s `4420cr expected and
`3843cr in 3QFY2015, a yoy growth of 3.0%. The lower than expected sales
performance is on back of the Emerging market ( `639.9cr) which dipped by
28.0% yoy. Russia with sales of `310cr, declined by 21% yoy, on back of
deprecation of Rubble. In constant currency the region posted a yoy growth of 5%.
Revenue from other CIS countries and Romania (~`90cr) posted a yoy dip of 17%.
ROW (`240cr) posted a dip of 38% yoy on back of the calibrated sales of
Venezuela.
The key regions-USA (`1941.7cr) posted a robust growth of 18% yoy, Europe
(`194cr) posted a yoy growth of 14% and India did sales of `581cr, a yoy growth
of 34%( aided by the UCB acquired brands). Overall generic segment posted a
sales growth of 7% yoy, while PSAI segment posted a sales de-growth of 17%.
On operating front, the OPM’s have come in at 25.5% V/s 27.1% expected and
V/s 23.0% during the last corresponding period, on back of improved sales mix.
R&D expenditure, during the quarter came in at 10.3% of sales V/s 11.2% of sales
expected. The dip is mainly on back of due to the receipt of company’s share of
the development costs and other contractual amounts from Merck Serono for
biosimilars development programme.
Also, the other income during the quarter came in at `12.2cr ( on account of
`63.7cr forex losses ) V/s `34.1cr during the last corresponding period along with
the 30% dip in tax outgo lead the company to post a net profit of `579cr V/s
`746cr expected V/s `574cr in 3QFY2015, a yoy growth of 1.0%. We maintain
our buy with a price target of `3,933.
Y/E
Sales OPM
PAT
EPS ROE P/E P/BV EV/EBITDA EV/Sales
Mar
(` cr)
(%)
(` cr)
(`)
(%) (x) (x)
(x)
(x)
FY2016E
16,838
25.0
2,854
167.5 23.1 17.7
3.7
11.7
2.9
FY2017E
19,575
23.1
3,046
178.8 20.4 16.6
3.1
10.7
2.5
Aurobindo Pharmaceuticals (CMP: `743/ TP: `856 / Upside: 15.2%)
The company disappointed on the revenue front which came in below expectations
growing by 9.2% yoy to `3,432cr. This was against our expectations of `3,800cr.
The key markets like USA (`1571cr) posted a yoy growth of 30.8%, Europe
(`779cr) posted a de-growth of 9.6%, ROW (`182cr) posted a yoy growth of
36.2% and ARV (`305cr) posted an de-growth of 8.5%.
On the operating front, the gross margins came in as expected at 54.7% V/s
49.6% in 3QFY2015, which aided the OPM’s to come in at 22.7% V/s 18.7%
during the last corresponding period. Thus, the Adj. Net profit of the company rose
to `525cr V/s `399cr in 3QFY2015, yoy growth of 31.7%. We maintain our buy
rating on the stock with a price target of `856.
Y/E
Sales OPM
PAT
EPS ROE P/E P/BV EV/EBITDA EV/Sales
Mar
(` cr)
(%)
(` cr)
(`)
(%) (x) (x)
(x)
(x)
FY2016E
14,823
22.0
2,084
35.7 34.0 20.8
6.1
14.9
3.3
FY2017E
17,162
23.0
2,498
42.8 30.2 17.4
4.6
12.2
2.8
Market Outlook
February 10, 2016
Punjab National Bank (CMP: `88 / TP: -/ Upside: -)
PNB has come out with a very disappointing set of results for the quarter. Though
results were expected to be bad however, the quantum of rise in Gross NPAs has
surprised us. The Gross NPAs has gone up by 37.7% QoQ and now stands at
8.47% vs 6.36% in 2QFY16. This 210 bps rise in GNPAs doesn’t seem to be the
end of the pain as the bank is expected to report similar set of rise in NPA levels
during Q4FY16. Net NPAs stood at 5.86 % vs 3.99% a rise of 187 bps QoQ.
During the quarter the bank recognised loans worth over `5,000cr from the RBI’s
Asset Quality Review accounts as NPA and hence the overall rise in NPAs. We
don’t expect asset quality to stabilise any time soon for the bank. We maintain our
NEUTRAL view on the stock.
Result Preview
Cipla (CMP: `557 / TP: `637/ Upside: 14.4%)
For 3QFY2016, the company is expected to post a robust growth. The sales are
expected to come in at `3,367cr V/s `2,625cr in 3QFY2015, a yoy growth of
28.3%, mainly lead by exports. On the operating front, the OPM’s are expected to
come in at 19.9% V/s 15.7% in 3QFY2015. Thus the Adj. net profit is expected to
come in at `400cr V/s `328cr in 3QFY2015, registering a yoy growth of 24.9%.
We maintain our accumulate view on the stock, with a price target of `637.
Y/E
Sales OPM
PAT
EPS ROE P/E P/BV EV/EBITDA EV/Sales
Mar
(` cr)
(%)
(` cr)
(`)
(%)
(x)
(x)
(x)
(x)
FY2016E
14,121
20.6
2,854
27.0 18.4 20.6
3.5
15.4
3.2
FY2017E
16,611
19.0
2,324
28.9 16.8 19.2
3.0
13.8
2.6
Quarterly Bloomberg Brokers Consensus Estimate
ACC Ltd.Consol - February 10, 2016
Particulars (` cr)
4QCY15E
4QCY14
y-o-y (%)
3QCY15
q-o-q (%)
Net sales
2,861
2,762
3.6
2,740
4.4
EBITDA
261
257
1.6
313
(16.6)
EBITDA margin (%)
9.1
9.3
11.4
Net profit
137
326
(58.0)
115
19.1
Ambuja Cement Ltd. - February 10, 2016
Particulars (` cr)
4QCY15E
4QCY14
y-o-y (%)
3QCY15
q-o-q (%)
Net sales
2,359
2,378
(0.8)
2,095
12.6
EBITDA
326
358
(8.9)
310
5.2
EBITDA margin (%)
13.8
15.1
14.8
Net profit
187
325
(42.5)
153
22.2
Cipla Ltd. Consol - February 10, 2016
Particulars (` cr)
3QFY16E
3QFY15
y-o-y (%)
2QFY16
q-o-q (%)
Net sales
3,334
2,624
27.1
3,361
(0.8)
EBITDA
698
553
26.2
789
(11.5)
EBITDA margin (%)
20.9
21.1
23.5
Net profit
402
327
22.9
431
(6.7)
Market Outlook
February 10, 2016
TATA Chemical Ltd.Consol - February 10, 2016
Particulars (` cr)
3QFY16E
3QFY15
y-o-y (%)
2QFY16
q-o-q (%)
Net sales
4,888
4,715
3.7
4,948
(1.2)
EBITDA
626
589
6.3
641
(2.3)
EBITDA margin (%)
12.8
12.5
13.0
Net profit
254
238
6.7
254
0.0
Economic and Political News
Centre aims at doubling oil and gas production in North East by 2030
US keen to participate in all 100 Smart City projects
India likely to spend $1 trillion on power by 2030: Piyush Goyal
Corporate News
Mahindra to upgrade software in TUV300 AMT models
Tribunal stays CCI fines on IndiGo, SpiceJet
Court Rejects Sun Union's Plea Against Transfers
Market Outlook
February 10, 2016
Top Picks
Large Cap
M
arket Cap
CM
P
T
arget
Upsid
e
Company
Rationale
(` Cr)
(`)
(`)
(%)
To outpace battery industry growth due to better technological
Amara Raja Batteries
14,797
866
1,040
20.1
products leading to market share gains in both the automotive
OEM and replacement segments.
Earnings to grow strongly given the MHCV cyclical upturn.
Ashok Leyland
25,143
88
111
25.6
Focus on exports and LCV's provides additional growth
avenue.
The stock is trading at attractive valuations and is factoring all
HCL Tech
1,14,415
812
1,038
27.9
the bad news.
Strong visibility for a robust 20% earnings trajectory, coupled
HDFC Bank
2,59,177
1,026
1,262
23.0
with high quality of earnings on account of high quality retail
business and strategic focus on highly rated corporates.
Back on the growth trend, expect a long term growth of 14%
Infosys
2,54,800
1,109
1,347
21.4
to be a US$20bn in FY2020.
Well positioned to benefit from such expected gradual
recovery in the overall domestic capex cycle, given its presence
Larsen & Toubro
1,03,779
1,114
1,646
47.7
across various infrastructure segments, its execution
capabilities, and its strong balance sheet.
LICHF continues to grow its retail loan book at a healthy pace
with improvement in asset quality. We expect the company to
LIC Housing Finance
21,431
425
592
39.3
post a healthy loan book which is likely to reflect in a strong
earnings growth.
Source: Company, Angel Research
Mid Cap
M
arket Cap
CM
P
T
arget
Upsid
e
Company
Rationale
(` Cr)
(`)
(`)
(%)
Favourable outlook for the AC industry to augur well for
Cooling products business which is out pacing the market
Blue Star
3,082
343
439
28.1
growth. EMPPAC division's profitability to improve once
operating environment turns around.
Change in business focus towards high-margin chronic &
Garware Wall Ropes
737
337
473
40.4
lifestyle segments and increasing penetration in Europe and
US
Economic recovery to have favourable impact on advertising &
circulation revenue growth. Further, the acquisition of a radio
Jagran Prakashan
5,218
160
189
18.4
business (Radio City) would also boost the company's revenue
growth.
Massive capacity expansion along with rail advantage at ICD
Navkar Corporation
2,639
185
265
43.2
as well CFS augurs well for the company
Earnings boost on back of stable material prices and
Radico Khaitan
1,424
107
156
45.7
favourable pricing environment. Valuation discount to peers
provides additional comfort
Strong brands and distribution network would boost growth
Siyaram Silk Mills
986
1,052
1,354
28.7
going ahead. Stock currently trades at an inexpensive
valuation.
Structural shift in the Lighting industry towards LED lighting will
Surya Roshni
622
142
201
41.6
drive growth.
Source: Company, Angel Research
Market Outlook
February 10, 2016
Key Upcoming Events
Result Calendar
Date
Company
Tata Chemicals, Tata Global, Automotive Axle, Areva, Ambuja Cements, ACC, India Cements, Rural Elec.Corp., IOB,
Feb 10, 2016
UCO Bank, Bank of Maharashtra, Petronet LNG, Bajaj Electrical, Finolex Cables, Surya Roshni, Cipla, GSK Pharma,
Orchid Chemicals, NHPC
Tata Motors, Hero Motocorp, Ashok Leyland, BHEL, BGR Energy , J & K Bank, St Bk of India, Bank of India, Union
Feb 11, 2016
Bank, Indian Bank, Oriental Bank, Coal India, Nalco, ONGC, Indraprasth Gas, Page Industries, GIPCL, Unitech,
Coffee Day Enterprises Ltd
M&M, FAG Bearings, CEAT, Canara Bank, IDBI Bank, Andhra Bank, Corporation Bank, Nestle, Sun TV Network,
Feb 12, 2016
NMDC, Bhushan Steel, Monnet Ispat, IOC, BPCL, HPCL, Sun Pharma, Adani Power, Anant Raj
Feb 13, 2016
Bank of Baroda, Jindal Steel, MM Forging, HDIL, Competent Automobiles
Source: Bloomberg, Angel Research
Global economic events release calendar
Date
Time
Country
Event Description
Unit
Period
Bloomberg Data
Last Reported Estimated
Feb 10, 2016 3:00PM UK
Industrial Production (YoY)
% Change
Dec
0.90
1.00
Feb 11, 2016 7:00PM US
Initial Jobless claims
Thousands
Feb 6
285.00
280.00
Feb 12, 2016
India
Imports YoY%
% Change
Jan
(3.90)
--
India
Exports YoY%
% Change
Jan
(14.70)
--
5:30PM India
Industrial Production YoY
% Change
Dec
(3.20)
(0.30)
3:30PM Euro Zone
Euro-Zone GDP s.a. (QoQ)
% Change
4Q A
0.30
0.30
12:30PM Germany
GDP nsa (YoY)
% Change
4Q P
1.80
1.70
Feb 15, 2016 12:00PM India
Monthly Wholesale Prices YoY%
% Change
Jan
(0.73)
(0.12)
China
Exports YoY%
% Change
Jan
(1.40)
(2.00)
Feb 16, 2016 3:00PM UK
CPI (YoY)
% Change
Jan
0.20
--
Feb 17, 2016 7:00PM US
Housing Starts
Thousands
Jan
1,149.00
1,175.00
7:00PM US
Building permits
Thousands
Jan
1,204.00
1,200.00
3:00PM UK
Jobless claims change
% Change
Jan
(4.30)
--
7:45PM US
Industrial Production
%
Jan
(0.36)
0.30
US
Producer Price Index (mom)
% Change
Jan
(0.70)
--
Feb 18, 2016 7:00AM China
Consumer Price Index (YoY)
% Change
Jan
1.60
1.90
Feb 19, 2016 7:00PM US
Consumer price index (mom)
% Change
Jan
(0.10)
(0.10)
8:30PM Euro Zone
Euro-Zone Consumer Confidence
Value
Feb A
(6.30)
--
Feb 22, 2016 2:00PM Germany
PMI Services
Value
Feb P
55.00
--
2:00PM Germany
PMI Manufacturing
Value
Feb P
52.30
--
Feb 23, 2016 8:30PM US
Existing home sales
Million
Jan
5.46
--
8:30PM US
Consumer Confidence
S.A./ 1985=100
Feb
98.10
--
Feb 24, 2016 8:30PM US
New home sales
Thousands
Jan
544.00
--
Feb 25, 2016 3:00PM UK
GDP (YoY)
% Change
4Q P
1.90
--
3:30PM Euro Zone
Euro-Zone CPI (YoY)
%
Jan F
0.40
--
Feb 26, 2016 7:00PM US
GDP Qoq (Annualised)
% Change
4Q S
0.70
--
Source: Bloomberg, Angel Research
Market Outlook
February 10, 2016
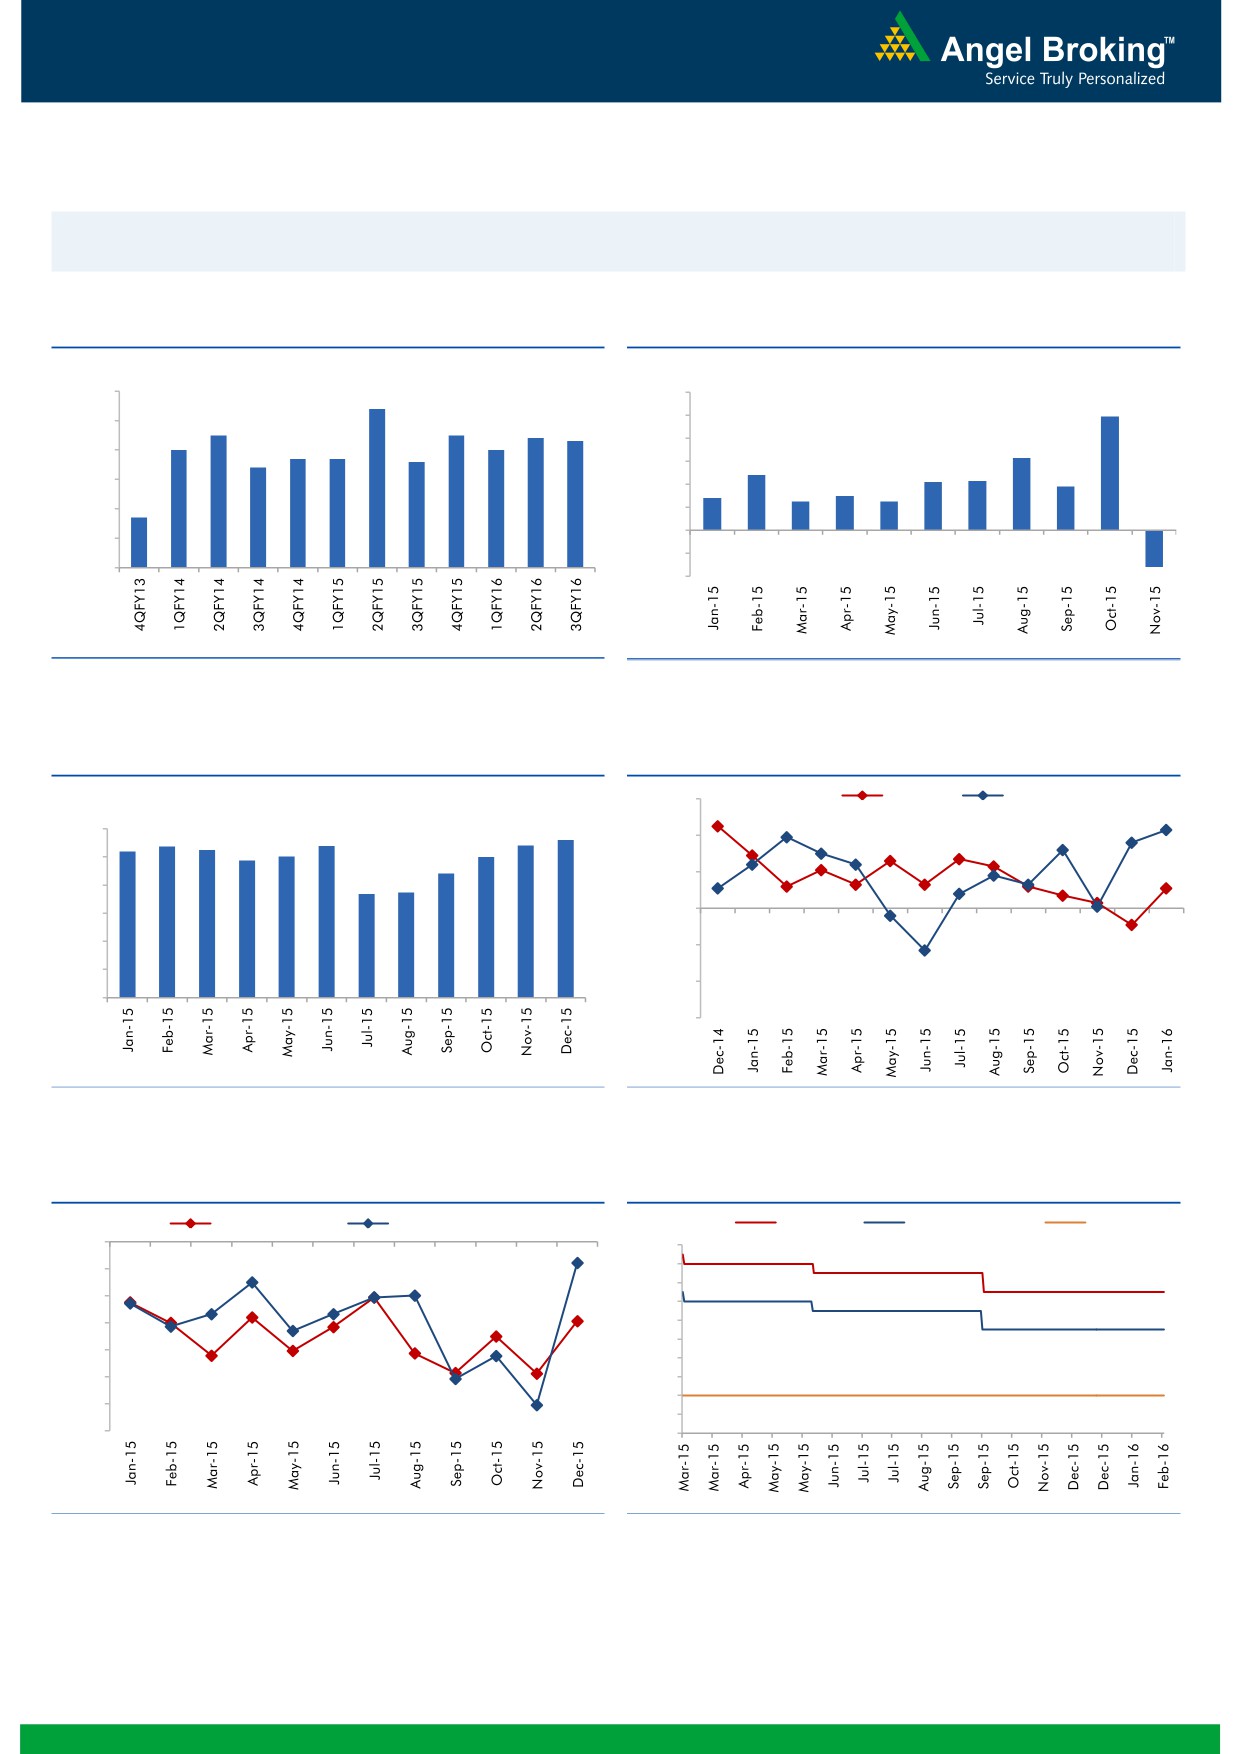
Macro watch
Exhibit 1: Quarterly GDP trends
Exhibit 2: IIP trends
(%)
(%)
9.0
8.4
12.0
9.9
7.5
7.5
10.0
8.0
7.4
7.3
7.0
7.0
6.7
6.7
6.6
8.0
6.3
7.0
6.4
6.0
4.8
4.3
4.2
3.8
6.0
2.8
3.0
4.0
2.5
2.5
4.7
5.0
2.0
(3.2)
-
4.0
(2.0)
3.0
(4.0)
Source: CSO, Angel Research
Source: MOSPI, Angel Research
Exhibit 3: Monthly CPI inflation trends
Exhibit 4: Manufacturing and services PMI
(%)
56.0
Mfg. PMI
Services PMI
5.4
5.4
5.6
6.0
5.2
5.4
5.3
54.0
4.9
5.0
5.0
5.0
4.4
3.7
3.7
52.0
4.0
3.0
50.0
2.0
48.0
1.0
46.0
-
44.0
Source: MOSPI, Angel Research
Source: Market, Angel Research; Note: Level above 50 indicates expansion
Exhibit 5: Exports and imports growth trends
Exhibit 6: Key policy rates
(%)
Exports yoy growth
Imports yoy growth
(%)
Repo rate
Reverse Repo rate
CRR
0.0
8.00
(5.0)
7.50
7.00
(10.0)
6.50
(15.0)
6.00
5.50
(20.0)
5.00
(25.0)
4.50
4.00
(30.0)
3.50
(35.0)
3.00
Source: Bloomberg, Angel Research
Source: RBI, Angel Research
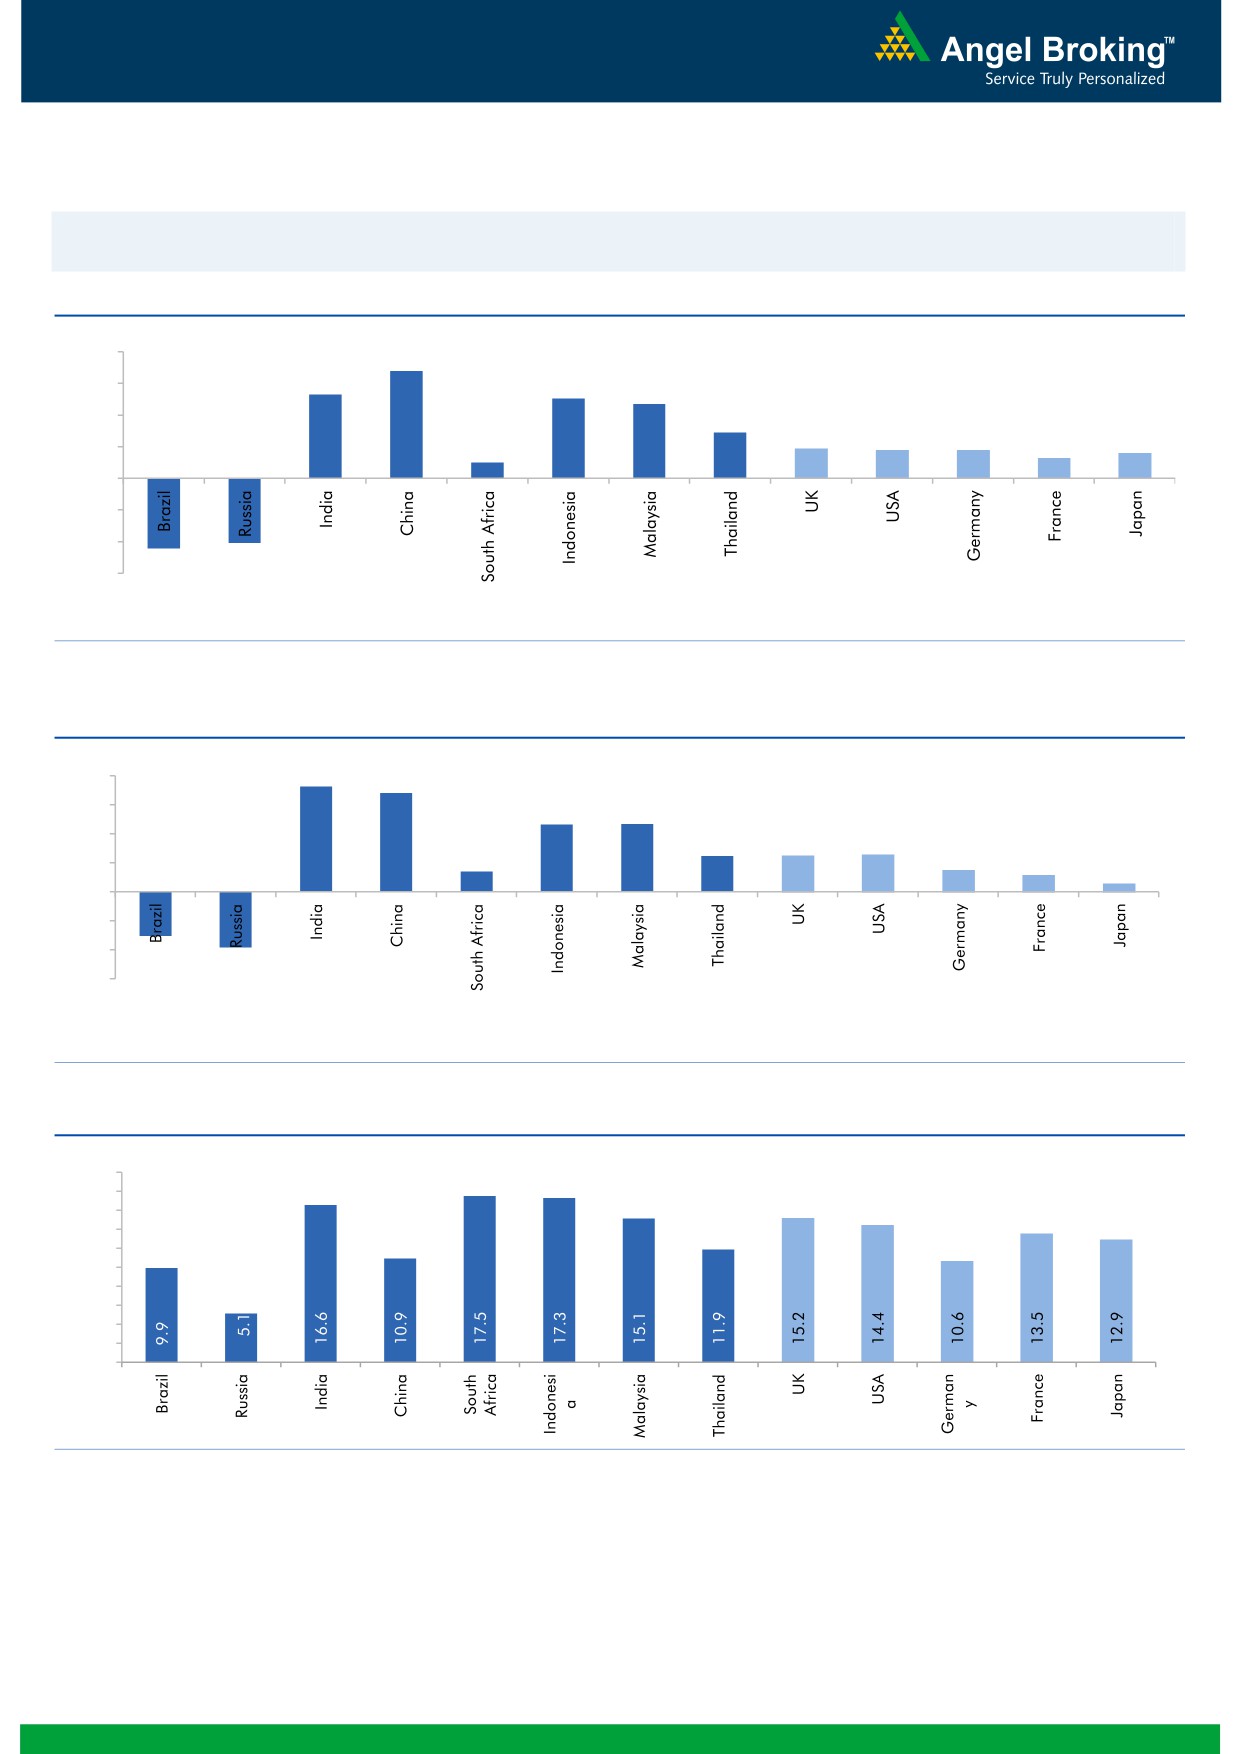
Market Outlook
February 10, 2016
Global watch
Exhibit 1: Latest quarterly GDP Growth (%, yoy) across select developing and developed countries
(%)
8.0
6.8
5.3
5.0
6.0
4.7
4.0
2.9
1.9
1.8
1.8
1.3
1.6
2.0
1.0
-
(2.0)
(4.0)
(4.1)
(4.5)
(6.0)
Source: Bloomberg, Angel Research
Exhibit 2: 2015 GDP Growth projection by IMF (%, yoy) across select developing and developed countries
(%)
7.3
8.0
6.8
6.0
4.7
4.7
4.0
2.5
2.5
2.6
1.4
1.5
1.2
2.0
0.6
(3.8)
-
(2.0)
(4.0)
(3.0)
(6.0)
Source: IMF, Angel Research
Exhibit 3: One year forward P-E ratio across select developing and developed countries
(x)
20.0
18.0
16.0
14.0
12.0
10.0
8.0
6.0
4.0
2.0
-
Source: IMF, Angel Research
Market Outlook
February 10, 2016
Exhibit 4: Relative performance of indices across globe
Returns (%)
Country
Name of index
Closing price
1M
3M
1YR
Brazil
Bovespa
40,592
(4.3)
(11.0)
(14.9)
Russia
Micex
1,723
(1.4)
(2.4)
(1.8)
India
Nifty
7,298
(3.6)
(8.3)
(16.3)
China
Shanghai Composite
2,763
(17.8)
(23.0)
(16.4)
South Africa
Top 40
42,975
(0.6)
(9.6)
(6.3)
Mexico
Mexbol
42,399
4.3
(6.2)
(1.0)
Indonesia
LQ45
838
6.2
5.6
(7.7)
Malaysia
KLCI
1,662
0.5
(0.2)
(7.8)
Thailand
SET 50
822
5.6
(10.0)
(22.2)
USA
Dow Jones
16,014
(3.0)
(10.4)
(10.4)
UK
FTSE
5,632
(3.7)
(8.8)
(14.5)
Japan
Nikkei
16,085
(8.5)
(11.9)
(5.5)
Germany
DAX
8,879
(9.8)
(18.4)
(17.4)
France
CAC
3,998
(7.8)
(18.6)
(15.9)
Source: Bloomberg, Angel Research
Stock Watch
February 10, 2016
Company Name
Reco
CMP
Target
Mkt Cap
Sales ( Čcr )
OPM(%)
EPS (Č)
PER(x)
P/BV(x)
RoE(%)
EV/Sales(x)
(Č)
Price ( Č)
( Č cr )
FY16E FY17E
FY16E
FY17E
FY16E
FY17E
FY16E
FY17E
FY16E
FY17E
FY16E
FY17E
FY16E
FY17E
Agri / Agri Chemical
Rallis
Neutral
162
-
3,159
2,097
2,415
14.4
14.4
9.5
11.0
17.1
14.8
3.4
2.9
21.1
21.3
1.5
1.3
United Phosphorus
Buy
391
480
16,748
12,500
14,375
18.3
18.3
29.8
35.9
13.1
10.9
2.4
2.0
20.0
20.3
1.4
1.2
Auto & Auto Ancillary
Ashok Leyland
Buy
88
111
25,143
17,995
21,544
11.4
11.6
3.4
4.7
26.0
18.8
4.6
4.2
17.7
22.2
1.4
1.1
Bajaj Auto
Accumulate
2,378
2,728
68,801
23,695
27,298
21.3
20.4
134.6
151.5
17.7
15.7
5.6
4.8
31.8
30.6
2.5
2.1
Bharat Forge
Buy
780
943
18,158
7,867
8,881
20.0
20.3
34.4
41.0
22.7
19.0
4.4
3.6
21.1
20.9
2.4
2.1
Eicher Motors
Accumulate
18,176
20,044
49,355
15,556
16,747
15.5
17.3
464.8
597.5
39.1
30.4
14.3
10.5
36.2
34.3
3.1
2.8
Gabriel India
Buy
84
101
1,205
1,415
1,544
8.7
9.0
4.6
5.4
18.2
15.5
3.3
2.9
18.1
18.9
0.8
0.7
Hero Motocorp
Accumulate
2,580
2,774
51,512
28,561
31,559
14.7
14.7
151.1
163.2
17.1
15.8
6.6
5.6
38.7
35.6
1.6
1.5
Jamna Auto Industries Buy
138
160
1,105
1,281
1,473
11.2
11.5
7.6
9.2
18.2
15.0
4.6
3.8
25.4
25.2
0.9
0.8
L G Balakrishnan & Bros Neutral
428
-
672
1,254
1,394
11.6
11.8
35.9
41.7
11.9
10.3
1.6
1.4
13.5
13.8
0.6
0.6
Mahindra and Mahindra Buy
1,183
1,449
73,450
39,031
44,440
13.8
13.9
57.9
67.6
20.4
17.5
3.3
2.9
16.1
16.6
1.5
1.3
Maruti
Neutral
3,657
-
110,459
57,865
68,104
16.4
16.7
176.3
225.5
20.7
16.2
4.0
3.4
19.4
21.2
1.7
1.4
Minda Industries
Buy
847
1,047
1,343
2,523
2,890
8.7
9.0
55.0
65.4
15.4
13.0
3.0
2.4
19.3
18.7
0.6
0.5
Motherson Sumi
Buy
241
313
31,931
39,343
45,100
8.8
9.1
10.1
12.5
23.9
19.3
7.6
5.9
35.3
34.4
0.9
0.8
Rane Brake Lining
Buy
379
465
300
454
511
11.5
12.0
25.2
31.0
15.0
12.2
2.3
2.0
14.9
16.6
0.8
0.7
Setco Automotive
Neutral
33
-
435
594
741
12.7
13.7
1.7
3.2
19.2
10.2
2.0
1.7
10.4
16.9
1.2
1.0
Tata Motors
Buy
311
409
89,677
266,022
312,667
12.8
13.1
26.3
38.3
11.8
8.1
1.6
1.3
8.4
12.1
0.5
0.5
TVS Motor
Accumulate
286
322
13,576
11,263
13,106
6.9
8.3
9.2
14.6
31.1
19.6
7.1
5.7
22.7
29.1
1.2
1.0
Amara Raja Batteries
Buy
866
1,040
14,797
4,892
5,871
17.4
17.6
28.8
37.1
30.1
23.4
7.0
5.6
23.4
24.1
3.0
2.4
Exide Industries
Buy
129
162
10,931
6,950
7,784
14.4
14.8
6.6
7.3
19.5
17.6
2.5
2.2
12.6
12.8
1.3
1.2
Apollo Tyres
Buy
135
171
6,874
12,146
12,689
16.8
16.0
21.2
19.0
6.4
7.1
1.1
0.9
16.5
13.0
0.6
0.7
Ceat
Buy
906
1,119
3,665
6,041
6,597
14.1
13.7
99.5
111.9
9.1
8.1
1.8
1.5
19.6
18.5
0.8
0.6
JK Tyres
Neutral
87
-
1,976
7,446
7,669
15.2
14.0
19.6
18.4
4.4
4.7
1.1
0.9
25.2
19.5
0.7
0.6
Swaraj Engines
Accumulate
847
919
1,052
552
630
14.2
14.7
44.6
54.1
19.0
15.7
4.4
4.0
23.2
25.6
1.8
1.5
Subros
Neutral
84
-
504
1,293
1,527
11.8
11.9
4.2
6.7
20.0
12.5
1.5
1.4
7.7
11.5
0.7
0.6
Indag Rubber
Neutral
175
-
460
283
329
17.0
17.2
13.0
15.4
13.5
11.4
3.0
2.5
21.8
21.6
1.3
1.1
Capital Goods
ACE
Neutral
37
-
363
660
839
4.7
8.2
1.0
3.9
36.7
9.4
1.2
1.0
3.2
11.3
0.7
0.6
BEML
Neutral
1,011
-
4,208
3,277
4,006
6.0
8.9
29.2
64.3
34.6
15.7
1.9
1.8
5.7
11.7
1.4
1.1
Bharat Electronics
Buy
1,209
1,414
29,017
7,737
8,634
16.8
17.2
54.0
61.0
22.4
19.8
3.2
2.8
39.3
45.6
2.9
2.4
Stock Watch
February 10, 2016
Company Name
Reco
CMP
Target
Mkt Cap
Sales ( Čcr )
OPM(%)
EPS (Č)
PER(x)
P/BV(x)
RoE(%)
EV/Sales(x)
(Č)
Price ( Č)
( Č cr )
FY16E
FY17E
FY16E
FY17E
FY16E
FY17E
FY16E
FY17E
FY16E
FY17E
FY16E
FY17E
FY16E
FY17E
Capital Goods
Voltas
Buy
281
353
9,298
5,363
5,963
8.0
9.1
11.0
13.8
25.6
20.4
3.9
3.4
16.2
17.9
1.7
1.5
BGR Energy
Neutral
109
-
785
3,615
3,181
9.5
9.4
16.7
12.4
6.5
8.8
0.6
0.6
10.0
7.0
0.6
0.8
BHEL
Neutral
131
-
32,161
33,722
35,272
10.8
11.7
10.5
14.2
12.5
9.3
0.9
0.9
7.0
9.0
1.0
1.0
Blue Star
Buy
343
439
3,082
3,548
3,977
6.3
6.9
13.7
17.2
25.0
20.0
6.3
4.1
26.1
25.4
1.0
0.8
Crompton Greaves
Neutral
129
-
8,063
13,484
14,687
4.9
6.2
4.5
7.1
28.6
18.1
2.0
1.9
7.2
10.8
0.7
0.7
Greaves Cotton
Neutral
127
-
3,089
1,655
1,755
16.6
16.8
7.4
7.8
17.1
16.2
3.4
3.2
21.1
20.6
1.8
1.7
Inox Wind
Buy
270
458
5,983
4,980
5,943
17.0
17.5
26.6
31.6
10.1
8.5
3.0
2.2
35.0
30.0
1.3
1.1
KEC International
Neutral
113
-
2,895
8,791
9,716
6.1
6.8
5.4
8.2
20.9
13.7
2.1
1.9
10.0
14.0
0.5
0.5
Thermax
Neutral
801
-
9,542
6,413
7,525
7.4
8.5
30.5
39.3
26.3
20.4
4.0
3.5
15.0
17.0
1.5
1.2
Cement
ACC
Buy
1,278
1,630
24,002
13,151
14,757
16.4
18.3
63.9
83.4
20.0
15.3
2.6
2.4
13.3
16.1
1.7
1.4
Ambuja Cements
Buy
197
233
30,634
11,564
12,556
19.4
20.7
8.9
10.1
22.2
19.5
2.8
2.6
12.8
13.8
2.3
2.1
HeidelbergCement
Neutral
70
-
1,591
1,772
1,926
13.3
15.4
1.0
3.0
70.2
23.4
1.8
1.6
2.6
7.9
1.5
1.3
India Cements
Buy
82
112
2,507
4,216
4,840
18.0
19.5
4.0
9.9
20.4
8.2
0.8
0.8
4.0
9.5
0.9
0.7
JK Cement
Buy
451
744
3,151
3,661
4,742
10.1
15.8
18.0
61.0
25.0
7.4
1.8
1.6
7.5
22.9
1.3
1.0
J K Lakshmi Cement
Buy
270
430
3,177
2,947
3,616
16.7
19.9
11.5
27.2
23.5
9.9
2.2
1.9
9.8
20.8
1.5
1.2
Mangalam Cements
Neutral
172
-
460
1,053
1,347
10.5
13.3
8.4
26.0
20.5
6.6
0.9
0.8
4.3
12.5
0.8
0.6
Orient Cement
Buy
137
183
2,809
1,854
2,524
21.2
22.2
7.7
11.1
17.8
12.4
2.6
2.2
13.3
15.7
2.3
1.6
Ramco Cements
Neutral
374
-
8,901
4,036
4,545
20.8
21.3
15.1
18.8
24.8
19.9
3.0
2.7
12.9
14.3
2.7
2.3
Shree Cement^
Neutral
10,274
-
35,791
7,150
8,742
26.7
28.6
228.0
345.5
45.1
29.7
6.6
5.6
15.7
20.3
4.8
3.8
UltraTech Cement
Buy
2,763
3,282
75,830
25,021
30,023
19.1
21.6
89.0
132.0
31.1
20.9
3.6
3.1
12.2
15.9
3.1
2.6
Construction
ITNL
Neutral
75
-
2,452
7,360
8,825
34.0
35.9
7.0
9.0
10.7
8.3
0.4
0.3
3.2
3.7
3.7
3.6
KNR Constructions
Buy
495
673
1,391
937
1,470
14.3
14.0
33.5
38.6
14.8
12.8
2.2
1.9
15.4
15.4
1.6
1.0
Larsen & Toubro
Buy
1,114
1,310
103,779
58,870
65,708
8.3
10.3
42.0
53.0
26.5
21.0
1.8
1.7
8.8
11.2
2.0
1.8
Gujarat Pipavav Port
Neutral
158
-
7,636
629
684
51.0
52.2
6.4
5.9
24.7
26.8
3.3
3.0
15.9
12.7
11.8
10.6
MBL Infrastructures
Buy
151
285
624
2,313
2,797
12.2
14.6
19.0
20.0
7.9
7.5
0.8
0.8
11.3
10.6
1.0
0.9
Nagarjuna Const.
Neutral
63
-
3,511
7,892
8,842
8.8
9.1
3.0
5.3
21.1
11.9
1.1
1.0
5.0
8.5
0.7
0.6
PNC Infratech
Accumulate
514
558
2,637
1,873
2,288
13.2
13.5
24.0
32.0
21.4
16.1
2.1
1.9
12.1
12.3
1.5
1.2
Simplex Infra
Neutral
264
-
1,304
5,955
6,829
10.3
10.5
16.0
31.0
16.5
8.5
0.9
0.8
5.3
9.9
0.7
0.6
Power Mech Projects
Neutral
584
-
858
1,539
1,801
12.8
12.7
59.0
72.1
9.9
8.1
1.5
1.3
18.6
16.8
0.6
0.5
Stock Watch
February 10, 2016
Company Name
Reco
CMP
Target
Mkt Cap
Sales ( Čcr )
OPM(%)
EPS (Č)
PER(x)
P/BV(x)
RoE(%)
EV/Sales(x)
(Č)
Price ( Č)
( Č cr )
FY16E
FY17E
FY16E
FY17E
FY16E
FY17E
FY16E
FY17E
FY16E
FY17E
FY16E
FY17E
FY16E
FY17E
Construction
Sadbhav Engineering
Neutral
299
-
5,120
3,481
4,219
10.7
10.8
8.0
12.0
37.3
24.9
3.5
3.1
10.3
13.5
1.7
1.4
NBCC
Buy
932
1,089
11,187
7,382
9,506
7.7
8.6
39.8
54.4
23.4
17.1
5.7
4.5
26.7
29.1
1.3
0.9
MEP Infra
Neutral
41
-
667
1,956
1,876
28.1
30.5
1.3
3.0
31.6
13.7
6.6
4.5
21.2
32.8
1.8
1.7
SIPL
Neutral
83
-
2,908
675
1,042
62.4
64.7
-
-
3.1
3.5
-
-
16.0
10.8
Financials
Allahabad Bank
Neutral
51
-
3,063
8,569
9,392
2.8
2.9
16.3
27.5
3.1
1.9
0.3
0.2
7.6
11.9
-
-
Axis Bank
Buy
400
494
95,292
26,473
31,527
3.5
3.6
35.7
43.5
11.2
9.2
1.9
1.6
17.9
18.9
-
-
Bank of Baroda
Neutral
124
-
28,572
18,485
21,025
1.9
2.0
13.5
21.1
9.2
5.9
0.7
0.7
7.3
10.6
-
-
Bank of India
Neutral
96
-
7,811
15,972
17,271
1.9
2.0
15.3
33.4
6.3
2.9
0.3
0.3
3.6
7.6
-
-
Canara Bank
Neutral
191
-
10,347
15,441
16,945
2.0
2.1
46.6
70.4
4.1
2.7
0.4
0.3
8.0
11.2
-
-
Dena Bank
Neutral
31
-
2,016
3,440
3,840
2.1
2.3
7.3
10.0
4.3
3.1
0.3
0.3
6.1
7.9
-
-
Federal Bank
Neutral
45
-
7,661
3,477
3,999
3.0
3.0
5.0
6.2
8.9
7.2
0.9
0.8
10.6
11.9
-
-
HDFC
Neutral
1,160
-
183,101
10,358
11,852
3.3
3.3
41.1
47.0
28.2
24.7
5.4
4.9
24.7
24.9
-
-
HDFC Bank
Buy
1,026
1,262
259,177
38,309
47,302
4.3
4.3
49.3
61.1
20.8
16.8
3.6
3.1
18.5
19.7
-
-
ICICI Bank
Buy
209
254
121,659
34,279
39,262
3.3
3.3
21.0
24.4
10.0
8.6
1.7
1.4
14.4
14.7
-
-
IDBI Bank
Neutral
56
-
10,574
9,625
10,455
1.8
1.8
8.5
14.2
6.5
3.9
0.4
0.4
5.9
9.3
-
-
Indian Bank
Neutral
87
-
4,162
6,160
6,858
2.5
2.5
24.5
29.8
3.5
2.9
0.3
0.3
7.7
8.6
-
-
LIC Housing Finance
Buy
425
592
21,431
3,101
3,745
2.5
2.5
33.0
40.2
12.9
10.6
2.4
2.1
19.7
20.5
-
-
Oriental Bank
Neutral
103
-
3,100
7,643
8,373
2.4
2.4
37.2
45.4
2.8
2.3
0.3
0.2
8.2
9.4
-
-
Punjab Natl.Bank
Neutral
88
-
17,250
23,638
26,557
2.8
2.8
17.9
27.2
4.9
3.2
0.5
0.4
8.5
12.0
-
-
South Ind.Bank
Neutral
18
-
2,471
1,965
2,185
2.5
2.5
2.5
3.3
7.3
5.5
0.7
0.7
9.5
11.7
-
-
St Bk of India
Buy
167
202
129,638
82,520
93,299
2.7
2.8
20.0
24.5
8.3
6.8
0.9
0.8
11.5
12.8
-
-
Union Bank
Neutral
129
-
8,875
12,646
14,129
2.3
2.4
31.0
39.1
4.2
3.3
0.5
0.4
9.8
11.4
-
-
Vijaya Bank
Neutral
32
-
2,758
3,536
3,827
1.9
1.9
5.5
6.7
5.8
4.8
0.5
0.4
7.8
8.8
-
-
Yes Bank
Neutral
748
-
31,393
7,190
9,011
3.2
3.3
58.2
69.7
12.8
10.7
2.3
2.0
19.2
19.6
-
-
FMCG
Asian Paints
Neutral
884
-
84,812
16,553
19,160
16.0
16.2
17.7
21.5
50.0
41.1
13.3
12.0
29.4
31.2
5.0
4.3
Britannia
Neutral
2,778
-
33,327
8,065
9,395
9.6
10.2
47.2
65.5
58.8
42.4
19.6
18.5
38.3
41.2
4.0
3.4
Colgate
Neutral
848
-
23,066
4,836
5,490
19.5
19.7
48.5
53.2
17.5
15.9
12.8
11.2
99.8
97.5
4.7
4.1
Dabur India
Accumulate
248
267
43,697
9,370
10,265
17.1
17.2
7.3
8.1
33.9
30.7
10.2
8.3
33.7
30.6
4.6
4.2
GlaxoSmith Con*
Neutral
5,847
-
24,590
4,919
5,742
17.2
17.4
168.3
191.2
34.8
30.6
9.9
8.4
28.8
28.9
4.6
3.9
Stock Watch
February 10, 2016
Company Name
Reco
CMP
Target
Mkt Cap
Sales ( Čcr )
OPM(%)
EPS (Č)
PER(x)
P/BV(x)
RoE(%)
EV/Sales(x)
(Č)
Price ( Č)
( Č cr )
FY16E FY17E
FY16E
FY17E
FY16E
FY17E
FY16E
FY17E
FY16E
FY17E
FY16E
FY17E
FY16E
FY17E
FMCG
Godrej Consumer
Neutral
1,241
-
42,257
10,168
12,886
16.1
16.1
32.1
38.4
38.7
32.3
7.9
7.3
19.7
21.0
4.3
3.3
HUL
Neutral
827
-
178,866
34,940
38,957
17.5
17.7
20.8
24.7
39.7
33.5
44.2
35.3
110.5
114.2
4.9
4.4
ITC
Buy
313
382
251,316
41,068
45,068
37.8
37.4
13.9
15.9
22.5
19.7
7.5
6.6
34.1
33.8
5.8
5.2
Marico
Neutral
231
-
29,790
6,551
7,766
15.7
16.0
10.4
12.5
22.3
18.5
6.5
5.4
33.2
32.4
4.5
3.8
Nestle*
Buy
5,418
6,646
52,242
11,291
12,847
22.2
22.3
158.9
184.6
34.1
29.4
17.8
16.0
55.0
57.3
4.5
3.9
Tata Global
Buy
121
144
7,621
8,635
9,072
9.8
9.9
6.5
7.6
18.6
15.9
1.9
1.8
6.8
7.4
0.8
0.8
IT
HCL Tech^
Buy
812
1,038
114,415
42,038
47,503
21.2
21.5
51.5
57.7
15.8
14.1
3.4
2.6
21.5
18.8
2.3
1.9
Infosys
Buy
1,109
1,347
254,800
61,850
69,981
27.5
27.5
59.4
65.7
18.7
16.9
4.0
3.4
21.2
20.1
3.4
2.9
TCS
Buy
2,281
2,854
449,543
108,487
122,590
28.3
28.5
122.8
138.4
18.6
16.5
7.1
6.4
38.0
38.9
3.7
3.3
Tech Mahindra
Buy
448
646
43,298
25,566
28,890
16.0
17.0
26.3
31.9
17.0
14.0
3.1
2.6
17.9
18.6
1.5
1.2
Wipro
Buy
536
680
132,430
50,808
56,189
23.7
23.8
37.3
40.7
14.4
13.2
2.7
2.5
19.2
17.7
2.1
1.7
Media
D B Corp
Accumulate
319
356
5,860
2,241
2,495
27.8
27.9
21.8
25.6
14.7
12.5
3.8
3.4
26.7
28.5
2.6
2.3
HT Media
Neutral
79
-
1,845
2,495
2,603
11.2
11.2
7.3
8.6
10.9
9.2
0.9
0.8
7.4
8.1
0.2
0.2
Jagran Prakashan
Buy
160
189
5,218
2,170
2,355
27.2
26.2
8.9
9.9
17.9
16.1
3.8
3.3
20.9
20.5
2.3
2.1
Sun TV Network
Neutral
348
-
13,694
2,779
3,196
70.2
70.5
22.8
27.3
15.2
12.7
3.8
3.4
26.7
28.3
4.7
4.0
Hindustan Media
Neutral
275
-
2,020
920
1,031
20.0
20.0
19.2
20.9
14.3
13.2
2.4
2.0
16.4
15.3
1.7
1.5
Ventures
Metals & Mining
Coal India
Buy
309
380
195,302
76,167
84,130
19.9
22.3
22.4
25.8
13.8
12.0
5.0
4.9
35.5
41.0
1.9
1.7
Hind. Zinc
Accumulate
164
175
69,380
14,641
14,026
50.4
50.4
17.7
16.0
9.3
10.3
1.4
1.3
16.2
13.2
2.4
2.2
Hindalco
Neutral
70
-
14,445
104,356
111,186
8.7
9.5
6.7
11.1
10.4
6.3
0.4
0.4
3.5
5.9
0.7
0.6
JSW Steel
Neutral
1,003
-
24,235
42,308
45,147
16.4
20.7
(10.3)
49.5
20.3
1.1
1.1
(1.0)
5.6
1.6
1.5
NMDC
Neutral
85
-
33,581
8,237
10,893
46.6
44.5
10.0
11.7
8.5
7.3
1.0
0.8
12.5
13.0
3.9
3.0
SAIL
Neutral
39
-
16,087
45,915
53,954
7.2
10.5
1.5
4.4
25.9
8.9
0.4
0.4
2.3
4.1
1.0
0.9
Vedanta
Neutral
70
-
20,679
71,445
81,910
26.2
26.3
12.9
19.2
5.4
3.6
0.4
0.3
7.2
8.9
0.7
0.6
Tata Steel
Neutral
236
-
22,877
126,760
137,307
8.9
11.3
6.4
23.1
37.0
10.2
0.7
0.7
2.0
7.1
0.8
0.7
Oil & Gas
Cairn India
Neutral
125
-
23,445
11,323
12,490
49.4
51.0
20.7
20.7
6.0
6.1
0.4
0.4
6.4
6.1
1.1
0.5
GAIL
Neutral
349
-
44,219
64,856
70,933
9.1
9.6
24.0
28.9
14.6
12.1
1.2
1.2
8.8
9.6
0.9
0.8
ONGC
Neutral
218
-
186,852
154,564
167,321
36.8
37.4
28.6
32.5
7.6
6.7
1.0
0.9
12.7
13.5
1.4
1.3
Petronet LNG
Neutral
253
-
19,005
29,691
31,188
5.8
6.2
12.8
13.4
19.8
18.9
3.0
2.6
15.8
14.8
0.7
0.7
Indian Oil Corp
Buy
388
455
94,302
359,607
402,760
5.9
6.1
42.5
48.7
9.2
8.0
1.2
1.1
14.1
14.4
0.4
0.3
Stock Watch
February 10, 2016
Company Name
Reco
CMP
Target
Mkt Cap
Sales ( Čcr )
OPM(%)
EPS (Č)
PER(x)
P/BV(x)
RoE(%)
EV/Sales(x)
(Č)
Price ( Č)
( Č cr )
FY16E FY17E
FY16E
FY17E
FY16E
FY17E
FY16E
FY17E
FY16E
FY17E
FY16E
FY17E
FY16E
FY17E
Oil & Gas
Reliance Industries
Buy
957
1,150
309,881
304,775
344,392
12.6
13.4
91.3
102.6
10.5
9.3
1.2
1.1
11.8
12.0
0.9
0.8
Pharmaceuticals
Alembic Pharma
Neutral
591
-
11,132
3,274
3,802
26.9
19.4
35.0
28.7
16.9
20.6
7.5
5.6
55.6
31.2
3.4
2.8
Aurobindo Pharma
Buy
743
856
43,470
14,923
17,162
22.0
23.0
35.7
42.8
20.8
17.4
6.1
4.6
34.0
30.2
3.3
2.8
Aventis*
Neutral
4,180
-
9,627
2,082
2,371
17.4
20.8
118.2
151.5
35.4
27.6
5.2
4.2
19.9
25.5
4.3
3.6
Cadila Healthcare
Accumulate
328
352
33,584
10,224
11,840
21.0
22.0
14.6
17.6
22.5
18.6
6.2
4.8
30.8
29.0
3.4
2.8
Cipla
Accumulate
557
636
44,705
14,211
16,611
20.6
19.0
27.0
28.9
20.6
19.3
3.5
3.0
18.4
16.8
3.1
2.6
Dr Reddy's
Buy
2,960
3,933
50,473
16,838
19,575
25.0
23.1
167.5
178.8
17.7
16.6
3.7
3.1
23.1
20.4
2.9
2.5
Dishman Pharma
Neutral
341
-
2,753
1,733
1,906
21.5
21.5
17.0
19.9
20.1
17.2
2.0
1.8
10.5
11.2
2.1
1.8
GSK Pharma*
Neutral
3,228
-
27,345
2,870
3,158
20.0
22.1
59.5
68.3
54.3
47.3
16.0
16.5
28.5
34.3
9.0
8.3
Indoco Remedies
Neutral
301
-
2,775
1,033
1,199
15.9
18.2
9.4
13.6
32.0
22.1
4.8
4.0
15.7
19.7
2.8
2.4
Ipca labs
Buy
654
900
8,253
3,363
3,909
12.9
18.6
13.4
28.0
48.8
23.4
3.5
3.1
7.4
14.0
2.7
2.4
Lupin
Neutral
1,904
-
85,782
13,092
16,561
25.0
27.0
50.4
68.3
37.8
27.9
7.8
6.2
22.8
24.7
6.3
4.8
Sun Pharma
Accumulate
854
950
205,584
28,163
32,610
25.8
30.7
17.4
26.9
49.1
31.8
4.7
4.0
13.0
16.6
6.8
5.6
Power
Tata Power
Neutral
60
-
16,147
35,923
37,402
22.6
22.8
4.1
5.2
14.7
11.6
1.1
1.1
7.5
9.3
1.4
1.3
NTPC
Buy
126
157
103,563
87,064
98,846
23.5
23.5
11.7
13.2
10.7
9.5
1.2
1.1
11.4
12.1
2.2
2.0
Power Grid
Buy
142
170
74,236
20,702
23,361
86.7
86.4
12.1
13.2
11.8
10.7
1.7
1.5
15.6
15.1
8.5
7.9
Telecom
Bharti Airtel
Neutral
312
-
124,699
101,748
109,191
32.1
31.7
12.0
12.5
26.0
25.0
1.8
1.7
6.9
6.7
1.9
1.7
Idea Cellular
Neutral
102
-
36,814
34,282
36,941
32.0
31.5
5.9
6.2
17.3
16.5
1.6
1.4
9.9
9.3
1.7
1.6
zOthers
Abbott India
Neutral
4,840
-
10,284
2,715
3,153
14.5
14.1
134.3
152.2
36.0
31.8
9.0
7.4
27.4
25.6
3.5
3.0
Bajaj Electricals
Buy
178
290
1,798
4,719
5,287
5.2
5.8
8.6
12.7
20.8
14.1
2.4
2.1
11.4
14.8
0.4
0.3
Finolex Cables
Neutral
224
-
3,427
2,520
2,883
12.2
12.0
12.7
14.2
17.7
15.8
2.4
2.1
13.6
13.5
1.1
0.9
Goodyear India*
Buy
488
582
1,126
1,800
1,600
11.7
11.5
58.7
52.9
8.3
9.2
1.9
1.6
24.6
18.7
0.4
0.4
Hitachi
Neutral
1,181
-
3,210
1,779
2,081
7.8
8.8
21.8
33.4
54.2
35.3
8.7
7.1
17.4
22.1
1.9
1.6
Jyothy Laboratories
Neutral
284
-
5,145
1,620
1,847
11.5
11.5
7.3
8.5
39.0
33.5
5.0
4.7
13.3
14.4
3.0
2.6
MRF
Buy
33,653
45,575
14,273
20,316
14,488
21.4
21.1
5,488.0
3,798.0
6.1
8.9
2.1
1.7
41.1
21.2
0.7
0.9
Page Industries
Neutral
11,698
-
13,047
1,929
2,450
19.8
20.1
229.9
299.0
50.9
39.1
22.5
15.6
52.1
47.1
6.8
5.3
Relaxo Footwears
Neutral
423
-
5,079
1,767
2,152
12.3
12.5
19.3
25.1
22.0
16.9
5.4
4.1
27.7
27.8
2.9
2.4
Siyaram Silk Mills
Buy
1,052
1,354
986
1,636
1,815
11.5
11.5
89.9
104.1
11.7
10.1
1.9
1.7
17.9
17.8
0.8
0.7
Styrolution ABS India*
Buy
557
698
980
1,271
1,440
8.6
9.2
32.0
41.1
17.4
13.6
1.8
1.6
10.7
12.4
0.7
0.6
Stock Watch
February 10, 2016
Company Name
Reco
CMP
Target
Mkt Cap
Sales ( Čcr )
OPM(%)
EPS (Č)
PER(x)
P/BV(x)
RoE(%)
EV/Sales(x)
(Č)
Price ( Č)
( Č cr )
FY16E
FY17E
FY16E
FY17E
FY16E
FY17E
FY16E
FY17E
FY16E
FY17E
FY16E
FY17E
FY16E
FY17E
zOthers
TVS Srichakra
Buy
2,485
3,217
1,903
2,035
2,252
15.9
15.3
248.6
268.1
10.0
9.3
4.4
3.1
43.6
33.9
1.0
0.8
HSIL
Accumulate
269
302
1,946
2,123
2,384
16.1
16.5
15.0
18.9
17.9
14.3
1.4
1.3
8.0
9.4
1.3
1.1
Kirloskar Engines India
Neutral
220
-
3,187
2,403
2,554
8.6
9.9
9.2
10.5
24.0
21.0
2.3
2.2
9.7
10.7
1.0
0.9
Ltd
M M Forgings
Buy
421
614
508
511
615
21.7
21.6
43.1
55.8
9.8
7.5
1.8
1.5
19.9
21.2
1.2
0.9
Banco Products (India) Neutral
110
-
783
1,208
1,353
11.0
12.3
10.8
14.5
10.2
7.6
1.2
1.0
11.9
14.5
0.6
0.5
Competent Automobiles Neutral
136
-
84
1,040
1,137
3.2
3.1
25.7
28.0
5.3
4.9
0.8
0.7
15.0
14.3
0.1
0.1
Nilkamal
Neutral
1,212
-
1,809
1,871
2,031
10.7
10.5
63.2
69.8
19.2
17.4
3.1
2.7
17.6
16.6
1.0
0.9
Visaka Industries
Buy
100
144
159
1,086
1,197
9.9
10.3
21.5
28.8
4.6
3.5
0.4
0.4
9.6
11.6
0.4
0.3
Transport Corporation of
Neutral
230
-
1,753
2,830
3,350
8.8
9.0
14.4
18.3
16.0
12.6
2.5
2.2
15.4
17.1
0.7
0.6
India
Elecon Engineering
Neutral
59
-
643
1,359
1,482
10.3
13.7
0.8
3.9
73.5
15.2
1.2
1.2
1.6
7.8
0.8
0.8
Surya Roshni
Buy
142
201
622
2,992
3,223
8.1
8.4
14.7
18.3
9.7
7.7
0.9
0.8
9.7
11.0
0.5
0.5
MT Educare
Neutral
158
-
629
286
366
18.3
17.7
7.7
9.4
20.5
16.9
4.3
3.8
20.2
21.1
2.1
1.6
Radico Khaitan
Buy
107
156
1,424
1,565
1,687
12.2
13.0
5.7
7.1
18.8
15.1
1.6
1.5
8.3
9.6
1.4
1.3
Garware Wall Ropes
Buy
337
473
737
862
974
11.2
11.2
24.9
29.6
13.6
11.4
2.0
1.8
15.1
15.4
0.9
0.7
Wonderla Holidays
Neutral
376
-
2,123
206
308
44.0
43.6
9.0
12.9
41.7
29.1
5.7
5.2
13.7
17.8
10.2
6.8
Linc Pen & Plastics
Neutral
186
-
275
340
371
8.3
8.9
10.8
13.2
17.2
14.1
2.8
2.4
16.0
17.1
0.8
0.8
The Byke Hospitality
Neutral
156
-
626
222
287
20.5
20.5
5.6
7.6
27.7
20.7
5.2
4.3
18.9
20.8
2.9
2.2
Interglobe Aviation
Neutral
788
-
28,402
17,022
21,122
20.7
14.5
63.9
53.7
12.3
14.7
18.5
15.2
149.9
103.2
1.7
1.4
Coffee Day Enterprises
Neutral
243
-
5,011
2,692
2,964
17.0
18.6
-
4.7
-
51.3
3.0
2.8
0.2
5.5
2.3
2.1
Ltd
Navneet Education
Neutral
83
-
1,984
998
1,062
24.1
24.0
5.8
6.1
14.5
13.7
3.2
2.8
22.0
20.6
2.1
1.9
Navkar Corporation
Buy
185
265
2,639
365
436
38.3
37.5
5.6
5.9
32.8
31.5
2.1
1.9
6.3
6.1
8.0
6.9
Source: Company, Angel Research; Note: *December year end; #September year end; &October year end; Price as on February 09, 2016
Market Outlook
February 10, 2016
Research Team Tel: 022 - 39357800
DISCLAIMER
Angel Broking Private Limited (hereinafter referred to as “Angel”) is a registered Member of National Stock Exchange of India Limited,
Bombay Stock Exchange Limited and Metropolitian Stock Exchange of India Limited. It is also registered as a Depository Participant with
CDSL and Portfolio Manager with SEBI. It also has registration with AMFI as a Mutual Fund Distributor. Angel Broking Private Limited is a
registered entity with SEBI for Research Analyst in terms of SEBI (Research Analyst) Regulations, 2014 vide registration number
INH000000164. Angel or its associates has not been debarred/ suspended by SEBI or any other regulatory authority for accessing
/dealing in securities Market. Angel or its associates including its relatives/analyst do not hold any financial interest/beneficial ownership
of more than 1% in the company covered by Analyst. Angel or its associates/analyst has not received any compensation / managed or co
-managed public offering of securities of the company covered by Analyst during the past twelve months. Angel/analyst has not served as
an officer, director or employee of company covered by Analyst and has not been engaged in market making activity of the company
covered by Analyst.
This document is solely for the personal information of the recipient, and must not be singularly used as the basis of any investment
decision. Nothing in this document should be construed as investment or financial advice. Each recipient of this document should make
such investigations as they deem necessary to arrive at an independent evaluation of an investment in the securities of the companies
referred to in this document (including the merits and risks involved), and should consult their own advisors to determine the merits and
risks of such an investment.
Reports based on technical and derivative analysis center on studying charts of a stock's price movement, outstanding positions and
trading volume, as opposed to focusing on a company's fundamentals and, as such, may not match with a report on a company's
fundamentals.
The information in this document has been printed on the basis of publicly available information, internal data and other reliable sources
believed to be true, but we do not represent that it is accurate or complete and it should not be relied on as such, as this document is for
general guidance only. Angel Broking Pvt. Limited or any of its affiliates/ group companies shall not be in any way responsible for any
loss or damage that may arise to any person from any inadvertent error in the information contained in this report. Angel Broking Pvt.
Limited has not independently verified all the information contained within this document. Accordingly, we cannot testify, nor make any
representation or warranty, express or implied, to the accuracy, contents or data contained within this document. While Angel Broking
Pvt. Limited endeavors to update on a reasonable basis the information discussed in this material, there may be regulatory, compliance,
or other reasons that prevent us from doing so.
This document is being supplied to you solely for your information, and its contents, information or data may not be reproduced,
redistributed or passed on, directly or indirectly.
Neither Angel Broking Pvt. Limited, nor its directors, employees or affiliates shall be liable for any loss or damage that may arise from or
in connection with the use of this information.
Note: Please refer to the important ‘Stock Holding Disclosure' report on the Angel website (Research Section). Also, please refer to the
latest update on respective stocks for the disclosure status in respect of those stocks. Angel Broking Pvt. Limited and its affiliates may have
investment positions in the stocks recommended in this report.