Market Outlook
December 9, 2015
Market Cues
Domestic Indices
Chg (%)
(Pts)
(Close)
Indian markets are expected to open on a Negative note tracking the SGX Nifty and
BSE Sensex
(0.9)
(220)
25,310
most Global markets.
Nifty
(0.8)
(64)
7,702
Following most global markets, US markets opened weak and ended in the negative
Mid Cap
(1.2)
(127)
10,797
zone citing weak global commodity prices and poor exports data from China.
Small Cap
(1.3)
(154)
11,422
The European markets closed in negative territory on Tuesday on weak oil prices
Bankex
(0.9)
(165)
19,217
and unimpressive data out of China where the exports declined for fifth straight
month.
Global Indices
Chg (%)
(Pts)
(Close)
Indian extended losses on Tuesday, tracing weakness in global markets and poor
Dow Jones
(0.9)
(163)
17,568
exports data from China hinting towards weak global demand. Continued selling by
Nasdaq
(0.1)
(4)
5,098
FIIs also added to the weakness in Indian markets.
FTSE
(1.4)
(88)
6,135
News & Result Analysis
Nikkei
(1.0)
(206)
19,493
Larsen & Toubro wins orders worth `1,960cr
Hang Seng
(1.3)
(298)
21,905
Detailed analysis on Pg2
Shanghai Com
(1.9)
(67)
3,470
Investor’s Ready Reckoner
Key Domestic & Global Indicators
Advances / Declines
BSE
NSE
Stock Watch: Latest investment recommendations on 150+ stocks
Advances
861
362
Refer P4 onwards
Declines
1,909
1,189
Unchanged
146
54
Top Picks
CMP
Target
Upside
Company
Sector
Rating
(`)
(`)
(%)
Volumes (` Cr)
Axis Bank
Financials
Buy
459
630
37.3
BSE
2,763
HCL Tech
IT
Buy
858
1,132
32.0
NSE
13,657
ICICI Bank
Financials
Buy
261
354
35.4
Ashok Leyland
Automobiles
Buy
90
111
23.7
Net Inflows (` Cr)
Net
Mtd
Ytd
Larsen & Toubro
Construction
Buy
1,322
1,646
24.5
More Top Picks on Pg3
FII
(42)
(2,291)
(24,740)
MFs
148
1,271
58,166
Key Upcoming Events
Previous
Consensus
Date
Region
Event Description
Reading
Expectations
Top Gainers
Price (`)
Chg (%)
Dec 9
China
Consumer Price Index (YoY) (Nov)
1.3
1.4
Amtekauto
52
11.0
Dec 10
US
Initial Jobless claims
269
268
Sci
86
4.8
India
Imports (YoY) %
(21.15)
-
Jetairways
572
2.6
India
Imports (YoY) %
(17.53)
-
Indhotel
107
2.5
Gskcons
6,181
2.3
Top Losers
Price (`)
Chg (%)
Adanipower
28
(9.5)
Jpassociat
12
(8.8)
Ibrealest
56
(7.5)
Rtnpower
11
(7.1)
Hdil
65
(6.3)
As on December 08, 2015
Market Outlook
December 9, 2015
Larsen & Toubro wins orders worth `1,960cr
Larsen & Toubro (L&T) has bagged orders worth `1,960cr across various business
segments. Its Water & Effluent Treatment Business has secured orders worth
`1,053cr from the Water Resource Department of Odisha for engineering,
procurement and construction of 34 lift irrigation schemes in various districts of
Odisha, for irrigating 48600 Ha of cultivable lands. The major scope involves
construction of 34 intake wells and delivery chambers, supply and laying of ductile
iron, HDPE and mild steel pipelines. The scope also involves supply and
installation of 96 vertical turbine pumps and other associated works. The project is
scheduled to be completed in 30 months.
Its Heavy Civil Infrastructure business has secured orders worth `889cr from
Chennai Metro Rail Corporation for the construction of Chennai Metro line
Package 3 Underground
- Balance works. The scope involves engineering,
procurement and construction of 4 stations at AG-DMS, Teynampet, Nandanam,
Saidapet and Saidapet ramp portion with associated tunnel works. Other works
include MEP and Architectural work at these stations. The project is scheduled to
be completed in 20 months. Its JV has secured an order worth `422cr for
construction of a cut-off wall in the Indira Sagar Dam project at Polavaram, AP.
At Q2FY2016 end, L&T’s order book stands at `2,44,097cr, which gives revenue
visibility for over the next 30 months. We maintain our positive view on the stock
and have our Buy rating.
Economic and Political News
Govt's public debt ticks up 2.1% in Sep quarter
India ready to impose more curbs on steel imports
OPDPA urges government to increase import duty on crude palm oil to 45%
Corporate News
Larsen & Toubro wins orders worth `1,960cr
SFIO probes 11 companies in relation to `6,000cr BoB forex
Wockhardt gets QIDP status for new antibiotic product from FDA
Market Outlook
December 9, 2015
Top Picks
Large Cap
M
arket Cap
CM
P
T
arget
Upsid
e
Company
Rationale
(` Cr)
(`)
(`)
(%)
To outpace battery industry growth due to better technological
Amara Raja Batteries
14,486
848
1,040
22.6
products leading to market share gains in both the automotive
OEM and replacement segments.
Earnings to grow strongly given the MHCV cyclical upturn.
Ashok Leyland
25,528
90
111
23.7
Focus on exports and LCV's provides additional growth
avenue.
Healthy pace of branch expansion, backed by distribution
Axis Bank
1,09,060
459
630
37.3
network, will be the driving force for the bank’s retail business
and overall earnings.
The stock is trading at attractive valuations and is factoring all
HCL Tech
1,20,882
858
1,132
32.0
the bad news.
Strong visibility for a robust 20% earnings trajectory, coupled
HDFC Bank
2,64,750
1,049
1,262
20.3
with high quality of earnings on account of high quality retail
business and strategic focus on highly rated corporates.
Due to its robust franchise and capital adequacy position, the
bank is well positioned to grow by at least a few percentage
ICICI Bank
1,51,950
261
354
35.4
points higher than the average industry growth rate from a
structural point of view.
Back on the growth trend, expect a long term growth of 14%
Infosys
2,40,019
1,045
1,306
25.0
to be a US$20bn in FY2020.
Well positioned to benefit from such expected gradual
recovery in the overall domestic capex cycle, given its presence
Larsen & Toubro
1,23,102
1,322
1,646
24.5
across various infrastructure segments, its execution
capabilities, and its strong balance sheet.
LICHF continues to grow its retail loan book at a healthy pace
with improvement in asset quality. We expect the company to
LIC Housing Finance
23,290
462
571
23.7
post a healthy loan book which is likely to reflect in a strong
earnings growth.
Source: Company, Angel Research
Mid Cap
M
arket Cap
CM
P
T
arget
Upsid
e
Company
Rationale
(` Cr)
(`)
(`)
(%)
Favourable outlook for the AC industry to augur well for
Cooling products business which is out pacing the market
Blue Star
3,184
354
429
21.2
growth. EMPPAC division's profitability to improve once
operating environment turns around.
Change in business focus towards high-margin chronic &
Ipca labs
9,460
750
900
20.0
lifestyle segments and increasing penetration in Europe and
US
Economic recovery to have favourable impact on advertising &
circulation revenue growth. Further, the acquisition of a radio
Jagran Prakashan
4,869
149
169
13.5
business (Radio City) would also boost the company's revenue
growth.
Strong brand & quality teaching with innovative technologies &
MT Educare
548
138
169
22.7
higher government educational spending to boost growth
Earnings boost on back of stable material prices and
Radico Khaitan
1,384
104
156
50.0
favourable pricing environment. Valuation discount to peers
provides additional comfort
Strong brands and distribution network would boost growth
Siyaram Silk Mills
1,065
1,137
1,354
19.1
going ahead. Stock currently trades at an inexpensive
valuation.
Structural shift in the Lighting industry towards LED lighting will
Surya Roshni
582
133
183
37.9
drive growth.
Source: Company, Angel Research
Market Outlook
December 9, 2015
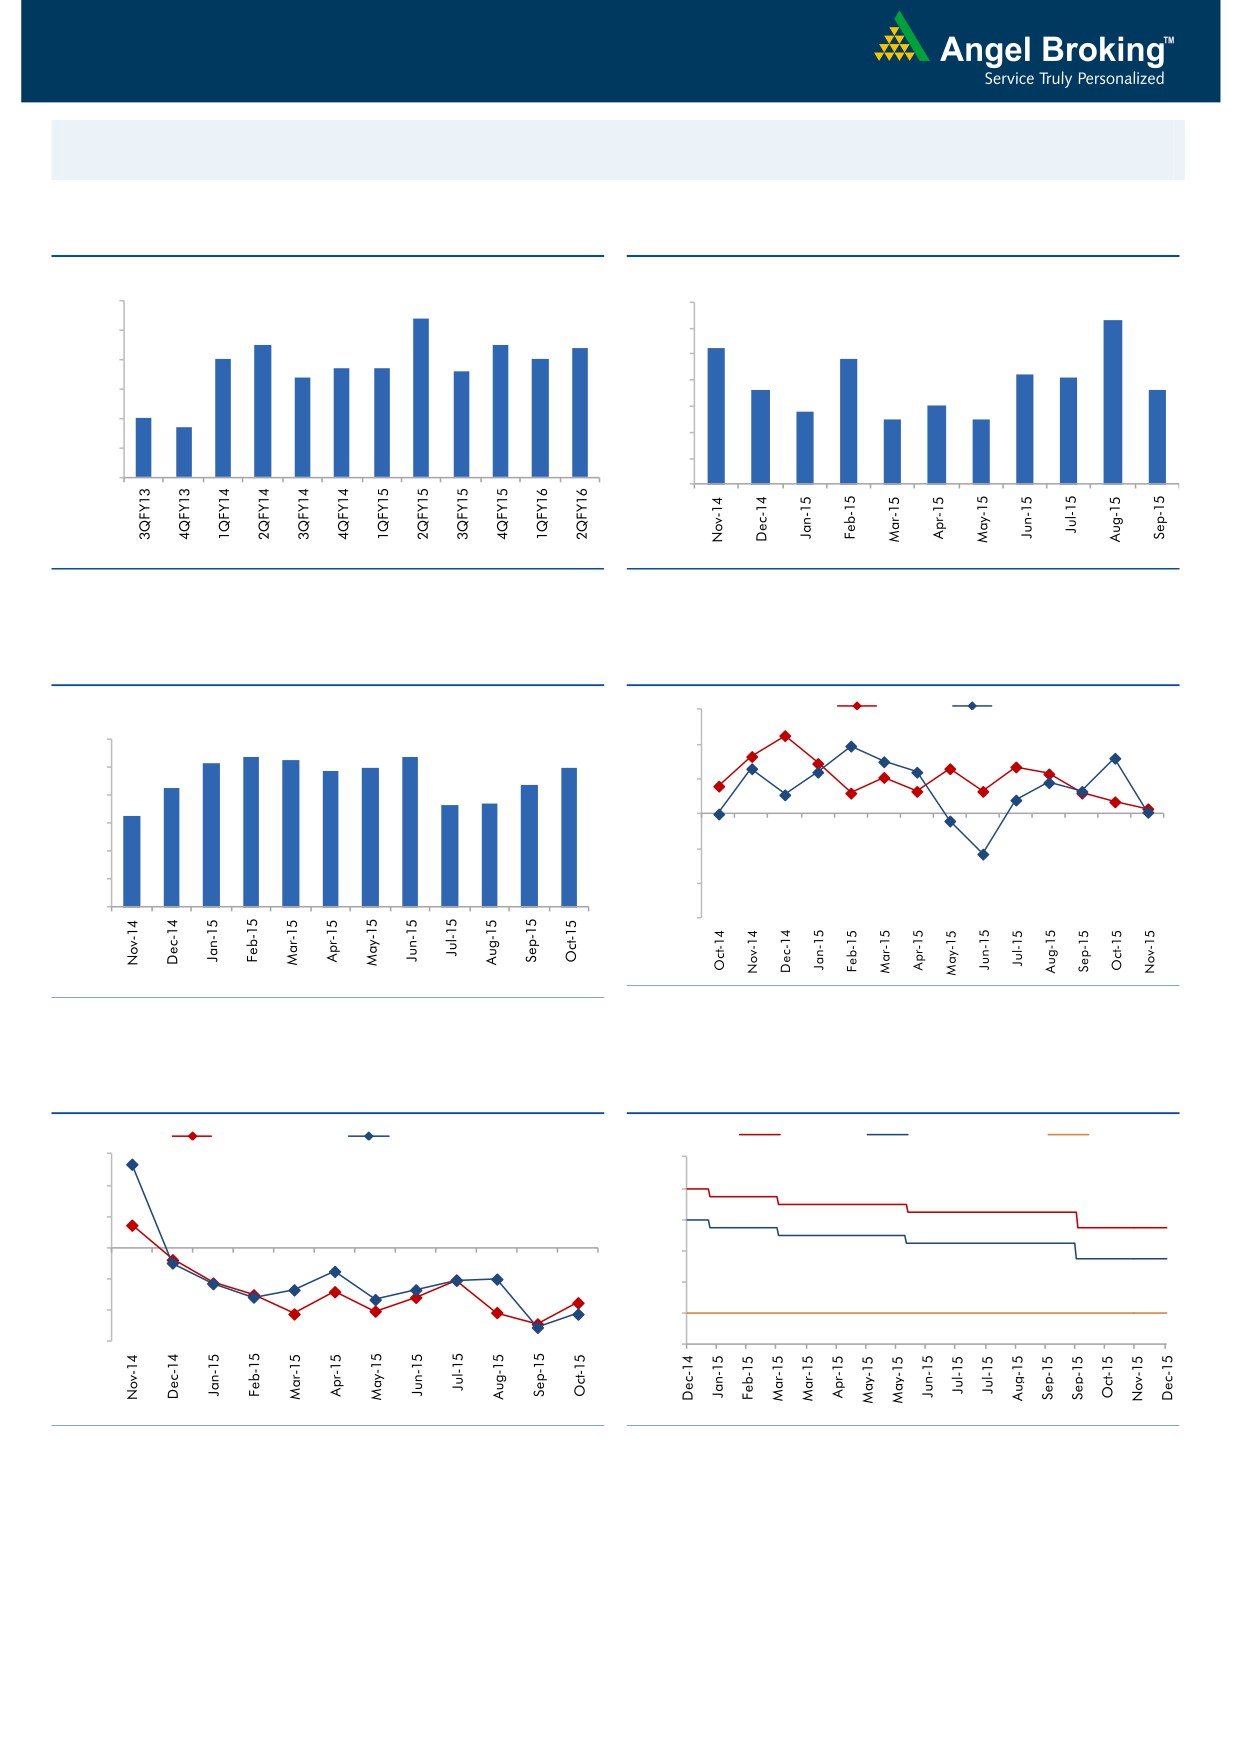
Macro watch
Exhibit 1: Quarterly GDP trends
Exhibit 2: IIP trends
(%)
(%)
9.0
8.4
7.0
6.3
8.0
7.5
7.5
7.4
6.0
5.2
7.0
7.0
4.8
6.7
6.7
6.6
5.0
7.0
6.4
4.2
4.1
3.6
3.6
4.0
6.0
2.8
3.0
5.0
3.0
2.5
2.5
4.7
5.0
2.0
4.0
1.0
3.0
-
Source: CSO, Angel Research
Source: MOSPI, Angel Research
Exhibit 3: Monthly CPI inflation trends
Exhibit 4: Manufacturing and services PMI
(%)
56.0
Mfg. PMI
Services PMI
6.0
5.4
5.3
5.4
54.0
5.2
5.0
5.0
4.9
5.0
4.3
4.4
52.0
3.7
3.7
4.0
3.3
50.0
3.0
2.0
48.0
1.0
46.0
-
44.0
Source: Market, Angel Research; Note: Level above 50 indicates expansion
Source: MOSPI, Angel Research
Exhibit 5: Exports and imports growth trends
Exhibit 6: Key policy rates
(%)
Exports yoy growth
Imports yoy growth
(%)
Repo rate
Reverse Repo rate
CRR
30.0
9.00
20.0
8.00
10.0
7.00
0.0
6.00
(10.0)
5.00
(20.0)
4.00
(30.0)
3.00
Source: Bloomberg, Angel Research
Source: RBI, Angel Research
Market Outlook
December 9, 2015
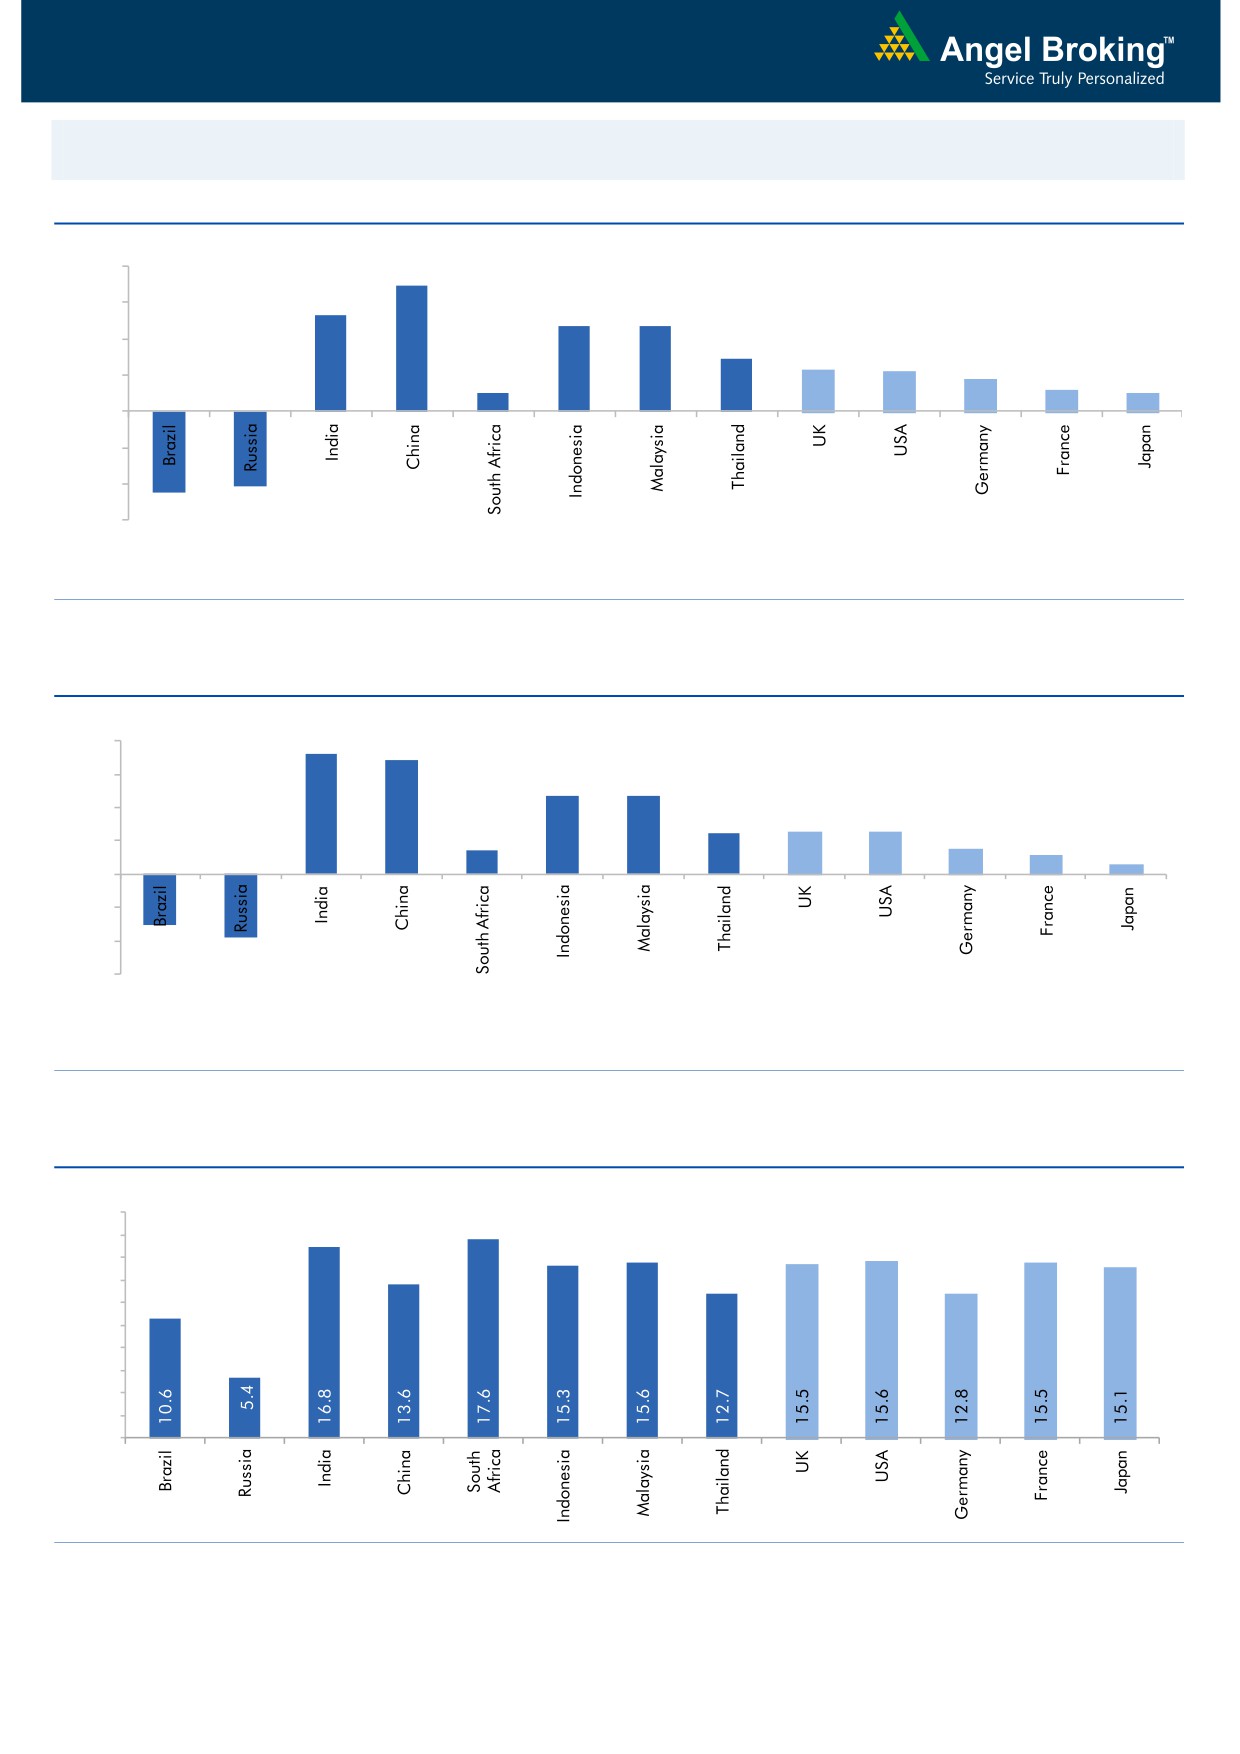
Global watch
Exhibit 1: Latest quarterly GDP Growth (%, yoy) across select developing and developed countries
(%)
8.0
6.9
5.3
6.0
4.7
4.7
4.0
2.9
2.3
2.2
1.8
2.0
1.0
1.2
1.0
-
(2.0)
(4.0)
(4.1)
(4.5)
(6.0)
Source: Bloomberg, Angel Research
Exhibit 2: 2015 GDP Growth projection by IMF (%, yoy) across select developing and developed countries
(%)
7.3
8.0
6.8
6.0
4.7
4.7
4.0
2.5
2.5
2.6
1.4
1.5
2.0
1.2
0.6
-
(2.0)
(4.0)
(3.0)
(3.8)
(6.0)
Source: IMF, Angel Research
Exhibit 3: One year forward P-E ratio across select developing and developed countries
(x)
20.0
18.0
16.0
14.0
12.0
10.0
8.0
6.0
4.0
2.0
-
Source: IMF, Angel Research
Market Outlook
December 9, 2015
Exhibit 4: Relative performance of indices across globe
Returns (%)
Country
Name of index
Closing price
1M
3M
1YR
Brazil
Bovespa
44,443
(7.5)
(6.2)
(15.0)
Russia
Micex
1,719
(2.0)
0.3
12.4
India
Nifty
7,702
(4.2)
(1.1)
(9.8)
China
Shanghai Composite
3,470
(5.1)
9.3
29.0
South Africa
Top 40
44,151
(7.1)
0.1
0.6
Mexico
Mexbol
42,237
(6.5)
(1.2)
(2.3)
Indonesia
LQ45
768
(2.1)
6.1
(13.4)
Malaysia
KLCI
1,669
(1.1)
4.1
(6.5)
Thailand
SET 50
837
(8.3)
(6.1)
(21.8)
USA
Dow Jones
17,568
(1.7)
6.5
(1.3)
UK
FTSE
6,135
(3.4)
(1.5)
(5.6)
Japan
Nikkei
19,493
2.0
7.3
13.0
Germany
DAX
10,674
(2.9)
3.6
9.0
France
CAC
4,682
(6.1)
0.4
13.9
Source: Bloomberg, Angel Research
Stock Watch
December 09, 2015
Company Name
Reco
CMP
Target
Mkt Cap
Sales ( Čcr )
OPM(%)
EPS (Č)
PER(x)
P/BV(x)
RoE(%)
EV/Sales(x)
(Č)
Price ( Č)
( Č cr )
FY16E FY17E
FY16E
FY17E
FY16E
FY17E
FY16E
FY17E
FY16E
FY17E
FY16E
FY17E
FY16E
FY17E
Agri / Agri Chemical
Rallis
Neutral
175
-
3,410
2,075
2,394
14.4
14.4
9.5
11.0
18.5
15.9
3.7
3.2
21.1
21.3
1.7
1.4
United Phosphorus
Buy
404
510
17,298
13,698
15,752
17.6
17.6
32.1
38.5
12.6
10.5
2.5
2.0
21.4
21.3
1.4
1.1
Auto & Auto Ancillary
Ashok Leyland
Buy
90
111
25,528
17,995
21,544
11.4
11.6
3.4
4.7
26.4
19.1
4.6
4.3
17.7
22.2
1.4
1.1
Bajaj Auto
Accumulate
2,462
2,728
71,255
23,695
27,298
21.3
20.4
134.6
151.5
18.3
16.3
5.8
5.0
31.8
30.6
2.6
2.2
Bharat Forge
Accumulate
827
943
19,261
7,867
8,881
20.0
20.3
34.4
41.0
24.1
20.2
4.7
3.9
21.1
20.9
2.6
2.2
Eicher Motors
Buy
16,307
19,036
44,280
15,379
16,498
15.6
16.6
473.2
574.8
34.5
28.4
12.7
9.5
36.7
33.2
2.8
2.6
Hero Motocorp
Accumulate
2,603
2,774
51,976
28,561
31,559
14.7
14.7
151.1
163.2
17.2
16.0
6.7
5.7
38.7
35.6
1.7
1.5
Jamna Auto Industries Accumulate
122
129
974
1,292
1,486
9.3
9.8
6.0
7.5
20.3
16.3
4.2
3.6
20.7
21.8
0.8
0.7
L G Balakrishnan & Bros Neutral
512
-
804
1,254
1,394
11.6
11.8
35.9
41.7
14.3
12.3
1.9
1.7
13.5
13.8
0.7
0.7
Mahindra and Mahindra Accumulate
1,320
1,449
81,962
39,031
44,440
13.8
13.9
57.9
67.6
22.8
19.5
3.7
3.3
16.1
16.6
1.8
1.5
Maruti
Neutral
4,543
-
137,243
57,865
68,104
16.4
16.7
176.3
225.5
25.8
20.2
5.0
4.3
19.4
21.2
2.2
1.8
Minda Industries
Neutral
849
-
1,346
2,567
2,965
8.0
8.3
46.1
57.8
18.4
14.7
3.1
2.5
16.7
17.3
0.6
0.5
Motherson Sumi
Accumulate
277
313
36,699
39,343
45,100
8.8
9.1
10.1
12.5
27.5
22.2
8.7
6.8
35.3
34.4
1.0
0.9
Rane Brake Lining
Accumulate
335
366
265
454
511
11.1
11.4
23.8
28.1
14.1
11.9
2.0
1.8
14.2
15.3
0.7
0.7
Setco Automotive
Neutral
220
-
587
594
741
12.7
13.7
8.4
15.8
26.2
13.9
2.7
2.4
10.4
16.9
1.4
1.2
Tata Motors
Neutral
402
-
116,037
255,254
301,772
12.9
13.4
23.7
37.3
17.0
10.8
2.1
1.7
7.4
12.1
0.6
0.6
TVS Motor
Buy
275
338
13,072
11,569
13,648
7.3
8.7
10.3
16.1
26.7
17.1
6.7
5.2
24.8
30.5
1.1
0.9
Amara Raja Batteries
Buy
848
1,040
14,486
4,892
5,871
17.4
17.6
28.8
37.1
29.5
22.9
6.9
5.5
23.4
24.1
2.9
2.4
Exide Industries
Buy
140
162
11,870
6,950
7,784
14.4
14.8
6.6
7.3
21.2
19.1
2.7
2.4
12.6
12.8
1.4
1.3
Apollo Tyres
Accumulate
156
171
7,928
12,146
12,689
16.8
16.0
21.2
19.0
7.4
8.2
1.2
1.1
16.5
13.0
0.7
0.8
Ceat
Accumulate
1,027
1,119
4,155
6,041
6,597
14.1
13.7
99.5
111.9
10.3
9.2
2.0
1.7
19.6
18.5
0.8
0.7
JK Tyres
Neutral
106
-
2,397
7,446
7,669
15.2
14.0
19.6
18.4
5.4
5.7
1.4
1.1
25.2
19.5
0.7
0.6
Swaraj Engines
Neutral
912
-
1,133
552
630
14.2
14.7
44.6
54.1
20.5
16.9
4.8
4.3
23.2
25.6
1.9
1.6
Subros
Neutral
93
-
560
1,268
1,488
11.6
11.9
3.7
6.6
25.2
14.2
1.7
1.5
6.8
11.4
0.7
0.6
Indag Rubber
Neutral
225
-
592
283
329
17.0
17.2
13.0
15.4
17.4
14.6
3.8
3.2
21.8
21.6
1.8
1.5
Capital Goods
ACE
Neutral
42
-
416
660
839
4.7
8.2
1.0
3.9
42.0
10.8
1.3
1.2
3.2
11.3
0.8
0.6
BEML
Neutral
1,077
-
4,486
3,277
4,006
6.0
8.9
29.2
64.3
36.9
16.8
2.1
1.9
5.7
11.7
1.5
1.1
BGR Energy
Neutral
119
-
856
3,615
3,181
9.5
9.4
16.7
12.4
7.1
9.6
0.7
0.7
10.0
7.0
0.7
0.8
BHEL
Neutral
165
-
40,300
33,722
35,272
10.8
11.7
10.5
14.2
15.7
11.6
1.2
1.1
7.0
9.0
1.3
1.2
Stock Watch
December 09, 2015
Company Name
Reco
CMP
Target
Mkt Cap
Sales ( Čcr )
OPM(%)
EPS (Č)
PER(x)
P/BV(x)
RoE(%)
EV/Sales(x)
(Č)
Price ( Č)
( Č cr )
FY16E
FY17E
FY16E
FY17E
FY16E
FY17E
FY16E
FY17E
FY16E
FY17E
FY16E
FY17E
FY16E
FY17E
Capital Goods
Blue Star
Buy
354
429
3,184
3,548
3,977
6.3
6.9
13.7
17.2
25.9
20.6
6.5
4.2
26.1
25.4
1.0
0.8
Crompton Greaves
Accumulate
188
204
11,789
13,484
14,687
4.9
6.2
4.5
7.1
41.8
26.5
3.0
2.8
7.2
10.8
1.0
0.9
Inox Wind
Buy
350
505
7,758
4,980
5,943
17.0
17.5
26.6
31.6
13.1
11.1
3.9
2.9
35.0
30.0
1.7
1.4
KEC International
Neutral
149
-
3,837
8,791
9,716
6.1
6.8
5.4
8.2
27.6
18.2
2.8
2.5
10.0
14.0
0.7
0.6
Thermax
Neutral
898
-
10,700
6,413
7,525
7.4
8.5
30.5
39.3
29.4
22.9
4.5
3.9
15.0
17.0
1.6
1.4
Cement
ACC
Buy
1,338
1,630
25,123
13,151
14,757
16.4
18.3
63.9
83.4
20.9
16.0
2.7
2.5
13.3
16.1
1.8
1.5
Ambuja Cements
Buy
194
233
30,177
11,564
12,556
19.4
20.7
8.9
10.1
21.9
19.3
2.7
2.6
12.8
13.8
2.3
2.0
HeidelbergCement
Neutral
73
-
1,658
1,772
1,926
13.3
15.4
1.0
3.0
73.2
24.4
1.9
1.7
2.6
7.9
1.5
1.3
India Cements
Buy
83
112
2,539
4,216
4,840
18.0
19.5
4.0
9.9
20.7
8.4
0.8
0.8
4.0
9.5
0.9
0.7
JK Cement
Accumulate
656
744
4,586
3,661
4,742
10.1
15.8
18.0
61.0
36.4
10.8
2.6
2.3
7.5
22.9
1.7
1.3
J K Lakshmi Cement
Buy
330
430
3,884
2,947
3,616
16.7
19.9
11.5
27.2
28.7
12.1
2.7
2.4
9.8
20.8
1.7
1.4
Mangalam Cements
Neutral
208
-
556
1,053
1,347
10.5
13.3
8.4
26.0
24.8
8.0
1.0
1.0
4.3
12.5
0.9
0.7
Orient Cement
Accumulate
161
183
3,291
1,854
2,524
21.2
22.2
7.7
11.1
20.9
14.5
3.0
2.6
13.3
15.7
2.5
1.8
Ramco Cements
Neutral
371
-
8,833
4,036
4,545
20.8
21.3
15.1
18.8
24.6
19.7
3.0
2.7
12.9
14.3
2.7
2.3
Shree Cement^
Neutral
10,981
-
38,256
7,150
8,742
26.7
28.6
228.0
345.5
48.2
31.8
7.1
6.0
15.7
20.3
5.1
4.1
UltraTech Cement
Buy
2,850
3,282
78,205
25,021
30,023
19.1
21.6
89.0
132.0
32.0
21.6
3.7
3.2
12.2
15.9
3.2
2.7
Construction
ITNL
Neutral
82
-
2,683
7,360
8,825
34.0
35.9
7.0
9.0
11.7
9.1
0.4
0.4
3.2
3.7
3.7
3.6
KNR Constructions
Accumulate
605
673
1,700
937
1,470
14.3
14.0
33.5
38.6
18.0
15.7
2.7
2.4
15.4
15.4
1.9
1.2
Larsen & Toubro
Buy
1,322
1,646
123,102
65,065
77,009
11.5
11.7
61.5
65.6
21.5
20.2
2.2
2.0
13.4
14.0
2.1
1.8
Gujarat Pipavav Port
Neutral
155
-
7,491
629
684
51.0
52.2
6.4
5.9
24.2
26.3
3.2
2.9
15.9
12.7
11.6
10.4
MBL Infrastructures
Buy
213
285
885
2,313
2,797
12.2
14.6
19.0
20.0
11.2
10.7
1.2
1.1
11.3
10.6
1.1
1.0
Nagarjuna Const.
Neutral
77
-
4,292
7,892
8,842
8.8
9.1
3.0
5.3
25.7
14.6
1.3
1.2
5.0
8.5
0.8
0.7
PNC Infratech
Accumulate
529
558
2,714
1,873
2,288
13.2
13.5
24.0
32.0
22.0
16.5
2.1
1.9
12.1
12.3
1.6
1.3
Simplex Infra
Neutral
325
-
1,609
5,955
6,829
10.3
10.5
16.0
31.0
20.3
10.5
1.1
1.0
5.3
9.9
0.8
0.7
Power Mech Projects
Neutral
613
-
902
1,539
1,801
12.8
12.7
59.0
72.1
10.4
8.5
1.6
1.3
18.6
16.8
0.6
0.5
Sadbhav Engineering
Neutral
326
-
5,584
3,481
4,219
10.7
10.8
8.0
12.0
40.7
27.1
3.8
3.3
10.3
13.5
1.9
1.6
NBCC
Accumulate
947
1,089
11,364
7,382
9,506
7.7
8.6
39.8
54.4
23.8
17.4
5.7
4.5
26.7
29.1
1.3
1.0
SIPL
Neutral
100
-
3,528
675
1,042
62.4
64.7
-
-
3.8
4.3
-
-
16.9
11.4
Financials
Allahabad Bank
Neutral
71
-
4,234
8,569
9,392
2.8
2.9
16.3
27.5
4.3
2.6
0.4
0.3
7.6
11.9
-
-
Stock Watch
December 09, 2015
Company Name
Reco
CMP
Target
Mkt Cap
Sales ( Čcr )
OPM(%)
EPS (Č)
PER(x)
P/BV(x)
RoE(%)
EV/Sales(x)
(Č)
Price ( Č)
( Č cr )
FY16E
FY17E
FY16E
FY17E
FY16E
FY17E
FY16E
FY17E
FY16E
FY17E
FY16E
FY17E
FY16E
FY17E
Financials
Axis Bank
Buy
459
630
109,060
26,473
31,527
3.5
3.6
35.7
43.5
12.8
10.5
2.5
2.2
17.9
18.9
-
-
Bank of Baroda
Neutral
162
-
37,293
18,485
21,025
1.9
2.0
13.5
21.1
12.0
7.7
1.0
0.8
7.3
10.6
-
-
Bank of India
Neutral
119
-
9,392
15,972
17,271
1.9
2.0
15.3
33.4
7.8
3.6
0.4
0.3
3.6
7.6
-
-
Canara Bank
Neutral
250
-
13,580
15,441
16,945
2.0
2.1
46.6
70.4
5.4
3.6
0.5
0.4
8.0
11.2
-
-
Dena Bank
Neutral
42
-
2,697
3,440
3,840
2.1
2.3
7.3
10.0
5.8
4.2
0.4
0.4
6.1
7.9
-
-
Federal Bank
Neutral
57
-
9,857
3,477
3,999
3.0
3.0
5.0
6.2
11.4
9.2
1.2
1.1
10.6
11.9
-
-
HDFC
Neutral
1,171
-
184,870
10,358
11,852
3.3
3.3
41.1
47.0
28.5
24.9
5.4
4.9
24.7
24.9
-
-
HDFC Bank
Buy
1,049
1,262
264,750
38,309
47,302
4.3
4.3
49.3
61.1
21.3
17.2
3.7
3.2
18.5
19.7
-
-
ICICI Bank
Buy
261
354
151,950
34,279
39,262
3.3
3.3
21.0
24.4
12.5
10.7
2.1
1.8
14.4
14.7
-
-
IDBI Bank
Neutral
88
-
14,163
9,625
10,455
1.8
1.8
8.5
14.2
10.4
6.2
0.6
0.6
5.9
9.3
-
-
Indian Bank
Neutral
125
-
6,016
6,160
6,858
2.5
2.5
24.5
29.8
5.1
4.2
0.4
0.4
7.7
8.6
-
-
LIC Housing Finance
Buy
462
571
23,290
3,101
3,745
2.5
2.5
33.0
40.2
14.0
11.5
2.6
2.2
19.7
20.5
-
-
Oriental Bank
Neutral
140
-
4,199
7,643
8,373
2.4
2.4
37.2
45.4
3.8
3.1
0.3
0.3
8.2
9.4
-
-
Punjab Natl.Bank
Neutral
132
-
25,949
23,638
26,557
2.8
2.8
17.9
27.2
7.4
4.9
0.7
0.6
8.5
12.0
-
-
South Ind.Bank
Neutral
20
-
2,700
1,965
2,185
2.5
2.5
2.5
3.3
8.0
6.1
0.8
0.7
9.5
11.7
-
-
St Bk of India
Buy
236
283
183,124
82,520
93,299
2.7
2.8
20.0
24.5
11.8
9.6
1.3
1.1
11.5
12.8
-
-
Union Bank
Neutral
161
-
11,051
12,646
14,129
2.3
2.4
31.0
39.1
5.2
4.1
0.6
0.5
9.8
11.4
-
-
Vijaya Bank
Neutral
34
-
2,921
3,536
3,827
1.9
1.9
5.5
6.7
6.2
5.1
0.5
0.5
7.8
8.8
-
-
Yes Bank
Buy
726
921
30,421
7,190
9,011
3.2
3.3
58.2
69.7
12.5
10.4
2.2
1.9
19.2
19.6
-
-
FMCG
Asian Paints
Neutral
860
-
82,534
16,553
19,160
16.0
16.2
17.7
21.5
48.7
40.0
12.9
11.6
29.4
31.2
4.8
4.2
Britannia
Neutral
2,868
-
34,410
8,065
9,395
9.6
10.2
47.2
65.5
60.8
43.8
20.2
19.1
38.3
41.2
4.1
3.5
Colgate
Neutral
982
-
26,702
4,836
5,490
19.5
19.7
48.5
53.2
20.2
18.5
14.8
12.9
99.8
97.5
5.4
4.8
Dabur India
Neutral
276
-
48,464
9,370
10,265
17.1
17.2
7.3
8.1
37.6
34.0
11.3
9.2
33.7
30.6
5.1
4.6
GlaxoSmith Con*
Neutral
6,181
-
25,996
4,919
5,742
17.2
17.4
168.3
191.2
36.7
32.3
10.4
8.9
28.8
28.9
4.8
4.1
Godrej Consumer
Neutral
1,243
-
42,337
10,168
12,886
16.1
16.1
32.1
38.4
38.7
32.4
7.9
7.3
19.7
21.0
4.3
3.4
HUL
Neutral
826
-
178,649
34,940
38,957
17.5
17.7
20.8
24.7
39.7
33.4
44.2
35.3
110.5
114.2
4.9
4.4
ITC
Buy
315
382
253,183
41,068
45,068
37.8
37.4
13.9
15.9
22.7
19.8
7.6
6.7
34.1
33.8
5.8
5.2
Marico
Neutral
426
-
27,481
6,551
7,766
15.7
16.0
10.4
12.5
41.0
34.1
11.9
9.9
33.2
32.4
4.1
3.5
Nestle*
Accumulate
5,825
6,646
56,161
11,291
12,847
22.2
22.3
158.9
184.6
36.7
31.6
19.2
17.2
55.0
57.3
4.8
4.2
Stock Watch
December 09, 2015
Company Name
Reco
CMP
Target
Mkt Cap
Sales ( Čcr )
OPM(%)
EPS (Č)
PER(x)
P/BV(x)
RoE(%)
EV/Sales(x)
(Č)
Price ( Č)
( Č cr )
FY16E FY17E
FY16E
FY17E
FY16E
FY17E
FY16E
FY17E
FY16E
FY17E
FY16E
FY17E
FY16E
FY17E
FMCG
Tata Global
Accumulate
135
144
8,520
8,635
9,072
9.8
9.9
6.5
7.6
20.8
17.8
2.1
2.0
6.8
7.4
0.9
0.9
IT
HCL Tech^
Buy
858
1,132
120,882
42,038
47,503
23.2
23.5
55.8
62.9
15.4
13.6
3.5
2.7
23.0
19.8
2.5
2.0
Infosys
Buy
1,045
1,306
240,019
60,250
66,999
28.0
28.0
58.3
63.7
17.9
16.4
3.8
3.2
20.9
19.7
3.3
2.8
TCS
Buy
2,330
3,165
459,011
111,274
126,852
28.4
28.7
125.4
143.9
18.6
16.2
7.4
6.8
39.9
42.2
3.7
3.2
Tech Mahindra
Buy
532
646
51,375
25,566
28,890
16.0
17.0
26.3
31.9
20.2
16.7
3.6
3.1
17.9
18.6
1.8
1.5
Wipro
Buy
569
719
140,516
52,414
58,704
23.7
23.8
38.4
42.3
14.8
13.5
2.9
2.6
19.5
18.0
2.3
1.9
Media
D B Corp
Accumulate
334
356
6,135
2,241
2,495
27.8
27.9
21.8
25.6
15.3
13.0
4.0
3.5
26.7
28.5
2.7
2.4
HT Media
Neutral
79
-
1,833
2,495
2,603
11.2
11.2
7.3
8.6
10.8
9.2
0.9
0.8
7.4
8.1
0.2
0.2
Jagran Prakashan
Accumulate
149
169
4,869
2,170
2,355
27.2
26.2
8.9
9.9
16.7
15.1
3.5
3.1
20.9
20.5
2.1
2.0
Sun TV Network
Neutral
383
-
15,095
2,779
3,196
70.2
70.5
22.8
27.3
16.8
14.0
4.1
3.7
26.7
28.3
5.2
4.5
Hindustan Media
Neutral
278
-
2,039
920
1,031
20.0
20.0
19.2
20.9
14.5
13.3
2.4
2.0
16.4
15.3
1.8
1.5
Ventures
Metals & Mining
Coal India
Buy
318
380
200,829
76,167
84,130
19.9
22.3
22.4
25.8
14.2
12.3
5.1
5.0
35.5
41.0
2.0
1.8
Hind. Zinc
Buy
142
175
60,000
14,641
14,026
50.4
50.4
17.7
16.0
8.1
8.9
1.2
1.1
16.2
13.2
1.7
1.5
Hindalco
Neutral
76
-
15,673
104,356
111,186
8.7
9.5
6.7
11.1
11.3
6.9
0.4
0.4
3.5
5.9
0.7
0.6
JSW Steel
Neutral
962
-
23,251
42,308
45,147
16.4
20.7
(10.3)
49.5
19.4
1.1
1.0
(1.0)
5.6
1.6
1.5
NMDC
Neutral
88
-
35,028
8,237
10,893
46.6
44.5
10.0
11.7
8.9
7.6
1.0
0.9
12.5
13.0
4.0
3.1
SAIL
Neutral
44
-
18,338
45,915
53,954
7.2
10.5
1.5
4.4
29.5
10.1
0.4
0.4
2.3
4.1
1.0
0.9
Vedanta
Neutral
87
-
25,837
71,445
81,910
26.2
26.3
12.9
19.2
6.8
4.5
0.5
0.4
7.2
8.9
0.8
0.6
Tata Steel
Neutral
235
-
22,799
126,760
137,307
8.9
11.3
6.4
23.1
36.9
10.2
0.7
0.7
2.0
7.1
0.8
0.7
Oil & Gas
Cairn India
Neutral
128
-
24,017
11,323
12,490
49.4
51.0
20.7
20.7
6.2
6.2
0.4
0.4
6.4
6.1
1.2
0.6
GAIL
Neutral
340
-
43,065
64,856
70,933
9.1
9.6
24.0
28.9
14.2
11.8
1.2
1.1
8.8
9.6
0.9
0.8
ONGC
Neutral
216
-
184,884
154,564
167,321
36.8
37.4
28.6
32.5
7.6
6.7
1.0
0.9
12.7
13.5
1.4
1.3
Petronet LNG
Neutral
240
-
18,030
29,691
31,188
5.8
6.2
12.8
13.4
18.8
17.9
2.8
2.5
15.8
14.8
0.7
0.6
Indian Oil Corp
Accumulate
423
455
102,605
359,607
402,760
5.9
6.1
42.5
48.7
10.0
8.7
1.3
1.2
14.1
14.4
0.4
0.3
Reliance Industries
Accumulate
942
1,050
305,279
304,775
344,392
12.6
13.4
91.3
102.6
10.3
9.2
1.2
1.1
11.8
12.0
0.9
0.8
Pharmaceuticals
Alembic Pharma
Neutral
694
-
13,083
2,658
3,112
24.1
20.2
24.6
23.9
28.2
29.0
10.1
7.8
42.5
30.2
4.9
4.1
Aurobindo Pharma
Accumulate
798
872
46,583
14,923
17,162
23.0
23.0
38.2
43.6
20.9
18.3
6.4
4.8
36.0
30.2
3.5
3.0
Aventis*
Neutral
4,326
-
9,962
2,082
2,371
17.4
20.8
118.2
151.5
36.6
28.6
5.4
4.3
19.9
25.5
4.5
3.7
Cadila Healthcare
Neutral
394
-
40,300
10,224
11,840
21.0
22.0
14.6
17.6
27.0
22.4
7.4
5.8
30.8
29.0
4.0
3.4
Stock Watch
December 09, 2015
Company Name
Reco
CMP
Target
Mkt Cap
Sales ( Čcr )
OPM(%)
EPS (Č)
PER(x)
P/BV(x)
RoE(%)
EV/Sales(x)
(Č)
Price ( Č)
( Č cr )
FY16E FY17E
FY16E
FY17E
FY16E
FY17E
FY16E
FY17E
FY16E
FY17E
FY16E
FY17E
FY16E
FY17E
Pharmaceuticals
Cipla
Neutral
642
-
51,579
14,211
16,611
20.6
19.0
27.0
28.9
23.8
22.2
4.0
3.5
18.4
16.8
3.6
3.0
Dr Reddy's
Buy
3,071
3,933
52,363
16,838
19,575
25.0
23.1
167.5
178.8
18.3
17.2
3.9
3.2
23.1
20.4
3.0
2.6
Dishman Pharma
Neutral
322
-
2,602
1,733
1,906
21.5
21.5
17.0
19.9
19.0
16.2
1.9
1.7
10.5
11.2
2.0
1.7
GSK Pharma*
Neutral
3,265
-
27,659
2,870
3,158
20.0
22.1
59.5
68.3
54.9
47.8
16.2
16.6
28.5
34.3
9.1
8.4
Indoco Remedies
Neutral
315
-
2,907
1,033
1,199
15.9
18.2
9.4
13.6
33.6
23.2
5.0
4.2
15.7
19.7
2.9
2.5
Ipca labs
Buy
750
900
9,460
3,363
3,909
12.9
18.6
13.4
28.0
56.0
26.8
4.0
3.5
7.4
14.0
3.1
2.7
Lupin
Neutral
1,803
-
81,220
13,092
16,561
25.0
27.0
50.4
68.3
35.8
26.4
7.4
5.8
22.8
24.7
5.9
4.6
Sun Pharma
Buy
771
950
185,539
28,163
32,610
25.8
30.7
17.4
26.9
44.3
28.7
4.2
3.6
13.0
16.6
6.1
5.0
Power
Tata Power
Neutral
64
-
17,188
35,923
37,402
22.6
22.8
4.1
5.2
15.7
12.3
1.2
1.1
7.5
9.3
1.4
1.3
NTPC
Buy
130
157
107,232
87,064
98,846
23.5
23.5
11.7
13.2
11.1
9.9
1.2
1.2
11.4
12.1
2.3
2.0
Power Grid
Buy
130
170
67,906
20,702
23,361
86.7
86.4
12.1
13.2
10.7
9.8
1.6
1.4
15.6
15.1
8.2
7.6
Telecom
Bharti Airtel
Neutral
318
-
126,997
101,748
109,191
32.1
31.7
12.0
12.5
26.5
25.4
1.8
1.7
6.9
6.7
1.9
1.7
Idea Cellular
Neutral
136
-
48,816
34,282
36,941
32.0
31.5
5.9
6.2
23.0
21.9
2.1
1.9
9.9
9.3
2.0
1.9
zOthers
Abbott India
Neutral
5,303
-
11,269
2,715
3,153
14.5
14.1
134.3
152.2
39.5
34.8
9.9
8.1
27.4
25.6
3.9
3.3
Bajaj Electricals
Buy
211
341
2,125
4,719
5,287
5.2
5.8
8.6
12.7
24.6
16.6
2.8
2.5
11.4
14.8
0.4
0.4
Finolex Cables
Neutral
246
-
3,757
2,520
2,883
12.2
12.0
12.7
14.2
19.4
17.3
2.6
2.3
13.6
13.5
1.2
1.0
Goodyear India*
Accumulate
565
622
1,303
1,888
1,680
12.1
11.9
62.2
56.6
9.1
10.0
2.1
1.8
25.9
19.7
0.5
0.5
Hitachi
Neutral
1,317
-
3,582
1,779
2,081
7.8
8.8
21.8
33.4
60.4
39.4
9.8
7.9
17.4
22.1
2.1
1.8
Jyothy Laboratories
Neutral
306
-
5,543
1,620
1,847
11.5
11.5
7.3
8.5
42.0
36.1
5.4
5.0
13.3
14.4
3.3
2.8
MRF
Buy
39,228
45,575
16,637
20,316
14,488
21.4
21.1
5,488.0
3,798.0
7.2
10.3
2.4
2.0
41.1
21.2
0.8
1.0
Page Industries
Neutral
12,807
-
14,284
1,929
2,450
19.8
20.1
229.9
299.0
55.7
42.8
24.6
17.1
52.1
47.1
7.4
5.8
Relaxo Footwears
Neutral
492
-
5,899
1,767
2,152
12.3
12.5
19.3
25.1
25.5
19.6
6.3
4.8
27.7
27.8
3.4
2.8
Siyaram Silk Mills
Buy
1,137
1,354
1,065
1,636
1,815
11.5
11.5
89.9
104.1
12.6
10.9
2.1
1.8
17.9
17.8
0.8
0.7
Styrolution ABS India*
Neutral
706
-
1,241
1,271
1,440
8.6
9.2
32.0
41.1
22.0
17.2
2.3
2.0
10.7
12.4
0.9
0.8
TVS Srichakra
Buy
2,763
3,240
2,116
2,101
2,338
15.7
15.0
248.6
270.0
11.1
10.2
4.9
3.5
43.6
34.0
1.0
0.9
HSIL
Neutral
308
-
2,223
2,123
2,384
16.1
16.5
15.0
18.9
20.5
16.3
1.6
1.5
8.0
9.4
1.4
1.2
Kirloskar Engines India
Neutral
261
-
3,774
2,471
2,826
8.8
10.4
9.1
13.3
28.6
19.6
2.7
2.5
9.7
13.4
1.2
1.0
Ltd
M M Forgings
Buy
531
614
641
511
615
21.7
21.6
43.1
55.8
12.3
9.5
2.2
1.8
19.9
21.2
1.5
1.1
Banco Products (India)
Neutral
137
-
976
1,208
1,353
11.0
12.3
10.8
14.5
12.7
9.4
1.5
1.3
11.9
14.5
0.8
0.7
Stock Watch
December 09, 2015
Company Name
Reco
CMP
Target Mkt Cap
Sales ( Čcr )
OPM(%)
EPS (Č)
PER(x)
P/BV(x)
RoE(%)
EV/Sales(x)
(Č)
Price ( Č)
( Č cr )
FY16E FY17E FY16E FY17E FY16E FY17E FY16E FY17E FY16E FY17E FY16E FY17E FY16E FY17E
zOthers
Competent Automobiles Neutral
143
-
88
1,040
1,137
3.2
3.1
25.7
28.0
5.6
5.1
0.8
0.7
15.0
14.3
0.1
0.1
Nilkamal
Neutral
1,037
-
1,547
1,910
2,083
10.5
10.3
63.3
69.2
16.4
15.0
2.7
2.3
17.6
16.5
0.9
0.8
Visaka Industries
Accumulate
128
144
204
1,086
1,197
9.9
10.3
21.5
28.8
6.0
4.5
0.6
0.5
9.6
11.6
0.4
0.3
Transport Corporation of
Neutral
319
-
2,425
2,830
3,350
8.8
9.0
14.4
18.3
22.2
17.4
3.4
3.0
15.4
17.1
1.0
0.8
India
Elecon Engineering
Neutral
85
-
929
1,369
1,533
13.7
14.9
3.3
6.1
25.7
14.1
1.7
1.6
6.6
11.4
1.0
0.9
Surya Roshni
Buy
133
183
582
2,992
3,223
8.1
8.4
14.7
18.3
9.0
7.2
0.8
0.8
9.7
11.0
0.5
0.4
MT Educare
Buy
138
169
548
286
366
18.3
17.7
7.7
9.4
17.8
14.7
3.8
3.3
20.2
21.1
1.8
1.4
Radico Khaitan
Buy
104
156
1,384
1,565
1,687
12.2
13.0
5.7
7.1
18.3
14.7
1.5
1.4
8.3
9.6
1.3
1.2
Garware Wall Ropes
Accumulate
382
423
837
861
967
10.9
10.9
24.0
28.2
15.9
13.6
2.3
2.0
14.6
14.9
1.0
0.8
Wonderla Holidays
Neutral
376
-
2,122
206
308
44.0
43.6
9.0
12.9
41.7
29.1
5.7
5.2
13.7
17.8
10.2
6.8
Linc Pen & Plastics
Accumulate
173
185
256
340
371
8.3
8.9
10.8
13.2
16.0
13.1
2.6
2.2
16.0
17.1
0.8
0.7
The Byke Hospitality
Accumulate
164
181
659
222
287
20.5
20.5
5.6
7.6
29.2
21.8
5.5
4.5
18.9
20.8
3.0
2.3
Interglobe Aviation
Neutral
1,018
-
36,688
17,022
21,122
20.7
14.5
63.9
53.7
15.9
19.0
23.9
19.6
149.9
103.2
2.2
1.8
Coffee Day Enterprises
Neutral
257
-
5,299
2,692
2,964
17.0
18.6
-
4.7
-
54.3
3.2
3.0
0.2
5.5
2.4
2.2
Ltd
Navneet Education
Accumulate
86
97
2,039
998
1,062
24.1
24.0
5.8
6.1
14.9
14.1
3.3
2.9
22.0
20.6
2.1
2.0
Source: Company, Angel Research; Note: *December year end; #September year end; &October year end; Price as on December 08, 2015
Market Outlook
December 09, 2015
Research Team Tel: 022 - 39357800
DISCLAIMER
Angel Broking Private Limited (hereinafter referred to as “Angel”) is a registered Member of National Stock Exchange of India Limited,
Bombay Stock Exchange Limited and Metropolitian Stock Exchange of India Limited. It is also registered as a Depository Participant with
CDSL and Portfolio Manager with SEBI. It also has registration with AMFI as a Mutual Fund Distributor. Angel Broking Private Limited is a
registered entity with SEBI for Research Analyst in terms of SEBI (Research Analyst) Regulations, 2014 vide registration number
INH000000164. Angel or its associates has not been debarred/ suspended by SEBI or any other regulatory authority for accessing
/dealing in securities Market. Angel or its associates including its relatives/analyst do not hold any financial interest/beneficial ownership
of more than 1% in the company covered by Analyst. Angel or its associates/analyst has not received any compensation / managed or co
-managed public offering of securities of the company covered by Analyst during the past twelve months. Angel/analyst has not served as
an officer, director or employee of company covered by Analyst and has not been engaged in market making activity of the company
covered by Analyst.
This document is solely for the personal information of the recipient, and must not be singularly used as the basis of any investment
decision. Nothing in this document should be construed as investment or financial advice. Each recipient of this document should make
such investigations as they deem necessary to arrive at an independent evaluation of an investment in the securities of the companies
referred to in this document (including the merits and risks involved), and should consult their own advisors to determine the merits and
risks of such an investment.
Reports based on technical and derivative analysis center on studying charts of a stock's price movement, outstanding positions and
trading volume, as opposed to focusing on a company's fundamentals and, as such, may not match with a report on a company's
fundamentals.
The information in this document has been printed on the basis of publicly available information, internal data and other reliable sources
believed to be true, but we do not represent that it is accurate or complete and it should not be relied on as such, as this document is for
general guidance only. Angel Broking Pvt. Limited or any of its affiliates/ group companies shall not be in any way responsible for any
loss or damage that may arise to any person from any inadvertent error in the information contained in this report. Angel Broking Pvt.
Limited has not independently verified all the information contained within this document. Accordingly, we cannot testify, nor make any
representation or warranty, express or implied, to the accuracy, contents or data contained within this document. While Angel Broking
Pvt. Limited endeavors to update on a reasonable basis the information discussed in this material, there may be regulatory, compliance,
or other reasons that prevent us from doing so.
This document is being supplied to you solely for your information, and its contents, information or data may not be reproduced,
redistributed or passed on, directly or indirectly.
Neither Angel Broking Pvt. Limited, nor its directors, employees or affiliates shall be liable for any loss or damage that may arise from or
in connection with the use of this information.
Note: Please refer to the important ‘Stock Holding Disclosure' report on the Angel website (Research Section). Also, please refer to the
latest update on respective stocks for the disclosure status in respect of those stocks. Angel Broking Pvt. Limited and its affiliates may have
investment positions in the stocks recommended in this report.