Market Outlook
September 8, 2015
Dealer’s Diary
Domestic Indices
Chg (%)
(Pts)
(Close)
BSE Sensex
(1.2)
(308)
24,894
Indian markets are expected to open positive tracking the SGX Nifty and most of
global markets.
Nifty
(1.3)
(96)
7,559
MID CAP
(2.2)
(227)
10,133
US markets was closed on Monday for Labor Day Holiday, while on Friday it moved
SMALL CAP
(1.8)
(187)
10,419
lower as the Labor Department's monthly jobs report offered mixed data. The report
BSE HC
(2.6)
(440)
16,696
showed much weaker than expected job growth in August but also a drop in the
BSE PSU
(1.6)
(107)
6,415
unemployment rate and an increase in wages.
BANKEX
(2.1)
(387)
18,050
The European markets edged higher on Monday after falling sharply last week as
AUTO
(1.2)
(196)
16,787
investors fretted over China's economic slowdown and an impending U.S. interest-
METAL
(2.3)
(164)
6,952
rate hike.
OIL & GAS
(1.0)
(86)
8,454
The Indian markets tumbled on Monday to hit their lowest level in 15 months as
BSE IT
(1.0)
(106)
10,864
uncertainty over the timing of a U.S. rate hike and continued volatility in Chinese
Global Indices
Chg (%)
(Pts)
(Close)
shares affected investors' confidence. China will report exports data for August
Dow Jones
(1.7)
(272)
16,102
month today, which is expected to be lower by 6.7% yoy according to consensus,
NASDAQ
(1.0)
(50)
4,684
which may impact Indian markets in the near term.
FTSE
0.5
32
6,075
Nikkei
0.4
68
17,860
News & Result Analysis
Hang Sang
(1.2)
(257)
20,584
Mahindra & Mahindra aims to increase market share with upcoming TUV300
Refer detailed news analysis on the following page
Straits Times
(0.4)
(11)
2,852
Shanghai Com
(2.5)
(80)
3,080
Markets Today
The trend deciding level for the day is 25,044 / 7,603 levels. If NIFTY trades above
Indian ADR
Chg (%)
(Pts)
(Close)
this level during the first half-an-hour of trade then we may witness a further rally up
to 25,237 - 25,580 / 7,661 - 7,762 levels. However, if NIFTY trades below
INFY
(3.6)
(0.6)
$16.9
25,044 / 7,603 levels for the first half-an-hour of trade then it may correct towards
WIT
(3.9)
(0.5)
$11.5
24,701 - 24,509 / 7,501 - 7,444 levels.
IBN
(2.9)
(0.2)
$8.3
Indices
S2
S1
PIVOT
R1
R2
HDB
(1.9)
(1.1)
$56.3
SENSEX
24,509
24,701
25,044
25,237
25,580
Advances / Declines
BSE
NSE
NIFTY
7,444
7,501
7,603
7,661
7,762
Advances
666
215
Declines
2,021
1,323
Net Inflows (September 04, 2015)
` cr
Purch
Sales
Net
MTD
YTD
Unchanged
99
49
FII
3,615
4,733
(1,118)
(3,659)
120,102
Volumes (` cr)
MFs
1,466
899
568
2,190
72,838
BSE
2,042
FII Derivatives (September 07, 2015)
NSE
12,202
` cr
Purch
Sales
Net
Open Interest
Index Futures
1,202
2,289
(1,087)
20,853
Stock Futures
1,888
1,681
207
43,143
Gainers / Losers
Gainer
Loser
Company
Price (`)
chg (%)
Company
Price (`)
chg (%)
PMCFIN
2
4.9
AMTEKAUTO
29
(11.2)
CUB
58
3.9
WELCORP
92
(8.7)
HATHWAY
42
3.8
JUBILANT
305
(8.2)
GVKPIL
7
3.5
DELTACORP
70
(6.2)
NATIONALUM
34
2.6
STAR
1,074
(6.1)
Market Outlook
September 8, 2015
Mahindra & Mahindra aims to increase market share with
upcoming TUV300
Auto major Mahindra & Mahindra (M&M) is looking to enhance its market share in
the utility vehicles segment with the upcoming compact SUV, TUV300 which is
expected to be priced around `7-9 lakh.
The company will launch the TUV300, which will be available only as diesel
option, this week. It is looking to take on the likes of Ford's EcoSport and Renault's
Duster that are priced between `7.88 lakh and `13.54 lakh (ex-showroom Delhi).
Commenting on the significance of the new model, management said the
company did not have a major presence in the compact SUV segment, while
M&M's forte has been in the bigger UV segment, with models such as the Scorpio
and XUV500
The vehicle will be manufactured at M&M's facility at Chakan, where it also
produces trucks and other vehicles on the Maxximo platform.
Economic and Political News
Deficient rains to spoil cotton farmers' party
PM to meet industrialists today to discuss economic crisis
States opt for de-allocation of costly power
Corporate News
Snapdeal to invest $100-mn in Shopo
Maruti Suzuki may advance Gujarat unit production
India rejects patent on Pfizer's arthritis drug tofacitinib
Market Outlook
September 8, 2015
Top Picks
Large Cap
Market Cap
CMP
Target
Upside
Company
Sector
Rating
(` Cr)
(`)
(`)
(%)
Aurobindo
Pharma
41,167
Buy
705
872
23.7
Axis Bank
Financials
1,07,085
Buy
451
704
56.3
ICICI Bank
Financials
1,44,705
Buy
249
373
49.6
Infosys
IT
2,43,384
Buy
1,060
1,306
23.3
Inox Wind
Capital Goods
8,089
Buy
365
505
38.5
LIC HFL
Financials
20,340
Buy
403
570
41.4
Power Grid
Power
63,825
Buy
122
170
39.3
TCS
IT
4,97,419
Buy
2,540
3,168
24.8
Tech Mahindra IT
51,755
Buy
538
646
20.1
Yes Bank
Financials
27,211
Buy
650
951
46.2
Sun Pharma
Pharma
201,286 Accumulate
836
950
13.6
Source: Angel Research, Bloomberg
Mid Cap
Market Cap
CMP
Target
Upside
Company
Sector
Rating
(` Cr)
(`)
(`)
(%)
Bajaj Electricals
Others
2,373
Buy
235
341
45.0
Garware Wall RopesOthers
611
Buy
279
390
39.7
HMVL
Media
1,539
Buy
210
292
39.2
JK Tyre
Auto Ancillary
2,240
Buy
99
129
30.6
MBL Infra
Construction
954
Buy
230
360
56.4
Minda Industries
Auto Ancillary
784
Buy
494
652
31.9
MT Educare
Others
478
Buy
120
169
40.7
Radico Khaitan
Others
1,105
Buy
83
112
34.9
Surya Roshni
Others
492
Buy
112
183
62.9
Source: Angel Research, Bloomberg
Market Outlook
September 08, 2015
Global economic events release calendar
Date
Time
Country Event Description
Unit
Period
Bloomberg Data
Last Reported Estimated
September 8, 2015
2:30PM
Euro Zone Euro-Zone GDP s.a. (QoQ)
% Change
2Q P
0.30
0.30
China
Exports YoY%
% Change
Aug
(8.30)
(6.70)
September 9, 2015
2:00PM
UK
Industrial Production (YoY)
% Change
Jul
1.50
1.50
September 10, 2015
6:00PM
US
Initial Jobless claims
Thousands
Sep 5
282.00
275.00
India
Imports YoY%
% Change
Aug
(10.28)
--
India
Exports YoY%
% Change
Aug
(10.30)
--
7:00AM
China
Consumer Price Index (YoY)
% Change
Aug
1.60
1.90
4:30PM
UK
BOE Announces rates
% Ratio
Sep 10
0.50
0.50
September 11, 2015
5:30PM
India
Industrial Production YoY
% Change
Jul
3.80
--
September 13, 2015
11:00AM
China
Industrial Production (YoY)
% Change
Aug
6.00
6.30
September 14, 2015
12:00PM
India
Monthly Wholesale Prices YoY%
% Change
Aug
(4.05)
--
September 15, 2015
6:45PM
US
Industrial Production
%
Aug
0.56
--
2:00PM
UK
CPI (YoY)
% Change
Aug
0.10
--
September 16, 2015
2:00PM
UK
Jobless claims change
% Change
Aug
(4.90)
--
2:30PM
Euro Zone Euro-Zone CPI (YoY)
%
Aug F
0.20
--
6:00PM
US
Consumer price index (mom)
% Change
Aug
0.10
--
September 17, 2015
6:00PM
US
Building permits
Thousands
Aug
1,130.00
--
6:00PM
US
Housing Starts
Thousands
Aug
1,206.00
--
11:30PM
US
FOMC rate decision
%
Sep 17
0.25
0.50
September 21, 2015
7:30PM
US
Existing home sales
Million
Aug
5.59
--
September 22, 2015
7:30PM
Euro Zone Euro-Zone Consumer Confidence
Value
Sep A
(6.90)
--
September 23, 2015
1:00PM
Germany PMI Services
Value
Sep P
54.90
--
1:00PM
Germany PMI Manufacturing
Value
Sep P
53.30
--
September 24, 2015
7:30PM
US
New home sales
Thousands
Aug
507.00
--
September 25, 2015
6:00PM
US
GDP Qoq (Annualised)
% Change
2Q T
3.70
--
September 29, 2015
7:30PM
US
Consumer Confidence
S.A./ 1985=100
Sep
101.54
--
11:00AM
India
RBI Reverse Repo rate
%
Sep 29
6.25
--
11:00AM
India
RBI Repo rate
%
Sep 29
7.25
--
11:00AM
India
RBI Cash Reserve ratio
%
Sep 29
4.00
--
September 30, 2015
1:25PM
Germany Unemployment change (000's)
Thousands
Sep
(7.00)
--
2:00PM
UK
GDP (YoY)
% Change
2Q F
2.60
--
October 1, 2015
6:30AM
China
PMI Manufacturing
Value
Sep
49.70
--
2:00PM
UK
PMI Manufacturing
Value
Sep
51.50
--
Source: Bloomberg, Angel Research
Market Outlook
September 8, 2015
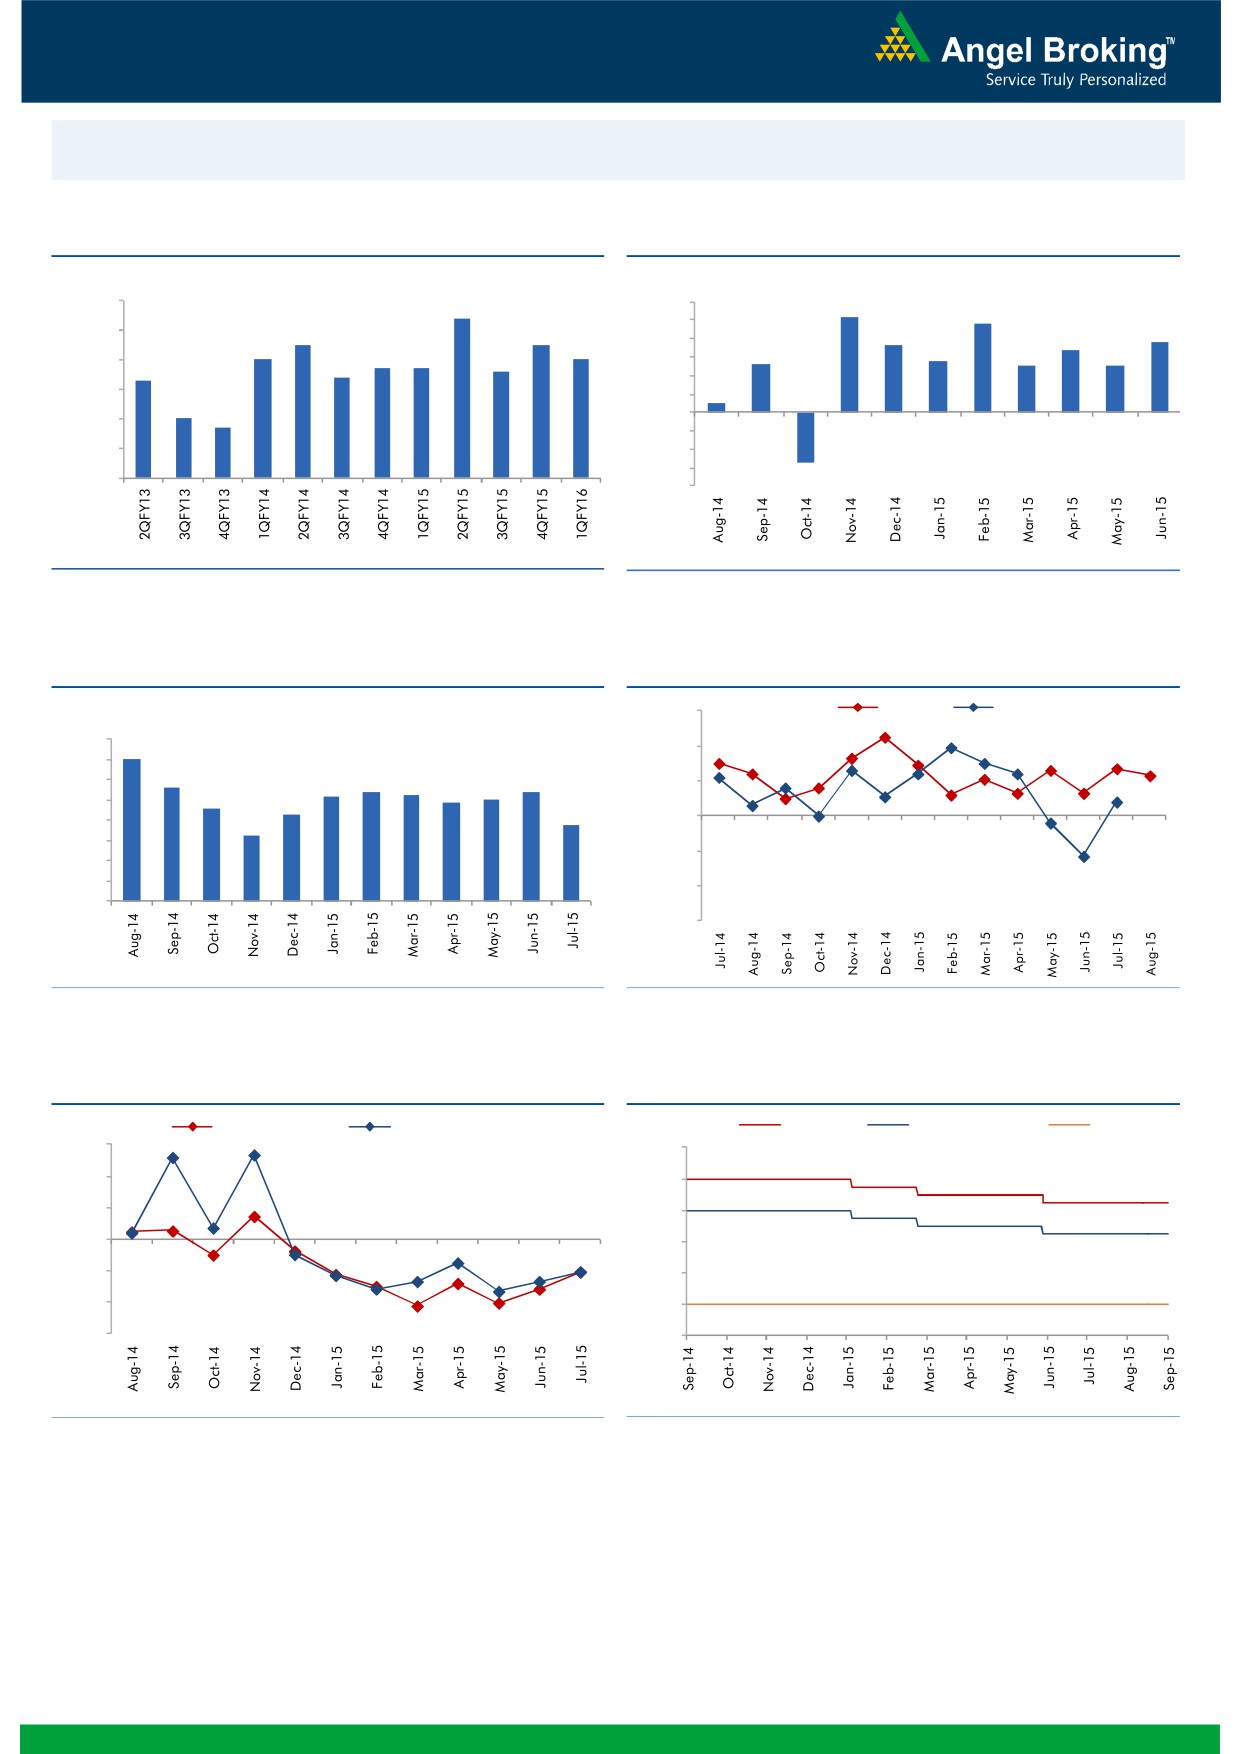
Macro watch
Exhibit 1: Quarterly GDP trends
Exhibit 2: IIP trends
(%)
(%)
9.0
8.4
6.0
5.2
4.8
7.5
7.5
5.0
3.8
8.0
3.6
3.4
7.0
7.0
4.0
2.8
6.7
6.7
2.6
2.5
2.5
7.0
6.3
6.4
6.6
3.0
2.0
6.0
0.5
1.0
5.0
4.7
-
5.0
(1.0)
4.0
(2.0)
(3.0)
3.0
(2.7)
(4.0)
Source: CSO, Angel Research
Source: MOSPI, Angel Research
Exhibit 3: Monthly CPI inflation trends
Exhibit 4: Manufacturing and services PMI
(%)
56.0
Mfg. PMI
Services PMI
8.0
7.0
54.0
7.0
5.6
5.4
6.0
5.2
5.4
5.3
5.0
52.0
4.6
4.9
5.0
4.3
3.8
4.0
3.3
50.0
3.0
48.0
2.0
1.0
46.0
-
44.0
Source: MOSPI, Angel Research
Source: Market, Angel Research; Note: Level above 50 indicates expansion
Exhibit 5: Exports and imports growth trends
Exhibit 6: Key policy rates
(%)
Exports yoy growth
Imports yoy growth
(%)
Repo rate
Reverse Repo rate
CRR
30.0
9.00
20.0
8.00
10.0
7.00
0.0
6.00
(10.0)
5.00
(20.0)
4.00
(30.0)
3.00
Source: Bloomberg, Angel Research
Source: RBI, Angel Research
Market Outlook
September 8, 2015
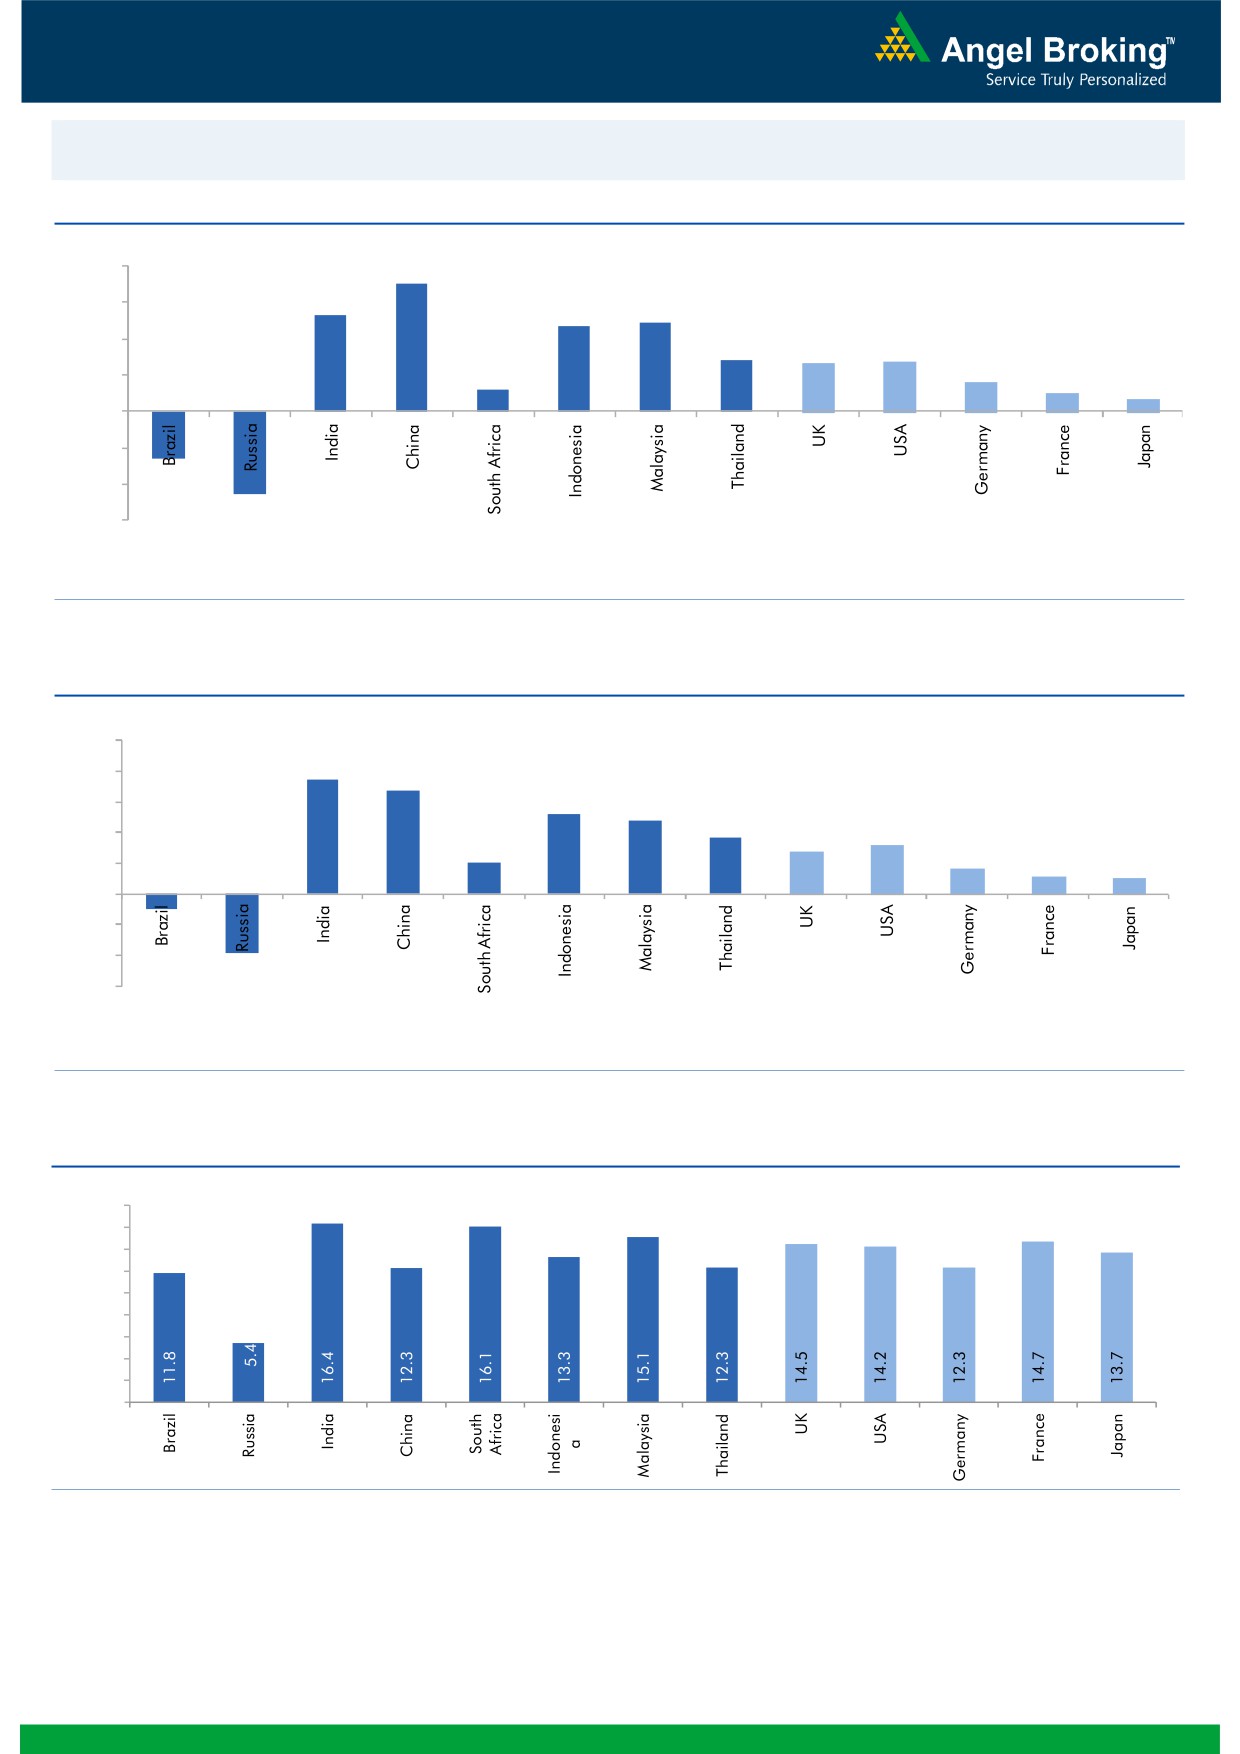
Global watch
Exhibit 1: Latest quarterly GDP Growth (%, yoy) across select developing and developed countries
(%)
8.0
7.0
6.0
5.3
4.9
4.7
4.0
2.8
2.6
2.7
1.6
2.0
1.2
1.0
0.7
(2.6)
(4.6)
-
(2.0)
(4.0)
(6.0)
Source: Bloomberg, Angel Research
Exhibit 2: 2015 GDP Growth projection by IMF (%, yoy) across select developing and developed countries
(%)
10.0
7.5
8.0
6.8
5.2
6.0
4.8
3.7
3.1
4.0
2.7
2.0
1.6
1.2
1.0
2.0
(3.8)
(1.0)
-
(2.0)
(4.0)
(6.0)
Source: IMF, Angel Research
Exhibit 3: One year forward P-E ratio across select developing and developed countries
(x)
18.0
16.0
14.0
12.0
10.0
8.0
6.0
4.0
2.0
-
Source: Bloomberg, Angel Research
Market Outlook
September 8, 2015
Exhibit 4: Relative performance of indices across globe
Returns (%)
Country
Name of index
Closing price
1M
3M
1YR
Brazil
Bovespa
46,498
(7.5)
(12.2)
(24.9)
Russia
Micex
1,701
1.5
3.3
16.7
India
Nifty
7,559
(12.0)
(5.8)
(5.8)
China
Shanghai Composite
3,080
(17.1)
(39.1)
38.5
South Africa
Top 40
43,389
(8.2)
(5.7)
(7.0)
Mexico
Mexbol
42,756
(4.8)
(4.0)
(7.5)
Indonesia
LQ45
724
(11.9)
(18.7)
(18.6)
Malaysia
KLCI
1,583
(8.3)
(9.3)
(15.3)
Thailand
SET 50
892
(5.5)
(9.2)
(14.8)
USA
Dow Jones
16,102
(8.2)
(9.8)
(5.9)
UK
FTSE
6,075
(10.0)
(10.5)
(11.0)
Japan
Nikkei
17,860
(13.6)
(12.7)
15.5
Germany
DAX
10,109
(12.7)
(8.1)
3.7
France
CAC
4,550
(12.4)
(6.2)
2.4
Source: Bloomberg, Angel Research
Market Outlook
September 08, 2015
Stock Watch
Company Name
Reco
CMP
Target
Mkt Cap
Sales ( Čcr )
OPM(%)
EPS (Č)
PER(x)
P/BV(x)
RoE(%)
EV/Sales(x)
(Č)
Price ( Č)
( Č cr )
FY16E FY17E
FY16E
FY17E
FY16E
FY17E
FY16E
FY17E
FY16E
FY17E
FY16E
FY17E
FY16E
FY17E
Agri / Agri Chemical
Rallis
Neutral
206
-
3,996
2,075
2,394
14.4
14.4
9.5
11.0
21.6
18.7
4.3
3.7
21.1
21.3
2.0
1.7
United Phosphorus
Neutral
527
-
22,570
13,698
15,752
17.6
17.6
32.1
38.5
16.4
13.7
3.2
2.7
21.4
21.3
1.8
1.5
Auto & Auto Ancillary
Ashok Leyland
Accumulate
82
97
23,322
18,186
21,529
10.8
11.2
3.3
4.5
24.8
18.2
4.2
3.9
17.3
21.6
1.3
1.1
Bajaj Auto
Accumulate
2,193
2,438
63,451
23,544
27,245
19.8
19.8
127.0
143.4
17.3
15.3
5.2
4.5
30.3
29.4
2.3
1.9
Eicher Motors
Buy
17,443
22,859
47,344
11,681
15,550
15.3
16.9
358.5
564.3
48.7
30.9
14.6
10.9
29.8
34.9
4.2
3.1
Hero Motocorp
Accumulate
2,280
2,672
45,525
28,500
32,764
14.1
14.3
146.9
167.0
15.5
13.7
5.9
5.0
37.8
36.5
1.5
1.3
L G Balakrishnan & Bros Neutral
451
-
708
1,254
1,394
11.6
11.8
35.9
41.7
12.6
10.8
1.7
1.5
13.5
13.8
0.7
0.6
Mahindra and Mahindra Buy
1,111
1,383
69,028
38,337
43,069
13.0
13.4
52.9
63.5
21.0
17.5
3.1
2.8
15.0
15.9
1.5
1.3
Maruti
Buy
4,072
4,735
123,009
58,102
68,587
16.7
16.9
182.0
225.5
22.4
18.1
4.5
3.8
19.9
21.0
1.9
1.5
Minda Industries
Buy
494
652
784
2,567
2,965
7.3
8.0
38.8
54.3
12.7
9.1
1.8
1.5
14.4
16.8
0.4
0.3
Rane Brake Lining
Buy
271
366
214
454
511
11.1
11.4
23.8
28.1
11.4
9.6
1.6
1.5
14.2
15.3
0.6
0.6
Setco Automotive
Neutral
220
-
588
594
741
12.7
13.7
8.4
15.8
26.2
13.9
2.7
2.4
10.4
16.9
1.4
1.2
Tata Motors
Buy
324
391
93,430
264,038
297,882
13.8
13.9
34.5
38.9
9.4
8.3
1.6
1.3
17.6
16.8
0.5
0.5
TVS Motor
Neutral
218
-
10,359
11,702
13,713
6.8
7.7
10.1
14.5
21.6
15.0
5.3
4.3
24.5
28.3
0.9
0.7
Amara Raja Batteries
Neutral
927
-
15,827
5,101
6,224
17.8
17.6
31.1
39.2
29.8
23.6
7.4
5.9
24.8
24.8
3.2
2.6
Exide Industries
Accumulate
147
159
12,516
7,363
8,247
13.7
14.5
6.6
7.7
22.3
19.1
2.8
2.6
12.6
13.3
1.5
1.3
Apollo Tyres
Neutral
169
-
8,587
12,576
12,978
16.8
16.1
22.3
19.9
7.6
8.5
1.3
1.1
17.2
13.4
0.8
0.8
Ceat
Neutral
1,069
-
4,324
6,041
6,597
14.3
14.2
101.5
116.6
10.5
9.2
2.1
1.8
20.0
19.1
0.9
0.8
JK Tyres
Buy
99
129
2,240
7,446
7,669
15.2
14.0
19.6
18.4
5.0
5.4
1.3
1.1
25.2
19.5
0.7
0.6
Swaraj Engines
Neutral
855
-
1,062
593
677
14.5
14.8
51.2
60.8
16.7
14.1
3.9
3.5
23.3
24.8
1.7
1.4
Subros
Neutral
78
-
466
1,268
1,488
11.6
11.9
3.7
6.6
21.0
11.8
1.4
1.3
6.8
11.4
0.7
0.6
Indag Rubber
Neutral
167
-
439
283
329
17.0
17.2
13.0
15.4
12.9
10.9
2.8
2.3
21.8
21.6
1.4
1.1
Capital Goods
ACE
Neutral
36
-
355
660
839
4.7
8.2
1.0
3.9
35.9
9.2
1.1
1.0
3.2
11.3
0.7
0.6
BEML
Neutral
1,188
-
4,948
3,277
4,006
6.0
8.9
29.2
64.3
40.7
18.5
2.3
2.1
5.7
11.7
1.6
1.3
BGR Energy
Neutral
101
-
730
3,615
3,181
9.5
9.4
16.7
12.4
6.1
8.2
0.6
0.6
10.0
7.0
0.6
0.8
BHEL
Neutral
201
-
49,185
33,722
35,272
10.8
11.7
10.5
14.2
19.1
14.2
1.4
1.3
7.0
9.0
1.6
1.5
Blue Star
Accumulate
339
387
3,047
3,649
4,209
5.0
5.9
9.2
14.7
37.0
23.0
6.7
6.3
9.1
17.5
0.9
0.8
Crompton Greaves
Buy
155
204
9,730
13,484
14,687
4.9
6.2
4.5
7.1
34.5
21.9
2.4
2.3
7.2
10.8
0.9
0.8
Inox Wind
Buy
365
505
8,089
4,980
5,943
17.0
17.5
26.6
31.6
13.7
11.5
4.1
3.0
35.0
30.0
1.8
1.5
Market Outlook
September 08, 2015
Stock Watch
Company Name
Reco
CMP
Target
Mkt Cap
Sales ( Čcr )
OPM(%)
EPS (Č)
PER(x)
P/BV(x)
RoE(%)
EV/Sales(x)
(Č)
Price ( Č)
( Č cr )
FY16E
FY17E
FY16E
FY17E
FY16E
FY17E
FY16E
FY17E
FY16E
FY17E
FY16E
FY17E
FY16E
FY17E
Capital Goods
KEC International
Neutral
127
-
3,255
8,791
9,716
6.1
6.8
5.4
8.2
23.4
15.4
2.3
2.2
10.0
14.0
0.6
0.6
Thermax
Neutral
898
-
10,703
6,413
7,525
7.4
8.5
30.5
39.3
29.5
22.9
4.5
3.9
15.0
17.0
1.8
1.5
Cement
ACC
Accumulate
1,348
1,548
25,302
11,856
14,092
14.5
17.8
47.6
76.1
28.3
17.7
2.9
2.7
10.6
15.7
2.0
1.6
Ambuja Cements
Accumulate
207
233
32,124
10,569
12,022
20.7
22.2
8.7
10.7
23.8
19.4
3.0
2.9
13.0
15.2
2.7
2.4
India Cements
Buy
69
112
2,109
4,716
5,133
15.9
16.9
3.7
7.5
18.6
9.2
0.7
0.7
3.8
7.3
0.8
0.6
JK Cement
Buy
603
767
4,217
4,056
4,748
14.5
17.0
22.6
41.1
26.7
14.7
2.4
2.1
9.3
15.3
1.5
1.2
J K Lakshmi Cement
Buy
358
430
4,213
2,947
3,616
16.7
19.9
11.5
27.2
31.1
13.2
3.0
2.6
9.8
20.8
1.8
1.4
Mangalam Cements
Neutral
202
-
539
1,053
1,347
10.5
13.3
8.4
26.0
24.0
7.8
1.0
0.9
4.3
12.5
0.9
0.7
Orient Cement
Accumulate
161
183
3,304
1,854
2,524
21.2
22.2
7.7
11.1
20.9
14.5
3.0
2.6
13.3
15.7
2.6
1.8
Ramco Cements
Accumulate
317
350
7,551
4,036
4,545
20.8
21.3
15.1
18.8
21.0
16.9
2.6
2.3
12.9
14.3
2.4
2.0
Shree Cement^
Neutral
10,656
-
37,123
7,150
8,742
26.7
28.6
228.0
345.5
46.7
30.8
6.9
5.8
15.7
20.3
5.1
4.1
UltraTech Cement
Accumulate
2,858
3,282
78,418
27,562
31,548
20.4
22.3
111.9
143.3
25.5
19.9
3.6
3.1
15.2
16.8
2.9
2.5
Construction
ITNL
Neutral
89
-
2,203
7,360
8,825
34.0
35.9
1.0
5.0
89.3
17.9
0.4
0.4
0.3
1.4
3.7
3.6
KNR Constructions
Neutral
520
-
1,461
915
1,479
14.3
13.9
20.3
37.2
25.6
14.0
2.4
2.0
9.6
15.6
1.8
1.2
Larsen & Toubro
Buy
1,510
2,013
140,535
68,920
82,446
10.9
11.5
57.0
73.0
26.5
20.7
2.4
2.3
13.6
15.5
2.3
1.9
Gujarat Pipavav Port
Neutral
182
-
8,820
721
784
53.1
53.6
8.2
9.1
22.2
20.1
3.6
2.9
20.0
18.3
11.4
10.1
MBL Infrastructures
Buy
230
360
954
2,313
2,797
12.2
14.6
19.0
20.0
12.1
11.5
1.3
1.2
11.3
10.6
1.1
1.0
Nagarjuna Const.
Neutral
55
-
3,069
7,892
8,842
8.3
9.1
2.4
5.3
23.0
10.4
0.9
0.9
4.2
8.6
0.7
0.6
PNC Infratech
Neutral
461
-
2,364
1,798
2,132
13.2
13.5
22.0
30.0
21.0
15.4
1.9
1.7
11.5
11.4
1.5
1.2
Simplex Infra
Neutral
264
-
1,306
6,241
7,008
10.4
10.7
20.0
36.0
13.2
7.3
1.1
1.0
6.8
11.1
0.7
0.6
Financials
Allahabad Bank
Neutral
76
-
4,314
8,859
9,817
3.0
3.0
23.7
30.1
3.2
2.5
0.4
0.3
10.6
12.3
-
-
Axis Bank
Buy
451
704
107,085
26,522
31,625
3.6
3.6
36.2
45.4
12.5
9.9
2.4
2.1
18.2
19.6
-
-
Bank of Baroda
Neutral
170
-
37,540
18,934
21,374
2.0
2.0
13.2
15.1
12.9
11.2
1.0
0.9
7.1
7.7
-
-
Bank of India
Neutral
127
-
8,471
17,402
20,003
2.0
2.1
40.3
50.7
3.2
2.5
0.3
0.3
9.0
10.4
-
-
Canara Bank
Neutral
253
-
13,027
15,805
17,745
2.0
2.2
64.3
73.5
3.9
3.4
0.4
0.4
10.8
11.3
-
-
Dena Bank
Neutral
39
-
2,200
3,580
4,040
2.1
2.2
8.4
10.9
4.7
3.6
0.4
0.3
6.8
8.4
-
-
Federal Bank
Neutral
57
-
9,803
3,522
4,045
3.2
3.2
12.2
14.1
4.7
4.1
0.6
0.5
12.9
13.4
-
-
HDFC
Neutral
1,149
-
181,197
11,198
13,321
3.5
3.5
45.1
53.7
25.5
21.4
5.3
4.7
27.2
28.2
-
-
HDFC Bank
Buy
985
1,255
247,829
38,629
47,500
4.5
4.7
52.6
66.4
18.7
14.8
3.4
2.9
19.6
21.2
-
-
Market Outlook
September 08, 2015
Stock Watch
Company Name
Reco
CMP
Target
Mkt Cap
Sales ( Čcr )
OPM(%)
EPS (Č)
PER(x)
P/BV(x)
RoE(%)
EV/Sales(x)
(Č)
Price ( Č)
( Č cr )
FY16E FY17E
FY16E
FY17E
FY16E
FY17E
FY16E
FY17E
FY16E
FY17E
FY16E
FY17E
FY16E
FY17E
Financials
ICICI Bank
Buy
249
373
144,705
36,037
41,647
3.5
3.6
22.9
26.7
10.9
9.3
1.8
1.6
15.7
15.9
-
-
IDBI Bank
Neutral
54
-
8,653
9,806
11,371
1.7
1.9
10.0
16.3
5.4
3.3
0.4
0.4
6.8
10.4
-
-
Indian Bank
Neutral
124
-
5,975
6,454
7,321
2.5
2.6
26.4
33.3
4.7
3.7
0.4
0.4
8.1
9.6
-
-
LIC Housing Finance
Buy
403
570
20,340
2,934
3,511
2.3
2.3
30.9
36.8
13.0
11.0
2.1
1.8
16.8
17.5
-
-
Oriental Bank
Neutral
122
-
3,660
7,930
8,852
2.5
2.5
51.8
57.1
2.4
2.1
0.3
0.2
9.3
9.5
-
-
Punjab Natl.Bank
Neutral
128
-
23,738
24,160
27,777
2.9
3.0
18.5
24.6
6.9
5.2
0.7
0.6
8.8
10.8
-
-
South Ind.Bank
Neutral
20
-
2,700
1,999
2,249
2.4
2.4
3.5
4.0
5.8
5.0
0.7
0.7
12.6
13.1
-
-
St Bk of India
Buy
222
309
167,743
86,900
100,550
3.1
3.1
22.1
27.7
10.1
8.0
1.2
1.1
12.7
14.3
-
-
Union Bank
Neutral
154
-
9,759
12,995
14,782
2.4
2.4
32.3
40.9
4.8
3.8
0.6
0.5
10.7
12.3
-
-
Vijaya Bank
Neutral
35
-
2,994
3,474
3,932
1.8
1.9
5.9
7.2
5.9
4.9
0.5
0.4
8.1
9.3
-
-
Yes Bank
Buy
650
951
27,211
7,006
8,825
3.1
3.3
61.4
77.1
10.6
8.4
2.0
1.7
20.1
21.3
-
-
FMCG
Asian Paints
Neutral
790
-
75,729
16,553
19,160
16.0
16.2
17.7
21.5
44.7
36.7
11.9
10.7
29.4
31.2
4.5
3.9
Britannia
Neutral
2,898
-
34,774
8,065
9,395
9.6
10.2
47.2
65.5
61.4
44.3
20.4
19.3
38.3
41.2
4.3
3.7
Colgate
Neutral
1,849
-
25,144
4,836
5,490
19.5
19.7
48.5
53.2
38.1
34.8
27.9
24.3
99.8
97.5
5.3
4.7
Dabur India
Neutral
277
-
48,646
9,370
10,265
17.1
17.2
7.3
8.1
37.8
34.2
11.4
9.3
33.7
30.6
5.1
4.7
GlaxoSmith Con*
Neutral
6,044
-
25,420
4,919
5,742
17.2
17.4
168.3
191.2
35.9
31.6
10.2
8.7
28.8
28.9
4.8
4.1
Godrej Consumer
Neutral
1,173
-
39,946
10,168
12,886
16.1
16.1
32.1
38.4
36.6
30.6
7.4
6.9
19.7
21.0
4.5
3.6
HUL
Neutral
820
-
177,447
34,940
38,957
17.5
17.7
20.8
24.7
39.4
33.2
43.9
35.0
110.5
114.2
5.0
4.4
ITC
Buy
313
409
251,334
41,068
45,068
37.8
37.4
13.9
15.9
22.5
19.7
7.5
6.6
34.1
33.8
5.9
5.3
Marico
Neutral
397
-
25,600
6,551
7,766
15.7
16.0
10.4
12.5
38.2
31.8
11.1
9.2
33.2
32.4
3.9
3.3
Nestle*
Accumulate
5,992
6,646
57,771
11,291
12,847
22.2
22.3
158.9
184.6
37.7
32.5
19.7
17.7
55.0
57.3
4.9
4.3
Tata Global
Buy
120
152
7,596
8,635
9,072
9.8
9.9
6.5
7.6
18.5
15.9
1.8
1.8
6.8
7.4
0.8
0.8
IT
HCL Tech^
Buy
921
1,132
129,474
42,038
47,503
23.5
23.5
56.4
62.9
16.3
14.6
3.8
2.9
23.2
19.8
2.8
2.2
Infosys
Buy
1,060
1,306
243,384
60,250
66,999
28.0
28.0
58.3
63.7
18.2
16.6
3.8
3.3
20.9
19.7
3.5
3.0
TCS
Buy
2,540
3,168
497,419
108,420
123,559
28.8
28.7
127.2
143.9
20.0
17.7
8.0
7.4
39.9
41.8
4.3
3.7
Tech Mahindra
Buy
538
646
51,755
25,566
28,890
16.0
17.0
26.3
31.9
20.5
16.9
3.7
3.1
17.9
18.6
1.8
1.5
Wipro
Buy
552
719
136,300
52,414
58,704
23.7
23.8
38.4
42.3
14.4
13.1
2.8
2.5
19.5
18.0
2.2
1.8
Media
D B Corp
Buy
302
356
5,556
2,241
2,495
27.8
27.9
21.8
25.6
13.9
11.8
3.6
3.2
26.7
28.5
2.5
2.2
HT Media
Neutral
75
-
1,754
2,495
2,603
11.2
11.2
7.3
8.6
10.3
8.8
0.8
0.7
7.4
8.1
0.2
0.2
Market Outlook
September 08, 2015
Stock Watch
Company Name
Reco
CMP
Target
Mkt Cap
Sales ( Čcr )
OPM(%)
EPS (Č)
PER(x)
P/BV(x)
RoE(%)
EV/Sales(x)
(Č)
Price ( Č)
( Č cr )
FY16E FY17E
FY16E
FY17E
FY16E
FY17E
FY16E
FY17E
FY16E
FY17E
FY16E
FY17E
FY16E
FY17E
Media
Jagran Prakashan
Buy
132
156
4,319
1,939
2,122
26.0
26.0
8.3
9.2
15.9
14.4
2.7
2.5
17.5
17.1
2.2
2.0
Sun TV Network
Neutral
371
-
14,636
2,779
3,196
70.2
70.5
22.8
27.3
16.3
13.6
4.0
3.6
26.7
28.3
5.0
4.4
Hindustan Media
Buy
210
292
1,539
920
1,031
20.0
20.0
19.2
20.9
10.9
10.1
1.8
1.5
16.4
15.3
1.3
1.1
Ventures
Metals & Mining
Coal India
Buy
338
400
213,240
72,015
78,415
21.2
21.5
21.7
25.3
15.5
13.4
5.3
5.2
33.1
39.1
2.3
2.1
Hind. Zinc
Neutral
130
-
54,993
15,546
16,821
47.5
49.0
19.7
20.3
6.6
6.4
1.1
1.0
17.2
16.6
1.2
0.8
Hindalco
Neutral
72
-
14,785
112,328
119,817
7.7
7.9
16.3
20.1
4.4
3.6
0.3
0.3
8.0
8.5
0.6
0.5
JSW Steel
Neutral
894
-
21,608
48,125
53,595
18.8
21.0
46.9
97.5
19.1
9.2
0.9
0.9
4.4
9.5
1.3
1.1
NMDC
Neutral
94
-
37,427
12,544
13,330
59.5
59.7
16.3
16.5
5.8
5.7
1.0
1.0
5.1
9.9
1.9
1.9
SAIL
Neutral
48
-
19,742
56,365
63,383
6.9
8.0
7.1
8.2
6.7
5.9
0.4
0.4
7.0
7.1
0.9
0.8
Vedanta
Neutral
90
-
26,638
81,842
88,430
30.6
32.8
20.2
25.7
4.5
3.5
0.3
0.3
7.5
8.5
0.7
0.5
Tata Steel
Neutral
216
-
20,969
136,805
149,228
11.3
11.9
26.4
36.8
8.2
5.9
0.7
0.6
6.0
8.0
0.7
0.6
Oil & Gas
Cairn India
Neutral
147
-
27,588
12,617
14,513
33.7
40.0
25.5
27.7
5.8
5.3
0.4
0.4
7.4
7.7
0.8
0.6
GAIL
Neutral
277
-
35,150
75,595
85,554
8.6
8.0
31.8
36.1
8.7
7.7
0.9
0.9
10.7
11.4
0.6
0.5
ONGC
Neutral
226
-
193,354
174,773
192,517
22.7
24.8
34.6
38.2
6.5
5.9
0.9
0.9
14.2
14.9
1.2
1.1
Petronet LNG
Buy
177
210
13,283
39,007
40,785
3.8
4.2
9.2
11.0
19.4
16.2
2.2
2.0
11.6
12.7
0.4
0.4
Indian Oil Corp
Buy
394
455
95,758
359,607
402,760
5.9
6.1
42.5
48.7
9.3
8.1
1.2
1.1
14.1
14.4
0.4
0.3
Reliance Industries
Accumulate
833
930
269,754
339,083
384,014
7.8
9.5
75.7
94.5
11.0
8.8
1.1
1.0
10.7
12.2
1.1
1.0
Pharmaceuticals
Alembic Pharma
Neutral
653
-
12,314
2,601
3,115
21.2
20.2
20.8
23.9
31.4
27.3
10.1
7.6
37.2
31.8
5.2
4.2
Aurobindo Pharma
Buy
705
872
41,167
14,923
17,162
23.0
23.0
38.2
43.6
18.5
16.2
5.7
4.3
36.0
30.2
3.2
2.7
Aventis*
Neutral
3,943
-
9,080
2,156
2,455
15.1
16.8
109.7
133.9
35.9
29.5
4.9
4.0
18.4
22.5
3.8
3.2
Cadila Healthcare
Neutral
1,795
-
36,746
10,224
11,840
20.0
21.0
71.0
85.6
25.3
21.0
6.8
5.3
30.1
28.5
3.8
3.2
Cipla
Neutral
649
-
52,146
14,051
16,515
20.4
18.7
26.6
28.4
24.4
22.9
4.1
3.5
18.2
16.5
3.7
3.1
Dr Reddy's
Neutral
3,949
-
67,333
17,903
20,842
22.7
22.8
160.5
189.5
24.6
20.8
5.0
4.1
22.2
21.7
4.0
3.3
Dishman Pharma
Accumulate
245
290
1,973
1,716
1,888
20.2
20.2
16.3
21.6
15.0
11.3
1.4
1.3
9.7
11.7
1.4
1.1
GSK Pharma*
Neutral
3,337
-
28,262
2,870
3,158
20.0
22.1
59.5
68.3
56.1
48.9
16.5
17.0
28.5
34.3
9.4
8.6
Indoco Remedies
Neutral
335
-
3,088
1,088
1,262
18.2
18.2
13.1
15.5
25.6
21.6
5.0
4.2
21.2
21.1
2.9
2.5
Ipca labs
Neutral
750
-
9,466
3,507
4,078
17.6
18.6
25.8
32.0
29.1
23.5
3.8
3.3
13.8
14.9
3.1
2.7
Lupin
Neutral
1,804
-
81,204
14,864
17,244
26.9
26.9
62.1
71.1
29.1
25.4
7.1
5.6
27.4
24.6
5.4
4.5
Sun Pharma
Accumulate
836
950
201,286
28,163
32,610
25.8
30.7
17.4
26.9
48.1
31.1
4.6
4.0
13.0
16.6
7.1
5.9
Market Outlook
September 08, 2015
Stock Watch
Company Name
Reco
CMP
Target
Mkt Cap
Sales ( Čcr )
OPM(%)
EPS (Č)
PER(x)
P/BV(x)
RoE(%)
EV/Sales(x)
(Č)
Price ( Č)
( Č cr )
FY16E FY17E
FY16E
FY17E
FY16E
FY17E
FY16E
FY17E
FY16E
FY17E
FY16E
FY17E
FY16E
FY17E
Power
Tata Power
Neutral
56
-
15,186
38,302
38,404
14.1
13.1
5.1
6.0
10.9
9.4
1.1
1.0
9.2
10.3
1.3
1.3
NTPC
Buy
113
157
92,885
87,064
98,846
23.5
23.5
11.7
13.2
9.6
8.5
1.1
1.0
11.4
12.1
2.1
1.9
Power Grid
Buy
122
170
63,825
20,702
23,361
86.7
86.4
12.1
13.2
10.1
9.2
1.5
1.3
15.6
15.1
8.1
7.5
Telecom
Bharti Airtel
Neutral
347
-
138,730
101,748
109,191
32.1
31.7
12.0
12.5
28.9
27.8
2.0
1.9
6.9
6.7
2.0
1.8
Idea Cellular
Neutral
145
-
52,191
34,282
36,941
32.0
31.5
5.9
6.2
24.6
23.4
2.3
2.0
9.9
9.3
2.2
2.1
zOthers
Abbott India
Neutral
5,319
-
11,302
2,715
3,153
14.5
14.1
134.3
152.2
39.6
34.9
9.9
8.1
27.4
25.6
3.6
3.1
Bajaj Electricals
Buy
235
341
2,373
4,719
5,287
5.2
5.8
8.6
12.7
27.5
18.6
3.1
2.8
11.4
14.8
0.5
0.5
Finolex Cables
Neutral
231
-
3,533
2,728
3,036
10.8
11.0
14.4
16.8
16.0
13.8
2.4
2.1
15.2
15.3
1.1
0.9
Goodyear India*
Buy
519
655
1,196
1,953
1,766
12.4
12.0
67.4
59.6
7.7
8.7
1.9
1.6
27.7
20.2
0.4
0.4
Hitachi
Neutral
1,272
-
3,459
1,806
2,112
9.0
9.2
28.6
29.1
44.5
43.8
11.1
8.9
28.1
22.6
2.1
1.8
Jyothy Laboratories
Neutral
301
-
5,445
1,620
1,847
11.5
11.5
7.3
8.5
41.3
35.5
5.3
4.9
13.3
14.4
3.3
2.8
MRF
Accumulate
38,069
43,575
16,145
20,727
14,841
19.3
18.6
4,905.8
3,351.9
7.8
11.4
2.5
2.0
37.6
19.6
0.8
1.0
Page Industries
Neutral
13,596
-
15,164
1,929
2,450
19.8
20.1
229.9
299.0
59.1
45.5
26.1
18.1
52.1
47.1
8.3
6.5
Relaxo Footwears
Neutral
487
-
5,844
1,767
2,152
12.3
12.5
19.3
25.1
25.3
19.4
6.2
4.8
27.7
27.8
3.5
2.9
Siyaram Silk Mills
Accumulate
999
1,221
937
1,653
1,873
11.7
12.2
99.3
122.1
10.1
8.2
1.8
1.5
19.5
20.2
0.8
0.7
Styrolution ABS India*
Neutral
741
-
1,303
1,271
1,440
8.6
9.2
32.0
41.1
23.1
18.1
2.4
2.1
10.7
12.4
1.0
0.9
Tree House
Buy
383
449
1,621
259
324
56.8
56.8
17.0
21.7
22.5
17.7
2.3
2.0
10.1
11.5
6.3
5.2
TVS Srichakra
Buy
2,352
3,210
1,801
2,127
2,388
15.2
14.9
237.7
267.5
9.9
8.8
4.2
3.0
51.7
39.8
1.0
0.8
HSIL
Buy
251
434
1,818
2,085
2,436
18.5
18.6
21.7
28.9
11.6
8.7
1.2
1.1
10.0
12.1
1.0
0.8
Kirloskar Engines India
Accumulate
269
297
3,889
2,634
3,252
10.1
12.0
10.9
17.4
24.7
15.4
2.8
2.5
11.4
16.8
1.1
0.9
Ltd
M M Forgings
Buy
545
797
658
563
671
22.1
22.9
51.0
66.5
10.7
8.2
2.2
1.8
23.1
24.1
1.4
1.1
Banco Products (India)
Neutral
113
-
809
1,208
1,353
11.0
12.3
10.8
14.5
10.5
7.8
1.2
1.1
11.9
14.5
0.7
0.6
Competent Automobiles Neutral
137
-
84
1,007
1,114
3.1
3.1
23.7
28.2
5.8
4.9
0.8
0.7
13.9
14.6
0.1
0.1
Nilkamal
Neutral
918
-
1,369
1,948
2,147
10.6
10.3
60.0
67.0
15.3
13.7
2.4
2.1
16.8
16.1
0.8
0.7
Visaka Industries
Buy
121
166
192
1,158
1,272
8.6
9.5
23.7
32.7
5.1
3.7
0.5
0.5
10.1
12.5
0.4
0.3
Transport Corporation of
Buy
211
293
1,608
2,830
3,350
8.8
9.0
14.4
18.3
14.7
11.6
2.3
2.0
15.4
17.1
0.8
0.7
India
Elecon Engineering
Buy
67
87
727
1,452
1,596
14.0
14.7
4.4
6.2
15.1
10.7
1.3
1.1
8.6
11.2
0.8
0.7
Surya Roshni
Buy
112
183
492
2,992
3,223
8.3
8.5
14.7
18.3
7.6
6.2
0.7
0.6
9.8
11.0
0.5
0.4
MT Educare
Buy
120
169
478
286
366
18.3
17.7
7.7
9.4
15.6
12.8
3.3
2.9
20.2
21.1
1.7
1.3
Market Outlook
September 08, 2015
Stock Watch
Company Name
Reco
CMP
Target Mkt Cap
Sales ( Čcr )
OPM(%)
EPS (Č)
PER(x)
P/BV(x)
RoE(%)
EV/Sales(x)
(Č)
Price ( Č)
( Č cr )
FY16E FY17E FY16E FY17E FY16E FY17E FY16E FY17E FY16E FY17E FY16E FY17E FY16E FY17E
zOthers
Radico Khaitan
Buy
83
112
1,105
1,565
1,687
11.9
12.4
5.4
6.6
15.3
12.6
1.2
1.1
8.0
9.0
1.2
1.2
Garware Wall Ropes
Buy
279
390
611
875
983
10.4
10.6
23.1
27.8
12.1
10.0
1.7
1.5
14.1
14.8
0.7
0.6
Wonderla Holidays
Buy
279
322
1,578
206
308
44.0
43.6
9.0
12.9
31.0
21.7
4.2
3.8
13.7
17.8
7.4
4.9
Linc Pen & Plastics
Buy
147
185
218
340
371
8.3
8.9
10.8
13.2
13.6
11.2
2.2
1.9
16.0
17.1
0.7
0.6
Source: Company, Angel Research; Note: *December year end; #September year end; &October year end; Price as on September 07, 2015
Market Outlook
September 08, 2015
Research Team Tel: 022 - 39357800
DISCLAIMER
Angel Broking Private Limited (hereinafter referred to as “Angel”) is a registered Member of National Stock Exchange of India Limited,
Bombay Stock Exchange Limited and MCX Stock Exchange Limited. It is also registered as a Depository Participant with CDSL and
Portfolio Manager with SEBI. It also has registration with AMFI as a Mutual Fund Distributor. Angel Broking Private Limited is a registered
entity with SEBI for Research Analyst in terms of SEBI (Research Analyst) Regulations, 2014 vide registration number INH000000164.
Angel or its associates has not been debarred/ suspended by SEBI or any other regulatory authority for accessing /dealing in securities
Market. Angel or its associates including its relatives/analyst do not hold any financial interest/beneficial ownership of more than 1% in
the company covered by Analyst. Angel or its associates/analyst has not received any compensation / managed or co-managed public
offering of securities of the company covered by Analyst during the past twelve months. Angel/analyst has not served as an officer,
director or employee of company covered by Analyst and has not been engaged in market making activity of the company covered by
Analyst.
This document is solely for the personal information of the recipient, and must not be singularly used as the basis of any investment
decision. Nothing in this document should be construed as investment or financial advice. Each recipient of this document should make
such investigations as they deem necessary to arrive at an independent evaluation of an investment in the securities of the companies
referred to in this document (including the merits and risks involved), and should consult their own advisors to determine the merits and
risks of such an investment.
Reports based on technical and derivative analysis center on studying charts of a stock's price movement, outstanding positions and
trading volume, as opposed to focusing on a company's fundamentals and, as such, may not match with a report on a company's
fundamentals.
The information in this document has been printed on the basis of publicly available information, internal data and other reliable sources
believed to be true, but we do not represent that it is accurate or complete and it should not be relied on as such, as this document is for
general guidance only. Angel Broking Pvt. Limited or any of its affiliates/ group companies shall not be in any way responsible for any
loss or damage that may arise to any person from any inadvertent error in the information contained in this report. Angel Broking Pvt.
Limited has not independently verified all the information contained within this document. Accordingly, we cannot testify, nor make any
representation or warranty, express or implied, to the accuracy, contents or data contained within this document. While Angel Broking
Pvt. Limited endeavors to update on a reasonable basis the information discussed in this material, there may be regulatory, compliance,
or other reasons that prevent us from doing so.
This document is being supplied to you solely for your information, and its contents, information or data may not be reproduced,
redistributed or passed on, directly or indirectly.
Neither Angel Broking Pvt. Limited, nor its directors, employees or affiliates shall be liable for any loss or damage that may arise from or
in connection with the use of this information.
Note: Please refer to the important ‘Stock Holding Disclosure' report on the Angel website (Research Section). Also, please refer to the
latest update on respective stocks for the disclosure status in respect of those stocks. Angel Broking Pvt. Limited and its affiliates may have
investment positions in the stocks recommended in this report.