Market Outlook
June 08, 2016
Market Cues
Domestic Indices
Chg (%)
(Pts)
(Close)
Indian Markets are expected to open in green tracking SGX Nifty & Global Markets.
BSE Sensex
0.9
232
27,010
The US markets ended flat to positive after gaining strength in the last few trading
Nifty
0.8
65
8,266
session. On Mon day Federal chairperson Yellen struck a generally positive tone to
Mid Cap
0.3
33
11,417
the US economy, warning markets against overreacting to the disappointing US non
Small Cap
1.0
108
11,281
farm pay rolls numbers on Friday.
Bankex
1.6
330
20,536
Euorpean stocks posted strong gains yesterday as a rise in oil price and latest
comments Fed Chairperson Janet Yellen, boosted investor sentiment. The FTSe
Global Indices
Chg (%)
(Pts)
(Close)
closed 0.2% higher while France’s CAC went up by 1.2% and Germany’s DAX
Dow Jones
0.1
18
17,938
pushed up further ahead gaining by 1.65% at day end.
Nasdaq
(0.1)
(7)
4,962
The Indian market opened with flat to positive not yesterday but picked up
FTSE
0.2
11
6,285
momentum after the RBI’s second bimonthly policy review. The RBI kept the key
policy rates unchanged and said there is an upside risk to the inflation target.
Nikkei
(0.3)
(55)
16,620
However it has retained its inflation target at 5% for Jan, 2017. Banking stocks
Hang Seng
(0.4)
(88)
21,241
posted strong gain led by ICICI Bank and SBI as the RBI said it is in the process of
Shanghai Com
(0.7)
(21)
2,915
setting up a stressed asset equity fund to help banks overcome the NPA issues. The
apex Bank has also retained its FY17 GDP growth projections at 7.6%, and this
Advances / Declines
BSE
NSE
seems to have played a positive sentiment for the market participants.
Advances
1,489
933
News Analysis
Declines
1,143
616
Alstom-Bharatforge JV signs $ 219 Mn deal
Unchanged
161
77
Detailed analysis on Pg2
Investor’s Ready Reckoner
Volumes (` Cr)
Key Domestic & Global Indicators
BSE
2,726
Stock Watch: Latest investment recommendations on 150+ stocks
NSE
19,024
Refer Pg4 onwards
Net Inflows (` Cr)
Net
Mtd
Ytd
Top Picks
CMP
Target
Upside
FII
1,612
2,558
16,927
Company
Sector
Rating
(`)
(`)
(%)
MFs
(154)
(342)
9,089
Amara Raja
Auto/Auto Ancillary
Buy
835
1,076
28.9
HCL Tech
IT
Buy
727
1,000
37.6
Top Gainers
Price (`)
Chg (%)
LIC Housing
Financials
Buy
475
592
24.7
J&Kbank
64
10.8
Bharat Electronics
Capital Goods
Buy
1,217
1,414
16.2
Fsl
46
9.0
Navkar Corporation Others
Buy
195
265
35.6
More Top Picks on Pg3
Edelweiss
77
8.8
Aban
209
6.5
Key Upcoming Events
Ipcalab
431
6.2
Previous
Consensus
Date
Region
Event Description
Reading
Expectations
June 08 UK
Industrial Production (YoY)
(0.20)
(0.40)
Top Losers
Price (`)
Chg (%)
June 08 China
Consumer price Index (YoY)
2.30
2.20
Aloktext
3
(7.6)
June 09 US
Initial Jobless claims
267.0
270.0
Dbcorp
373
(3.9)
June 09 India
Industrial Production YoY
0.10
(0.60)
6.(
Cox&Kings
153
(2.6)
More Events on Pg4
Glenmark
764
(2.3)
Jetairways
552
(2.3)
As on June 7, 2016
Market Outlook
June 08, 2016
Alstom Bharat Forge JV to Supply Steam Generators worth
$219Mn to NTPC in Telenagana:
Alstom Bharat Forge Power Private Ltd, the JV between GE and Bharat Forge Ltd,
have signed a contract worth $219Mn (`1495 cr) with NTPC Ltd. The JV will supply
two units of 800 MW ultra super critical steam turbine generator islands on EPC
basis, along with related civil work for the Telangana Super Thermal Power Project
Phase I in Telangana. The total power demand from the southern region is
34,000 MW. The 800 MW Steam Turbine Generator Islands for the power plant
will be the first with ultra super critical parameters and will help in meeting the ever
increasing power demand of southern states in India by adding a much needed
1600 MW to electricity grid. The equipment for the project will be manufactured
majorly at the JV’s state of the art facility at Sanand , Gujarat.
Alstom Bharat Forge Power Pvt Ltd is a joint venture between GE and Bharat Forge
Ltd, created to participate in the Indian market of turbines Islands (steam turbines
and generators, heat exchangers and all associated equipments. The JV Company
has set the cornerstone of its new manufacturing facility in India. The JV
manufacturers 300-800 MW subcritical and super critical equipment with an
annual capacity of 4000 MW.
Economic and Political News
Work to begin on `4,000 cr Metrino project in 2 months.
Amazon to invest $3 bn more in India
Ministry plans phase II of solar parks targets 40,000 MW
US backs India’s NSG membership
Mamata Banerjee asks Amit Mitra to iron out differences on GST
Corporate News
RCom -Aircel Merger on track, may conclude in July, 2016
GMR Infra Led Consortium bags `2280 cr order.
Market Outlook
June 08, 2016
Top Picks ★★★★★
Large Cap
Market Cap
CMP
Target
Upside
Company
Rationale
(` Cr)
(`)
(`)
(%)
To outpace battery industry growth due to better technological
Amara Raja Batteries
14,261
835
1,076
28.9
products leading to market share gains in both the automotive
OEM and replacement segments.
Uptick in defense capex by government, coupled with BELs
Bharat Electronics
29,216
1,217
1,414
16.2
strong market positioning, indicate good times ahead for BEL.
HCL Tech
53,852
3,158
3,476
10.1
Stock is trading at attractive valuations & factors all bad news.
Strong visibility for a robust 20% earnings trajectory, coupled
HDFC Bank
1,02,520
727
1,000
37.6
with high quality of earnings on account of high quality retail
business and strategic focus on highly rated corporates.
Back on the growth trend, expect a long term growth of 14%
Infosys
2,96,983
1,174
1,262
7.5
to be a US$20bn in FY2020.
Continues to grow its retail loan book at healthy pace with
LIC Housing Finance
2,88,772
1,257
1,374
9.3
improvement in asset quality. Expect LICHF to post a healthy
loan book which is likely to reflect in a strong earnings growth.
Huge bid pipeline of re-development works at Delhi and other
NBCC
23,949
475
592
24.7
State Governments and opportunity from Smart City, positions
NBCC to report strong growth, going forward.
Strong market positioning within the domestic AC markets to
Voltas
11,556
193
220
14.2
continue, EMP business set to revive
Source: Company, Angel Research
Mid Cap
Market Cap
CMP
Target
Upside
Company
Rationale
(` Cr)
(`)
(`)
(%)
Among the top 4 players in the consumer durables segment.
Bajaj Electricals
2,206
219
268
22.6
Improved profitability backed by turn around in E&P segment.
Strong order book lends earnings visibility.
Favourable outlook for AC industry to augur well for Cooling
Blue Star
3,901
434
495
14.1
products business. EMPPAC division's profitability to improve
once operating environment turns around.
With a focus on the low and medium income (LMI) consumer
Dewan Housing
5,760
197
270
36.8
segment, the company has increased its presence in tier-II &
III cities where the growth opportunity is immense.
Strong loan growth backed by diversified loan portfolio and
Equitas Holdings
5,894
176
235
33.7
adequate CAR. ROE & ROA likely to remain decent as risk of
dilution remains low. Attractive valuations considering growth.
Commencement of new projects, downtrend in the interest
IL&FS Transport
2,331
71
93
31.3
rate cycle, to lead to stock re-rating
Economic recovery to have favourable impact on advertising
& circulation revenue growth. Further, the acquisition of a
Jagran Prakashan
5,613
172
205
19.4
radio business (Radio City) would also boost the company's
revenue growth.
Speedier execution and speedier sales, strong revenue
Mahindra Lifespace
1,824
445
554
24.6
visibility in short-to-long run, attractive valuations
Massive capacity expansion along with rail advantage at ICD
Navkar Corporation
2,787
195
265
35.6
as well CFS augurs well for the company
Earnings boost on back of stable material prices and
Radico Khaitan
1,239
93
125
34.2
favourable pricing environment. Valuation discount to peers
provides additional comfort
Strong brands and distribution network would boost growth
Siyaram Silk Mills
986
1,052
1,347
28.1
going ahead. Stock currently trades at an inexpensive
valuation.
Source: Company, Angel Research
Market Outlook
June 08, 2016
Key Upcoming Events
Global economic events release calendar
Date
Time
Country
Event Description
Unit
Period
Bloomberg Data
Last Reported Estimated
Jun 8, 2016
2:00PM
UK
Industrial Production (YoY)
% Change
Apr
(0.20)
(0.40)
7:00AM
China
Consumer Price Index (YoY)
% Change
May
2.30
2.20
Jun 9, 2016
China
Exports YoY%
% Change
May
(1.80)
(4.00)
6:00PM
US
Initial Jobless claims
Thousands
Jun 4
267.00
270.00
Jun 10, 2016
India
Imports YoY%
% Change
May
(23.10)
--
India
Exports YoY%
% Change
May
(6.70)
--
5:30PM
India
Industrial Production YoY
% Change
Apr
0.10
(0.60)
Jun 12, 2016
11:00AM
China
Industrial Production (YoY)
% Change
May
6.00
6.00
Jun 14, 2016
12:00PM
India
Monthly Wholesale Prices YoY%
% Change
May
0.34
--
2:00PM
UK
CPI (YoY)
% Change
May
0.30
--
Jun 15, 2016
2:00PM
UK
Jobless claims change
% Change
May
(2.40)
--
US
Producer Price Index (mom)
% Change
May
0.20
--
6:45PM
US
Industrial Production
%
May
0.66
(0.15)
2:30PM
Euro Zone
Euro-Zone CPI (YoY)
%
May F
(0.10)
--
Jun 16, 2016
11:30PM
US
FOMC rate decision
%
Jun 15
0.50
0.50
6:00PM
US
Consumer price index (mom)
% Change
May
0.40
0.30
4:30PM
UK
BOE Announces rates
% Ratio
Jun 16
0.50
--
Jun 17, 2016
6:00PM
US
Housing Starts
Thousands
May
1,172.00
1,163.00
6:00PM
US
Building permits
Thousands
May
1,130.00
1,148.00
Jun 22, 2016
7:30PM
Euro Zone
Euro-Zone Consumer Confidence
Value
Jun A
(7.00)
--
7:30PM
US
Existing home sales
Million
May
5.45
--
Jun 23, 2016
1:00PM
Germany
PMI Services
Value
Jun P
55.20
--
1:00PM
Germany
PMI Manufacturing
Value
Jun P
52.10
--
7:30PM
US
Consumer Confidence
S.A./ 1985=100
Jun
92.60
--
Source: Bloomberg, Angel Research
Market Outlook
June 07, 2016
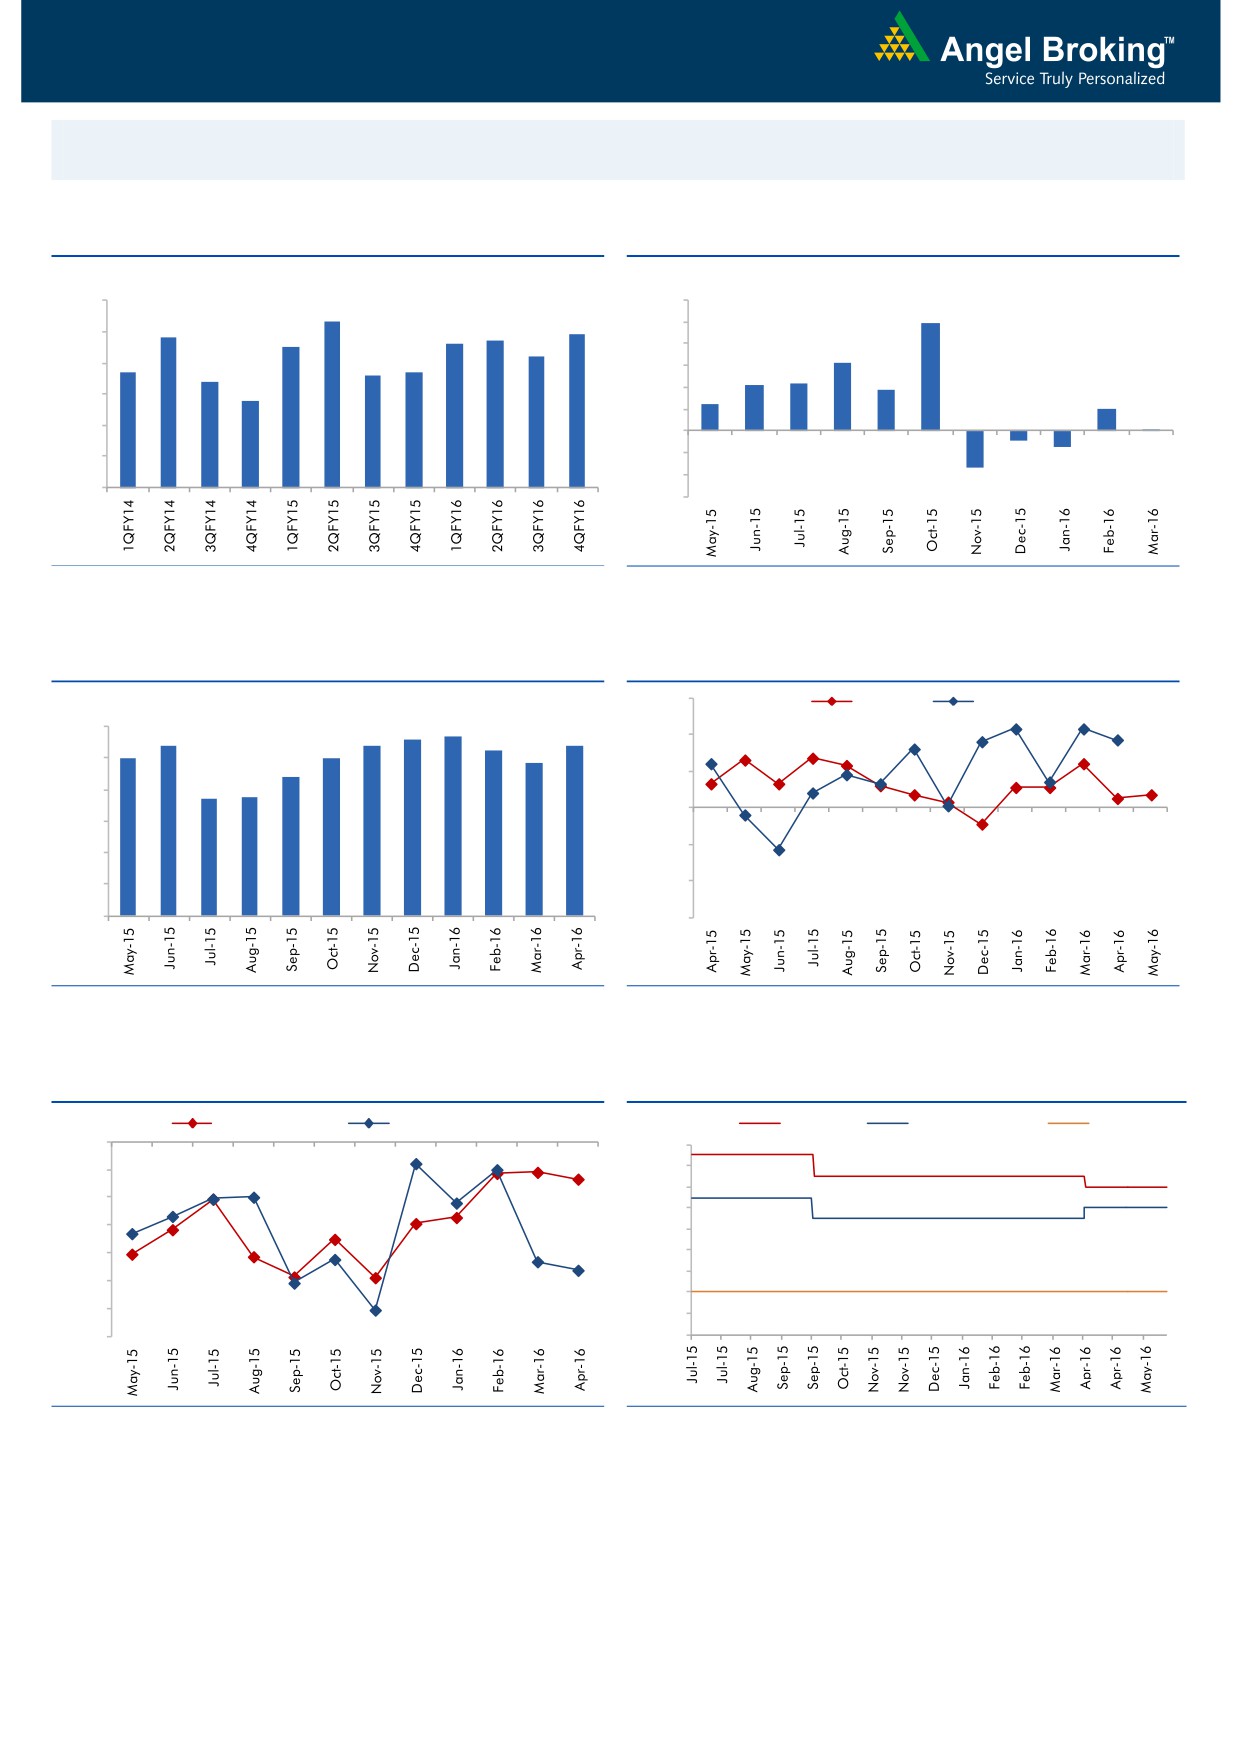
Macro watch
Exhibit 1: Quarterly GDP trends
Exhibit 2: IIP trends
(%)
(%)
9.0
8.3
12.0
9.9
7.8
7.7
7.9
10.0
8.0
7.5
7.6
7.2
8.0
6.3
6.7
6.6
6.7
7.0
6.4
6.0
4.2
4.3
3.7
5.8
4.0
2.5
6.0
2.0
2.0
0.1
5.0
-
4.0
(2.0)
(0.9)
(1.5)
(4.0)
3.0
(3.4)
(6.0)
Source: CSO, Angel Research
Source: MOSPI, Angel Research
Exhibit 3: Monthly CPI inflation trends
Exhibit 4: Manufacturing and services PMI
56.0
Mfg. PMI
Services PMI
(%)
5.6
5.7
6.0
5.4
5.4
5.4
5.3
54.0
5.0
5.0
4.8
5.0
4.4
52.0
3.7
3.7
4.0
50.0
3.0
48.0
2.0
1.0
46.0
-
44.0
Source: MOSPI, Angel Research
Source: Market, Angel Research; Note: Level above 50 indicates expansion
Exhibit 5: Exports and imports growth trends
Exhibit 6: Key policy rates
(%)
Exports yoy growth
Imports yoy growth
(%)
Repo rate
Reverse Repo rate
CRR
0.0
7.50
(5.0)
7.00
6.50
(10.0)
6.00
(15.0)
5.50
(20.0)
5.00
4.50
(25.0)
4.00
(30.0)
3.50
(35.0)
3.00
Source: Bloomberg, Angel Research
Source: RBI, Angel Research
Market Outlook
June 07, 2016
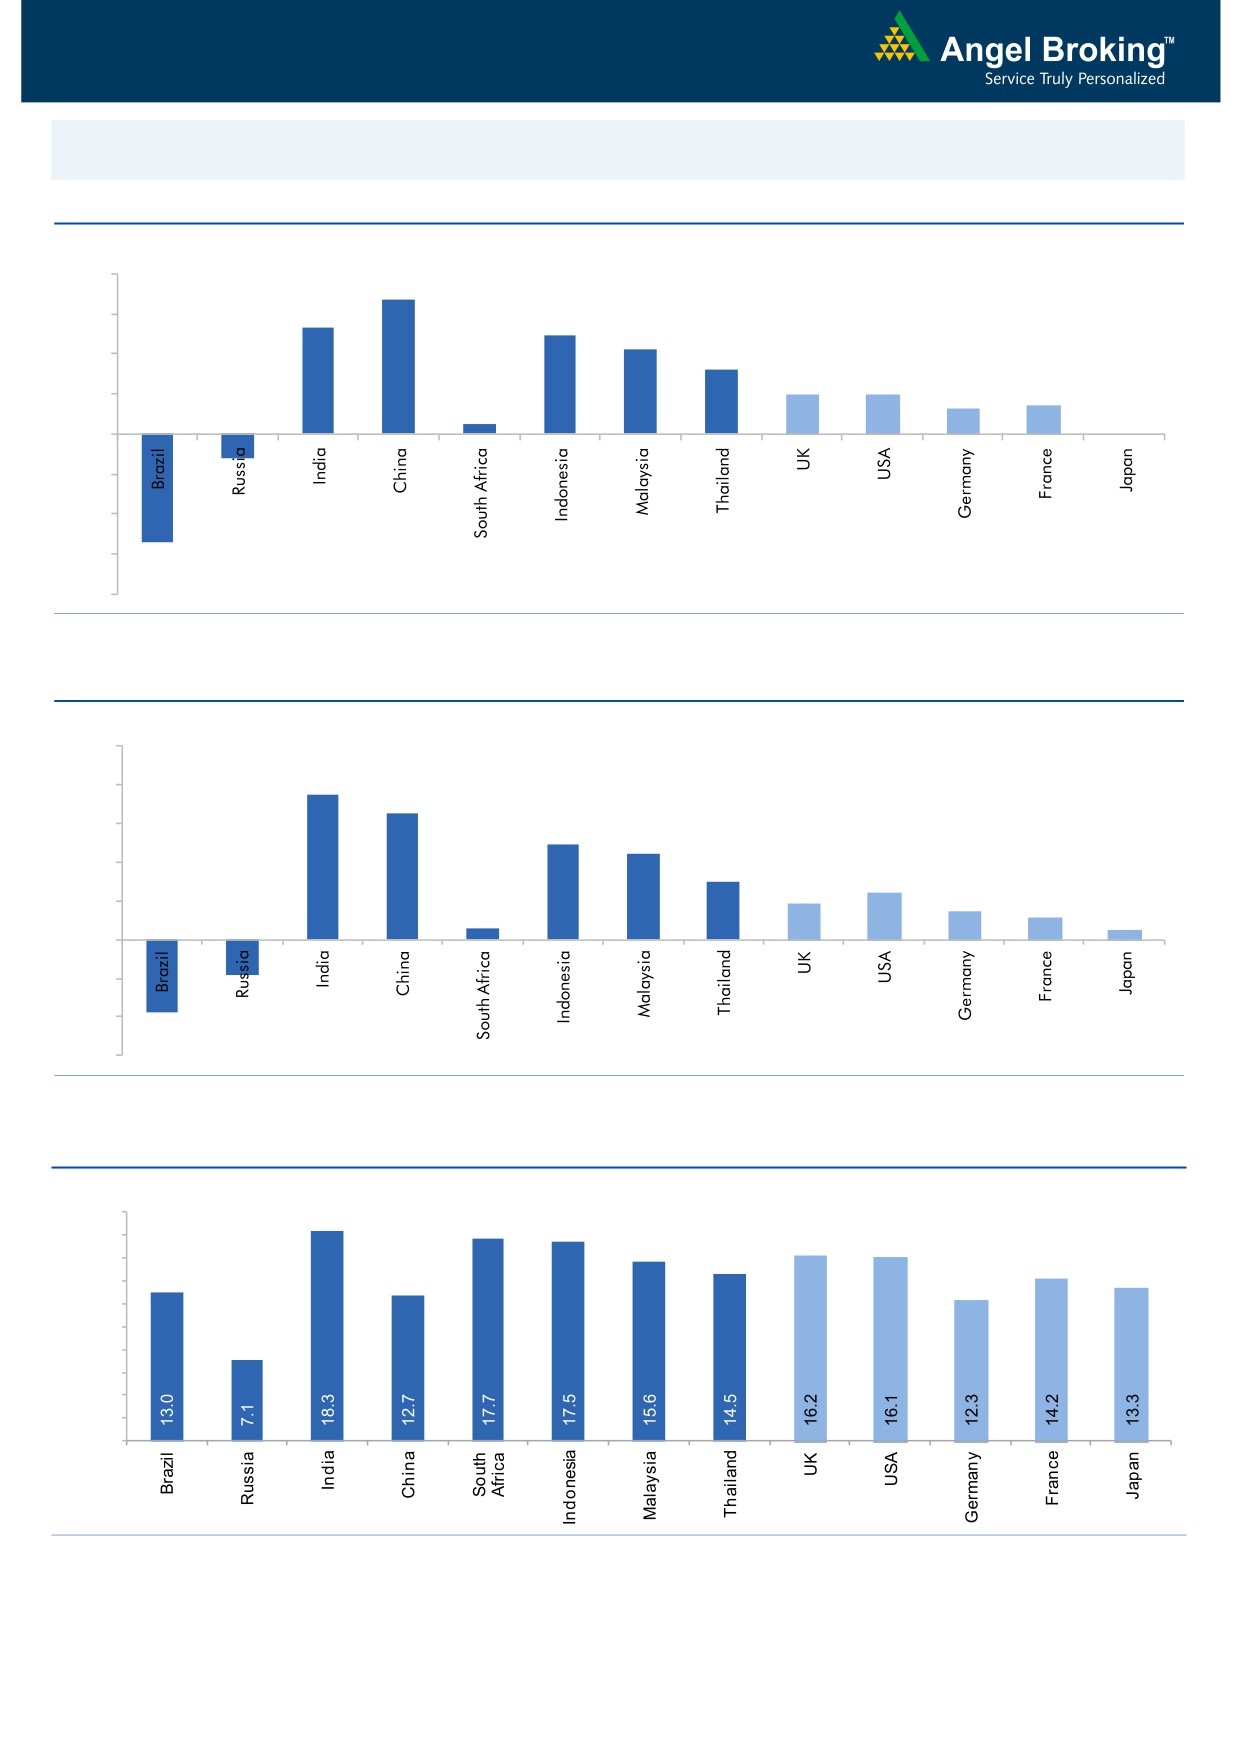
Global watch
Exhibit 1: Latest quarterly GDP Growth (%, yoy) across select developing and developed countries
(%)
8.0
6.7
6.0
5.3
4.9
4.2
4.0
3.2
2.0
2.0
1.3
1.4
2.0
0.5
-
-
(2.0)
(4.0)
(1.2)
(6.0)
(5.4)
(8.0)
Source: Bloomberg, Angel Research
Exhibit 2: 2016 GDP Growth projection by IMF (%, yoy) across select developing and developed countries
(%)
10.0
7.5
8.0
6.5
6.0
4.9
4.4
4.0
3.0
2.4
1.9
1.5
2.0
1.1
0.6
0.5
(3.8)
(1.8)
-
(2.0)
(4.0)
(6.0)
Source: IMF, Angel Research
Exhibit 3: One year forward P-E ratio across select developing and developed countries
(x)
20.0
18.0
16.0
14.0
12.0
10.0
8.0
6.0
4.0
2.0
-
Source: IMF, Angel Research
Market Outlook
June 08, 2016
Exhibit 4: Relative performance of indices across globe
Returns (%)
Country
Name of index
Closing price
1M
3M
1YR
Brazil
Bovespa
50,488
(4.0)
6.9
(6.6)
Russia
Micex
1,951
1.5
4.1
17.1
India
Nifty
8,266
6.9
14.5
0.4
China
Shanghai Composite
2,936
0.8
1.3
(36.3)
South Africa
Top 40
48,053
6.4
6.0
4.3
Mexico
Mexbol
46,125
1.6
2.5
2.9
Indonesia
LQ45
849
2.2
(0.1)
(7.0)
Malaysia
KLCI
1,661
0.7
(1.6)
(4.6)
Thailand
SET 50
921
3.9
7.2
(7.1)
USA
Dow Jones
17,938
1.5
5.4
0.9
UK
FTSE
6,285
2.7
2.5
(8.0)
Japan
Nikkei
16,675
3.5
(0.4)
(18.9)
Germany
DAX
10,288
4.5
4.8
(9.2)
France
CAC
4,476
4.1
0.8
(7.5)
Source: Bloomberg, Angel Research
Stock Watch
June 08, 2016
Company Name
Reco
CMP
Target
Mkt Cap
Sales ( Čcr )
OPM(%)
EPS (Č)
PER(x)
P/BV(x)
RoE(%)
EV/Sales(x)
(Č)
Price ( Č)
( Č cr )
FY16E FY17E
FY16E
FY17E
FY16E
FY17E
FY16E
FY17E
FY16E
FY17E
FY16E
FY17E
FY16E
FY17E
Agri / Agri Chemical
Rallis
Neutral
217
-
4,213
1,612
1,911
13.3
13.3
7.4
9.5
29.3
22.8
4.7
4.2
16.7
18.4
2.7
2.2
United Phosphorus
Accumulate
601
684
25,751
13,083
15,176
18.5
18.5
31.5
37.4
19.1
16.1
3.8
3.2
21.4
21.4
2.1
1.8
Auto & Auto Ancillary
Ashok Leyland
Neutral
106
-
30,166
17,995
21,544
11.4
11.6
3.4
4.7
31.2
22.6
5.5
5.0
17.7
22.2
1.6
1.3
Bajaj Auto
Neutral
2,642
-
76,458
22,709
25,860
20.9
20.1
129.0
143.6
20.5
18.4
6.3
5.4
30.7
29.4
2.9
2.5
Bharat Forge
Buy
749
875
17,430
7,351
8,318
19.9
19.7
31.2
36.5
24.0
20.5
4.3
3.6
19.3
19.2
2.5
2.2
Eicher Motors
Accumulate
18,828
20,044
51,139
15,556
16,747
15.5
17.3
464.8
597.5
40.5
31.5
14.8
10.9
36.2
34.3
3.2
2.9
Gabriel India
Accumulate
91
101
1,300
1,415
1,544
8.7
9.0
4.6
5.4
19.7
16.8
3.6
3.2
18.1
18.9
0.9
0.8
Hero Motocorp
Neutral
3,128
-
62,460
28,244
30,532
15.5
15.9
156.7
168.5
20.0
18.6
8.0
6.8
39.9
36.4
2.1
1.9
Jamna Auto Industries Neutral
165
-
1,314
1,281
1,473
11.2
11.5
7.6
9.2
21.6
17.9
5.5
4.5
25.4
25.2
1.1
0.9
L G Balakrishnan & Bros Neutral
460
-
723
1,254
1,394
11.6
11.8
35.9
41.7
12.8
11.1
1.7
1.5
13.5
13.8
0.7
0.6
Mahindra and Mahindra Neutral
1,378
-
85,577
38,416
42,904
13.7
13.9
54.8
63.4
25.1
21.7
3.9
3.4
15.4
15.8
1.9
1.6
Maruti
Neutral
4,143
-
125,158
57,865
68,104
16.4
16.7
176.3
225.5
23.5
18.4
4.6
3.9
19.4
21.2
1.9
1.6
Minda Industries
Neutral
1,165
-
1,848
2,523
2,890
8.7
9.0
55.0
65.4
21.2
17.8
4.1
3.3
19.3
18.7
0.8
0.7
Motherson Sumi
Accumulate
287
313
37,963
39,343
45,100
8.8
9.1
10.1
12.5
28.4
23.0
9.0
7.1
35.3
34.4
1.0
0.9
Rane Brake Lining
Buy
380
465
301
454
511
11.5
12.0
25.2
31.0
15.1
12.3
2.3
2.0
14.9
16.6
0.8
0.7
Setco Automotive
Neutral
40
-
534
594
741
12.7
13.7
1.7
3.2
23.5
12.5
2.5
2.1
10.4
16.9
1.3
1.1
Tata Motors
Neutral
463
-
133,692
259,686
273,957
13.0
13.4
25.9
29.5
17.9
15.7
2.3
2.0
8.0
9.0
0.7
0.7
TVS Motor
Accumulate
295
330
13,994
11,263
13,122
6.9
8.5
9.2
15.0
32.0
19.6
7.3
5.8
22.7
29.6
1.2
1.0
Amara Raja Batteries
Buy
835
1,076
14,261
4,690
5,429
17.5
17.5
28.5
35.3
29.4
23.6
6.8
5.6
23.1
25.9
3.0
2.6
Exide Industries
Neutral
162
-
13,740
6,950
7,784
14.4
14.8
6.6
7.3
24.5
22.1
3.1
2.8
12.6
12.8
1.7
1.5
Apollo Tyres
Buy
153
183
7,783
12,056
12,714
17.2
16.4
23.0
20.3
6.7
7.5
1.2
1.0
17.7
13.6
0.7
0.7
Ceat
Buy
904
1,119
3,655
6,041
6,597
14.1
13.7
99.5
111.9
9.1
8.1
1.8
1.5
19.6
18.5
0.8
0.6
JK Tyres
Neutral
87
-
1,981
7,446
7,669
15.2
14.0
19.6
18.4
4.5
4.8
1.1
0.9
25.2
19.5
0.7
0.6
Swaraj Engines
Neutral
1,105
-
1,372
552
630
14.2
14.7
44.6
54.1
24.8
20.4
5.8
5.2
23.2
25.6
2.3
2.0
Subros
Neutral
95
-
571
1,293
1,527
11.8
11.9
4.2
6.7
22.7
14.2
1.7
1.6
7.7
11.5
0.8
0.6
Indag Rubber
Neutral
186
-
487
283
329
17.0
17.2
13.0
15.4
14.3
12.0
3.1
2.6
21.8
21.6
1.4
1.2
Capital Goods
ACE
Neutral
40
-
396
660
839
4.7
8.2
1.0
3.9
40.1
10.3
1.3
1.1
3.2
11.3
0.8
0.6
BEML
Buy
837
1,157
3,486
3,277
4,006
6.0
8.9
36.2
64.3
23.1
13.0
1.6
1.5
5.7
11.7
1.2
0.9
Bharat Electronics
Buy
1,217
1,414
29,216
7,295
8,137
20.0
16.8
56.5
58.7
21.6
20.7
3.2
2.9
42.1
44.6
3.2
2.7
Stock Watch
June 08, 2016
Company Name
Reco
CMP
Target
Mkt Cap
Sales ( Čcr )
OPM(%)
EPS (Č)
PER(x)
P/BV(x)
RoE(%)
EV/Sales(x)
(Č)
Price ( Č)
( Č cr )
FY16E
FY17E
FY16E
FY17E
FY16E
FY17E
FY16E
FY17E
FY16E
FY17E
FY16E
FY17E
FY16E
FY17E
Capital Goods
Voltas
Buy
337
407
11,138
5,857
6,511
7.5
7.9
11.7
12.9
28.8
26.1
4.7
4.1
17.1
16.7
1.9
1.7
BGR Energy
Neutral
116
-
835
3,615
3,181
9.5
9.4
16.7
12.4
6.9
9.3
0.7
0.6
10.0
7.0
0.6
0.8
BHEL
Neutral
119
-
29,188
33,722
35,272
10.8
11.7
10.5
14.2
11.4
8.4
0.8
0.8
7.0
9.0
0.9
0.9
Blue Star
Accumulate
434
495
3,901
3,770
4,351
5.7
6.4
11.4
17.2
38.0
25.3
5.9
5.5
18.4
23.1
1.1
0.9
Crompton Greaves
Neutral
71
-
4,466
13,484
14,687
4.9
6.2
4.5
7.1
15.8
10.0
1.1
1.0
7.2
10.8
0.5
0.4
Greaves Cotton
Neutral
139
-
3,401
1,655
1,755
16.6
16.8
7.4
7.8
18.8
17.9
3.8
3.6
21.1
20.6
2.0
1.9
Inox Wind
Buy
229
286
5,076
4,406
5,605
15.5
15.7
20.4
24.8
11.2
9.2
2.6
1.9
27.9
25.9
1.4
1.0
KEC International
Neutral
137
-
3,511
8,791
9,716
6.1
6.8
5.4
8.2
25.3
16.7
2.5
2.3
10.0
14.0
0.6
0.6
Thermax
Neutral
802
-
9,562
6,413
7,525
7.4
8.5
30.5
39.3
26.3
20.4
4.1
3.5
15.0
17.0
1.5
1.2
VATech Wabag
Neutral
615
-
3,351
2,722
3,336
7.9
8.1
19.5
24.6
31.5
25.0
3.3
2.9
11.1
12.4
1.3
1.1
Cement
ACC
Neutral
1,541
-
28,931
13,151
14,757
16.4
18.3
63.9
83.4
24.1
18.5
3.1
2.9
13.3
16.1
2.0
1.7
Ambuja Cements
Neutral
234
-
36,369
11,564
12,556
19.4
20.7
8.9
10.1
26.3
23.2
3.3
3.1
12.8
13.8
2.8
2.5
HeidelbergCement
Neutral
111
-
2,522
1,772
1,926
13.3
15.4
1.0
3.0
111.3
37.1
2.8
2.6
2.6
7.9
2.0
1.7
India Cements
Neutral
97
-
2,972
4,216
4,840
18.0
19.5
4.0
9.9
24.2
9.8
1.0
0.9
4.0
9.5
1.0
0.8
JK Cement
Neutral
625
-
4,371
3,661
4,742
10.1
15.8
7.5
28.5
83.4
21.9
2.5
2.2
7.5
22.9
1.7
1.3
J K Lakshmi Cement
Neutral
345
-
4,054
2,947
3,616
16.7
19.9
11.5
27.2
30.0
12.7
2.8
2.5
9.8
20.8
1.8
1.4
Mangalam Cements
Neutral
275
-
733
1,053
1,347
10.5
13.3
8.4
26.0
32.7
10.6
1.4
1.3
4.3
12.5
1.1
0.8
Orient Cement
Neutral
164
-
3,352
1,854
2,524
21.2
22.2
7.7
11.1
21.3
14.7
3.1
2.6
13.3
15.7
2.5
1.8
Ramco Cements
Neutral
534
-
12,719
4,036
4,545
20.8
21.3
15.1
18.8
35.4
28.4
4.3
3.8
12.9
14.3
3.7
3.2
Shree Cement^
Neutral
13,935
-
48,545
7,150
8,742
26.7
28.6
228.0
345.5
61.1
40.3
9.0
7.5
15.7
20.3
6.5
5.3
UltraTech Cement
Neutral
3,332
-
91,436
24,669
29,265
18.2
20.6
82.0
120.0
40.6
27.8
4.4
3.8
11.3
14.7
3.8
3.2
Construction
ITNL
Buy
71
93
2,331
7,360
8,682
34.0
32.2
7.0
8.6
10.1
8.2
0.3
0.3
3.2
2.5
3.7
3.5
KNR Constructions
Accumulate
570
603
1,602
937
1,470
14.3
14.0
44.2
38.6
12.9
14.8
2.6
2.2
15.4
15.4
1.8
1.2
Larsen & Toubro
Accumulate
1,488
1,700
138,662
58,870
65,708
8.3
10.3
42.0
53.0
35.4
28.1
2.5
2.2
8.8
11.2
2.6
2.3
Gujarat Pipavav Port
Neutral
160
-
7,754
629
684
51.0
52.2
6.4
5.9
25.1
27.2
3.3
3.0
15.9
12.7
12.0
10.8
MBL Infrastructures
Buy
120
285
497
2,313
2,797
12.2
14.6
19.0
20.0
6.3
6.0
0.7
0.6
11.3
10.6
0.9
0.8
Nagarjuna Const.
Neutral
73
-
4,067
7,892
8,842
8.8
9.1
3.0
5.3
24.4
13.8
1.2
1.1
5.0
8.5
0.8
0.6
PNC Infratech
Neutral
569
-
2,919
1,873
2,288
13.2
13.5
24.0
32.0
23.7
17.8
2.3
2.1
12.1
12.3
1.7
1.4
Simplex Infra
Neutral
268
-
1,325
5,955
6,829
10.3
10.5
16.0
31.0
16.7
8.6
0.9
0.8
5.3
9.9
0.7
0.6
Stock Watch
June 08, 2016
Company Name
Reco
CMP
Target
Mkt Cap
Sales ( Čcr )
OPM(%)
EPS (Č)
PER(x)
P/BV(x)
RoE(%)
EV/Sales(x)
(Č)
Price ( Č)
( Č cr )
FY16E
FY17E
FY16E
FY17E
FY16E
FY17E
FY16E
FY17E
FY16E
FY17E
FY16E
FY17E
FY16E
FY17E
Construction
Power Mech Projects
Neutral
587
-
863
1,539
1,801
12.8
12.7
59.0
72.1
9.9
8.1
1.5
1.3
18.6
16.8
0.6
0.5
Sadbhav Engineering
Accumulate
283
298
4,854
3,186
3,598
10.2
10.3
8.0
9.0
35.4
31.4
3.3
2.9
9.4
9.9
1.8
1.6
NBCC
Accumulate
193
220
11,556
5,838
7,428
6.0
7.9
5.2
8.2
37.0
23.5
1.2
0.9
21.9
28.2
1.8
1.3
MEP Infra
Neutral
39
-
627
1,956
1,876
28.1
30.5
1.3
3.0
29.7
12.9
6.2
4.2
21.2
32.8
1.7
1.7
SIPL
Neutral
97
-
3,420
675
1,042
62.4
64.7
-
-
3.6
4.2
-
-
16.7
11.3
Engineers India
Neutral
193
-
6,511
1,667
1,725
13.5
16.0
9.7
11.4
19.9
17.0
2.3
2.3
11.7
13.4
2.7
2.7
Financials
Allahabad Bank
Neutral
52
-
3,778
8,569
9,392
2.8
2.9
16.3
27.5
3.2
1.9
0.3
0.2
7.6
11.9
-
-
Axis Bank
Neutral
534
-
127,440
26,204
29,738
3.6
3.5
34.5
35.4
15.5
15.1
2.4
2.2
16.8
14.9
-
-
Bank of Baroda
Neutral
145
-
33,468
18,802
21,088
2.0
2.2
(7.4)
13.0
11.2
1.2
0.9
(4.2)
7.3
-
-
Bank of India
Neutral
86
-
8,014
15,972
17,271
1.9
2.0
15.3
33.4
5.6
2.6
0.3
0.2
3.6
7.6
-
-
Canara Bank
Neutral
196
-
10,632
15,441
16,945
2.0
2.1
46.6
70.4
4.2
2.8
0.4
0.3
8.0
11.2
-
-
Dena Bank
Neutral
29
-
1,947
3,440
3,840
2.1
2.3
7.3
10.0
4.0
2.9
0.3
0.3
6.1
7.9
-
-
Dewan Housing Finance Buy
197
270
5,760
1,828
2,225
2.9
3.0
24.9
29.7
7.9
6.7
1.2
1.1
15.1
16.1
-
-
Equitas Holdings
Buy
176
235
5,894
679
1,076
12.4
11.7
6.2
6.7
28.4
26.2
3.5
2.6
13.3
12.5
-
-
Federal Bank
Neutral
57
-
9,733
3,279
3,787
2.8
2.9
3.9
5.5
14.4
10.2
1.2
1.1
8.4
10.8
-
-
HDFC
Neutral
1,250
-
197,551
10,358
11,852
3.3
3.3
41.1
47.0
30.5
26.6
5.8
5.3
24.7
24.9
-
-
HDFC Bank
Accumulate
1,174
1,262
296,983
38,606
47,696
4.4
4.5
48.8
61.4
24.1
19.1
4.1
3.6
18.7
20.0
-
-
ICICI Bank
Neutral
254
-
147,627
34,279
39,262
3.3
3.3
21.0
24.4
12.1
10.4
2.0
1.7
14.4
14.7
-
-
IDBI Bank
Neutral
66
-
13,547
9,625
10,455
1.8
1.8
8.5
14.2
7.7
4.6
0.5
0.4
5.9
9.3
-
-
Indian Bank
Neutral
97
-
4,649
6,160
6,858
2.5
2.5
24.5
29.8
4.0
3.2
0.3
0.3
7.7
8.6
-
-
LIC Housing Finance
Buy
475
592
23,949
3,179
3,758
2.6
2.6
32.9
40.6
14.4
11.7
2.7
2.3
19.6
20.7
-
-
Oriental Bank
Neutral
85
-
2,925
7,643
8,373
2.4
2.4
37.2
45.4
2.3
1.9
0.2
0.2
8.2
9.4
-
-
Punjab Natl.Bank
Neutral
78
-
15,257
23,122
26,022
2.8
2.8
7.0
21.6
11.1
3.6
0.6
0.5
3.4
10.0
-
-
South Ind.Bank
Neutral
20
-
2,701
1,965
2,185
2.5
2.5
2.5
3.3
8.0
6.1
0.8
0.7
9.5
11.7
-
-
St Bk of India
Neutral
210
-
162,863
79,958
86,061
2.6
2.6
13.4
20.7
15.7
10.2
1.3
1.2
11.5
12.8
-
-
Union Bank
Neutral
118
-
8,091
12,646
14,129
2.3
2.4
31.0
39.1
3.8
3.0
0.4
0.3
9.8
11.4
-
-
Vijaya Bank
Neutral
31
-
3,081
3,536
3,827
1.9
1.9
5.5
6.7
5.6
4.6
0.5
0.4
7.8
8.8
-
-
Yes Bank
Neutral
1,066
-
44,872
7,190
9,011
3.2
3.3
58.2
69.7
18.3
15.3
3.3
2.8
19.2
19.6
-
-
FMCG
Asian Paints
Neutral
1,032
-
98,984
15,534
17,445
17.7
16.8
18.4
19.6
56.2
52.6
19.9
18.7
34.6
35.6
6.2
5.6
Stock Watch
June 08, 2016
Company Name
Reco
CMP
Target
Mkt Cap
Sales ( Čcr )
OPM(%)
EPS (Č)
PER(x)
P/BV(x)
RoE(%)
EV/Sales(x)
(Č)
Price ( Č)
( Č cr )
FY16E FY17E
FY16E
FY17E
FY16E
FY17E
FY16E
FY17E
FY16E
FY17E
FY16E
FY17E
FY16E
FY17E
FMCG
Britannia
Neutral
2,794
-
33,517
8,481
9,795
14.0
14.1
65.5
78.3
42.7
35.7
20.2
16.6
38.3
41.2
3.9
3.3
Colgate
Neutral
855
-
23,253
4,136
4,632
22.5
23.3
22.2
25.3
38.5
33.8
23.4
20.9
68.6
67.5
5.5
4.9
Dabur India
Neutral
306
-
53,909
9,370
10,265
17.6
17.3
7.3
8.1
41.8
37.8
10.8
9.9
31.7
30.6
5.6
5.1
GlaxoSmith Con*
Accumulate
5,772
6,118
24,274
4,519
5,142
19.6
19.8
164.3
191.2
35.1
30.2
9.7
8.3
30.8
29.9
4.8
4.2
Godrej Consumer
Neutral
1,542
-
52,493
9,003
10,335
18.1
18.7
34.1
41.8
45.2
36.9
9.8
8.4
23.9
24.8
6.0
5.2
HUL
Neutral
897
-
194,094
33,299
35,497
17.1
17.1
18.9
20.0
47.5
44.8
41.6
36.2
87.6
80.8
5.6
5.3
ITC
Neutral
363
-
291,953
36,837
39,726
38.8
38.7
12.2
13.5
29.7
26.9
8.3
7.2
27.8
26.9
7.4
6.8
Marico
Neutral
256
-
33,009
6,151
6,966
17.2
17.3
5.4
6.4
47.4
40.0
14.9
11.7
33.2
32.4
5.3
4.6
Nestle*
Neutral
6,450
-
62,192
9,393
10,507
22.2
22.3
106.8
121.8
60.4
53.0
21.2
19.1
34.8
36.7
6.4
5.7
Tata Global
Accumulate
119
137
7,533
8,635
9,072
9.8
9.9
5.8
7.2
20.6
16.6
1.8
1.8
6.8
7.4
0.9
0.9
Procter & Gamble
Buy
6,175
7,369
20,045
2,588
2,939
23.3
23.2
130.2
146.2
47.4
42.3
94.6
90.7
27.6
25.3
7.3
6.4
Hygiene
IT
HCL Tech^
Buy
727
1,000
102,520
37,061
30,781
21.5
20.5
51.4
40.0
14.1
18.2
3.7
2.7
20.1
20.3
2.5
2.7
Infosys
Accumulate
1,257
1,374
288,772
62,441
70,558
27.5
27.5
59.0
65.3
21.3
19.3
4.3
3.9
22.2
22.4
4.1
3.5
TCS
Accumulate
2,631
3,004
518,508
108,646
122,770
28.3
28.3
123.7
141.0
21.3
18.7
7.0
6.5
33.1
34.6
4.3
3.7
Tech Mahindra
Buy
536
700
52,042
26,494
30,347
16.3
17.0
32.2
37.5
16.7
14.3
3.6
3.1
21.7
21.8
1.7
1.5
Wipro
Buy
540
680
133,332
50,808
56,189
23.7
23.8
37.3
40.7
14.5
13.3
2.8
2.5
19.2
17.7
2.1
1.7
Media
D B Corp
Neutral
374
-
6,870
2,025
2,187
27.4
27.4
17.4
18.9
21.5
19.8
4.8
4.4
22.9
23.7
3.4
3.1
HT Media
Neutral
80
-
1,856
2,495
2,673
12.9
13.2
6.8
7.2
11.7
11.1
0.9
0.9
7.5
7.8
0.3
0.3
Jagran Prakashan
Buy
172
205
5,613
2,107
2,355
33.5
28.0
10.1
10.8
17.1
15.9
4.0
3.5
23.3
21.7
2.7
2.4
Sun TV Network
Neutral
361
-
14,228
2,510
2,763
71.8
71.5
21.9
24.8
16.5
14.6
3.9
3.5
22.8
24.3
5.1
4.6
Hindustan Media
Neutral
274
-
2,011
914
1,016
21.7
21.5
21.9
23.3
12.5
11.8
2.3
1.9
18.0
16.2
1.6
1.4
Ventures
Metals & Mining
Coal India
Buy
308
380
194,291
76,167
84,130
19.9
22.3
22.4
25.8
13.7
11.9
5.0
4.8
35.5
41.0
1.9
1.7
Hind. Zinc
Neutral
171
-
72,337
14,641
14,026
50.4
50.4
17.7
16.0
9.7
10.7
1.5
1.4
16.2
13.2
2.6
2.4
Hindalco
Neutral
109
-
22,570
104,356
111,186
8.7
9.5
6.7
11.1
16.3
9.9
0.6
0.6
3.5
5.9
0.7
0.7
JSW Steel
Neutral
1,377
-
33,281
42,308
45,147
16.4
20.7
(10.3)
49.5
27.8
1.5
1.5
(1.0)
5.6
1.8
1.7
NMDC
Neutral
92
-
36,337
8,237
10,893
46.6
44.5
10.0
11.7
9.2
7.9
1.0
0.9
12.5
13.0
4.2
3.2
SAIL
Neutral
42
-
17,284
45,915
53,954
7.2
10.5
1.5
4.4
27.8
9.6
0.4
0.4
2.3
4.1
1.0
0.9
Vedanta
Neutral
110
-
32,626
71,445
81,910
26.2
26.3
12.9
19.2
8.5
5.7
0.6
0.5
7.2
8.9
0.9
0.7
Tata Steel
Neutral
343
-
33,298
126,760
137,307
8.9
11.3
6.4
23.1
53.9
14.9
1.1
1.0
2.0
7.1
0.8
0.8
Stock Watch
June 08, 2016
Company Name
Reco
CMP
Target
Mkt Cap
Sales ( Čcr )
OPM(%)
EPS (Č)
PER(x)
P/BV(x)
RoE(%)
EV/Sales(x)
(Č)
Price ( Č)
( Č cr )
FY16E FY17E
FY16E
FY17E
FY16E
FY17E
FY16E
FY17E
FY16E
FY17E
FY16E
FY17E
FY16E
FY17E
Oil & Gas
Cairn India
Neutral
142
-
26,567
11,323
12,490
49.4
51.0
20.7
20.7
6.8
6.9
0.4
0.4
6.4
6.1
1.4
0.8
GAIL
Neutral
374
-
47,498
64,856
70,933
9.1
9.6
24.0
28.9
15.6
13.0
1.3
1.3
8.8
9.6
0.9
0.8
ONGC
Neutral
213
-
182,232
154,564
145,998
36.8
37.4
20.8
22.6
10.3
9.4
1.0
0.9
10.1
9.7
1.4
1.5
Petronet LNG
Neutral
273
-
20,438
29,691
31,188
5.8
6.2
12.8
13.4
21.3
20.3
3.2
2.8
15.8
14.8
0.8
0.7
Indian Oil Corp
Accumulate
419
455
101,695
359,607
402,760
5.9
6.1
42.5
48.7
9.9
8.6
1.3
1.2
14.1
14.4
0.4
0.3
Reliance Industries
Buy
955
1,150
309,429
304,775
344,392
12.6
13.4
91.3
102.6
10.5
9.3
1.2
1.1
11.8
12.0
0.9
0.8
Pharmaceuticals
Alembic Pharma
Neutral
557
-
10,498
3,274
3,802
26.9
19.4
35.0
28.7
15.9
19.4
7.1
5.3
55.6
31.2
3.2
2.7
Aurobindo Pharma
Accumulate
773
856
45,228
14,923
17,162
22.0
23.0
35.7
42.8
21.7
18.1
6.4
4.8
34.0
30.2
3.4
2.9
Aventis*
Accumulate
4,300
4,738
9,903
2,049
2,375
15.4
17.3
115.4
153.5
37.3
28.0
6.1
4.8
19.3
25.8
4.6
3.9
Cadila Healthcare
Buy
320
400
32,709
9,469
11,246
21.2
22.0
14.9
17.1
21.4
18.7
6.1
4.8
28.8
26.6
3.4
2.8
Cipla
Buy
469
605
37,659
13,979
16,447
20.2
18.6
25.7
27.5
18.2
17.1
3.0
2.6
17.6
16.1
2.7
2.2
Dr Reddy's
Accumulate
3,158
3,476
53,852
15,471
17,479
24.6
24.6
138.2
152.4
22.9
20.7
4.2
3.6
19.7
18.7
3.4
3.0
Dishman Pharma
Neutral
152
-
2,455
1,733
1,906
21.5
21.5
10.1
10.0
15.1
15.2
1.8
1.6
10.5
11.2
1.9
1.7
GSK Pharma*
Neutral
3,515
-
29,777
2,870
3,158
20.0
22.1
59.5
68.3
59.1
51.5
17.4
17.9
28.5
34.3
9.9
9.0
Indoco Remedies
Neutral
282
-
2,597
1,033
1,199
15.9
18.2
9.4
13.6
30.0
20.7
4.5
3.8
15.7
19.7
2.6
2.3
Ipca labs
Buy
431
750
5,441
3,363
3,909
12.9
18.6
13.4
28.0
32.2
15.4
2.3
2.0
7.4
14.0
1.9
1.6
Lupin
Buy
1,435
1,809
64,677
13,702
15,912
23.7
26.4
50.5
58.1
28.4
24.7
5.9
4.8
22.9
21.4
5.2
4.1
Sun Pharma
Buy
739
950
177,807
28,163
32,610
25.8
30.7
17.4
26.9
42.5
27.5
4.0
3.5
13.0
16.6
5.8
4.8
Power
Tata Power
Neutral
74
-
19,879
35,923
37,402
22.6
22.8
4.1
5.2
18.1
14.3
1.4
1.3
7.5
9.3
1.5
1.4
NTPC
Neutral
148
-
122,074
87,271
99,297
23.5
23.5
11.8
13.3
12.6
11.1
1.4
1.3
11.5
12.2
2.4
2.2
Power Grid
Accumulate
150
170
78,448
20,702
23,361
86.7
86.4
12.1
13.2
12.4
11.4
1.8
1.6
15.6
15.1
8.7
8.1
Real Estate
MLIFE
Buy
445
554
1,824
826
1,011
20.1
21.9
22.7
30.7
19.6
14.5
1.2
1.1
6.0
7.4
4.1
3.1
Telecom
Bharti Airtel
Neutral
349
-
139,569
101,748
109,191
32.1
31.7
12.0
12.5
29.1
27.9
2.0
1.9
6.9
6.7
2.0
1.8
Idea Cellular
Neutral
105
-
37,931
34,282
36,941
32.0
31.5
5.9
6.2
17.9
17.0
1.6
1.5
9.9
9.3
1.7
1.6
zOthers
Abbott India
Neutral
4,504
-
9,570
2,715
3,153
14.5
14.1
134.3
152.2
33.5
29.6
8.4
6.9
27.4
25.6
3.2
2.7
Bajaj Electricals
Buy
219
268
2,206
4,612
5,351
5.6
5.7
23.4
18.0
9.3
12.2
2.9
2.5
12.5
14.4
0.5
0.4
Finolex Cables
Neutral
354
-
5,421
2,520
2,883
12.2
12.0
12.7
14.2
28.0
25.0
3.8
3.4
13.6
13.5
1.9
1.6
Goodyear India*
Accumulate
512
582
1,181
1,800
1,600
11.7
11.5
58.7
52.9
8.7
9.7
2.0
1.7
24.6
18.7
0.4
0.4
Hitachi
Neutral
1,222
-
3,322
1,779
2,081
7.8
8.8
21.8
33.4
56.0
36.5
9.1
7.3
17.4
22.1
1.9
1.6
Stock Watch
June 08, 2016
Company Name
Reco
CMP
Target
Mkt Cap
Sales ( Čcr )
OPM(%)
EPS (Č)
PER(x)
P/BV(x)
RoE(%)
EV/Sales(x)
(Č)
Price ( Č)
( Č cr )
FY16E
FY17E
FY16E
FY17E
FY16E
FY17E
FY16E
FY17E
FY16E
FY17E
FY16E
FY17E
FY16E
FY17E
zOthers
Jyothy Laboratories
Neutral
290
-
5,250
1,620
1,847
11.5
11.5
7.3
8.5
39.8
34.2
5.1
4.8
13.3
14.4
3.1
2.6
MRF
Buy
33,000
45,575
13,996
20,316
14,488
21.4
21.1
5,488.0
3,798.0
6.0
8.7
2.1
1.7
41.1
21.2
0.6
0.9
Page Industries
Neutral
13,970
-
15,582
1,929
2,450
19.8
20.1
229.9
299.0
60.8
46.7
26.8
18.6
52.1
47.1
8.1
6.4
Relaxo Footwears
Neutral
455
-
5,464
1,767
2,152
12.3
12.5
19.3
25.1
23.7
18.2
5.8
4.5
27.7
27.8
3.1
2.6
Siyaram Silk Mills
Buy
1,052
1,347
986
1,619
1,799
11.6
11.6
93.5
104.9
11.3
10.0
1.9
1.7
17.1
16.4
0.8
0.8
Styrolution ABS India* Neutral
592
-
1,040
1,271
1,440
8.6
9.2
32.0
41.1
18.5
14.4
1.9
1.7
10.7
12.4
0.8
0.7
TVS Srichakra
Buy
2,336
2,932
1,789
2,035
2,252
15.9
15.3
248.6
268.1
9.4
8.7
4.1
3.0
43.6
33.9
0.9
0.8
HSIL
Buy
267
310
1,934
2,123
2,384
16.1
16.5
15.0
18.9
17.8
14.2
1.4
1.3
8.0
9.4
1.3
1.1
Kirloskar Engines India
Neutral
250
-
3,620
2,403
2,554
8.6
9.9
9.2
10.5
27.3
23.9
2.6
2.5
9.7
10.7
1.2
1.1
Ltd
M M Forgings
Buy
430
546
519
511
615
21.7
21.6
43.1
55.8
10.0
7.7
1.8
1.5
19.9
21.2
1.2
0.9
Banco Products (India) Neutral
137
-
978
1,208
1,353
11.0
12.3
10.8
14.5
12.7
9.4
1.5
1.3
11.9
14.5
0.8
0.7
Competent Automobiles Neutral
137
-
84
1,040
1,137
3.2
3.1
25.7
28.0
5.3
4.9
0.8
0.7
15.0
14.3
0.1
0.1
Nilkamal
Neutral
1,203
-
1,795
1,871
2,031
10.7
10.5
63.2
69.8
19.0
17.2
3.1
2.7
17.6
16.6
1.0
0.9
Visaka Industries
Accumulate
141
162
224
1,020
1,120
8.7
9.1
13.9
20.1
10.1
7.0
0.7
0.6
6.4
8.7
0.5
0.4
Transport Corporation of
Neutral
297
-
2,256
2,830
3,350
8.8
9.0
14.4
18.3
20.6
16.2
3.2
2.8
15.4
17.1
0.9
0.8
India
Elecon Engineering
Neutral
58
-
631
1,359
1,482
10.3
13.7
0.8
3.9
72.2
14.9
1.2
1.1
1.6
7.8
0.8
0.7
Surya Roshni
Buy
157
201
688
2,992
3,223
8.1
8.4
14.7
18.3
10.7
8.6
1.0
0.9
9.7
11.0
0.5
0.5
MT Educare
Neutral
179
-
713
286
366
18.3
17.7
7.7
9.4
23.2
19.1
4.9
4.3
20.2
21.1
2.4
1.8
Radico Khaitan
Buy
93
125
1,239
1,543
1,659
12.6
13.0
5.8
6.3
16.1
14.7
1.4
1.3
8.5
8.6
1.3
1.2
Garware Wall Ropes
Buy
349
460
764
828
898
11.2
10.3
28.3
29.0
12.3
12.0
2.1
1.8
16.8
14.9
0.9
0.8
Wonderla Holidays
Neutral
395
-
2,232
206
308
44.0
43.6
9.0
12.9
43.9
30.6
6.0
5.4
13.7
17.8
10.7
7.1
Linc Pen & Plastics
Accumulate
212
235
314
344
382
9.1
9.1
12.4
13.1
17.1
16.2
3.1
2.7
18.0
16.7
1.0
0.9
The Byke Hospitality
Neutral
171
-
684
222
287
20.5
20.5
5.6
7.6
30.3
22.6
5.7
4.7
18.9
20.8
3.1
2.4
Interglobe Aviation
Neutral
1,007
-
36,290
17,022
21,122
20.7
14.5
63.9
53.7
15.8
18.8
23.6
19.4
149.9
103.2
2.2
1.7
Coffee Day Enterprises
Neutral
259
-
5,326
2,692
2,964
17.0
18.6
-
4.7
-
54.6
3.2
3.0
0.2
5.5
2.4
2.2
Ltd
Navneet Education
Neutral
86
-
2,049
998
1,062
24.1
24.0
5.8
6.1
15.0
14.1
3.3
2.9
22.0
20.6
2.1
2.0
Navkar Corporation
Buy
195
265
2,787
347
408
43.2
42.9
6.7
6.8
29.3
28.9
2.2
2.0
7.3
6.9
8.5
7.7
UFO Moviez
Neutral
535
-
1,477
558
619
32.0
33.2
22.5
30.0
23.8
17.9
2.9
2.5
12.0
13.8
2.5
2.1
VRL Logistics
Neutral
282
-
2,575
1,725
1,902
16.5
16.7
12.2
14.6
23.2
19.4
4.8
4.2
20.8
21.9
1.6
1.5
Stock Watch
June 08, 2016
Company Name
Reco
CMP
Target Mkt Cap
Sales ( Čcr )
OPM(%)
EPS (Č)
PER(x)
P/BV(x)
RoE(%)
EV/Sales(x)
(Č)
Price ( Č)
( Č cr )
FY16E FY17E FY16E FY17E FY16E FY17E FY16E FY17E FY16E FY17E FY16E FY17E FY16E FY17E
zOthers
Team Lease Serv.
Neutral
915
-
1,565
2,565
3,229
1.3
1.5
15.2
22.8
60.3
40.2
4.8
4.3
8.0
10.7
0.5
0.4
S H Kelkar & Co.
Neutral
214
-
3,099
928
1,036
15.3
15.1
4.9
6.1
43.4
35.1
4.1
3.8
9.4
10.7
3.2
2.9
Quick Heal
Neutral
242
-
1,694
339
408
27.8
27.3
7.1
7.7
34.2
31.3
2.9
2.9
8.5
9.3
3.9
3.3
Narayana Hrudaya
Neutral
310
-
6,339
1,603
1,873
10.9
11.5
1.0
2.6
325.6
117.3
7.8
7.2
2.4
6.1
4.1
3.5
Manpasand Bever.
Neutral
567
-
2,837
540
836
19.9
19.6
10.2
16.9
55.3
33.5
4.5
4.0
8.1
12.0
4.9
3.1
Source: Company, Angel Research; Note: *December year end; #September year end; &October year end; Price as on June 07, 2016
Market Outlook
June 08, 2016
Research Team Tel: 022 - 39357800
DISCLAIMER
Angel Broking Private Limited (hereinafter referred to as “Angel”) is a registered Member of National Stock Exchange of India Limited,
Bombay Stock Exchange Limited and Metropolitian Stock Exchange of India Limited. It is also registered as a Depository Participant with
CDSL and Portfolio Manager with SEBI. It also has registration with AMFI as a Mutual Fund Distributor. Angel Broking Private Limited is a
registered entity with SEBI for Research Analyst in terms of SEBI (Research Analyst) Regulations, 2014 vide registration number
INH000000164. Angel or its associates has not been debarred/ suspended by SEBI or any other regulatory authority for accessing
/dealing in securities Market. Angel or its associates including its relatives/analyst do not hold any financial interest/beneficial ownership
of more than 1% in the company covered by Analyst. Angel or its associates/analyst has not received any compensation / managed or co
-managed public offering of securities of the company covered by Analyst during the past twelve months. Angel/analyst has not served as
an officer, director or employee of company covered by Analyst and has not been engaged in market making activity of the company
covered by Analyst.
This document is solely for the personal information of the recipient, and must not be singularly used as the basis of any investment
decision. Nothing in this document should be construed as investment or financial advice. Each recipient of this document should make
such investigations as they deem necessary to arrive at an independent evaluation of an investment in the securities of the companies
referred to in this document (including the merits and risks involved), and should consult their own advisors to determine the merits and
risks of such an investment.
Reports based on technical and derivative analysis center on studying charts of a stock's price movement, outstanding positions and
trading volume, as opposed to focusing on a company's fundamentals and, as such, may not match with a report on a company's
fundamentals.
The information in this document has been printed on the basis of publicly available information, internal data and other reliable sources
believed to be true, but we do not represent that it is accurate or complete and it should not be relied on as such, as this document is for
general guidance only. Angel Broking Pvt. Limited or any of its affiliates/ group companies shall not be in any way responsible for any
loss or damage that may arise to any person from any inadvertent error in the information contained in this report. Angel Broking Pvt.
Limited has not independently verified all the information contained within this document. Accordingly, we cannot testify, nor make any
representation or warranty, express or implied, to the accuracy, contents or data contained within this document. While Angel Broking
Pvt. Limited endeavors to update on a reasonable basis the information discussed in this material, there may be regulatory, compliance,
or other reasons that prevent us from doing so.
This document is being supplied to you solely for your information, and its contents, information or data may not be reproduced,
redistributed or passed on, directly or indirectly.
Neither Angel Broking Pvt. Limited, nor its directors, employees or affiliates shall be liable for any loss or damage that may arise from or
in connection with the use of this information.
Note: Please refer to the important ‘Stock Holding Disclosure' report on the Angel website (Research Section). Also, please refer to the
latest update on respective stocks for the disclosure status in respect of those stocks. Angel Broking Pvt. Limited and its affiliates may have
investment positions in the stocks recommended in this report.