Market Outlook
April 8, 2016
Market Cues
Domestic Indices
Chg (%)
(Pts)
(Close)
Indian markets are expected to open weak tracking the SGX Nifty and negative
BSE Sensex
(0.9)
(215)
24,685
global cues.
Nifty
(0.9)
(68)
7,546
U.S. markets moved sharply lower over the course of the trading day on Thursday,
Mid Cap
(0.4)
(47)
10,527
more than offsetting the strength seen in the previous session. The sell-off on Wall
Small Cap
(0.4)
(44)
10,597
Street was mainly due to concerns the outlook for global economic growth, which
Bankex
(0.7)
(122)
17,658
came amid a jump in the value of the Japanese yen versus the U.S. dollar.
European stock markets slid in Thursday's trade, with initial optimism over rising oil
Global Indices
Chg (%)
(Pts)
(Close)
prices overshadowed by concerns about global growth.
Dow Jones
(1.0)
(174)
17,542
Indian markets fell sharply on Thursday, tracking mixed cues from Asia and Europe
Nasdaq
(1.5)
(72)
4,848
as oil surrendered initial gains.
FTSE
(0.4)
(25)
6,137
News & Result Analysis
Nikkei
0.2
34
15,750
AC maker Blue Star feels 30% sales to come from e-commerce
Hang Seng
0.3
59
20,266
Detailed analysis on Pg2
Shanghai Com
(1.4)
(42)
3,008
Investor’s Ready Reckoner
Advances / Declines
BSE
NSE
Key Domestic & Global Indicators
Advances
1,138
617
Stock Watch: Latest investment recommendations on 150+ stocks
Declines
1,443
922
Refer Pg5 onwards
Unchanged
120
75
Top Picks
CMP
Target
Upside
Company
Sector
Rating
Volumes (` Cr)
(`)
(`)
(%)
Amara Raja
Auto & Auto Ancillary
Buy
866
1,040
20.1
BSE
2,956
HCL Tech
IT
Buy
829
1,038
25.3
NSE
15,019
LIC Housing
Financials
Buy
464
592
27.4
Bharat Electronics
Capital Goods
Buy
1,152
1,414
22.7
Net Inflows (` Cr)
Net
Mtd
Ytd
Navkar Corporation Others
Buy
177
265
49.5
FII
(515)
(1,040)
(13,550)
More Top Picks on Pg3
MFs
(233)
(444)
64,251
Key Upcoming Events
Previous
Consensus
Date
Region
Event Description
Top Gainers
Price (`)
Chg (%)
Reading
Expectations
Apr 8 UK
Industrial Production (YoY)
0.20
-
Deltacorp
80
7.3
Apr 11 China
Consumer Price Index (YoY)
2.30
2.40
Bhel
119
4.7
Apr 12 UK
CPI (YoY)
0.30
-
M&Mfin
243
4.5
Apr 12 India
Industrial Production (YoY)
(1.50)
-
Crisil
1,907
4.1
6.(6.(
More Events on Pg4
Nestleind
5,916
3.6
Top Losers
Price (`)
Chg (%)
Balramchin
106
(4.9)
Tatapower
64
(3.8)
Rajeshexpo
602
(3.7)
Sadbhav
266
(3.7)
Aplltd
569
(3.5)
As on April 07, 2016
Market Outlook
April 8, 2016
AC maker Blue Star feels 30% sales to come from e-commerce
Air conditioning and commercial refrigeration major Blue Star feels more than
30% of all air conditioners in the country would be sold through the online channel
in the next three to four years.
According to management, currently 5% of all room air conditioners (ACs) are
sold on the e-commerce format. The companies share is slightly higher than the
industry average at 6%. But in the next three to four years, the share of the e-
commerce channel to total room AC sales can cross 30%.
Blue Star aims to expand its room AC sales by 25% in this fiscal and grab 12% of
the market share. Presently, the company owns 10.5% share in the room AC
market and trails leading brands like Voltas, LG, Samsung and Hitachi.
The company has lined up an investment of `30cr on new product development as
well as its research and design initiatives in this fiscal. Also, it will spend `40cr on
brand promotion through a series of television commercials, advertisements in
mainstream dailies and hoardings. Blue Star would enhance its digital presence on
the social media as well since most of its buyers are from the highest socio
economic category and actively surf the internet.
With commercial air-conditioning segment decelerating, Blue Star would focus on
the room AC segment and expand its capacity. In the commercial air conditioning
segment, Blue Star is still the market leader with 28% share. But this segment is
witnessing a terrible de-growth. Office space consumption is not growing and
malls across the country are not doing well. There is also lack of growth in metro
rail and airports. The only bright spots are educational and healthcare institutions.
Blue Star is setting up two new facilities at Jammu and Sri City (Andhra Pradesh) at
a cost of `215cr. The two new manufacturing units are expected to be ready in 18
months. In room ACs, Blue Star has a capacity of 0.4 million units. With the
commissioning of two new facilities, the capacity can go up to 1.1 million units per
year.
Economic and Political News
Govt expands CNG sales network to lure motorists, curb pollution
Jewellers strike against excise duty continues
Domestic air traffic grew 24.6%, says IATA
Corporate News
BHEL's FY16 provisional loss at `877cr
Bodal Chemicals receives environmental clearance for expansion of dyes
facility
Hindustan Unilever completes acquistion of Indulekha brand for `330cr
Market Outlook
April 8, 2016
Top Picks ★★★★★
Large Cap
Market Cap
CMP
Target
Upside
Company
Rationale
(` Cr)
(`)
(`)
(%)
To outpace battery industry growth due to better technological
Amara Raja Batteries
14,787
866
1,040
20.1
products leading to market share gains in both the automotive
OEM and replacement segments.
Uptick in defense capex by government when coupled with
Bharat Electronics
27,656
1,152
1,414
22.7
BELs strong market positioning, indicate that good times are
ahead for BEL.
The stock is trading at attractive valuations and is factoring all
HCL Tech
1,16,871
829
1,038
25.3
the bad news.
Strong visibility for a robust 20% earnings trajectory, coupled
HDFC Bank
2,66,888
1,056
1,262
19.6
with high quality of earnings on account of high quality retail
business and strategic focus on highly rated corporates.
Back on the growth trend, expect a long term growth of 14%
Infosys
2,72,305
1,182
1,347
14.0
to be a US$20bn in FY2020.
LICHF continues to grow its retail loan book at a healthy pace
with improvement in asset quality. We expect the company to
LIC Housing Finance
23,432
464
592
27.4
post a healthy loan book which is likely to reflect in a strong
earnings growth.
Huge bid pipeline of re-development works at Delhi and other
NBCC
11,309
942
1,089
15.5
State Governments and opportunity from Smart City, positions
NBCC to report strong growth, going forward.
Source: Company, Angel Research
Mid Cap
Market Cap
CMP
Target
Upside
Company
Rationale
(` Cr)
(`)
(`)
(%)
Favorable outlook for the AC industry to augur well for
Cooling products business which is out pacing the market
Blue Star
3,535
393
458
16.6
growth. EMPPAC division's profitability to improve once
operating environment turns around.
With a focus on the low and medium income (LMI) consumer
Dewan Housing
5,470
187
270
44.0
segment, the company has increased its presence in tier-II &
III cities where the growth opportunity is immense.
Commencement of new projects, downtrend in the interest
IL&FS Transport
2,540
77
93
20.5
rate cycle, to lead to stock re-rating
Economic recovery to have favourable impact on advertising
& circulation revenue growth. Further, the acquisition of a
Jagran Prakashan
5,119
157
189
20.7
radio business (Radio City) would also boost the company's
revenue growth.
Speedier execution and speedier sales, strong revenue visibilty
Mahindra Lifespace
1,821
444
554
24.8
in short-to-long run, attractive valuations
Massive capacity expansion along with rail advantage at ICD
Navkar Corporation
2,528
177
265
49.5
as well CFS augurs well for the company
Earnings boost on back of stable material prices and
Radico Khaitan
1,256
94
156
65.3
favourable pricing environment. Valuation discount to peers
provides additional comfort
Strong brands and distribution network would boost growth
Siyaram Silk Mills
932
994
1,354
36.2
going ahead. Stock currently trades at an inexpensive
valuation.
Source: Company, Angel Research
Market Outlook
April 8, 2016
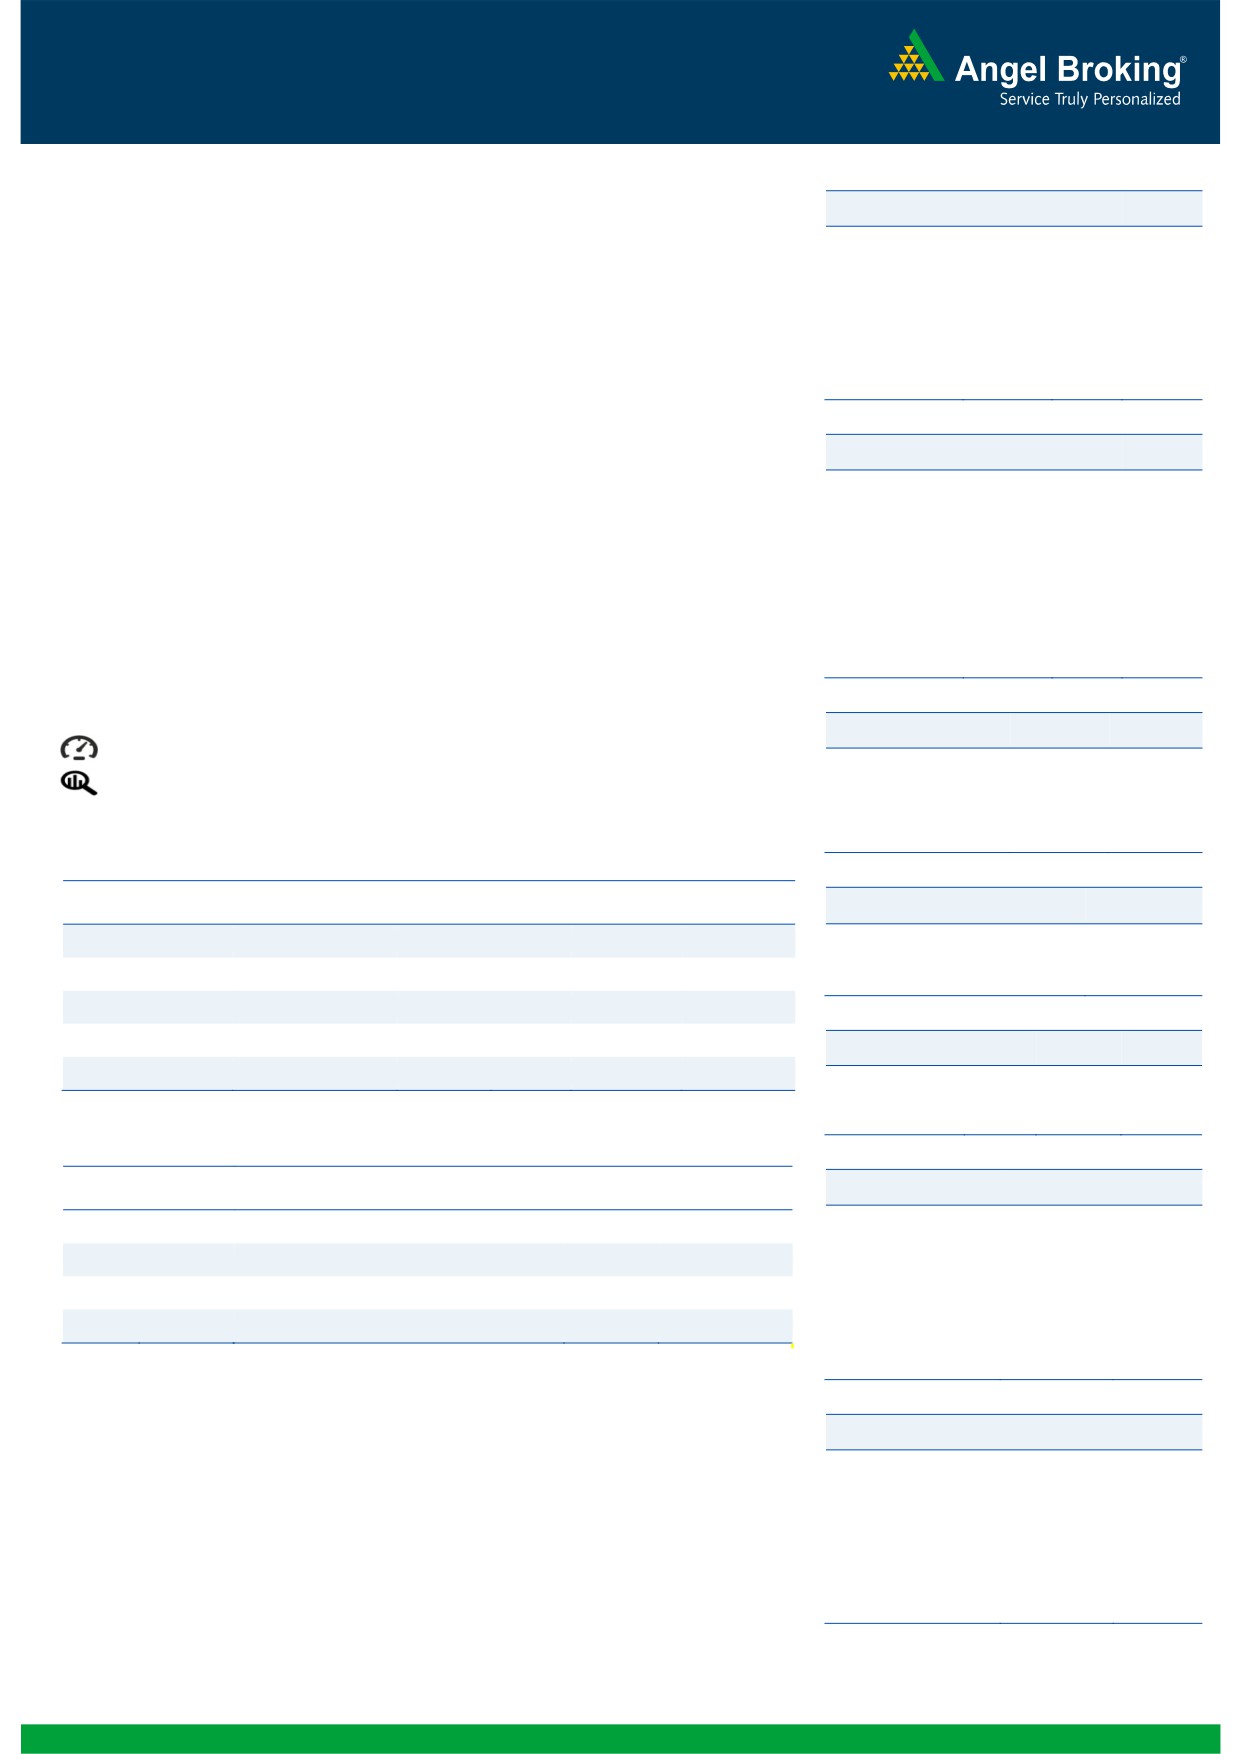
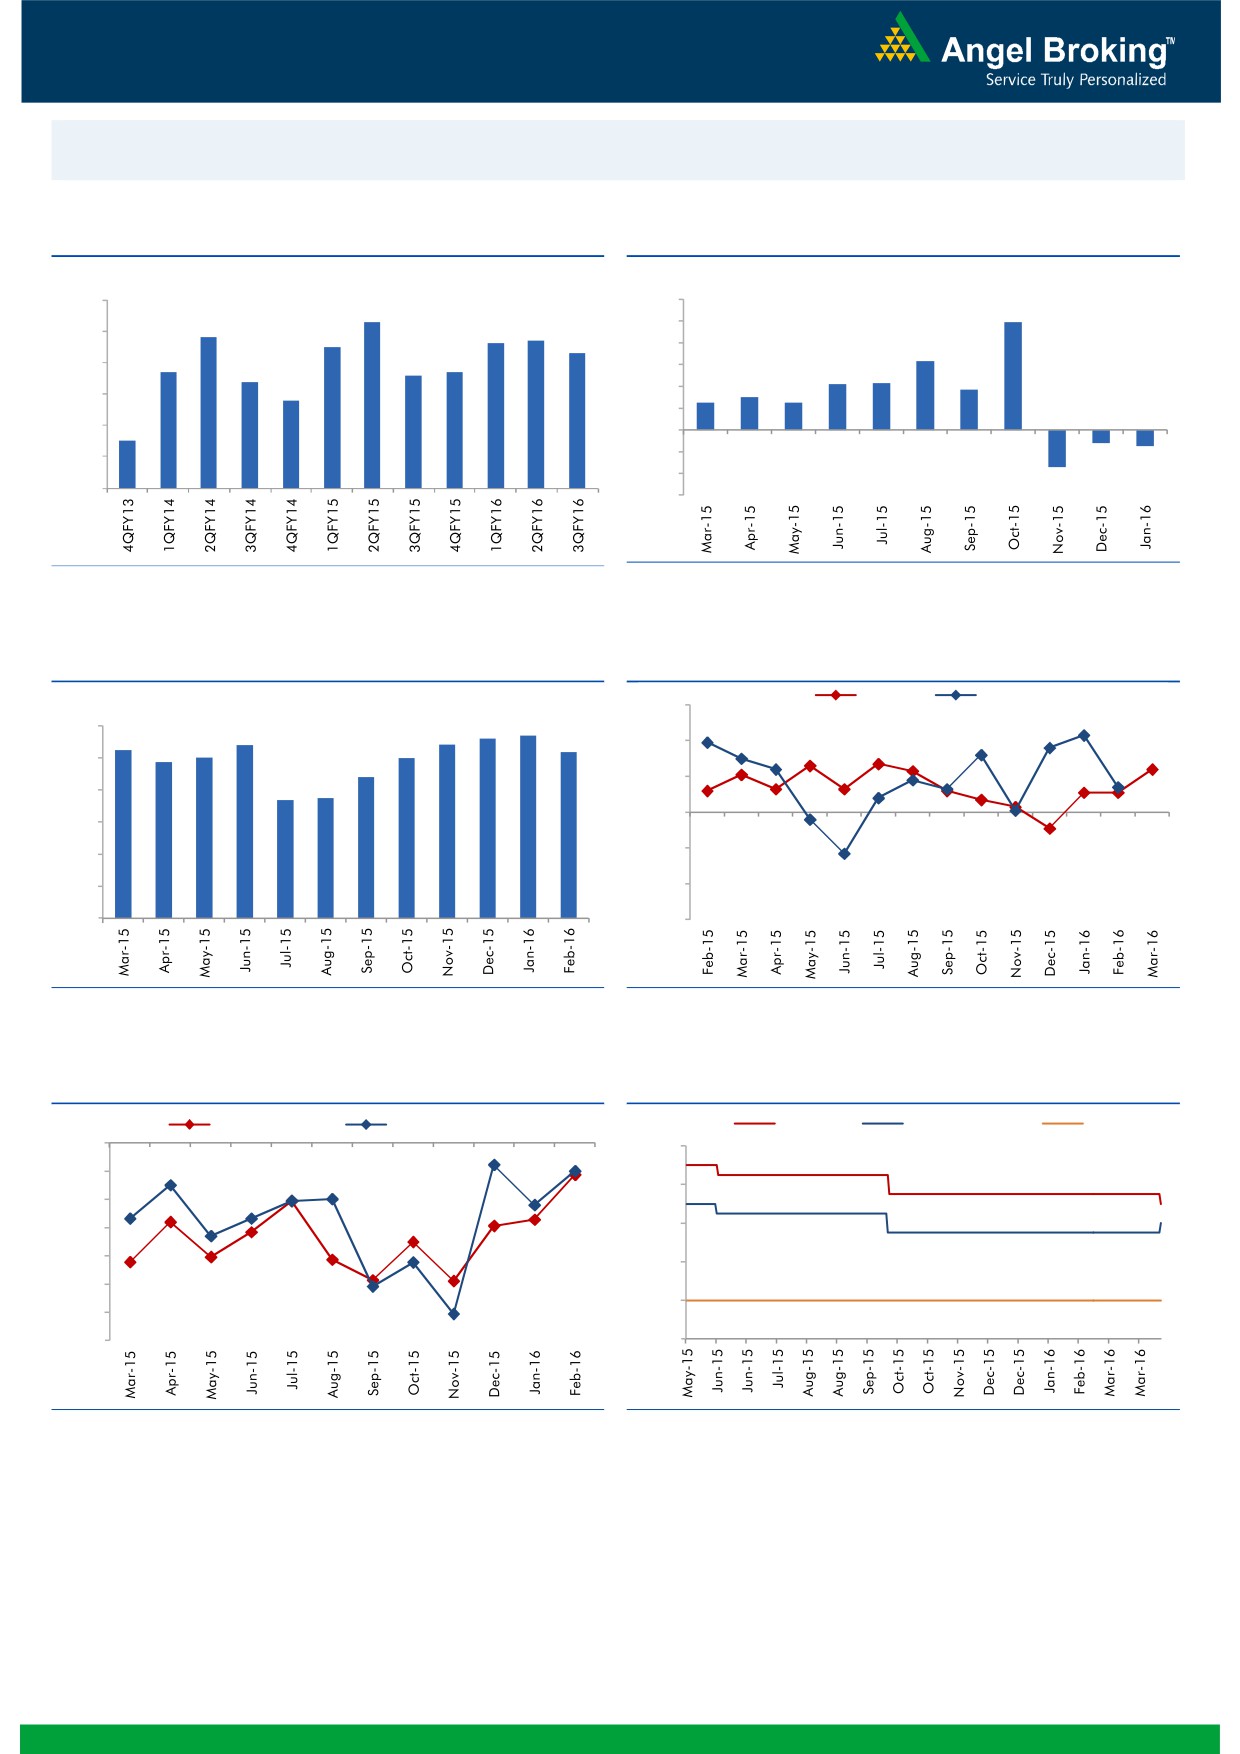
Macro watch
Exhibit 1: Quarterly GDP trends
Exhibit 2: IIP trends
(%)
(%)
9.0
8.3
12.0
9.9
7.8
7.7
10.0
8.0
7.5
7.6
7.3
8.0
6.3
6.7
6.6
6.7
7.0
6.4
6.0
4.2
4.3
3.7
5.8
4.0
2.5
3.0
2.5
6.0
2.0
5.0
4.5
-
4.0
(2.0)
(1.2)
(1.5)
(4.0)
3.0
(3.4)
(6.0)
Source: CSO, Angel Research
Source: MOSPI, Angel Research
Exhibit 3: Monthly CPI inflation trends
Exhibit 4: Manufacturing and services PMI
Mfg. PMI
Services PMI
(%)
56.0
5.6
5.7
6.0
5.4
5.4
5.3
5.2
4.9
5.0
5.0
54.0
5.0
4.4
52.0
3.7
3.7
4.0
50.0
3.0
48.0
2.0
1.0
46.0
-
44.0
Source: MOSPI, Angel Research
Source: Market, Angel Research; Note: Level above 50 indicates expansion
Exhibit 5: Exports and imports growth trends
Exhibit 6: Key policy rates
(%)
Exports yoy growth
Imports yoy growth
(%)
Repo rate
Reverse Repo rate
CRR
0.0
8.00
(5.0)
7.00
(10.0)
(15.0)
6.00
(20.0)
5.00
(25.0)
4.00
(30.0)
(35.0)
3.00
Source: Bloomberg, Angel Research
Source: RBI, Angel Research
Market Outlook
April 8, 2016
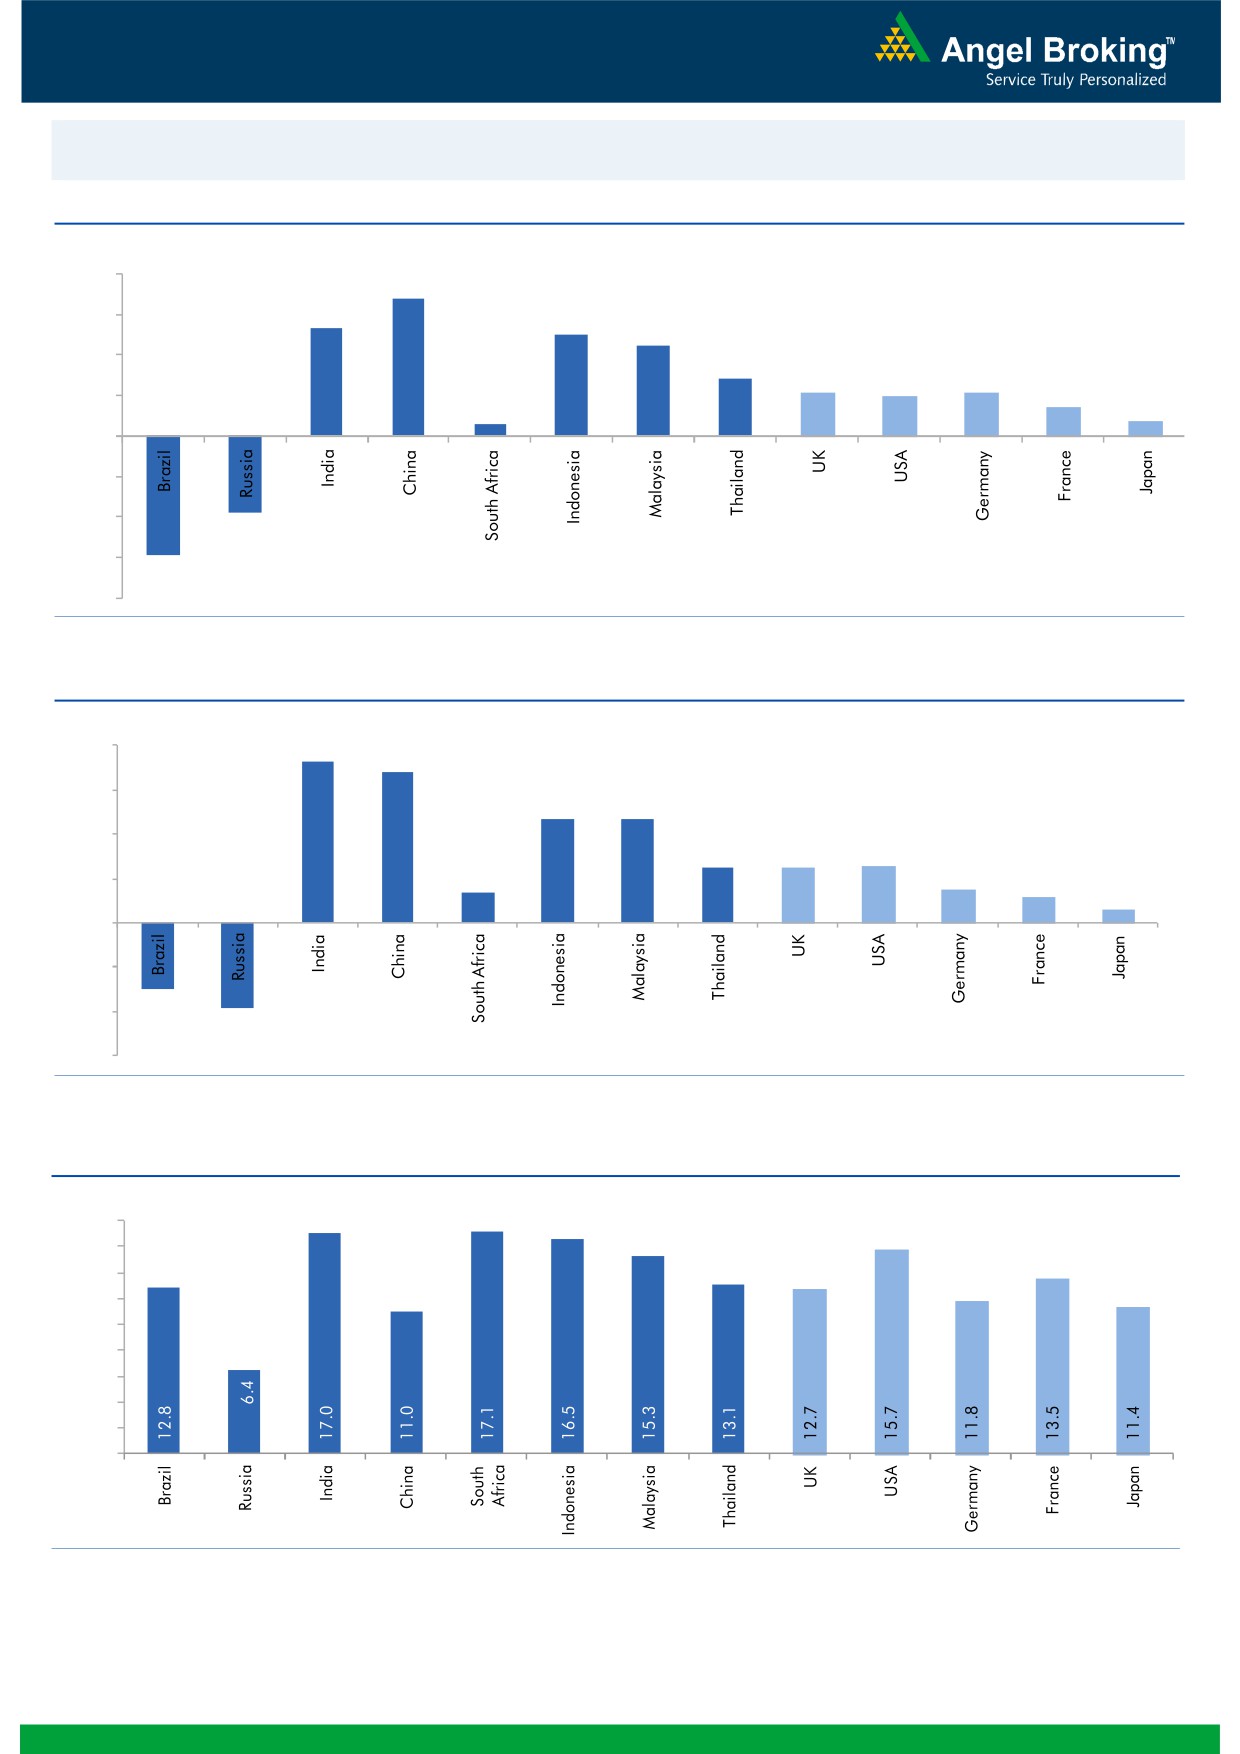
Global watch
Exhibit 1: Latest quarterly GDP Growth (%, yoy) across select developing and developed countries
(%)
8.0
6.8
6.0
5.3
5.0
4.5
4.0
2.8
2.1
2.0
2.1
1.4
2.0
0.6
0.7
-
(2.0)
(4.0)
(3.8)
(6.0)
(5.9)
(8.0)
Source: Bloomberg, Angel Research
Exhibit 2: 2015 GDP Growth projection by IMF (%, yoy) across select developing and developed countries
(%)
8.0
7.3
6.8
6.0
4.7
4.7
4.0
2.5
2.5
2.6
1.4
1.5
2.0
1.2
0.6
-
(2.0)
(3.0)
(4.0)
(3.8)
(6.0)
Source: IMF, Angel Research
Exhibit 3: One year forward P-E ratio across select developing and developed countries
(x)
18.0
16.0
14.0
12.0
10.0
8.0
6.0
4.0
2.0
-
Source: IMF, Angel Research
Market Outlook
April 8, 2016
Exhibit 4: Relative performance of indices across globe
Returns (%)
Country
Name of index
Closing price
1M
3M
1YR
Brazil
Bovespa
48,513
(1.5)
15.1
(5.3)
Russia
Micex
1,859
(2.7)
7.2
9.6
India
Nifty
7,546
0.9
(3.1)
(12.1)
China
Shanghai Composite
3,008
3.0
(15.5)
(20.2)
South Africa
Top 40
45,024
(2.0)
0.8
(3.0)
Mexico
Mexbol
45,052
0.7
7.0
0.2
Indonesia
LQ45
846
(0.4)
7.1
(9.3)
Malaysia
KLCI
1,724
2.2
4.3
(5.6)
Thailand
SET 50
860
(5.0)
8.9
(13.4)
USA
Dow Jones
17,542
2.7
2.2
(2.3)
UK
FTSE
6,137
(1.0)
1.0
(13.4)
Japan
Nikkei
15,750
(6.9)
(14.3)
(18.9)
Germany
DAX
9,531
(3.0)
(6.7)
(23.0)
France
CAC
4,246
(4.7)
(5.2)
(19.2)
Source: Bloomberg, Angel Research
Stock Watch
April 08, 2016
Company Name
Reco
CMP
Target
Mkt Cap
Sales ( Čcr )
OPM(%)
EPS (Č)
PER(x)
P/BV(x)
RoE(%)
EV/Sales(x)
(Č)
Price ( Č)
( Č cr )
FY16E FY17E
FY16E
FY17E
FY16E
FY17E
FY16E
FY17E
FY16E
FY17E
FY16E
FY17E
FY16E
FY17E
Agri / Agri Chemical
Rallis
Neutral
170
-
3,304
2,097
2,415
14.4
14.4
9.5
11.0
17.9
15.5
3.6
3.1
21.1
21.3
1.6
1.4
United Phosphorus
Neutral
463
-
19,842
12,500
14,375
18.3
18.3
29.8
35.9
15.5
12.9
2.9
2.4
20.0
20.3
1.7
1.4
Auto & Auto Ancillary
Ashok Leyland
Neutral
107
-
30,451
17,995
21,544
11.4
11.6
3.4
4.7
31.5
22.8
5.5
5.1
17.7
22.2
1.7
1.4
Bajaj Auto
Accumulate
2,375
2,585
68,719
22,709
25,860
20.9
20.1
129.0
143.6
18.4
16.5
5.6
4.9
30.7
29.4
2.6
2.2
Bharat Forge
Accumulate
778
875
18,107
7,351
8,318
19.9
19.7
31.2
36.5
24.9
21.3
4.5
3.8
19.3
19.2
2.6
2.3
Eicher Motors
Neutral
18,884
-
51,291
15,556
16,747
15.5
17.3
464.8
597.5
40.6
31.6
14.8
10.9
36.2
34.3
3.3
3.0
Gabriel India
Accumulate
90
101
1,299
1,415
1,544
8.7
9.0
4.6
5.4
19.7
16.8
3.6
3.2
18.1
18.9
0.9
0.8
Hero Motocorp
Neutral
2,968
-
59,273
28,244
30,532
15.5
15.9
156.7
168.5
18.9
17.6
7.6
6.4
39.9
36.4
1.9
1.8
Jamna Auto Industries Accumulate
144
160
1,153
1,281
1,473
11.2
11.5
7.6
9.2
19.0
15.7
4.8
3.9
25.4
25.2
1.0
0.8
L G Balakrishnan & Bros Neutral
460
-
722
1,254
1,394
11.6
11.8
35.9
41.7
12.8
11.0
1.7
1.5
13.5
13.8
0.7
0.6
Mahindra and Mahindra Accumulate
1,213
1,364
75,311
38,416
42,904
13.7
13.9
54.8
63.4
22.1
19.1
3.4
3.0
15.4
15.8
1.6
1.4
Maruti
Neutral
3,471
-
104,863
57,865
68,104
16.4
16.7
176.3
225.5
19.7
15.4
3.8
3.3
19.4
21.2
1.6
1.3
Minda Industries
Neutral
1,004
-
1,593
2,523
2,890
8.7
9.0
55.0
65.4
18.3
15.4
3.5
2.9
19.3
18.7
0.7
0.6
Motherson Sumi
Buy
244
313
32,288
39,343
45,100
8.8
9.1
10.1
12.5
24.2
19.5
7.7
6.0
35.3
34.4
0.9
0.8
Rane Brake Lining
Buy
377
465
298
454
511
11.5
12.0
25.2
31.0
15.0
12.2
2.2
2.0
14.9
16.6
0.8
0.7
Setco Automotive
Neutral
32
-
422
594
741
12.7
13.7
1.7
3.2
18.6
9.9
2.0
1.7
10.4
16.9
1.1
0.9
Tata Motors
Neutral
375
-
108,299
259,686
273,957
13.0
13.4
25.9
29.5
14.5
12.7
1.9
1.7
8.0
9.0
0.6
0.6
TVS Motor
Neutral
314
-
14,937
11,263
13,122
6.9
8.5
9.2
15.0
34.2
21.0
7.8
6.2
22.7
29.6
1.3
1.1
Amara Raja Batteries
Buy
866
1,040
14,787
4,892
5,871
17.4
17.6
28.8
37.1
30.1
23.3
7.0
5.6
23.4
24.1
3.0
2.5
Exide Industries
Buy
134
162
11,403
6,950
7,784
14.4
14.8
6.6
7.3
20.3
18.4
2.6
2.3
12.6
12.8
1.4
1.2
Apollo Tyres
Accumulate
169
183
8,595
12,056
12,714
17.2
16.4
23.0
20.3
7.3
8.3
1.3
1.1
17.7
13.6
0.8
0.8
Ceat
Neutral
1,086
-
4,393
6,041
6,597
14.1
13.7
99.5
111.9
10.9
9.7
2.1
1.8
19.6
18.5
0.9
0.7
JK Tyres
Neutral
83
-
1,887
7,446
7,669
15.2
14.0
19.6
18.4
4.2
4.5
1.1
0.9
25.2
19.5
0.7
0.6
Swaraj Engines
Neutral
892
-
1,108
552
630
14.2
14.7
44.6
54.1
20.0
16.5
4.7
4.2
23.2
25.6
1.9
1.6
Subros
Neutral
86
-
516
1,293
1,527
11.8
11.9
4.2
6.7
20.5
12.8
1.5
1.4
7.7
11.5
0.7
0.6
Indag Rubber
Neutral
171
-
449
283
329
17.0
17.2
13.0
15.4
13.2
11.1
2.9
2.4
21.8
21.6
1.3
1.1
Capital Goods
ACE
Neutral
38
-
373
660
839
4.7
8.2
1.0
3.9
37.7
9.7
1.2
1.1
3.2
11.3
0.7
0.6
BEML
Buy
918
1,157
3,821
3,277
4,006
6.0
8.9
36.2
64.3
25.4
14.3
1.8
1.6
5.7
11.7
1.3
1.0
Bharat Electronics
Buy
1,152
1,414
27,656
7,737
8,634
16.8
17.2
54.0
61.5
21.3
18.7
3.0
2.7
39.3
45.6
2.7
2.3
Stock Watch
April 08, 2016
Company Name
Reco
CMP
Target
Mkt Cap
Sales ( Čcr )
OPM(%)
EPS (Č)
PER(x)
P/BV(x)
RoE(%)
EV/Sales(x)
(Č)
Price ( Č)
( Č cr )
FY16E
FY17E
FY16E
FY17E
FY16E
FY17E
FY16E
FY17E
FY16E
FY17E
FY16E
FY17E
FY16E
FY17E
Capital Goods
Voltas
Buy
271
353
8,969
5,363
5,963
8.0
9.1
11.0
13.8
24.6
19.6
3.8
3.3
16.2
17.9
1.7
1.5
BGR Energy
Neutral
105
-
756
3,615
3,181
9.5
9.4
16.7
12.4
6.3
8.5
0.6
0.6
10.0
7.0
0.6
0.8
BHEL
Neutral
119
-
29,200
33,722
35,272
10.8
11.7
10.5
14.2
11.4
8.4
0.8
0.8
7.0
9.0
0.9
0.9
Blue Star
Buy
393
458
3,535
3,548
3,977
6.3
6.9
13.7
17.2
28.7
22.9
7.2
4.7
26.1
25.4
1.1
0.9
Crompton Greaves
Neutral
51
-
3,203
13,484
14,687
4.9
6.2
4.5
7.1
11.4
7.2
0.8
0.8
7.2
10.8
0.4
0.3
Greaves Cotton
Neutral
128
-
3,115
1,655
1,755
16.6
16.8
7.4
7.8
17.2
16.4
3.5
3.3
21.1
20.6
1.9
1.8
Inox Wind
Buy
248
458
5,498
4,980
5,943
17.0
17.5
26.6
31.6
9.3
7.8
2.8
2.1
35.0
30.0
1.3
1.0
KEC International
Neutral
125
-
3,217
8,791
9,716
6.1
6.8
5.4
8.2
23.2
15.3
2.3
2.1
10.0
14.0
0.6
0.5
Thermax
Neutral
758
-
9,027
6,413
7,525
7.4
8.5
30.5
39.3
24.8
19.3
3.8
3.3
15.0
17.0
1.4
1.1
VATech Wabag
Neutral
535
-
2,914
2,722
3,336
7.9
8.1
19.5
24.6
27.4
21.7
2.9
2.6
11.1
12.4
1.1
0.9
Cement
ACC
Neutral
1,417
-
26,605
13,151
14,757
16.4
18.3
63.9
83.4
22.2
17.0
2.9
2.6
13.3
16.1
1.9
1.6
Ambuja Cements
Neutral
226
-
35,096
11,564
12,556
19.4
20.7
8.9
10.1
25.4
22.4
3.2
3.0
12.8
13.8
2.7
2.5
HeidelbergCement
Neutral
93
-
2,097
1,772
1,926
13.3
15.4
1.0
3.0
92.6
30.9
2.3
2.2
2.6
7.9
1.8
1.5
India Cements
Neutral
87
-
2,660
4,216
4,840
18.0
19.5
4.0
9.9
21.7
8.8
0.9
0.8
4.0
9.5
1.0
0.8
JK Cement
Neutral
665
-
4,651
3,661
4,742
10.1
15.8
7.5
28.5
88.7
23.3
2.7
2.4
7.5
22.9
1.8
1.3
J K Lakshmi Cement
Neutral
327
-
3,845
2,947
3,616
16.7
19.9
11.5
27.2
28.4
12.0
2.7
2.3
9.8
20.8
1.8
1.4
Mangalam Cements
Neutral
233
-
621
1,053
1,347
10.5
13.3
8.4
26.0
27.7
9.0
1.2
1.1
4.3
12.5
1.0
0.7
Orient Cement
Neutral
152
-
3,109
1,854
2,524
21.2
22.2
7.7
11.1
19.7
13.7
2.8
2.4
13.3
15.7
2.4
1.7
Ramco Cements
Neutral
421
-
10,021
4,036
4,545
20.8
21.3
15.1
18.8
27.9
22.4
3.4
3.0
12.9
14.3
3.0
2.6
Shree Cement^
Neutral
12,329
-
42,951
7,150
8,742
26.7
28.6
228.0
345.5
54.1
35.7
8.0
6.7
15.7
20.3
5.8
4.7
UltraTech Cement
Neutral
3,140
-
86,167
24,669
29,265
18.2
20.6
82.0
120.0
38.3
26.2
4.1
3.6
11.3
14.7
3.6
3.1
Construction
ITNL
Buy
77
93
2,540
7,360
8,825
34.0
35.9
7.0
9.0
11.0
8.6
0.4
0.4
3.2
3.7
3.7
3.6
KNR Constructions
Buy
522
603
1,469
937
1,470
14.3
14.0
44.2
38.6
11.8
13.5
2.4
2.0
15.4
15.4
1.6
1.0
Larsen & Toubro
Accumulate
1,183
1,310
110,147
58,870
65,708
8.3
10.3
42.0
53.0
28.2
22.3
2.0
1.8
8.8
11.2
2.1
1.9
Gujarat Pipavav Port
Neutral
178
-
8,591
629
684
51.0
52.2
6.4
5.9
27.8
30.1
3.7
3.4
15.9
12.7
13.4
12.1
MBL Infrastructures
Buy
157
285
650
2,313
2,797
12.2
14.6
19.0
20.0
8.3
7.8
0.9
0.8
11.3
10.6
1.0
0.9
Nagarjuna Const.
Neutral
73
-
4,067
7,892
8,842
8.8
9.1
3.0
5.3
24.4
13.8
1.2
1.1
5.0
8.5
0.8
0.6
PNC Infratech
Accumulate
531
558
2,724
1,873
2,288
13.2
13.5
24.0
32.0
22.1
16.6
2.2
1.9
12.1
12.3
1.5
1.3
Simplex Infra
Neutral
242
-
1,197
5,955
6,829
10.3
10.5
16.0
31.0
15.1
7.8
0.8
0.7
5.3
9.9
0.7
0.6
Stock Watch
April 08, 2016
Company Name
Reco
CMP
Target
Mkt Cap
Sales ( Čcr )
OPM(%)
EPS (Č)
PER(x)
P/BV(x)
RoE(%)
EV/Sales(x)
(Č)
Price ( Č)
( Č cr )
FY16E
FY17E
FY16E
FY17E
FY16E
FY17E
FY16E
FY17E
FY16E
FY17E
FY16E
FY17E
FY16E
FY17E
Construction
Power Mech Projects
Neutral
576
-
847
1,539
1,801
12.8
12.7
59.0
72.1
9.8
8.0
1.5
1.2
18.6
16.8
0.6
0.5
Sadbhav Engineering
Accumulate
269
289
4,616
3,481
4,219
10.7
10.8
8.2
11.7
32.8
23.0
3.1
2.8
10.3
13.5
1.6
1.3
NBCC
Accumulate
942
1,089
11,309
5,816
7,382
6.9
7.7
29.6
39.8
31.8
23.7
5.7
4.5
24.1
26.7
1.7
1.3
MEP Infra
Neutral
40
-
657
1,956
1,876
28.1
30.5
1.3
3.0
31.1
13.5
6.5
4.4
21.2
32.8
1.7
1.7
SIPL
Neutral
103
-
3,640
675
1,042
62.4
64.7
-
-
3.9
4.4
-
-
16.7
11.3
Engineers India
Neutral
164
-
5,524
1,667
1,725
13.5
16.0
9.7
11.4
16.9
14.4
2.0
1.9
11.7
13.4
2.2
2.2
Financials
Allahabad Bank
Neutral
53
-
3,192
8,569
9,392
2.8
2.9
16.3
27.5
3.3
1.9
0.3
0.2
7.6
11.9
-
-
Axis Bank
Buy
426
494
101,616
26,473
31,527
3.5
3.6
35.7
43.5
11.9
9.8
2.0
1.7
17.9
18.9
-
-
Bank of Baroda
Neutral
143
-
33,030
18,485
21,025
1.9
2.0
13.5
21.1
10.7
6.8
0.8
0.8
7.3
10.6
-
-
Bank of India
Neutral
91
-
7,447
15,972
17,271
1.9
2.0
15.3
33.4
6.0
2.7
0.3
0.2
3.6
7.6
-
-
Canara Bank
Neutral
182
-
9,882
15,441
16,945
2.0
2.1
46.6
70.4
3.9
2.6
0.3
0.3
8.0
11.2
-
-
Dena Bank
Neutral
29
-
1,881
3,440
3,840
2.1
2.3
7.3
10.0
4.0
2.9
0.3
0.3
6.1
7.9
-
-
Dewan Housing Finance Buy
187
270
5,470
1,892
2,277
2.9
2.9
25.9
30.8
7.2
6.1
1.1
1.0
15.3
15.9
-
-
Federal Bank
Neutral
43
-
7,361
3,477
3,999
3.0
3.0
5.0
6.2
8.5
6.9
0.9
0.8
10.6
11.9
-
-
HDFC
Neutral
1,073
-
169,462
10,358
11,852
3.3
3.3
41.1
47.0
26.1
22.8
5.0
4.5
24.7
24.9
-
-
HDFC Bank
Buy
1,056
1,262
266,888
38,309
47,302
4.3
4.3
49.3
61.1
21.4
17.3
3.7
3.2
18.5
19.7
-
-
ICICI Bank
Accumulate
220
254
128,012
34,279
39,262
3.3
3.3
21.0
24.4
10.5
9.0
1.8
1.5
14.4
14.7
-
-
IDBI Bank
Neutral
68
-
13,948
9,625
10,455
1.8
1.8
8.5
14.2
8.0
4.8
0.5
0.5
5.9
9.3
-
-
Indian Bank
Neutral
99
-
4,769
6,160
6,858
2.5
2.5
24.5
29.8
4.1
3.3
0.3
0.3
7.7
8.6
-
-
LIC Housing Finance
Buy
464
592
23,432
3,101
3,745
2.5
2.5
33.0
40.2
14.1
11.6
2.6
2.2
19.7
20.5
-
-
Oriental Bank
Neutral
86
-
2,577
7,643
8,373
2.4
2.4
37.2
45.4
2.3
1.9
0.2
0.2
8.2
9.4
-
-
Punjab Natl.Bank
Neutral
81
-
15,886
23,638
26,557
2.8
2.8
17.9
27.2
4.5
3.0
0.5
0.4
8.5
12.0
-
-
South Ind.Bank
Neutral
17
-
2,343
1,965
2,185
2.5
2.5
2.5
3.3
7.0
5.3
0.7
0.6
9.5
11.7
-
-
St Bk of India
Neutral
182
-
141,360
79,958
86,061
2.6
2.6
13.4
20.7
13.6
8.8
1.1
1.0
11.5
12.8
-
-
Union Bank
Neutral
125
-
8,593
12,646
14,129
2.3
2.4
31.0
39.1
4.0
3.2
0.4
0.4
9.8
11.4
-
-
Vijaya Bank
Neutral
31
-
2,914
3,536
3,827
1.9
1.9
5.5
6.7
5.7
4.7
0.5
0.4
7.8
8.8
-
-
Yes Bank
Neutral
835
-
35,125
7,190
9,011
3.2
3.3
58.2
69.7
14.3
12.0
2.6
2.2
19.2
19.6
-
-
FMCG
Asian Paints
Neutral
857
-
82,198
16,553
19,160
16.0
16.2
17.7
21.5
48.5
39.9
12.9
11.6
29.4
31.2
4.8
4.2
Britannia
Neutral
2,701
-
32,404
8,481
9,795
14.0
14.1
65.5
78.3
41.2
34.5
19.5
16.0
38.3
41.2
3.7
3.2
Stock Watch
April 08, 2016
Company Name
Reco
CMP
Target
Mkt Cap
Sales ( Čcr )
OPM(%)
EPS (Č)
PER(x)
P/BV(x)
RoE(%)
EV/Sales(x)
(Č)
Price ( Č)
( Č cr )
FY16E FY17E
FY16E
FY17E
FY16E
FY17E
FY16E
FY17E
FY16E
FY17E
FY16E
FY17E
FY16E
FY17E
FMCG
Colgate
Neutral
822
-
22,355
4,836
5,490
19.5
19.7
48.5
53.2
17.0
15.5
12.4
10.8
99.8
97.5
4.6
4.0
Dabur India
Accumulate
248
267
43,583
9,370
10,265
17.1
17.2
7.3
8.1
33.8
30.6
10.2
8.3
33.7
30.6
4.6
4.2
GlaxoSmith Con*
Neutral
5,933
-
24,951
4,919
5,742
17.2
17.4
168.3
191.2
35.3
31.0
10.0
8.5
28.8
28.9
4.6
3.9
Godrej Consumer
Neutral
1,354
-
46,091
10,168
12,886
16.1
16.1
32.1
38.4
42.2
35.3
8.6
7.9
19.7
21.0
4.7
3.7
HUL
Neutral
861
-
186,228
34,940
38,957
17.5
17.7
20.8
24.7
41.4
34.8
46.0
36.8
110.5
114.2
5.2
4.6
ITC
Accumulate
320
359
257,189
36,804
38,776
37.9
37.9
12.2
12.9
26.2
24.8
7.3
6.4
27.7
25.8
6.7
6.4
Marico
Neutral
247
-
31,867
6,551
7,766
15.7
16.0
10.4
12.5
23.8
19.8
6.9
5.7
33.2
32.4
4.9
4.1
Nestle*
Buy
5,861
6,646
56,509
11,291
12,847
22.2
22.3
158.9
184.6
36.9
31.8
19.3
17.3
55.0
57.3
4.7
4.1
Tata Global
Buy
119
144
7,492
8,635
9,072
9.8
9.9
6.5
7.6
18.3
15.6
1.8
1.7
6.8
7.4
0.8
0.8
IT
HCL Tech^
Buy
829
1,038
116,871
42,038
47,503
21.2
21.5
51.5
57.7
16.1
14.4
3.5
2.7
21.5
18.8
2.4
2.0
Infosys
Accumulate
1,182
1,347
272,305
61,850
69,981
27.5
27.5
59.4
65.7
19.9
18.0
4.2
3.6
21.2
20.1
3.8
3.2
TCS
Buy
2,471
2,854
486,883
108,487
122,590
28.3
28.5
122.8
138.4
20.1
17.9
7.7
6.9
38.0
38.9
4.1
3.6
Tech Mahindra
Buy
445
530
43,043
26,524
29,177
16.2
17.0
28.8
33.6
15.4
13.2
3.0
2.5
19.3
19.1
1.4
1.2
Wipro
Buy
552
680
136,482
50,808
56,189
23.7
23.8
37.3
40.7
14.8
13.6
2.8
2.6
19.2
17.7
2.2
1.8
Media
D B Corp
Buy
311
356
5,712
2,241
2,495
27.8
27.9
21.8
25.6
14.3
12.1
3.7
3.3
26.7
28.5
2.4
2.2
HT Media
Neutral
77
-
1,798
2,495
2,603
11.2
11.2
7.3
8.6
10.6
9.0
0.8
0.8
7.4
8.1
0.2
0.2
Jagran Prakashan
Buy
157
189
5,119
2,170
2,355
27.2
26.2
8.9
9.9
17.6
15.8
3.7
3.2
20.9
20.5
2.3
2.1
Sun TV Network
Neutral
354
-
13,943
2,779
3,196
70.2
70.5
22.8
27.3
15.5
13.0
3.8
3.5
26.7
28.3
4.9
4.2
Hindustan Media
Neutral
249
-
1,828
920
1,031
20.0
20.0
19.2
20.9
13.0
11.9
2.1
1.8
16.4
15.3
1.5
1.3
Ventures
Metals & Mining
Coal India
Buy
281
380
177,553
76,167
84,130
19.9
22.3
22.4
25.8
12.5
10.9
4.5
4.4
35.5
41.0
1.6
1.4
Hind. Zinc
Accumulate
161
175
67,880
14,641
14,026
50.4
50.4
17.7
16.0
9.1
10.0
1.4
1.3
16.2
13.2
2.3
2.1
Hindalco
Neutral
87
-
18,007
104,356
111,186
8.7
9.5
6.7
11.1
13.0
7.9
0.5
0.5
3.5
5.9
0.7
0.6
JSW Steel
Neutral
1,277
-
30,863
42,308
45,147
16.4
20.7
(10.3)
49.5
25.8
1.4
1.4
(1.0)
5.6
1.8
1.7
NMDC
Neutral
102
-
40,420
8,237
10,893
46.6
44.5
10.0
11.7
10.3
8.7
1.1
1.0
12.5
13.0
4.7
3.6
SAIL
Neutral
42
-
17,532
45,915
53,954
7.2
10.5
1.5
4.4
28.2
9.7
0.4
0.4
2.3
4.1
1.0
0.9
Vedanta
Neutral
86
-
25,437
71,445
81,910
26.2
26.3
12.9
19.2
6.7
4.5
0.5
0.4
7.2
8.9
0.8
0.6
Tata Steel
Neutral
324
-
31,463
126,760
137,307
8.9
11.3
6.4
23.1
50.9
14.0
1.0
1.0
2.0
7.1
0.8
0.8
Oil & Gas
Cairn India
Neutral
147
-
27,532
11,323
12,490
49.4
51.0
20.7
20.7
7.1
7.1
0.5
0.4
6.4
6.1
1.5
0.8
GAIL
Neutral
341
-
43,280
64,856
70,933
9.1
9.6
24.0
28.9
14.2
11.8
1.2
1.1
8.8
9.6
0.9
0.8
Stock Watch
April 08, 2016
Company Name
Reco
CMP
Target
Mkt Cap
Sales ( Čcr )
OPM(%)
EPS (Č)
PER(x)
P/BV(x)
RoE(%)
EV/Sales(x)
(Č)
Price ( Č)
( Č cr )
FY16E FY17E
FY16E
FY17E
FY16E
FY17E
FY16E
FY17E
FY16E
FY17E
FY16E
FY17E
FY16E
FY17E
Oil & Gas
ONGC
Neutral
208
-
177,783
154,564
167,321
36.8
37.4
28.6
32.5
7.3
6.4
0.9
0.9
12.7
13.5
1.3
1.3
Petronet LNG
Neutral
240
-
18,000
29,691
31,188
5.8
6.2
12.8
13.4
18.8
17.9
2.8
2.5
15.8
14.8
0.7
0.7
Indian Oil Corp
Accumulate
411
455
99,825
359,607
402,760
5.9
6.1
42.5
48.7
9.7
8.4
1.3
1.2
14.1
14.4
0.4
0.3
Reliance Industries
Accumulate
1,038
1,150
336,335
304,775
344,392
12.6
13.4
91.3
102.6
11.4
10.1
1.3
1.2
11.8
12.0
1.0
0.9
Pharmaceuticals
Alembic Pharma
Neutral
569
-
10,718
3,274
3,802
26.9
19.4
35.0
28.7
16.2
19.8
7.2
5.4
55.6
31.2
3.4
2.8
Aurobindo Pharma
Accumulate
753
856
44,066
14,923
17,162
22.0
23.0
35.7
42.8
21.1
17.6
6.2
4.7
34.0
30.2
3.3
2.8
Aventis*
Neutral
4,337
-
9,988
2,082
2,371
17.4
20.8
118.2
151.5
36.7
28.6
5.4
4.3
19.9
25.5
4.4
3.6
Cadila Healthcare
Accumulate
320
352
32,709
10,224
11,840
21.0
22.0
14.6
17.6
21.9
18.2
6.0
4.7
30.8
29.0
3.2
2.7
Cipla
Buy
508
605
40,780
13,979
16,447
20.2
18.6
25.7
27.5
19.8
18.5
3.2
2.8
17.6
16.1
2.9
2.4
Dr Reddy's
Buy
3,031
3,933
51,696
16,838
19,575
25.0
23.1
167.5
178.8
18.1
17.0
3.8
3.2
23.1
20.4
3.0
2.5
Dishman Pharma
Neutral
333
-
2,684
1,733
1,906
21.5
21.5
17.0
19.9
19.6
16.7
2.0
1.8
10.5
11.2
2.1
1.8
GSK Pharma*
Neutral
3,666
-
31,052
2,870
3,158
20.0
22.1
59.5
68.3
61.6
53.7
18.2
18.7
28.5
34.3
10.5
9.6
Indoco Remedies
Neutral
272
-
2,510
1,033
1,199
15.9
18.2
9.4
13.6
29.0
20.0
4.3
3.7
15.7
19.7
2.6
2.2
Ipca labs
Buy
559
900
7,047
3,363
3,909
12.9
18.6
13.4
28.0
41.7
20.0
3.0
2.6
7.4
14.0
2.3
2.0
Lupin
Accumulate
1,507
1,560
67,883
13,092
16,561
25.0
27.0
50.4
68.3
29.9
22.1
6.2
4.9
22.8
24.7
4.8
3.7
Sun Pharma
Buy
812
950
195,530
28,163
32,610
25.8
30.7
17.4
26.9
46.7
30.2
4.4
3.8
13.0
16.6
6.4
5.3
Power
Tata Power
Neutral
64
-
17,283
35,923
37,402
22.6
22.8
4.1
5.2
15.8
12.4
1.2
1.1
7.5
9.3
1.5
1.3
NTPC
Buy
127
146
104,346
87,271
99,297
23.5
23.5
11.8
13.3
10.8
9.5
1.2
1.1
11.5
12.2
2.2
2.0
Power Grid
Buy
140
170
73,295
20,702
23,361
86.7
86.4
12.1
13.2
11.6
10.6
1.7
1.5
15.6
15.1
8.5
7.9
Real Estate
MLIFE
Buy
444
554
1,821
697
1,011
14.9
19.3
13.8
20.1
32.2
22.1
1.2
1.2
3.8
5.3
3.9
2.6
Telecom
Bharti Airtel
Neutral
332
-
132,594
101,748
109,191
32.1
31.7
12.0
12.5
27.6
26.5
1.9
1.8
6.9
6.7
2.0
1.8
Idea Cellular
Neutral
109
-
39,390
34,282
36,941
32.0
31.5
5.9
6.2
18.5
17.7
1.7
1.5
9.9
9.3
1.7
1.7
zOthers
Abbott India
Neutral
4,589
-
9,752
2,715
3,153
14.5
14.1
134.3
152.2
34.2
30.2
8.5
7.0
27.4
25.6
3.3
2.8
Bajaj Electricals
Accumulate
218
237
2,204
4,719
5,287
5.2
5.8
8.6
12.7
25.5
17.3
2.9
2.6
11.4
14.8
0.5
0.4
Finolex Cables
Neutral
281
-
4,290
2,520
2,883
12.2
12.0
12.7
14.2
22.1
19.8
3.0
2.7
13.6
13.5
1.5
1.2
Goodyear India*
Buy
490
582
1,130
1,800
1,600
11.7
11.5
58.7
52.9
8.3
9.3
1.9
1.6
24.6
18.7
0.4
0.4
Hitachi
Neutral
1,171
-
3,185
1,779
2,081
7.8
8.8
21.8
33.4
53.7
35.0
8.7
7.0
17.4
22.1
1.9
1.6
Jyothy Laboratories
Neutral
298
-
5,391
1,620
1,847
11.5
11.5
7.3
8.5
40.8
35.1
5.3
4.9
13.3
14.4
3.2
2.7
MRF
Buy
35,830
45,575
15,196
20,316
14,488
21.4
21.1
5,488.0
3,798.0
6.5
9.4
2.2
1.8
41.1
21.2
0.7
0.9
Stock Watch
April 08, 2016
Company Name
Reco
CMP
Target
Mkt Cap
Sales ( Čcr )
OPM(%)
EPS (Č)
PER(x)
P/BV(x)
RoE(%)
EV/Sales(x)
(Č)
Price ( Č)
( Č cr )
FY16E
FY17E
FY16E
FY17E
FY16E
FY17E
FY16E
FY17E
FY16E
FY17E
FY16E
FY17E
FY16E
FY17E
zOthers
Page Industries
Neutral
12,209
-
13,617
1,929
2,450
19.8
20.1
229.9
299.0
53.1
40.8
23.4
16.3
52.1
47.1
7.1
5.6
Relaxo Footwears
Neutral
493
-
5,913
1,767
2,152
12.3
12.5
19.3
25.1
25.6
19.7
6.3
4.8
27.7
27.8
3.5
2.8
Siyaram Silk Mills
Buy
994
1,354
932
1,636
1,815
11.5
11.5
89.9
104.1
11.1
9.6
1.8
1.6
17.9
17.8
0.7
0.7
Styrolution ABS India* Neutral
588
-
1,034
1,271
1,440
8.6
9.2
32.0
41.1
18.4
14.3
1.9
1.7
10.7
12.4
0.8
0.7
TVS Srichakra
Buy
2,415
3,217
1,849
2,035
2,252
15.9
15.3
248.6
268.1
9.7
9.0
4.2
3.1
43.6
33.9
1.0
0.8
HSIL
Neutral
299
-
2,162
2,123
2,384
16.1
16.5
15.0
18.9
19.9
15.9
1.5
1.4
8.0
9.4
1.4
1.2
Kirloskar Engines India
Neutral
225
-
3,254
2,403
2,554
8.6
9.9
9.2
10.5
24.5
21.5
2.4
2.2
9.7
10.7
1.0
0.9
Ltd
M M Forgings
Buy
450
614
543
511
615
21.7
21.6
43.1
55.8
10.4
8.1
1.9
1.6
19.9
21.2
1.3
1.0
Banco Products (India) Neutral
111
-
794
1,208
1,353
11.0
12.3
10.8
14.5
10.3
7.7
1.2
1.1
11.9
14.5
0.6
0.6
Competent Automobiles Neutral
137
-
84
1,040
1,137
3.2
3.1
25.7
28.0
5.3
4.9
0.8
0.7
15.0
14.3
0.1
0.1
Nilkamal
Neutral
1,111
-
1,658
1,871
2,031
10.7
10.5
63.2
69.8
17.6
15.9
2.9
2.5
17.6
16.6
0.9
0.8
Visaka Industries
Buy
110
144
175
1,086
1,197
9.9
10.3
21.5
28.8
5.1
3.8
0.5
0.5
9.6
11.6
0.4
0.3
Transport Corporation of
Neutral
272
-
2,068
2,830
3,350
8.8
9.0
14.4
18.3
18.9
14.9
2.9
2.5
15.4
17.1
0.9
0.7
India
Elecon Engineering
Neutral
61
-
669
1,359
1,482
10.3
13.7
0.8
3.9
76.5
15.8
1.3
1.2
1.6
7.8
0.9
0.8
Surya Roshni
Buy
142
201
621
2,992
3,223
8.1
8.4
14.7
18.3
9.7
7.7
0.9
0.8
9.7
11.0
0.5
0.5
MT Educare
Neutral
166
-
659
286
366
18.3
17.7
7.7
9.4
21.4
17.7
4.5
4.0
20.2
21.1
2.2
1.7
Radico Khaitan
Buy
94
156
1,256
1,517
1,635
12.7
13.4
5.8
7.1
16.2
13.3
1.4
1.3
8.6
9.6
1.3
1.2
Garware Wall Ropes
Buy
330
473
722
862
974
11.2
11.2
24.9
29.6
13.3
11.2
2.0
1.7
15.1
15.4
0.8
0.7
Wonderla Holidays
Neutral
378
-
2,135
206
308
44.0
43.6
9.0
12.9
42.0
29.3
5.7
5.2
13.7
17.8
10.2
6.8
Linc Pen & Plastics
Neutral
194
-
287
340
371
8.3
8.9
10.8
13.2
18.0
14.7
2.9
2.5
16.0
17.1
0.9
0.8
The Byke Hospitality
Neutral
155
-
620
222
287
20.5
20.5
5.6
7.6
27.4
20.5
5.2
4.3
18.9
20.8
2.9
2.2
Interglobe Aviation
Neutral
991
-
35,702
17,022
21,122
20.7
14.5
63.9
53.7
15.5
18.5
23.2
19.0
149.9
103.2
2.1
1.7
Coffee Day Enterprises
Neutral
228
-
4,691
2,692
2,964
17.0
18.6
-
4.7
-
48.1
2.8
2.6
0.2
5.5
2.2
2.0
Ltd
Navneet Education
Neutral
85
-
2,025
998
1,062
24.1
24.0
5.8
6.1
14.8
14.0
3.3
2.9
22.0
20.6
2.1
2.0
Navkar Corporation
Buy
177
265
2,528
365
436
38.3
37.5
5.6
5.9
31.5
30.2
2.0
1.9
6.3
6.1
7.7
6.6
UFO Moviez
Neutral
472
-
1,298
558
619
32.0
33.2
22.5
30.0
21.0
15.8
2.5
2.2
12.0
13.8
2.1
1.8
VRL Logistics
Neutral
377
-
3,438
1,725
1,902
16.5
16.7
12.2
14.6
31.0
25.9
6.4
5.7
20.8
21.9
2.1
1.9
Team Lease Serv.
Neutral
870
-
1,487
2,565
3,229
1.3
1.5
15.2
22.8
57.3
38.2
4.6
4.1
8.0
10.7
0.5
0.4
S H Kelkar & Co.
Neutral
235
-
3,399
928
1,036
15.3
15.1
4.9
6.1
47.6
38.5
4.5
4.1
9.4
10.7
3.5
3.1
Stock Watch
April 08, 2016
Company Name
Reco
CMP
Target Mkt Cap
Sales ( Čcr )
OPM(%)
EPS (Č)
PER(x)
P/BV(x)
RoE(%)
EV/Sales(x)
(Č)
Price ( Č)
( Č cr )
FY16E FY17E FY16E FY17E FY16E FY17E FY16E FY17E FY16E FY17E FY16E FY17E FY16E FY17E
zOthers
Quick Heal
Neutral
217
-
1,518
339
408
27.8
27.3
7.1
7.7
30.7
28.0
2.6
2.6
8.5
9.3
3.4
2.9
Narayana Hrudaya
Neutral
299
-
6,120
1,603
1,873
10.9
11.5
1.0
2.6
314.3
113.2
7.6
7.0
2.4
6.1
4.0
3.4
Manpasand Bever.
Neutral
452
-
2,262
540
836
19.9
19.6
10.2
16.9
44.1
26.8
3.6
3.2
8.1
12.0
3.9
2.5
Source: Company, Angel Research; Note: *December year end; #September year end; &October year end; Price as on April 07, 2016
Market Outlook
April 08, 2016
Research Team Tel: 022 - 39357800
DISCLAIMER
Angel Broking Private Limited (hereinafter referred to as “Angel”) is a registered Member of National Stock Exchange of India Limited,
Bombay Stock Exchange Limited and Metropolitian Stock Exchange of India Limited. It is also registered as a Depository Participant with
CDSL and Portfolio Manager with SEBI. It also has registration with AMFI as a Mutual Fund Distributor. Angel Broking Private Limited is a
registered entity with SEBI for Research Analyst in terms of SEBI (Research Analyst) Regulations, 2014 vide registration number
INH000000164. Angel or its associates has not been debarred/ suspended by SEBI or any other regulatory authority for accessing
/dealing in securities Market. Angel or its associates including its relatives/analyst do not hold any financial interest/beneficial ownership
of more than 1% in the company covered by Analyst. Angel or its associates/analyst has not received any compensation / managed or co
-managed public offering of securities of the company covered by Analyst during the past twelve months. Angel/analyst has not served as
an officer, director or employee of company covered by Analyst and has not been engaged in market making activity of the company
covered by Analyst.
This document is solely for the personal information of the recipient, and must not be singularly used as the basis of any investment
decision. Nothing in this document should be construed as investment or financial advice. Each recipient of this document should make
such investigations as they deem necessary to arrive at an independent evaluation of an investment in the securities of the companies
referred to in this document (including the merits and risks involved), and should consult their own advisors to determine the merits and
risks of such an investment.
Reports based on technical and derivative analysis center on studying charts of a stock's price movement, outstanding positions and
trading volume, as opposed to focusing on a company's fundamentals and, as such, may not match with a report on a company's
fundamentals.
The information in this document has been printed on the basis of publicly available information, internal data and other reliable sources
believed to be true, but we do not represent that it is accurate or complete and it should not be relied on as such, as this document is for
general guidance only. Angel Broking Pvt. Limited or any of its affiliates/ group companies shall not be in any way responsible for any
loss or damage that may arise to any person from any inadvertent error in the information contained in this report. Angel Broking Pvt.
Limited has not independently verified all the information contained within this document. Accordingly, we cannot testify, nor make any
representation or warranty, express or implied, to the accuracy, contents or data contained within this document. While Angel Broking
Pvt. Limited endeavors to update on a reasonable basis the information discussed in this material, there may be regulatory, compliance,
or other reasons that prevent us from doing so.
This document is being supplied to you solely for your information, and its contents, information or data may not be reproduced,
redistributed or passed on, directly or indirectly.
Neither Angel Broking Pvt. Limited, nor its directors, employees or affiliates shall be liable for any loss or damage that may arise from or
in connection with the use of this information.
Note: Please refer to the important ‘Stock Holding Disclosure' report on the Angel website (Research Section). Also, please refer to the
latest update on respective stocks for the disclosure status in respect of those stocks. Angel Broking Pvt. Limited and its affiliates may have
investment positions in the stocks recommended in this report.