Market Outlook
February 8, 2016
`
Market Cues
Domestic Indices
Chg (%)
(Pts)
(Close)
Indian markets are expected to open in red tracking the SGX Nifty and its Asian
BSE Sensex
1.1
279
24,617
peers.
Nifty
1.2
85
7,489
US markets ended in red reflecting a negative reaction to the closely watched
Mid Cap
1.9
193
10,335
monthly jobs report. With the steep drop on the day, the tech-heavy Nasdaq fell to
Small Cap
1.2
127
10,570
its lowest closing level in well over a year.
Bankex
2.1
355
17,173
The European markets ended mixed. The highly anticipated U.S. employment report
for January showed weaker than expected job growth and German factory orders
Global Indices
Chg (%)
(Pts)
(Close)
also disappointed. Investors were also confronted by a large number of corporate
Dow Jones
(1.3)
(212)
16,205
earnings results.
Nasdaq
(3.3)
(146)
4,363
Indian shares rose sharply to extend gains for a second consecutive session as crude
FTSE
(0.9)
(51)
5,848
prices steadied and weak U.S. data reinforced views that the Federal Reserve would
need to delay further rate hikes. While the rupee traded weak, upbeat FDI figures for
Nikkei
(1.3)
(225)
16,820
December and media reports that the government will notify minimum import prices
Hang Seng
0.6
105
19,288
for steel products spurred some buying in beaten-down stocks.
Shanghai Com
(0.6)
(18)
2,763
News & Result Analysis
Advances / Declines
BSE
NSE
Government imposes minimum import price on 173 steel items
Result Review: Goodyear India, TVS Srichakra, Lupin, Cadila Healthcare,
Advances
1,609
1,054
Dishman Pharama
Declines
1,029
483
Detailed analysis on Pg2
Unchanged
132
72
Investor’s Ready Reckoner
Volumes (` Cr)
Key Domestic & Global Indicators
BSE
2,854
Stock Watch: Latest investment recommendations on 150+ stocks
Refer P6 onwards
NSE
17,836
Top Picks
Net Inflows (` Cr)
Net
Mtd
Ytd
CMP
Target
Upside
Company
Sector
Rating
(`)
(`)
(%)
FII
(178)
(156)
(10,165)
Amara Raja Batteries Auto & Auto Ancillary
Buy
881
1,040
18.0
MFs
(407)
(787)
81,139
HCL Tech
IT
Buy
870
1,038
19.3
Larsen & Toubro
Construction
Buy
1,140
1,310
14.9
Top Gainers
Price (`)
Chg (%)
LIC Housing Finance Financials
Buy
446
592
32.6
Jindalstel
63
10.4
Navkar Corporation Others
Buy
188
265
41.3
Suzlon
16
9.4
More Top Picks on Pg4
Lupin
1,801
9.0
Key Upcoming Events
Vedl
74
9.0
Previous
Consensus
Date
Region
Event Description
Reading
Expectations
Jetairways
571
7.8
Feb 10 India
Exports YoY% (% Change)
(14.70)
--
Feb 10 India
Imports YoY% (% Change)
(3.90)
--
Top Losers
Price (`)
Chg (%)
Feb 12 India
Industrial Production YoY (% Change)
(3.20)
--
Aplltd
597
(5.8)
Feb 12 Euro Zone
Euro Zone GDP
0.30
0.30
6.(
Crompgreav
127
(5.3)
Boschltd
16,133
(5.0)
Gail
342
(3.7)
Niittech
530
(2.7)
As on February 05, 2016
Market Outlook
February 8, 2016
Government imposes minimum import price on 173 steel items
The government has imposed a minimum import price (MIP) ranging from $341 to
$752 per tonne on 173 steel products to provide relief to local steel makers hurt
by an increase in cheap imports of these items. The MIP will be valid for six months
from the date of the notification (5th Feb) or until further orders, whichever is
earlier. The notification said imports/shipment contracts (under Letter of Credit)
entered into before this date, are exempted from the MIP conditions. However, the
MIP will not be applicable on imports under the advance authorization scheme
and high-grade pipes used for pipeline transportation systems in the petroleum
and natural gas industry. MIP on semi-finished steel has been fixed at $341-362
per tonne, $362 per tonne for ingots and billets and $445-500 for flat rolled and
hot rolled steel. This is a welcome move for the steel players who have been
lobbying hard for some protection. Steel players especially the ones saddled with
high leverage will benefit the most. Tata steel, JSW steel, SAIL and JSPL would be
the major beneficiaries among the larger steel players.
Result Review
Goodyear India (CMP: `497/ TP: `587/ Upside: 18.1%)
Note- Goodyear is extending its Financial Year by one quarter to March 31, 2016.
Hence our FY2016E numbers account for 5 quarters.
Goodyear’s numbers for 4QFY2016 have come in lower than our estimates. The
top-line witnessed a marginal growth of 1.7% yoy to `366cr, which is below our
estimate of `397. Sales continue to be impacted on account of softness in demand
for farm tyres owing to erratic rainfall and only a moderate increase in MSPs. The
demand from OEMs has been unimpressive as tractor sales grew just ~3% yoy
during the Oct-Dec 2015 period, that too on a lower base. Declining realizations
also contributed towards a subdued top-line growth. On the operating front, the
EBITDA grew by 27.7% yoy to `39cr and the EBITDA margin improved by 214bp
yoy to `10.5%. Aided by the operating performance and higher other income, the
net profit for the quarter grew by 37.5% yoy to `26cr, still lower than our estimate
of `33cr.
The near term future for Goodyear looks to be improving on account on
expectation of a normal monsoon and good growth coming from the passenger
vehicle segment. At current market price, the stock is trading at 9.3x its FY2017E.
We have a Buy rating on the stock with a target price of `587 based on target P/E
of 11.0x for FY2017E.
Y/E
Sales OPM
PAT
EPS ROE P/E P/BV EV/EBITDA EV/Sales
Mar
(` cr)
(%)
(` cr)
(`)
(%)
(x)
(x)
(x)
(x)
FY2016E
1,800
11.7
136
58.8 24.6
8.5
1.9
3.5
0.4
FY2017E
1,600
11.9
123
53.4 18.9
9.3
1.6
3.3
0.4
Market Outlook
February 8, 2016
TVS Srichakra (CMP: `2,587/ TP: `3,217/ Upside: 24.3%)
For 3QFY2016, TVS Srichakra (TVSSL) reported a good set of numbers. The top-
line grew by 4.0% yoy to `509cr, against our estimate of `542cr. Although the
top-line was below our estimate, TVSSL is performing well and reporting top-line
growth while other tyre makers are reporting declines on yoy basis as TVSSL does
not have exposure to TBR segment and on account of its growing presence in the
2W aftermarket segment. As for operational performance, the other expenses
increased during the quarter by 313bp yoy to 23.9% but raw material expense
declined by 689bp yoy to 50.7% resulting in EBITDA margin expanding by 313bp
yoy to 15.9% and EBITDA growing by 29.3% yoy to `81cr. The margin and EBITDA
were both in-line with our expectation of `83cr and 15.4%, respectively. The
company has reduced its debt in the current fiscal and is net debt free as on
1HFY2016. Lower debt level (~37cr as on 1HFY2016) has resulted in interest
expense declining by 57.7% yoy to `3cr. Owing to better operational performance
and lower interest outgo the net profit nearly doubled to `48cr from `26cr in the
same quarter of the previous year (against our estimate of `49cr).
At current market price, the stock is trading at 9.7x its FY2017E earnings. We
maintain our Buy recommendation on the stock with target price of `3,217 based
on target P/E of 12x for FY2017E.
Y/E
Sales OPM
PAT
EPS ROE P/E P/BV EV/EBITDA EV/Sales
March
(` cr)
(%)
(` cr)
(`)
(%)
(x)
(x)
(x)
(x)
FY2016E
2,035
15.9
191
248.9
43.7
10.4
4.5
6.4
1.0
FY2017E
2,252
15.3
205
268.1
33.9
9.7
3.3
5.6
0.9
Lupin (CMP: `1,801/ TP: / Upside: )
Lupin, posted results more or less in line with expectation barring the other
income, which aided the net profit come in higher than expectations. For
3QFY2016, the company posted sales of `3358cr V/s `3400cr expected a yoy
growth of 6.8%. The Key geographies like US- ( `1405cr) posted a flat growth,
India ( `871.2cr) a yoy growth of 17.1%, Japan (`373.9cr) posted a 9.2% yoy
growth and ROW ( `225.9cr) posted a 18.1% yoy growth. On the operating front,
the OPM’s came in at 20.2% V/s 20.5% expected V/s 27.0% in 3QFY2015. The
R&D expenditure during the quarter was 11.7% of sales V/s 8.3% in 3QFY2015.
The, net profit came in at `529.1cr V/s `469cr expected and V/s `602cr in
3QFY2015, a yoy dip of 12.0%. This was on back of other income which came in
at `263cr V/s `116.1cr in 3QFY2015. Overall, we are neutral on the stock.
Y/E
Sales OPM
PAT
EPS ROE P/E P/BV EV/EBITDA EV/Sales
Mar
(` cr)
(%)
(` cr)
(`)
(%) (x) (x)
(x)
(x)
FY2016E
13,092
25.0
2,266
50.4 22.8 35.7
7.4
24.0
6.0
FY2017E
16,561
27.0
3,072
68.3 24.7 26.4
5.8
17.1
4.6
Cadila Healthcare (CMP: `327 / TP: `352/ Upside:7.6% )
Cadila Healthcare posted robust results during the quarter, on the net profit front,
while the sales came in lower. For 3QFY2016, the company posted sales of
`2342cr V/s `2600cr expected a yoy growth of 8.4%. The growth on sales front
was impacted on back domestic markets. Exports( `1398.8cr) which posted a
Market Outlook
February 8, 2016
10.6% yoy during the quarter, while domestic markets( `993.2cr) posted a 6.4%
yoy growth. In exports the key market like US (`1017.7cr) a yoy growth of 19.6%,
while other key market like Europe (`76.2cr ) posted a dip of 10.0%, while JV and
alliances (`100.2cr) posted a dip of 17.7% yoy. In domestic markets, the Indian
formulation markets posted a yoy growth of 11.0%
On operating front, the OPM came in at 21.0% V/s 21.4% expected and V/s
19.3% in 3QFY2015. The expansion in the OPM was driven by the GPM
expansion which expanded to 65.9% V/s 64.8% in 3QFY2015 and almost flat
growth in the staff and other expenditure. R&D expenditure, during the quarter
came in at 10.1% V/s 8.7% in 3QFY2015. Also during the quarter, the company
posted an other income of `112cr V/s `39.9cr in 3QFY2015.This, aided the net
profit to come in at `389cr V/s `353cr V/s `282cr, yoy growth of 38.2%. The Adj.
net profit came in at `390cr V/s `278cr in 3QFY2015, a yoy growth of 40.0%. We
maintain our accumulate with a price target of `352.
Y/E
Sales OPM PAT EPS ROE P/E P/BV EV/EBITDA EV/Sales
Mar
(` cr)
(%)
(` cr)
(`)
(%) (x)
(x)
(x)
(x)
FY2016E
10,224
21.0
1,496
14.6
30.8
22.4
6.1
15.6
3.3
FY2017E
11,840
22.0
1,800
17.6
29.0
18.6
4.8
12.4
2.7
Dishman Pharma (CMP: `347/ TP: / Upside: )
Dishman Pharma posted results better than expected on net profit level. For
3QFY2016, the company posted sales of `382.5cr V/s `450cr expected and
`38.5.8cr in 3QFY2015, a yoy de-growth of 0.9%. Its key segment CRAMS posted
sales of `293cr, a growth of 0.4% yoy, while other segment posted a sales of
`89.7cr, de-growth of 4.9%. On operating front, the gross margins came in at
77.9% V/s 67.0% in 3QFY2015, leading the OPM to come in 27.2% V/s 18.4%
expected and 18.2% in 3QFY2015. Thus, the Adj. net profit came in at `46.9cr
V/s `31.6cr expected and V/s `24cr in 3QFY2015, yoy growth of 95.3%. We
maintain our neutral rating on the stock.
Y/E
Sales OPM PAT EPS ROE P/E P/BV EV/EBITDA EV/Sales
Mar
(` cr)
(%)
(` cr)
(`)
(%) (x)
(x)
(x)
(x)
FY2016E
1,733
21.5
137 17.0
10.5
20.5
2.1
9.8
2.1
FY2017E
1,906
21.5
161 19.9
11.2
17.4
1.9
8.4
1.8
Economic and Political News
Arun Jaitley says states pitching for higher allocation to farm sector in Budget
2016
Cong wants land deals under Modi as Guj CM probed
Life-saving medicines to cost more: Govt withdraws customs exemption on 74
drugs
Corporate News
Alembic Pharma tastes success in the US
Narayana Hrudayalaya to expand chain with new projects at Jammu, Mumbai
Royal Enfield plans to enter Brazil market
Market Outlook
February 8, 2016
Top Picks
Large Cap
M
arket Cap
CM
P
T
arget
Upsid
e
Company
Rationale
(` Cr)
(`)
(`)
(%)
To outpace battery industry growth due to better technological
Amara Raja Batteries
15,055
881
1,040
18.0
products leading to market share gains in both the automotive
OEM and replacement segments.
Earnings to grow strongly given the MHCV cyclical upturn.
Ashok Leyland
25,784
91
111
22.5
Focus on exports and LCV's provides additional growth
avenue.
The stock is trading at attractive valuations and is factoring all
HCL Tech
1,22,625
870
1,038
19.3
the bad news.
Strong visibility for a robust 20% earnings trajectory, coupled
HDFC Bank
2,66,856
1,056
1,262
19.5
with high quality of earnings on account of high quality retail
business and strategic focus on highly rated corporates.
Back on the growth trend, expect a long term growth of 14%
Infosys
2,69,880
1,175
1,347
14.6
to be a US$20bn in FY2020.
Well positioned to benefit from such expected gradual
recovery in the overall domestic capex cycle, given its presence
Larsen & Toubro
1,06,126
1,140
1,310
14.9
across various infrastructure segments, its execution
capabilities, and its strong balance sheet.
LICHF continues to grow its retail loan book at a healthy pace
with improvement in asset quality. We expect the company to
LIC Housing Finance
22,523
446
592
32.6
post a healthy loan book which is likely to reflect in a strong
earnings growth.
Source: Company, Angel Research
Mid Cap
M
arket Cap
CM
P
T
arget
Upsid
e
Company
Rationale
(` Cr)
(`)
(`)
(%)
Favourable outlook for the AC industry to augur well for
Cooling products business which is out pacing the market
Blue Star
3,190
355
439
23.8
growth. EMPPAC division's profitability to improve once
operating environment turns around.
Change in business focus towards high-margin chronic &
Garware Wall Ropes
778
356
473
33.1
lifestyle segments and increasing penetration in Europe and
US
Economic recovery to have favourable impact on advertising &
circulation revenue growth. Further, the acquisition of a radio
Jagran Prakashan
5,208
159
189
18.6
business (Radio City) would also boost the company's revenue
growth.
Massive capacity expansion along with rail advantage at ICD
Navkar Corporation
2,675
188
265
41.3
as well CFS augurs well for the company
Earnings boost on back of stable material prices and
Radico Khaitan
1,509
113
156
37.6
favourable pricing environment. Valuation discount to peers
provides additional comfort
Strong brands and distribution network would boost growth
Siyaram Silk Mills
966
1,031
1,354
31.3
going ahead. Stock currently trades at an inexpensive
valuation.
Structural shift in the Lighting industry towards LED lighting will
Surya Roshni
631
144
201
39.7
drive growth.
Source: Company, Angel Research
Market Outlook
February 8, 2016
Key Upcoming Events
Result Calendar
Date
Company
February 08, 2016
JK Tyre, GlaxoSmith Con, Hitachi, Sterling Tools, Ipca labs
Motherson Sumi, Bharat Forge, Apollo Tyres, Ramco Cements, Punjab Natl.Bank, Power Fin.Corpn., Allahabad Bank,
February 09, 2016
Central Bank, Dena Bank, Britannia, SAIL, Hindalco, MOIL, GAIL, Essar Oil, Dr Reddy's, Aurobindo Pharma, CESC
Tata Chemicals, Tata Global, Automotive Axle, Areva, Ambuja Cements, ACC, India Cements, Rural Elec.Corp., UCO
February 10, 2016
Bank, Bank of Maharashtra, Petronet LNG, Bajaj Electrical, Finolex Cables, Cipla, GSK Pharma, NHPC
Tata Motors, Hero Motocorp, Ashok Leyland, BHEL, BGR Energy , J & K Bank, St Bk of India, Union Bank, Indian Bank,
February 11, 2016
Oriental Bank, Coal India, Nalco, ONGC, Indraprasth Gas, Page Industries, GIPCL, Unitech, Coffee Day Enterprises
Ltd
M&M, FAG Bearings, Canara Bank, Andhra Bank, Corporation Bank, Nestle, Sun TV Network, NMDC, Bhushan Steel,
February 12, 2016
Monnet Ispat, IOC, BPCL, HPCL, Sun Pharma, Anant Raj
February 13, 2016
Bank of Baroda, Adani Power
Source: Bloomberg, Angel Research
Global economic events release calendar
Bloomberg Data
Date
Time
Country
Event Description
Unit
Period
Last Reported
Estimated
Feb 10, 2016
India
Imports YoY%
% Change
Jan
(3.90)
India
Exports YoY%
% Change
Jan
(14.70)
3:00 PM UK
Industrial Production (YoY)
% Change
Dec
0.90
1.00
Feb 12, 2016
7:30 AM India
Industrial Production YoY
% Change
Dec
(3.20)
3:30 PM Euro Zone Euro-Zone GDP s.a. (QoQ)
% Change
4Q A
0.30
0.30
12:30 PM Germany GDP nsa (YoY)
% Change
4Q P
1.80
Feb 15, 2016
12:00 PM India
Monthly Wholesale Prices YoY%
% Change
Jan
(0.73)
China
Exports YoY%
% Change
Jan
(1.40)
(2.00)
Feb 16, 2016
3:00 PM UK
CPI (YoY)
% Change
Jan
0.20
Feb 17, 2016
7:00 PM US
Housing Starts
Thousands
Jan
1,149.00
7:00 PM US
Building permits
Thousands
Jan
1,204.00
3:00 PM UK
Jobless claims change
% Change
Jan
(4.30)
7:45 PM US
Industrial Production
%
Jan
(0.36)
US
Producer Price Index (mom)
% Change
Jan
(0.70)
Feb 18, 2016
7:00 AM China
Consumer Price Index (YoY)
% Change
Jan
1.60
Feb 19, 2016
7:00 PM US
Consumer price index (mom)
% Change
Jan
(0.10)
8:30 PM Euro Zone Euro-Zone Consumer Confidence
Value
Feb A
(6.30)
Source: Bloomberg, Angel Research
Market Outlook
February 8, 2016
Macro watch
Exhibit 1: Quarterly GDP trends
Exhibit 2: IIP trends
(%)
(%)
9.0
8.4
12.0
9.9
7.5
7.5
10.0
8.0
7.4
7.0
7.0
6.7
6.7
6.6
8.0
6.3
7.0
6.4
6.0
4.8
4.3
4.2
3.8
6.0
2.8
3.0
4.0
2.5
2.5
5.0
4.7
5.0
2.0
(3.2)
-
4.0
(2.0)
3.0
(4.0)
Source: CSO, Angel Research
Source: MOSPI, Angel Research
Exhibit 3: Monthly CPI inflation trends
Exhibit 4: Manufacturing and services PMI
(%)
56.0
Mfg. PMI
Services PMI
5.4
5.4
5.6
6.0
5.2
5.4
5.3
54.0
4.9
5.0
5.0
5.0
4.4
3.7
3.7
52.0
4.0
3.0
50.0
2.0
48.0
1.0
46.0
-
44.0
Source: MOSPI, Angel Research
Source: Market, Angel Research; Note: Level above 50 indicates expansion
Exhibit 5: Exports and imports growth trends
Exhibit 6: Key policy rates
(%)
Exports yoy growth
Imports yoy growth
(%)
Repo rate
Reverse Repo rate
CRR
0.0
8.00
7.50
(5.0)
7.00
(10.0)
6.50
(15.0)
6.00
5.50
(20.0)
5.00
(25.0)
4.50
4.00
(30.0)
3.50
(35.0)
3.00
Source: Bloomberg, Angel Research
Source: RBI, Angel Research
Market Outlook
February 8, 2016
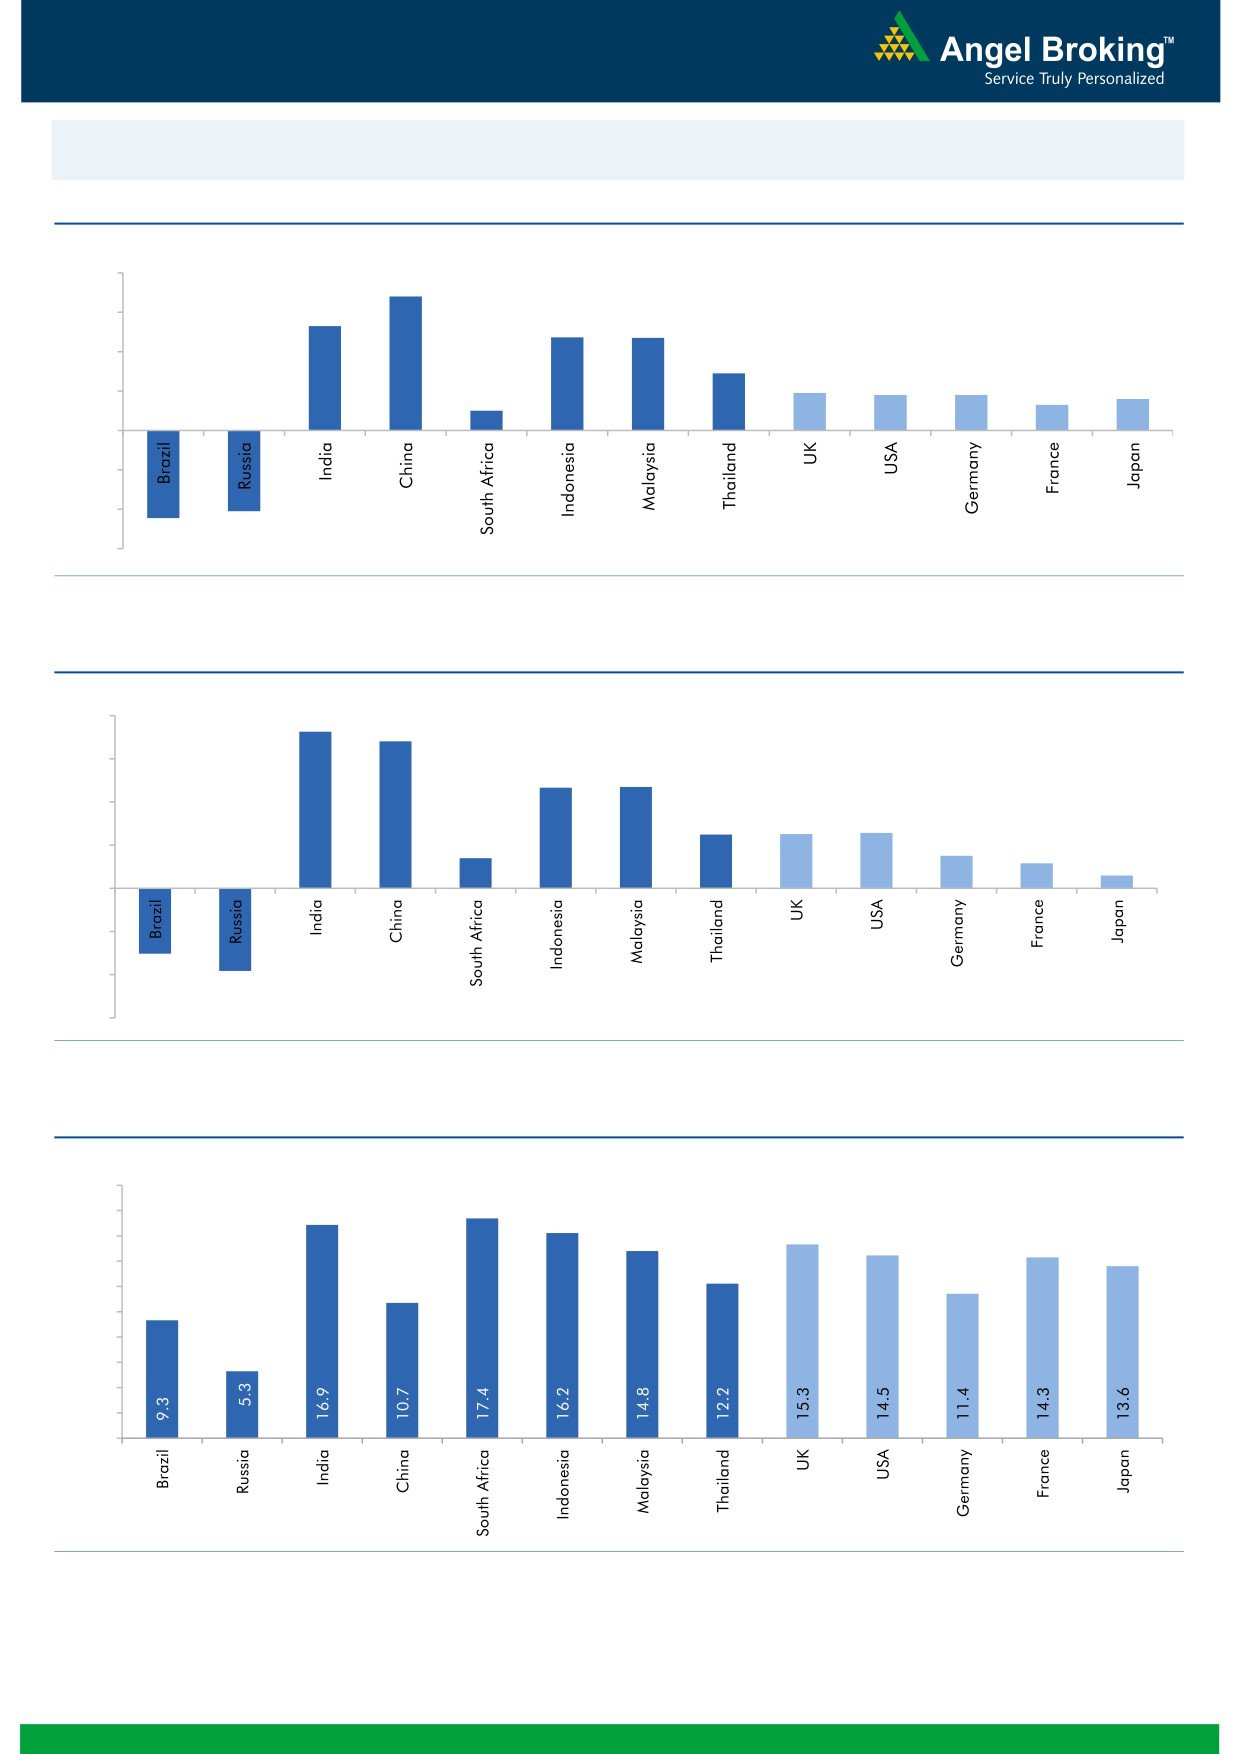
Global watch
Exhibit 1: Latest quarterly GDP Growth (%, yoy) across select developing and developed countries
(%)
8.0
6.8
6.0
5.3
4.7
4.7
4.0
2.9
1.9
1.8
1.8
1.3
1.6
2.0
1.0
-
(2.0)
(4.0)
(4.1)
(4.5)
(6.0)
Source: Bloomberg, Angel Research
Exhibit 2: 2015 GDP Growth projection by IMF (%, yoy) across select developing and developed countries
(%)
8.0
7.3
6.8
6.0
4.7
4.7
4.0
2.5
2.5
2.6
1.4
1.5
2.0
1.2
0.6
-
(2.0)
(3.0)
(4.0)
(3.8)
(6.0)
Source: IMF, Angel Research
Exhibit 3: One year forward P-E ratio across select developing and developed countries
(x)
20.0
18.0
16.0
14.0
12.0
10.0
8.0
6.0
4.0
2.0
-
Source: IMF, Angel Research
Stock Watch
February 08, 2016
Company Name
Reco
CMP
Target
Mkt Cap
Sales ( Čcr )
OPM(%)
EPS (Č)
PER(x)
P/BV(x)
RoE(%)
EV/Sales(x)
(Č)
Price ( Č)
( Č cr )
FY16E FY17E
FY16E
FY17E
FY16E
FY17E
FY16E
FY17E
FY16E
FY17E
FY16E
FY17E
FY16E
FY17E
Agri / Agri Chemical
Rallis
Neutral
161
-
3,128
2,097
2,415
14.4
14.4
9.5
11.0
16.9
14.6
3.4
2.9
21.1
21.3
1.5
1.3
United Phosphorus
Buy
413
480
17,684
12,500
14,375
18.3
18.3
29.8
35.9
13.9
11.5
2.6
2.1
20.0
20.3
1.5
1.2
Auto & Auto Ancillary
Ashok Leyland
Buy
91
111
25,784
17,995
21,544
11.4
11.6
3.4
4.7
26.7
19.3
4.7
4.3
17.7
22.2
1.4
1.1
Bajaj Auto
Buy
2,361
2,728
68,322
23,695
27,298
21.3
20.4
134.6
151.5
17.5
15.6
5.6
4.8
31.8
30.6
2.4
2.1
Bharat Forge
Buy
772
943
17,975
7,867
8,881
20.0
20.3
34.4
41.0
22.5
18.8
4.4
3.6
21.1
20.9
2.4
2.1
Eicher Motors
Accumulate
18,128
19,036
49,226
15,379
16,498
15.6
16.6
473.2
574.8
38.3
31.5
14.2
10.5
36.7
33.2
3.1
2.9
Gabriel India
Accumulate
88
101
1,271
1,415
1,544
8.7
9.0
4.6
5.4
19.2
16.4
3.5
3.1
18.1
18.9
0.9
0.8
Hero Motocorp
Accumulate
2,578
2,774
51,480
28,561
31,559
14.7
14.7
151.1
163.2
17.1
15.8
6.6
5.6
38.7
35.6
1.6
1.5
Jamna Auto Industries Neutral
145
-
1,160
1,292
1,486
9.3
9.8
6.0
7.5
24.2
19.4
5.0
4.2
20.7
21.8
1.0
0.8
L G Balakrishnan & Bros Neutral
452
-
709
1,254
1,394
11.6
11.8
35.9
41.7
12.6
10.8
1.7
1.5
13.5
13.8
0.7
0.6
Mahindra and Mahindra Buy
1,217
1,449
75,609
39,031
44,440
13.8
13.9
57.9
67.6
21.0
18.0
3.4
3.0
16.1
16.6
1.6
1.3
Maruti
Neutral
3,723
-
112,472
57,865
68,104
16.4
16.7
176.3
225.5
21.1
16.5
4.1
3.5
19.4
21.2
1.7
1.4
Minda Industries
Buy
886
1,047
1,405
2,523
2,890
8.7
9.0
55.0
65.4
16.1
13.5
3.1
2.5
19.3
18.7
0.7
0.6
Motherson Sumi
Buy
269
313
35,535
39,343
45,100
8.8
9.1
10.1
12.5
26.6
21.5
8.4
6.6
35.3
34.4
1.0
0.9
Rane Brake Lining
Buy
396
465
314
454
511
11.5
12.0
25.2
31.0
15.7
12.8
2.4
2.1
14.9
16.6
0.8
0.7
Setco Automotive
Neutral
33
-
438
594
741
12.7
13.7
1.7
3.2
19.3
10.3
2.0
1.8
10.4
16.9
1.2
1.0
Tata Motors
Buy
337
409
97,371
266,022
312,667
12.8
13.1
26.3
38.3
12.8
8.8
1.7
1.4
8.4
12.1
0.5
0.5
TVS Motor
Accumulate
288
322
13,702
11,263
13,106
6.9
8.3
9.2
14.6
31.4
19.8
7.2
5.7
22.7
29.1
1.2
1.0
Amara Raja Batteries
Buy
881
1,040
15,055
4,892
5,871
17.4
17.6
28.8
37.1
30.6
23.8
7.1
5.7
23.4
24.1
3.0
2.5
Exide Industries
Buy
125
162
10,617
6,950
7,784
14.4
14.8
6.6
7.3
18.9
17.1
2.4
2.2
12.6
12.8
1.2
1.1
Apollo Tyres
Buy
139
171
7,053
12,146
12,689
16.8
16.0
21.2
19.0
6.5
7.3
1.1
1.0
16.5
13.0
0.7
0.7
Ceat
Buy
901
1,119
3,644
6,041
6,597
14.1
13.7
99.5
111.9
9.1
8.1
1.8
1.5
19.6
18.5
0.8
0.6
JK Tyres
Neutral
88
-
1,990
7,446
7,669
15.2
14.0
19.6
18.4
4.5
4.8
1.1
0.9
25.2
19.5
0.7
0.6
Swaraj Engines
Accumulate
851
919
1,056
552
630
14.2
14.7
44.6
54.1
19.1
15.7
4.4
4.0
23.2
25.6
1.8
1.5
Subros
Neutral
86
-
517
1,293
1,527
11.8
11.9
4.2
6.7
20.5
12.9
1.5
1.4
7.7
11.5
0.7
0.6
Indag Rubber
Neutral
179
-
469
283
329
17.0
17.2
13.0
15.4
13.8
11.6
3.0
2.5
21.8
21.6
1.4
1.1
Capital Goods
ACE
Neutral
38
-
378
660
839
4.7
8.2
1.0
3.9
38.2
9.8
1.2
1.1
3.2
11.3
0.7
0.6
BEML
Neutral
1,031
-
4,294
3,277
4,006
6.0
8.9
29.2
64.3
35.3
16.0
2.0
1.8
5.7
11.7
1.4
1.1
Bharat Electronics
Accumulate
1,234
1,414
29,609
7,737
8,634
16.8
17.2
54.0
61.0
22.9
20.2
3.3
2.9
39.3
45.6
2.9
2.5
Stock Watch
February 08, 2016
Company Name
Reco
CMP
Target
Mkt Cap
Sales ( Čcr )
OPM(%)
EPS (Č)
PER(x)
P/BV(x)
RoE(%)
EV/Sales(x)
(Č)
Price ( Č)
( Č cr )
FY16E
FY17E
FY16E
FY17E
FY16E
FY17E
FY16E
FY17E
FY16E
FY17E
FY16E
FY17E
FY16E
FY17E
Capital Goods
Voltas
Buy
279
353
9,242
5,363
5,963
8.0
9.1
11.0
13.8
25.4
20.2
3.9
3.4
16.2
17.9
1.7
1.5
BGR Energy
Neutral
110
-
797
3,615
3,181
9.5
9.4
16.7
12.4
6.6
8.9
0.6
0.6
10.0
7.0
0.6
0.8
BHEL
Neutral
133
-
32,504
33,722
35,272
10.8
11.7
10.5
14.2
12.7
9.4
0.9
0.9
7.0
9.0
1.0
1.0
Blue Star
Buy
355
439
3,190
3,548
3,977
6.3
6.9
13.7
17.2
25.9
20.7
6.5
4.2
26.1
25.4
1.0
0.8
Crompton Greaves
Neutral
127
-
7,953
13,484
14,687
4.9
6.2
4.5
7.1
28.2
17.9
2.0
1.9
7.2
10.8
0.7
0.7
Greaves Cotton
Neutral
132
-
3,213
1,655
1,755
16.6
16.8
7.4
7.8
17.8
16.9
3.6
3.4
21.1
20.6
1.9
1.8
Inox Wind
Buy
295
458
6,547
4,980
5,943
17.0
17.5
26.6
31.6
11.1
9.3
3.3
2.4
35.0
30.0
1.5
1.2
KEC International
Neutral
118
-
3,022
8,791
9,716
6.1
6.8
5.4
8.2
21.8
14.3
2.2
2.0
10.0
14.0
0.6
0.5
Thermax
Neutral
796
-
9,484
6,413
7,525
7.4
8.5
30.5
39.3
26.1
20.3
4.0
3.5
15.0
17.0
1.5
1.2
Cement
ACC
Buy
1,271
1,630
23,856
13,151
14,757
16.4
18.3
63.9
83.4
19.9
15.2
2.6
2.4
13.3
16.1
1.7
1.4
Ambuja Cements
Buy
195
233
30,332
11,564
12,556
19.4
20.7
8.9
10.1
22.0
19.4
2.8
2.6
12.8
13.8
2.3
2.1
HeidelbergCement
Neutral
72
-
1,642
1,772
1,926
13.3
15.4
1.0
3.0
72.5
24.2
1.8
1.7
2.6
7.9
1.5
1.3
India Cements
Buy
84
112
2,583
4,216
4,840
18.0
19.5
4.0
9.9
21.0
8.5
0.8
0.8
4.0
9.5
0.9
0.8
JK Cement
Buy
465
744
3,251
3,661
4,742
10.1
15.8
18.0
61.0
25.8
7.6
1.9
1.7
7.5
22.9
1.4
1.0
J K Lakshmi Cement
Buy
274
430
3,227
2,947
3,616
16.7
19.9
11.5
27.2
23.9
10.1
2.3
2.0
9.8
20.8
1.5
1.2
Mangalam Cements
Neutral
180
-
479
1,053
1,347
10.5
13.3
8.4
26.0
21.4
6.9
0.9
0.8
4.3
12.5
0.8
0.6
Orient Cement
Buy
137
183
2,802
1,854
2,524
21.2
22.2
7.7
11.1
17.8
12.3
2.6
2.2
13.3
15.7
2.3
1.6
Ramco Cements
Neutral
383
-
9,118
4,036
4,545
20.8
21.3
15.1
18.8
25.4
20.4
3.1
2.8
12.9
14.3
2.8
2.4
Shree Cement^
Neutral
10,352
-
36,064
7,150
8,742
26.7
28.6
228.0
345.5
45.4
30.0
6.7
5.6
15.7
20.3
4.8
3.8
UltraTech Cement
Buy
2,843
3,282
78,012
25,021
30,023
19.1
21.6
89.0
132.0
31.9
21.5
3.7
3.2
12.2
15.9
3.2
2.7
Construction
ITNL
Neutral
76
-
2,503
7,360
8,825
34.0
35.9
7.0
9.0
10.9
8.5
0.4
0.4
3.2
3.7
3.7
3.6
KNR Constructions
Buy
503
673
1,415
937
1,470
14.3
14.0
33.5
38.6
15.0
13.0
2.3
2.0
15.4
15.4
1.6
1.0
Larsen & Toubro
Accumulate
1,140
1,310
106,126
58,870
65,708
8.3
10.3
42.0
53.0
27.1
21.5
1.9
1.7
8.8
11.2
2.0
1.8
Gujarat Pipavav Port
Neutral
155
-
7,513
629
684
51.0
52.2
6.4
5.9
24.3
26.3
3.2
2.9
15.9
12.7
11.6
10.5
MBL Infrastructures
Buy
156
285
645
2,313
2,797
12.2
14.6
19.0
20.0
8.2
7.8
0.9
0.8
11.3
10.6
1.0
0.9
Nagarjuna Const.
Neutral
63
-
3,508
7,892
8,842
8.8
9.1
3.0
5.3
21.0
11.9
1.1
1.0
5.0
8.5
0.7
0.6
PNC Infratech
Accumulate
504
558
2,585
1,873
2,288
13.2
13.5
24.0
32.0
21.0
15.7
2.0
1.8
12.1
12.3
1.5
1.2
Simplex Infra
Neutral
267
-
1,321
5,955
6,829
10.3
10.5
16.0
31.0
16.7
8.6
0.9
0.8
5.3
9.9
0.7
0.6
Power Mech Projects
Neutral
590
-
868
1,539
1,801
12.8
12.7
59.0
72.1
10.0
8.2
1.5
1.3
18.6
16.8
0.6
0.5
Stock Watch
February 08, 2016
Company Name
Reco
CMP
Target
Mkt Cap
Sales ( Čcr )
OPM(%)
EPS (Č)
PER(x)
P/BV(x)
RoE(%)
EV/Sales(x)
(Č)
Price ( Č)
( Č cr )
FY16E
FY17E
FY16E
FY17E
FY16E
FY17E
FY16E
FY17E
FY16E
FY17E
FY16E
FY17E
FY16E
FY17E
Construction
Sadbhav Engineering
Neutral
312
-
5,348
3,481
4,219
10.7
10.8
8.0
12.0
39.0
26.0
3.6
3.2
10.3
13.5
1.8
1.5
NBCC
Buy
942
1,089
11,304
7,382
9,506
7.7
8.6
39.8
54.4
23.7
17.3
5.7
4.5
26.7
29.1
1.3
1.0
MEP Infra
Neutral
41
-
662
1,956
1,876
28.1
30.5
1.3
3.0
31.3
13.6
6.6
4.4
21.2
32.8
1.8
1.7
SIPL
Neutral
86
-
3,012
675
1,042
62.4
64.7
-
-
3.2
3.7
-
-
16.1
10.9
Financials
Allahabad Bank
Neutral
52
-
3,129
8,569
9,392
2.8
2.9
16.3
27.5
3.2
1.9
0.3
0.2
7.6
11.9
-
-
Axis Bank
Buy
399
494
94,932
26,473
31,527
3.5
3.6
35.7
43.5
11.2
9.2
1.9
1.6
17.9
18.9
-
-
Bank of Baroda
Neutral
127
-
29,240
18,485
21,025
1.9
2.0
13.5
21.1
9.4
6.0
0.8
0.7
7.3
10.6
-
-
Bank of India
Neutral
98
-
7,941
15,972
17,271
1.9
2.0
15.3
33.4
6.4
2.9
0.3
0.3
3.6
7.6
-
-
Canara Bank
Neutral
193
-
10,491
15,441
16,945
2.0
2.1
46.6
70.4
4.2
2.7
0.4
0.3
8.0
11.2
-
-
Dena Bank
Neutral
35
-
2,226
3,440
3,840
2.1
2.3
7.3
10.0
4.8
3.4
0.4
0.3
6.1
7.9
-
-
Federal Bank
Neutral
46
-
7,867
3,477
3,999
3.0
3.0
5.0
6.2
9.1
7.3
0.9
0.8
10.6
11.9
-
-
HDFC
Neutral
1,184
-
186,874
10,358
11,852
3.3
3.3
41.1
47.0
28.8
25.2
5.5
5.0
24.7
24.9
-
-
HDFC Bank
Buy
1,056
1,262
266,856
38,309
47,302
4.3
4.3
49.3
61.1
21.4
17.3
3.7
3.2
18.5
19.7
-
-
ICICI Bank
Buy
209
254
121,596
34,279
39,262
3.3
3.3
21.0
24.4
10.0
8.6
1.7
1.4
14.4
14.7
-
-
IDBI Bank
Neutral
57
-
10,830
9,625
10,455
1.8
1.8
8.5
14.2
6.7
4.0
0.4
0.4
5.9
9.3
-
-
Indian Bank
Neutral
86
-
4,138
6,160
6,858
2.5
2.5
24.5
29.8
3.5
2.9
0.3
0.3
7.7
8.6
-
-
LIC Housing Finance
Buy
446
592
22,523
3,101
3,745
2.5
2.5
33.0
40.2
13.5
11.1
2.5
2.2
19.7
20.5
-
-
Oriental Bank
Neutral
105
-
3,151
7,643
8,373
2.4
2.4
37.2
45.4
2.8
2.3
0.3
0.2
8.2
9.4
-
-
Punjab Natl.Bank
Neutral
95
-
18,585
23,638
26,557
2.8
2.8
17.9
27.2
5.3
3.5
0.5
0.4
8.5
12.0
-
-
South Ind.Bank
Neutral
19
-
2,505
1,965
2,185
2.5
2.5
2.5
3.3
7.4
5.6
0.7
0.7
9.5
11.7
-
-
St Bk of India
Buy
168
202
130,570
82,520
93,299
2.7
2.8
20.0
24.5
8.4
6.9
0.9
0.8
11.5
12.8
-
-
Union Bank
Neutral
131
-
9,036
12,646
14,129
2.3
2.4
31.0
39.1
4.2
3.4
0.5
0.4
9.8
11.4
-
-
Vijaya Bank
Neutral
34
-
2,947
3,536
3,827
1.9
1.9
5.5
6.7
6.2
5.2
0.5
0.5
7.8
8.8
-
-
Yes Bank
Neutral
777
-
32,644
7,190
9,011
3.2
3.3
58.2
69.7
13.4
11.2
2.4
2.0
19.2
19.6
-
-
FMCG
Asian Paints
Neutral
897
-
86,054
16,553
19,160
16.0
16.2
17.7
21.5
50.8
41.7
13.5
12.1
29.4
31.2
5.0
4.3
Britannia
Neutral
2,866
-
34,389
8,065
9,395
9.6
10.2
47.2
65.5
60.7
43.8
20.2
19.1
38.3
41.2
4.1
3.5
Colgate
Neutral
852
-
23,181
4,836
5,490
19.5
19.7
48.5
53.2
17.6
16.0
12.9
11.2
99.8
97.5
4.7
4.1
Dabur India
Accumulate
251
267
44,093
9,370
10,265
17.1
17.2
7.3
8.1
34.2
30.9
10.3
8.4
33.7
30.6
4.6
4.2
GlaxoSmith Con*
Accumulate
5,751
6,118
24,185
4,919
5,742
17.2
17.4
168.3
191.2
34.2
30.1
9.7
8.3
28.8
28.9
4.5
3.8
Stock Watch
February 08, 2016
Company Name
Reco
CMP
Target
Mkt Cap
Sales ( Čcr )
OPM(%)
EPS (Č)
PER(x)
P/BV(x)
RoE(%)
EV/Sales(x)
(Č)
Price ( Č)
( Č cr )
FY16E FY17E
FY16E
FY17E
FY16E
FY17E
FY16E
FY17E
FY16E
FY17E
FY16E
FY17E
FY16E
FY17E
FMCG
Godrej Consumer
Neutral
1,245
-
42,396
10,168
12,886
16.1
16.1
32.1
38.4
38.8
32.4
7.9
7.3
19.7
21.0
4.3
3.4
HUL
Neutral
845
-
182,836
34,940
38,957
17.5
17.7
20.8
24.7
40.6
34.2
45.2
36.1
110.5
114.2
5.0
4.5
ITC
Buy
324
382
260,359
41,068
45,068
37.8
37.4
13.9
15.9
23.3
20.4
7.8
6.9
34.1
33.8
6.0
5.4
Marico
Neutral
228
-
29,364
6,551
7,766
15.7
16.0
10.4
12.5
21.9
18.2
6.4
5.3
33.2
32.4
4.4
3.7
Nestle*
Buy
5,434
6,646
52,389
11,291
12,847
22.2
22.3
158.9
184.6
34.2
29.4
17.9
16.1
55.0
57.3
4.5
3.9
Tata Global
Buy
123
144
7,738
8,635
9,072
9.8
9.9
6.5
7.6
18.9
16.1
1.9
1.8
6.8
7.4
0.8
0.8
IT
HCL Tech^
Buy
870
1,038
122,625
42,038
47,503
21.2
21.5
51.5
57.7
16.9
15.1
3.7
2.8
21.5
18.8
2.5
2.0
Infosys
Accumulate
1,175
1,347
269,880
61,850
69,981
27.5
27.5
59.4
65.7
19.8
17.9
4.2
3.6
21.2
20.1
3.6
3.1
TCS
Buy
2,426
2,854
477,996
108,487
122,590
28.3
28.5
122.8
138.4
19.8
17.5
7.5
6.8
38.0
38.9
4.0
3.5
Tech Mahindra
Buy
475
646
45,929
25,566
28,890
16.0
17.0
26.3
31.9
18.1
14.9
3.3
2.8
17.9
18.6
1.6
1.3
Wipro
Buy
558
719
137,853
50,808
58,713
23.7
23.8
37.3
42.3
15.0
13.2
2.8
2.5
19.0
17.9
2.3
1.8
Media
D B Corp
Accumulate
321
356
5,892
2,241
2,495
27.8
27.9
21.8
25.6
14.7
12.5
3.8
3.4
26.7
28.5
2.6
2.3
HT Media
Neutral
74
-
1,730
2,495
2,603
11.2
11.2
7.3
8.6
10.2
8.7
0.8
0.7
7.4
8.1
0.2
0.2
Jagran Prakashan
Buy
159
189
5,208
2,170
2,355
27.2
26.2
8.9
9.9
17.9
16.1
3.8
3.3
20.9
20.5
2.3
2.1
Sun TV Network
Neutral
350
-
13,811
2,779
3,196
70.2
70.5
22.8
27.3
15.4
12.8
3.8
3.4
26.7
28.3
4.7
4.1
Hindustan Media
Neutral
267
-
1,959
920
1,031
20.0
20.0
19.2
20.9
13.9
12.8
2.3
2.0
16.4
15.3
1.7
1.5
Ventures
Metals & Mining
Coal India
Buy
326
380
206,040
76,167
84,130
19.9
22.3
22.4
25.8
14.6
12.6
5.2
5.1
35.5
41.0
2.0
1.8
Hind. Zinc
Neutral
168
-
71,091
14,641
14,026
50.4
50.4
17.7
16.0
9.5
10.5
1.5
1.3
16.2
13.2
2.5
2.3
Hindalco
Neutral
71
-
14,734
104,356
111,186
8.7
9.5
6.7
11.1
10.6
6.5
0.4
0.4
3.5
5.9
0.7
0.6
JSW Steel
Neutral
1,039
-
25,116
42,308
45,147
16.4
20.7
(10.3)
49.5
21.0
1.2
1.1
(1.0)
5.6
1.6
1.5
NMDC
Neutral
85
-
33,542
8,237
10,893
46.6
44.5
10.0
11.7
8.5
7.3
1.0
0.8
12.5
13.0
3.9
2.9
SAIL
Neutral
41
-
16,871
45,915
53,954
7.2
10.5
1.5
4.4
27.1
9.3
0.4
0.4
2.3
4.1
1.0
0.9
Vedanta
Neutral
74
-
21,894
71,445
81,910
26.2
26.3
12.9
19.2
5.7
3.9
0.4
0.4
7.2
8.9
0.8
0.6
Tata Steel
Neutral
234
-
22,726
126,760
137,307
8.9
11.3
6.4
23.1
36.8
10.1
0.7
0.7
2.0
7.1
0.8
0.7
Oil & Gas
Cairn India
Neutral
127
-
23,867
11,323
12,490
49.4
51.0
20.7
20.7
6.1
6.2
0.4
0.4
6.4
6.1
1.2
0.6
GAIL
Neutral
342
-
43,318
64,856
70,933
9.1
9.6
24.0
28.9
14.3
11.8
1.2
1.1
8.8
9.6
0.9
0.8
ONGC
Neutral
220
-
188,178
154,564
167,321
36.8
37.4
28.6
32.5
7.7
6.8
1.0
0.9
12.7
13.5
1.4
1.3
Petronet LNG
Neutral
264
-
19,766
29,691
31,188
5.8
6.2
12.8
13.4
20.6
19.6
3.1
2.7
15.8
14.8
0.7
0.7
Indian Oil Corp
Buy
394
455
95,734
359,607
402,760
5.9
6.1
42.5
48.7
9.3
8.1
1.2
1.1
14.1
14.4
0.4
0.3
Stock Watch
February 08, 2016
Company Name
Reco
CMP
Target
Mkt Cap
Sales ( Čcr )
OPM(%)
EPS (Č)
PER(x)
P/BV(x)
RoE(%)
EV/Sales(x)
(Č)
Price ( Č)
( Č cr )
FY16E FY17E
FY16E
FY17E
FY16E
FY17E
FY16E
FY17E
FY16E
FY17E
FY16E
FY17E
FY16E
FY17E
Oil & Gas
Reliance Industries
Buy
972
1,150
314,967
304,775
344,392
12.6
13.4
91.3
102.6
10.7
9.5
1.2
1.1
11.8
12.0
1.0
0.8
Pharmaceuticals
Alembic Pharma
Neutral
597
-
11,246
3,274
3,802
26.9
19.4
35.0
28.7
17.0
20.8
7.6
5.7
55.6
31.2
3.4
2.9
Aurobindo Pharma
Accumulate
763
856
44,595
14,923
17,162
22.0
23.0
35.7
42.8
21.4
17.8
6.3
4.7
34.0
30.2
3.4
2.9
Aventis*
Neutral
4,227
-
9,735
2,082
2,371
17.4
20.8
118.2
151.5
35.8
27.9
5.2
4.2
19.9
25.5
4.4
3.6
Cadila Healthcare
Accumulate
327
352
33,456
10,224
11,840
21.0
22.0
14.6
17.6
22.4
18.6
6.1
4.8
30.8
29.0
3.3
2.8
Cipla
Accumulate
570
636
45,785
14,211
16,611
20.6
19.0
27.0
28.9
21.1
19.7
3.6
3.1
18.4
16.8
3.2
2.7
Dr Reddy's
Buy
3,109
3,933
53,020
16,838
19,575
25.0
23.1
167.5
178.8
18.6
17.4
3.9
3.3
23.1
20.4
3.1
2.6
Dishman Pharma
Neutral
348
-
2,805
1,733
1,906
21.5
21.5
17.0
19.9
20.5
17.5
2.1
1.9
10.5
11.2
2.1
1.8
GSK Pharma*
Neutral
3,291
-
27,874
2,870
3,158
20.0
22.1
59.5
68.3
55.3
48.2
16.3
16.8
28.5
34.3
9.2
8.4
Indoco Remedies
Neutral
307
-
2,827
1,033
1,199
15.9
18.2
9.4
13.6
32.6
22.6
4.8
4.1
15.7
19.7
2.8
2.4
Ipca labs
Buy
619
900
7,814
3,363
3,909
12.9
18.6
13.4
28.0
46.2
22.1
3.3
2.9
7.4
14.0
2.6
2.2
Lupin
Neutral
1,801
-
81,161
13,092
16,561
25.0
27.0
50.4
68.3
35.7
26.4
7.4
5.8
22.8
24.7
5.9
4.6
Sun Pharma
Accumulate
857
950
206,198
28,163
32,610
25.8
30.7
17.4
26.9
49.2
31.9
4.7
4.0
13.0
16.6
6.8
5.7
Power
Tata Power
Neutral
60
-
16,336
35,923
37,402
22.6
22.8
4.1
5.2
14.9
11.7
1.1
1.1
7.5
9.3
1.4
1.3
NTPC
Buy
125
157
102,821
87,064
98,846
23.5
23.5
11.7
13.2
10.7
9.5
1.2
1.1
11.4
12.1
2.2
2.0
Power Grid
Buy
145
170
76,015
20,702
23,361
86.7
86.4
12.1
13.2
12.0
11.0
1.8
1.6
15.6
15.1
8.6
8.0
Telecom
Bharti Airtel
Neutral
307
-
122,760
101,748
109,191
32.1
31.7
12.0
12.5
25.6
24.6
1.8
1.7
6.9
6.7
1.8
1.7
Idea Cellular
Neutral
101
-
36,526
34,282
36,941
32.0
31.5
5.9
6.2
17.2
16.4
1.6
1.4
9.9
9.3
1.6
1.6
zOthers
Abbott India
Neutral
4,963
-
10,546
2,715
3,153
14.5
14.1
134.3
152.2
37.0
32.6
9.2
7.6
27.4
25.6
3.6
3.0
Bajaj Electricals
Buy
178
290
1,801
4,719
5,287
5.2
5.8
8.6
12.7
20.9
14.1
2.4
2.1
11.4
14.8
0.4
0.3
Finolex Cables
Neutral
226
-
3,460
2,520
2,883
12.2
12.0
12.7
14.2
17.9
15.9
2.4
2.2
13.6
13.5
1.1
0.9
Goodyear India*
Buy
497
622
1,147
1,888
1,680
12.1
11.9
62.2
56.6
8.0
8.8
1.9
1.6
25.9
19.7
0.4
0.4
Hitachi
Neutral
1,130
-
3,072
1,779
2,081
7.8
8.8
21.8
33.4
51.8
33.8
8.4
6.8
17.4
22.1
1.8
1.5
Jyothy Laboratories
Neutral
287
-
5,190
1,620
1,847
11.5
11.5
7.3
8.5
39.3
33.8
5.1
4.7
13.3
14.4
3.1
2.6
MRF
Buy
34,190
45,575
14,500
20,316
14,488
21.4
21.1
5,488.0
3,798.0
6.2
9.0
2.1
1.7
41.1
21.2
0.7
0.9
Page Industries
Neutral
11,760
-
13,117
1,929
2,450
19.8
20.1
229.9
299.0
51.2
39.3
22.6
15.7
52.1
47.1
6.8
5.4
Relaxo Footwears
Neutral
438
-
5,258
1,767
2,152
12.3
12.5
19.3
25.1
22.8
17.5
5.6
4.3
27.7
27.8
3.0
2.5
Siyaram Silk Mills
Buy
1,031
1,354
966
1,636
1,815
11.5
11.5
89.9
104.1
11.5
9.9
1.9
1.6
17.9
17.8
0.8
0.7
Styrolution ABS India*
Buy
588
698
1,033
1,271
1,440
8.6
9.2
32.0
41.1
18.3
14.3
1.9
1.7
10.7
12.4
0.8
0.7
Stock Watch
February 08, 2016
Company Name
Reco
CMP
Target
Mkt Cap
Sales ( Čcr )
OPM(%)
EPS (Č)
PER(x)
P/BV(x)
RoE(%)
EV/Sales(x)
(Č)
Price ( Č)
( Č cr )
FY16E
FY17E
FY16E
FY17E
FY16E
FY17E
FY16E
FY17E
FY16E
FY17E
FY16E
FY17E
FY16E
FY17E
zOthers
TVS Srichakra
Buy
2,586
3,240
1,980
2,101
2,338
15.7
15.0
248.6
270.0
10.4
9.6
4.5
3.3
43.6
34.0
1.0
0.8
HSIL
Accumulate
267
302
1,927
2,123
2,384
16.1
16.5
15.0
18.9
17.7
14.1
1.4
1.3
8.0
9.4
1.3
1.1
Kirloskar Engines India
Neutral
228
-
3,292
2,403
2,554
8.6
9.9
9.2
10.5
24.8
21.7
2.4
2.3
9.7
10.7
1.0
0.9
Ltd
M M Forgings
Buy
405
614
488
511
615
21.7
21.6
43.1
55.8
9.4
7.3
1.7
1.4
19.9
21.2
1.2
0.9
Banco Products (India) Neutral
114
-
814
1,208
1,353
11.0
12.3
10.8
14.5
10.6
7.9
1.2
1.1
11.9
14.5
0.6
0.6
Competent Automobiles Neutral
136
-
84
1,040
1,137
3.2
3.1
25.7
28.0
5.3
4.9
0.8
0.7
15.0
14.3
0.1
0.1
Nilkamal
Neutral
1,242
-
1,853
1,871
2,031
10.7
10.5
63.2
69.8
19.7
17.8
3.2
2.7
17.6
16.6
1.0
0.9
Visaka Industries
Buy
101
144
161
1,086
1,197
9.9
10.3
21.5
28.8
4.7
3.5
0.5
0.4
9.6
11.6
0.4
0.3
Transport Corporation of
Neutral
231
-
1,757
2,830
3,350
8.8
9.0
14.4
18.3
16.1
12.6
2.5
2.2
15.4
17.1
0.7
0.6
India
Elecon Engineering
Neutral
63
-
683
1,369
1,533
13.7
14.9
3.3
6.1
18.9
10.4
1.2
1.1
6.6
11.4
0.8
0.7
Surya Roshni
Buy
144
201
631
2,992
3,223
8.1
8.4
14.7
18.3
9.8
7.9
0.9
0.8
9.7
11.0
0.5
0.5
MT Educare
Neutral
159
-
634
286
366
18.3
17.7
7.7
9.4
20.6
17.0
4.3
3.8
20.2
21.1
2.1
1.6
Radico Khaitan
Buy
113
156
1,509
1,565
1,687
12.2
13.0
5.7
7.1
19.9
16.0
1.7
1.5
8.3
9.6
1.4
1.3
Garware Wall Ropes
Buy
356
473
778
862
974
11.2
11.2
24.9
29.6
14.3
12.0
2.2
1.9
15.1
15.4
0.9
0.8
Wonderla Holidays
Neutral
380
-
2,144
206
308
44.0
43.6
9.0
12.9
42.2
29.4
5.8
5.2
13.7
17.8
10.3
6.9
Linc Pen & Plastics
Neutral
201
-
298
340
371
8.3
8.9
10.8
13.2
18.6
15.3
3.0
2.6
16.0
17.1
0.9
0.8
The Byke Hospitality
Neutral
160
-
643
222
287
20.5
20.5
5.6
7.6
28.5
21.2
5.4
4.4
18.9
20.8
2.9
2.3
Interglobe Aviation
Neutral
837
-
30,171
17,022
21,122
20.7
14.5
63.9
53.7
13.1
15.6
19.6
16.1
149.9
103.2
1.8
1.4
Coffee Day Enterprises
Neutral
246
-
5,070
2,692
2,964
17.0
18.6
-
4.7
-
51.9
3.0
2.8
0.2
5.5
2.3
2.1
Ltd
Navneet Education
Neutral
83
-
1,981
998
1,062
24.1
24.0
5.8
6.1
14.5
13.7
3.2
2.8
22.0
20.6
2.1
1.9
Navkar Corporation
Buy
188
265
2,675
365
436
38.3
37.5
5.6
5.9
33.3
31.9
2.1
2.0
6.3
6.1
8.1
7.0
Source: Company, Angel Research; Note: *December year end; #September year end; &October year end; Price as on February 05, 2016
Market Outlook
February 08, 2016
Research Team Tel: 022 - 39357800
DISCLAIMER
Angel Broking Private Limited (hereinafter referred to as “Angel”) is a registered Member of National Stock Exchange of India Limited,
Bombay Stock Exchange Limited and Metropolitian Stock Exchange of India Limited. It is also registered as a Depository Participant with
CDSL and Portfolio Manager with SEBI. It also has registration with AMFI as a Mutual Fund Distributor. Angel Broking Private Limited is a
registered entity with SEBI for Research Analyst in terms of SEBI (Research Analyst) Regulations, 2014 vide registration number
INH000000164. Angel or its associates has not been debarred/ suspended by SEBI or any other regulatory authority for accessing
/dealing in securities Market. Angel or its associates including its relatives/analyst do not hold any financial interest/beneficial ownership
of more than 1% in the company covered by Analyst. Angel or its associates/analyst has not received any compensation / managed or co
-managed public offering of securities of the company covered by Analyst during the past twelve months. Angel/analyst has not served as
an officer, director or employee of company covered by Analyst and has not been engaged in market making activity of the company
covered by Analyst.
This document is solely for the personal information of the recipient, and must not be singularly used as the basis of any investment
decision. Nothing in this document should be construed as investment or financial advice. Each recipient of this document should make
such investigations as they deem necessary to arrive at an independent evaluation of an investment in the securities of the companies
referred to in this document (including the merits and risks involved), and should consult their own advisors to determine the merits and
risks of such an investment.
Reports based on technical and derivative analysis center on studying charts of a stock's price movement, outstanding positions and
trading volume, as opposed to focusing on a company's fundamentals and, as such, may not match with a report on a company's
fundamentals.
The information in this document has been printed on the basis of publicly available information, internal data and other reliable sources
believed to be true, but we do not represent that it is accurate or complete and it should not be relied on as such, as this document is for
general guidance only. Angel Broking Pvt. Limited or any of its affiliates/ group companies shall not be in any way responsible for any
loss or damage that may arise to any person from any inadvertent error in the information contained in this report. Angel Broking Pvt.
Limited has not independently verified all the information contained within this document. Accordingly, we cannot testify, nor make any
representation or warranty, express or implied, to the accuracy, contents or data contained within this document. While Angel Broking
Pvt. Limited endeavors to update on a reasonable basis the information discussed in this material, there may be regulatory, compliance,
or other reasons that prevent us from doing so.
This document is being supplied to you solely for your information, and its contents, information or data may not be reproduced,
redistributed or passed on, directly or indirectly.
Neither Angel Broking Pvt. Limited, nor its directors, employees or affiliates shall be liable for any loss or damage that may arise from or
in connection with the use of this information.
Note: Please refer to the important ‘Stock Holding Disclosure' report on the Angel website (Research Section). Also, please refer to the
latest update on respective stocks for the disclosure status in respect of those stocks. Angel Broking Pvt. Limited and its affiliates may have
investment positions in the stocks recommended in this report.