Market Outlook
August 7, 2015
Dealer’s Diary
Domestic Indices
Chg (%)
(Pts)
(Close)
BSE Sensex
0.3
75
28,298
Indian markets are expected to open negative tracking SGX Nifty.
Nifty
0.2
21
8,589
Wall Street traded lower, weighed by biotech shares and second day of sharp
MID CAP
0.4
41
11,586
declines in Media companies after Viacom's revenue miss was linked to viewers
SMALL CAP
(0.1)
(14)
12,122
increasingly shifting from cable television to online streaming.
BSE HC
1.1
199
17,579
BSE PSU
(0.0)
(2)
7,830
U.K. stocks were little changed, paring an earlier retreat after fewer Bank of England
policy makers than expected voted to increase interest rates this month. FTSE 100
BANKEX
0.6
120
21,864
Index lost 0.1% at the close in London, after earlier falling as much as 0.5%.
AUTO
0.6
111
19,752
Declines in miners and oil companies weighed on the benchmark. BHP Billiton Ltd.
METAL
(0.6)
(49)
8,754
and Glencore Plc fell at least 2%.
OIL & GAS
(0.3)
(25)
9,774
BSE IT
0.3
30
11,173
After a sluggish day, markets geared up to rally at the end. However, this rally of
Global Indices
Chg (%)
(Pts)
(Close)
Nifty to scale above 8,600 was not successful as index heavyweights ITC, CIL,
Dow Jones
(0.7)
(121)
17,420
Vedanta, Reliance and Tech Mahindra pulled Nifty down.
NASDAQ
(1.6)
(84)
5,056
News & Result Analysis
FTSE
(0.1)
(5)
6,747
Dr Reddy’s in pact with Amgen
Nikkei
0.2
50
20,664
Result Review: Bajaj Electricals, Banco Products
Hang Sang
(0.6)
(139)
24,375
Refer detailed news & result analysis on the following page
Straits Times
0.2
5
3,196
Markets Today
Shanghai Com
(0.9)
(33)
3,662
The trend deciding level for the day is 28,274 / 8,582 levels. If NIFTY trades above
this level during the first half-an-hour of trade then we may witness a further rally up
Indian ADR
Chg (%)
(Pts)
(Close)
to 28,384 - 28,470 / 8,613 - 8,637 levels. However, if NIFTY trades below
INFY
(0.5)
(0.1)
$17.3
28,274 / 8,582 levels for the first half-an-hour of trade then it may correct towards
WIT
(1.0)
(0.1)
$12.5
28,188 - 28,078 / 8,558 - 8,527 levels.
IBN
(0.9)
(0.1)
$10.2
Indices
S2
S1
PIVOT
R1
R2
HDB
(0.7)
(0.5)
$62.6
SENSEX
28,078
28,188
28,274
28,384
28,470
NIFTY
8,527
8,558
8,582
8,613
8,637
Advances / Declines
BSE
NSE
Advances
1,386
664
Net Inflows (August 5, 2015)
Declines
1,558
856
` cr
Purch
Sales
Net
MTD
YTD
Unchanged
104
63
FII
4,708
3,981
727
1,492
142,462
MFs
887
1,215
(328)
(409)
57,539
Volumes (` cr)
BSE
3,432
FII Derivatives (August 6, 2015)
NSE
18,151
` cr
Purch
Sales
Net
Open Interest
Index Futures
851
585
266
15,639
Stock Futures
2,493
2,543
(50)
50,901
Gainers / Losers
Gainer
Loser
Company
Price (`)
chg (%)
Company
Price (`)
chg (%)
JPPOWER
8
19.6
NESTLEIND
6,488
(5.0)
ALOKTEXT
8
12.9
BATAIND
1,170
(5.0)
CUMMINSIND
1,159
12.8
MOTHERSUMI
372
(4.8)
BFUTILIFE
613
9.6
INDIACEM
88
(4.4)
LAXMIMACH
4,056
7.3
KAILASH
5
(4.3)
Market Outlook
August 7, 2015
Dr Reddy’s in pact with Amgen
Dr Reddy's has entered into a strategic collaboration with Amgen, the
biotechnology company, to market and distribute three Amgen medicines in India
in the area of oncology and cardiology. Under the terms of collaboration, the drug
major will perform a full range of regulatory and commercial services to seek
approval and launch Kyprolis (carfilzomib), Blincyto (blinatumomab) and Repatha
(evolocumab) in India. Kyprolis was approved by the US Food and Drug
Administration in July
2015, in combination with lenalidomide and
dexamethasone, for the treatment of patients with relapsed multiple myelomas
who have received one to three prior lines of therapy. Blincyto is an example of
immunotherapy, a treatment that uses certain parts of a person's immune system
to fight diseases such as cancer. Repatha got approval from European
Commission for marketing in July, which is used for the treatment of patients with
uncontrolled cholesterol. The alliance will enhance its biotechnology product
portfolio. On number terms it will not be that significant to the overall sales of the
company. We maintain our neutral on the stock.
Result Review
Bajaj Electricals (CMP-`274/ TP-`343 / Upside-25.1%)
For 1QFY216, Bajaj Electricals reported good set of numbers. The top-line
witnessed a 13.7% yoy increase to `1,009cr which is broadly in-line with our
estimate of `1,045cr. The top-line growth was on account of 20.3% yoy growth in
the Lighting segment (`203cr) and 54.1% yoy growth in the E&P segment (`330cr).
The Consumer Durables segment witnessed marginal de-growth of 5.7% on yoy
basis, reporting top-line of `476cr.
The EBITDA grew by 63.5% yoy to `60cr and EBITDA margin expanded by 182bp
yoy to 6.0% against our estimated EBITDA and EBITDA margin of `60cr and 6.0%
respectively. The improvement in margins was mainly on account of lower other
expenses which declined by 222bp yoy to 12.3% of sales. As far as segmental
margins are concerned, the Lighting and E&P segment margins grew by 269bp
yoy and 862bp yoy to 4.2% and 5.8% respectively while the Consumer Durables
margins were stable on yoy basis.
Owing to better operating performance and 124.6% yoy increase in other income
to `5cr, the net profit increased by 261.3% yoy to `20cr vis-à-vis our expectation
of `23cr.
At current market price, the stock is trading at EV/Sales multiple of 0.6x for
FY2017E. We maintain our Buy rating on the stock with a target price of `343
based on target EV/ Sales multiple of 0.7x for FY2017E.
Y/E
Sales OPM PAT EPS
ROE
P/E
P/BV EV/Sales EV/EBITDA
Mar
(` cr)
(%)
(` cr)
(`)
(%)
(x)
(x)
(x)
(x)
FY2016E
4,751
5.2
88
8.7
11.6
31.4
3.6
12.3
0.6
FY2017E
5,316
5.8
130
12.9
15.0
21.2
3.2
9.8
0.6
Banco Products (CMP: `128/ TP: -/ Upside: -)
For 1QFY2016, Banco Products reported a mixed set of numbers. Consolidated
top-line during the quarter witnessed a 1.3% yoy decline to `319cr. This is slightly
Market Outlook
August 7, 2015
lower than our estimate of `326cr. The raw material cost as a percentage of sales
declined by 135bp yoy to 52.5%. Employee cost as a percentage of sales declined
by 73bp to 11.9% while other expenses increased by 55bp yoy to 21.6% of sales.
This resulted in EBITDA margins expanding by 154bp yoy to 14.0% against our
estimate of
12.3%. The company has witnessed significant improvement in
performance on yoy basis where EBITDA margin stood at 0.9%. Interest expense
has come down to `1cr from `3cr in 1QFY2015. On the back of improvement in
operating performance, the net profit during the quarter improved to `28cr
representing a yoy growth of 15.3% vis-à-vis our estimate of `25cr.
On standalone basis, top line remained unchanged on yoy basis coming in
at `113cr. Exports being hurt on the back of weakness in Euro against the INR can
be attributed to flat top-line. Raw material cost, employee and other expenses all
increased by 20bp each on yoy basis resulting in EBITDA margin declining by
60bp yoy to 18.2%. Other income during the quarter increased by 755.7% yoy
to `14.3cr while interest expense decline to `0.5cr from `2cr in 1QFY2015.
Consequently, the net profit grew by 62.5% yoy to `24cr.
At the current market price, the stock is trading at PE of 8.9x its FY2017E earnings.
The consolidated performance has been impacted in the past few quarters owing
to depreciating Euro against the INR along with slowdown in the European
markets. While we await for the performance to stabilize and gain clarity on the
company, we maintain our Neutral rating on the stock.
Y/E
Sales OPM
PAT
EPS ROE P/E P/BV EV/EBITDA EV/Sales
March
(` cr)
(%)
(` cr)
(`)
(%)
(x)
(x)
(x)
(x)
FY2016E
1,189
10.9
77
10.8 11.9 11.9
1.4
6.6
0.7
FY2017E
1,332
12.3
104
14.5
14.5
8.9
1.2
5.1
0.6
Quarterly Bloomberg Brokers Consensus Estimate
Tata Motors Ltd (Consol)- August 07, 2015
Particulars (` cr)
1QFY16E
1QFY15
y-o-y (%)
4QFY15
q-o-q (%)
Net sales
64,070
64,151
(0.1)
67,298
(4.8)
EBITDA
9,280
11,142
(16.7)
8,438
10.0
EBITDA margin (%)
14.5
17.4
12.5
Net profit
3,136
5,413
(42.1)
1,717
82.7
Mahindra & Mahindra Ltd- August 07, 2015
Particulars (` cr)
1QFY16E
1QFY15
y-o-y (%)
4QFY15
q-o-q (%)
Net sales
9,812
10,096
(2.8)
9,412
4.3
EBITDA
1,135
1,269
(10.6)
901
26.1
EBITDA margin (%)
11.6
12.6
9.6
Net profit
742
882
(15.9)
551
34.7
Bharat Heavy Electricals Ltd- August 07, 2015
Particulars (` cr)
1QFY16E
1QFY15
y-o-y (%)
4QFY15
q-o-q (%)
Net sales
5,281
5,068
4.2
12,368
(57.3)
EBITDA
284
218
30.1
1,682
(83.1)
EBITDA margin (%)
5.4
4.3
13.6
Net profit
206
194
6.4
888
(76.8)
Market Outlook
August 7, 2015
Rural Electrification Corp Ltd- August 07, 2015
Particulars (` cr)
1QFY16E
1QFY15
y-o-y (%)
4QFY15
q-o-q (%)
Net sales
2,271
4,667
(51.3)
5,333
(57.4)
EBITDA
3,632
4,489
(19.1)
4,716
(23.0)
EBITDA margin (%)
159.9
96.2
88.4
Net profit
1,375
1,283
7.2
1,097
25.4
Divi's Laboratories Ltd- August 08, 2015
Particulars (` cr)
1QFY16E
1QFY15
y-o-y (%)
4QFY15
q-o-q (%)
Net sales
755
640
18.0
815
(7.3)
EBITDA
292
235
24.0
315
(7.5)
EBITDA margin (%)
38.6
36.8
38.7
Net profit
210
168
24.8
229
(8.5)
Economic and Political News
PM directs speeding up of rural electrification
Centre plans to end upstream under-recoveries for kerosene from FY17
Rajasthan signs pact for `2,452cr investments
Corporate News
Airtel launches 4G services nationally ahead of Jio
JLR making strategic adjustments to arrest falling China sales
Mumbai Metro: R-Infra, govt set for a showdown
Srei Infra plans to scale up acquisition of stressed infra projects
Top Picks
Large Cap
Market Cap
CMP
Target
Upside
Company
Sector
Rating
(` Cr)
(`)
(`)
(%)
Axis Bank
Financials
138,709
Buy
584
716
22.6
ICICI Bank
Financials
180,703
Buy
311
370
18.9
Infosys
IT
250,241
Buy
1,089
1,306
19.9
Inox Wind
Cap Goods
9,183
Buy
414
505
22.0
Power Grid
Power
73,608
Buy
141
170
20.8
TCS
IT
504,235
Buy
2,574
3,168
23.1
Tech Mahindra
IT
51,351
Buy
534
646
21.0
Yes Bank
Financials
34,603
Buy
828
989
19.5
LIC Housing Fin. Financials
26,424
Accumulate
524
590
12.7
Sun Pharma
Pharma
203,699
Accumulate
847
950
12.2
Source: Angel Research, Bloomberg
Market Outlook
August 7, 2015
Mid Cap
Market Cap
CMP
Target
Upside
Company
Sector
Rating
(` Cr)
(`)
(`)
(%)
Bajaj Electricals
Others
2,759
Buy
274
341
24.6
Garware Wall Rope
Others
652
Buy
298
390
31.0
Hindustan Media Ven.
Media
1,795
Buy
245
292
19.4
JK Tyre
Auto Ancillary
2,651
Buy
117
147
25.6
MBL Infrastructures
Construction
1,112
Buy
268
395
47.0
Mangalam Cements
Cement
664
Buy
249
349
40.4
MT Educare
Others
472
Buy
119
141
18.9
Minda Industries
Auto Ancillary
933
Accumulate
588
652
10.8
Radico Khaitan
Others
1,298
Buy
98
112
14.8
Setco Automotive
Auto Ancillary
681
Accumulate
255
286
12.3
Source: Angel Research, Bloomberg
Market Outlook
August 07, 2015
Result Calendar
Date
Company
Tata Motors, M&M, BHEL, Mangalam Cement, Rural Elec.Corp., Corporation Bank, GSPL, Kirloskar Engines India Ltd,
August 7, 2015
MT Educare
August 8, 2015
Central Bank, UCO Bank, Divi's Lab.
August 9, 2015
August 10, 2015
LMW, J & K Bank, Finolex Cables, Power Grid Corpn, Adani Power, HDIL, Radico Khaitan
Bosch India, Apollo Tyres, J K Lakshmi Cements, St Bk of India, NMDC, Tata Steel, Prakash Industries, HPCL, Siyaram
August 11, 2015
Silk Mills, Sun Pharma, Reliance Power
Ashok Leyland, India Cements, IDBI Bank, Coal India, Jindal Steel, Nalco, Bhushan Steel, TVS Srichakra, Cadila
August 12, 2015
Healthcare, Aurobindo Pharma, Anant Raj
August 13, 2015
IOC, Page Industries, Surya Roshni, Tata Power Co., Unitech
August 14, 2015
Amara Raja Batteries, SAIL, Hindalco, BPCL, Elecon Engineering, GIPCL
Source: Bloomberg, Angel Research
Global economic events release calendar
Date
Time
Country Event Description
Unit
Period
Bloomberg Data
Last Reported Estimated
August 7, 2015
6:00PM US
Change in Nonfarm payrolls
Thousands
Jul
223.00
225.00
6:00PM US
Unnemployment rate
%
Jul
5.30
5.30
August 8, 2015
China
Exports YoY%
% Change
Jul
2.80
(1.50)
August 9, 2015
7:00AM China Consumer Price Index (YoY)
% Change
Jul
1.40
1.50
August 10, 2015
India
Imports YoY%
% Change
Jul
(13.40)
--
India
Exports YoY%
% Change
Jul
(15.80)
--
August 12, 2015
2:00PM UK
Jobless claims change
% Change
Jul
7.00
2.50
11:00AM China Industrial Production (YoY)
% Change
Jul
6.80
6.60
5:30PM India
Industrial Production YoY
% Change
Jun
2.70
--
August 14, 2015
2:30PM Euro Zone Euro-Zone CPI (YoY)
%
Jul F
0.20
0.20
6:45PM US
Industrial Production
%
Jul
0.23
0.30
12:00PM India
Monthly Wholesale Prices YoY%
% Change
Jul
(2.40)
--
2:30PM Euro Zone Euro-Zone GDP s.a. (QoQ)
% Change
2Q A
0.40
0.40
11:30AM Germany GDP nsa (YoY)
% Change
2Q P
1.10
1.60
August 18, 2015
6:00PM US
Building permits
Thousands
Jul
1,337.00
--
6:00PM US
Housing Starts
Thousands
Jul
1,174.00
--
2:00PM UK
CPI (YoY)
% Change
Jul
--
--
August 19, 2015
6:00PM US
Consumer price index (mom)
% Change
Jul
0.30
--
August 20, 2015
7:30PM US
Existing home sales
Million
Jul
5.49
--
Source: Bloomberg, Angel Research
Market Outlook
August 07, 2015
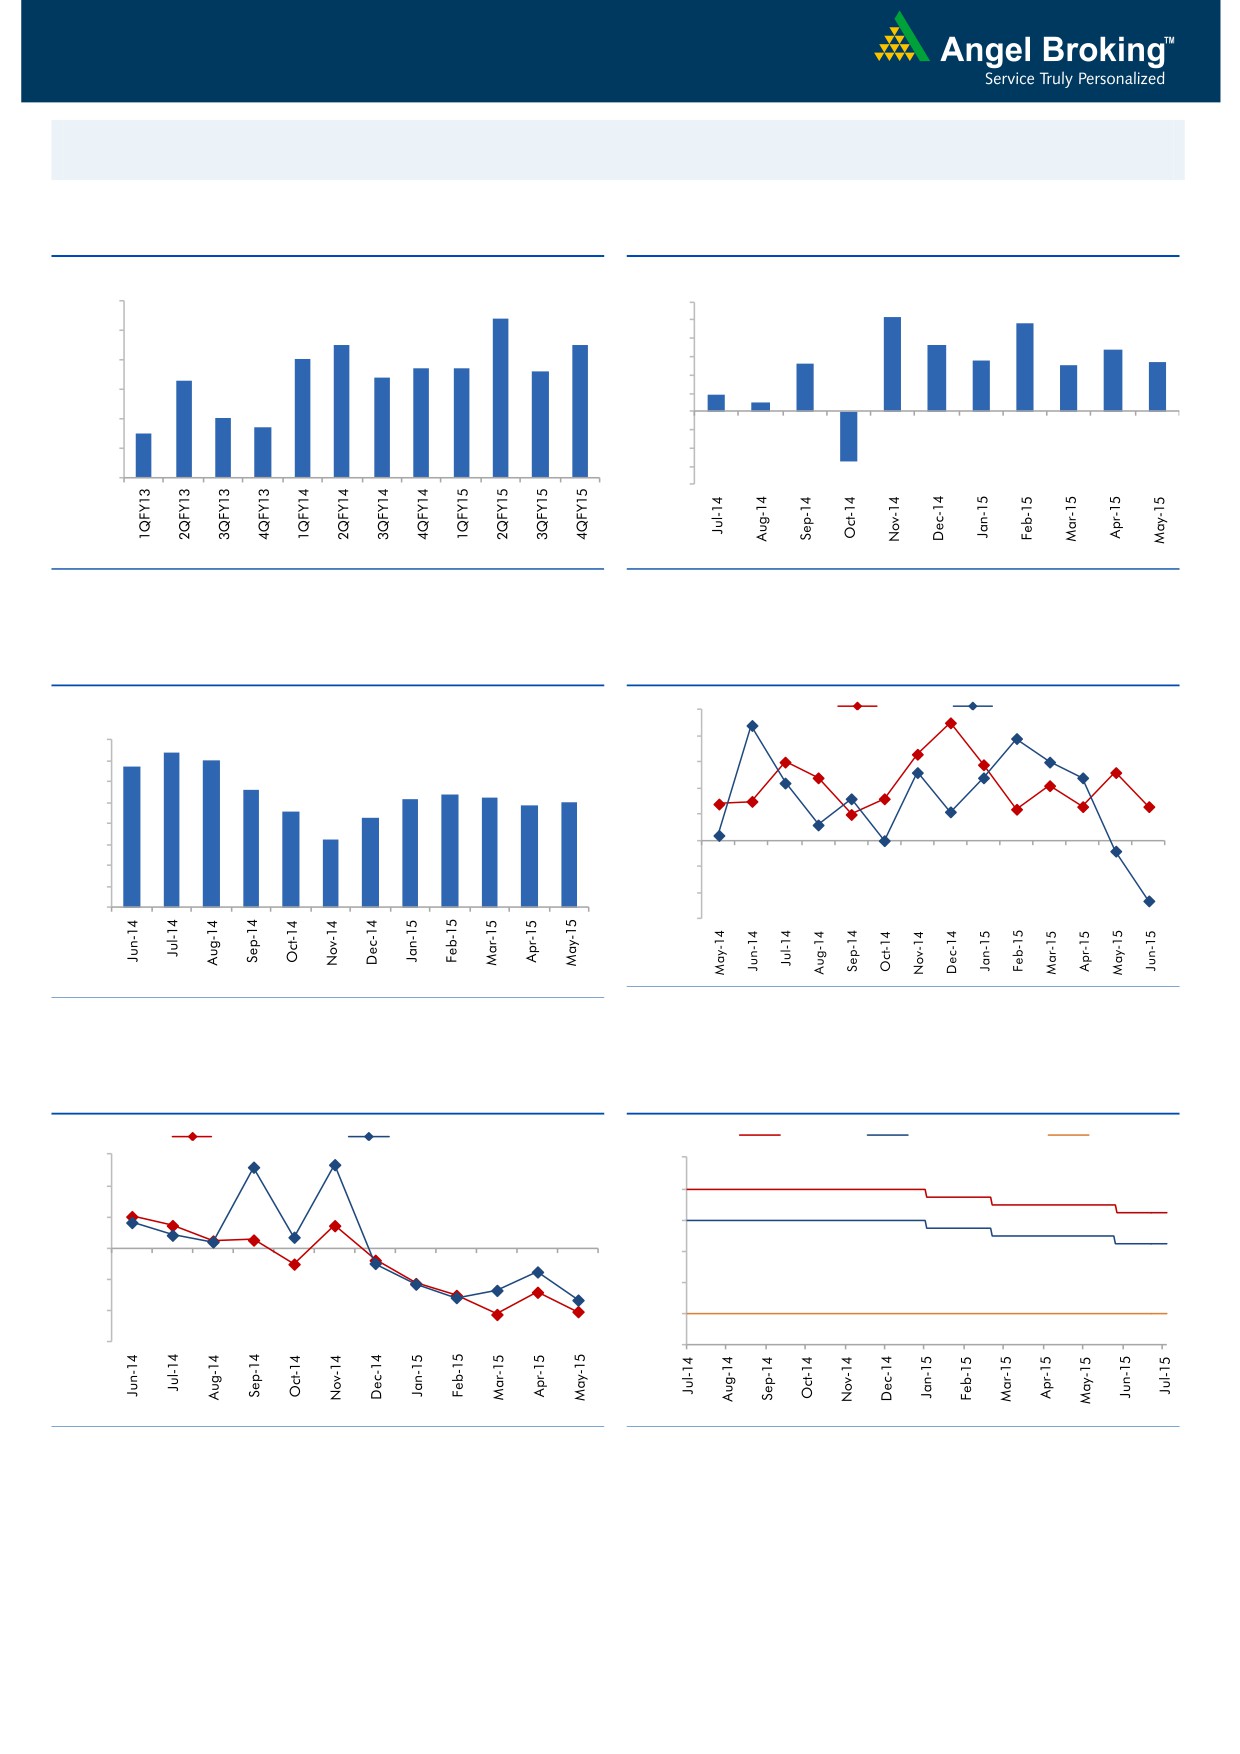
Macro watch
Exhibit 1: Quarterly GDP trends
Exhibit 2: IIP trends
(%)
(%)
9.0
8.4
6.0
5.2
4.8
5.0
8.0
7.5
7.5
3.6
3.4
7.0
4.0
2.8
2.7
6.7
6.7
2.6
2.5
6.6
3.0
7.0
6.3
6.4
2.0
0.9
6.0
0.5
1.0
5.0
4.7
-
5.0
4.5
(1.0)
4.0
(2.0)
(3.0)
3.0
(2.7)
(4.0)
Source: CSO, Angel Research
Source: MOSPI, Angel Research
Exhibit 3: Monthly CPI inflation trends
Exhibit 4: Manufacturing and services PMI
(%)
55.0
Mfg. PMI
Services PMI
8.0
7.4
54.0
6.8
7.0
7.0
53.0
5.6
5.4
6.0
5.2
5.3
4.9
5.0
52.0
4.6
5.0
4.3
51.0
4.0
3.3
50.0
3.0
2.0
49.0
1.0
48.0
-
47.0
Source: Market, Angel Research; Note: Level above 50 indicates expansion
Source: MOSPI, Angel Research
Exhibit 5: Exports and imports growth trends
Exhibit 6: Key policy rates
(%)
Exports yoy growth
Imports yoy growth
(%)
Repo rate
Reverse Repo rate
CRR
30.0
9.00
20.0
8.00
10.0
7.00
0.0
6.00
(10.0)
5.00
(20.0)
4.00
(30.0)
3.00
Source: Bloomberg, Angel Research
Source: RBI, Angel Research
Market Outlook
August 07, 2015
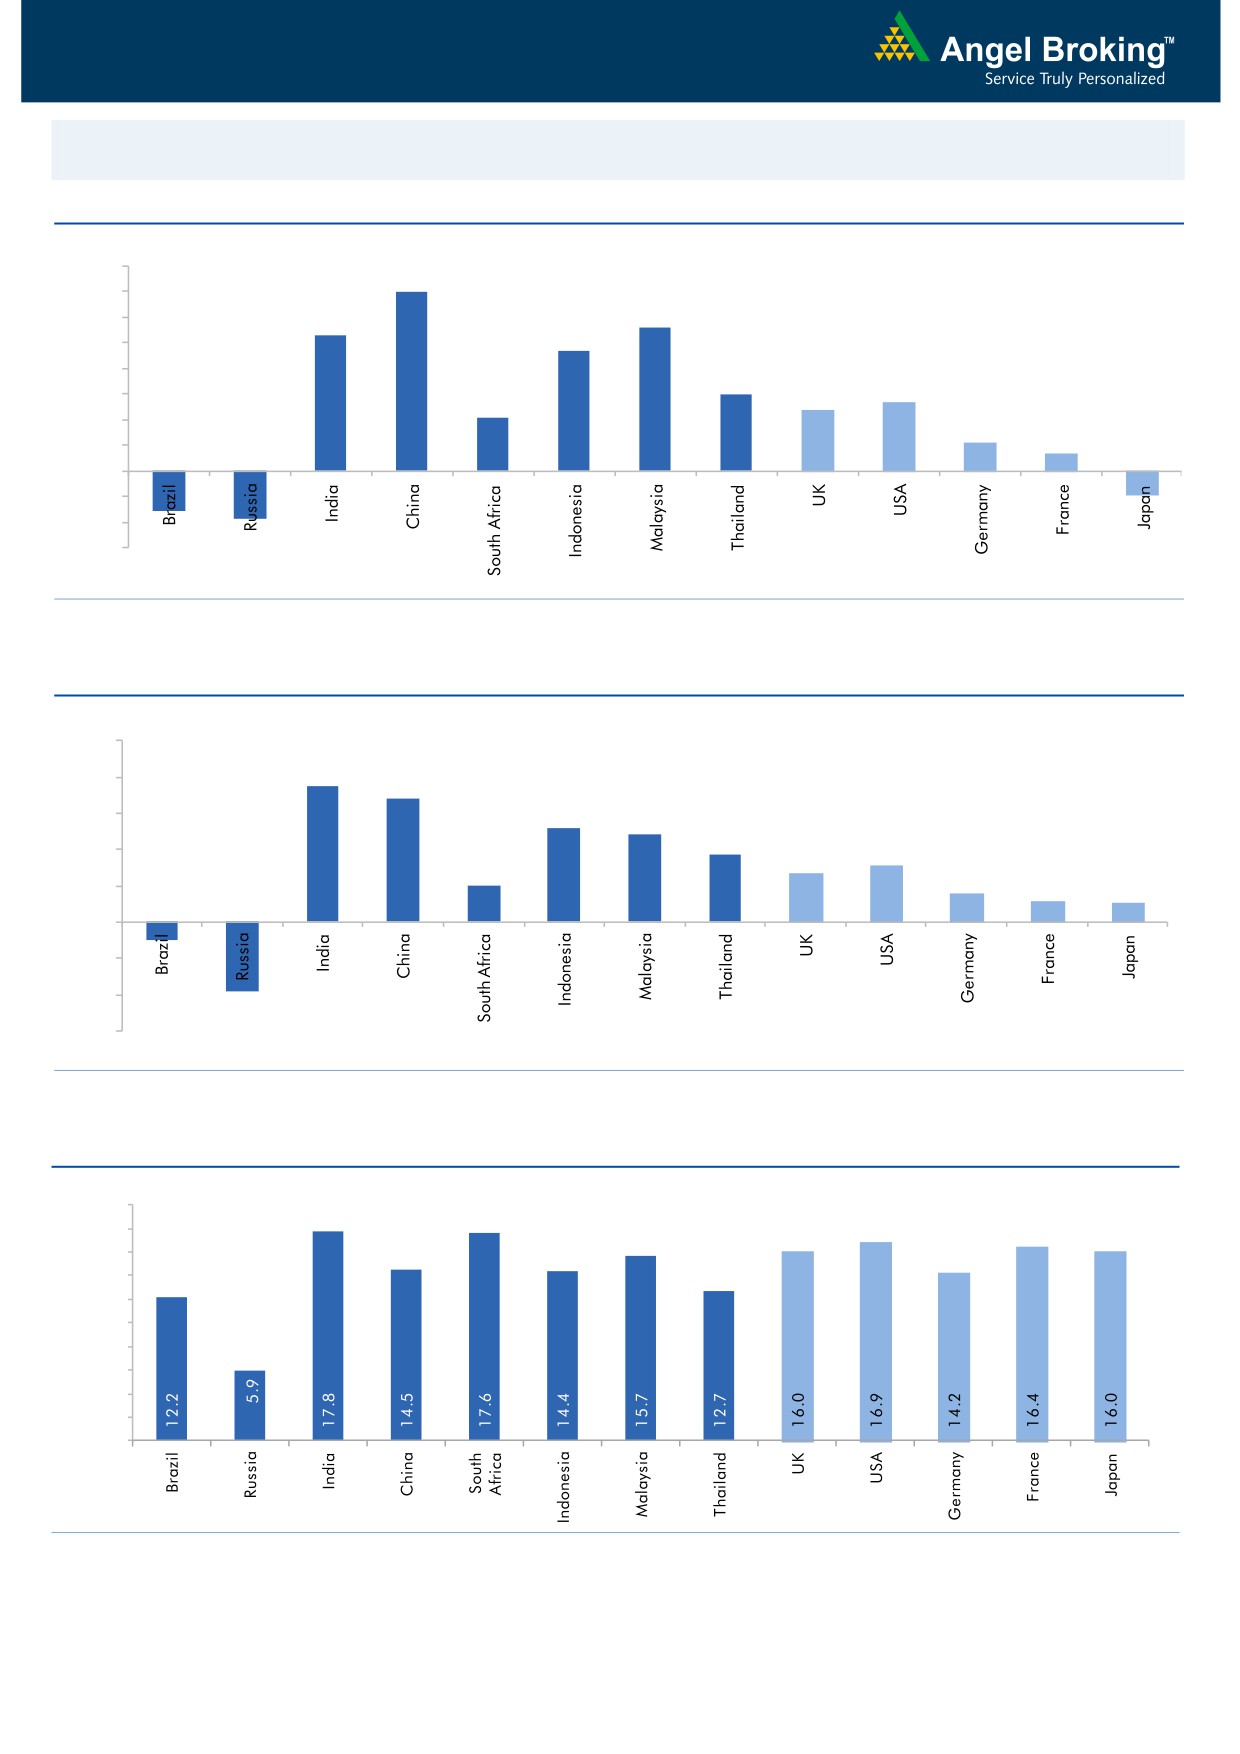
Global watch
Exhibit 1: Latest quarterly GDP Growth (%, yoy) across select developing and developed countries
(%)
8.0
7.0
7.0
5.6
6.0
5.3
4.7
5.0
4.0
3.0
2.7
3.0
2.4
2.1
2.0
1.1
0.7
1.0
(1.6)
(1.9)
(0.9)
-
(1.0)
(2.0)
(3.0)
Source: Bloomberg, Angel Research
Exhibit 2: 2015 GDP Growth projection by IMF (%, yoy) across select developing and developed countries
(%)
10.0
7.5
8.0
6.8
6.0
5.2
4.8
3.7
4.0
3.1
2.7
2.0
1.6
2.0
1.2
1.0
(1.0)
(3.8)
-
(2.0)
(4.0)
(6.0)
Source: IMF, Angel Research
Exhibit 3: One year forward P-E ratio across select developing and developed countries
(x)
20.0
18.0
16.0
14.0
12.0
10.0
8.0
6.0
4.0
2.0
-
Source: Bloomberg, Angel Research
Market Outlook
August 07, 2015
Exhibit 4: Relative performance of indices across globe
Returns (%)
Country
Name of index
Closing price
1M
3M
1YR
Brazil
Bovespa
50,011
(4.1)
(12.4)
(11.7)
Russia
Micex
1,676
3.8
(2.3)
23.4
India
Nifty
8,589
0.9
4.8
10.8
China
Shanghai Composite
3,662
6.1
(11.5)
70.6
South Africa
Top 40
46,931
5.8
(0.6)
2.2
Mexico
Mexbol
44,921
(0.2)
(0.5)
1.1
Indonesia
LQ45
819
(4.0)
(6.2)
(7.2)
Malaysia
KLCI
1,695
(1.9)
(7.0)
(10.4)
Thailand
SET 50
938
(3.2)
(6.8)
(9.4)
USA
Dow Jones
17,420
(2.0)
(2.4)
6.4
UK
FTSE
6,747
4.9
(2.0)
2.7
Japan
Nikkei
20,664
1.2
6.4
31.8
Germany
DAX
11,585
8.5
1.6
26.9
France
CAC
5,192
12.8
2.0
24.7
Source: Bloomberg, Angel Research
Market Outlook
August 07, 2015
Stock Watch
Company Name
Reco
CMP
Target
Mkt Cap
Sales ( Čcr )
OPM(%)
EPS (Č)
PER(x)
P/BV(x)
RoE(%)
EV/Sales(x)
(Č)
Price ( Č)
( Č cr )
FY16E FY17E
FY16E
FY17E
FY16E
FY17E
FY16E
FY17E
FY16E
FY17E
FY16E
FY17E
FY16E
FY17E
Agri / Agri Chemical
Rallis
Neutral
227
-
4,406
2,075
2,394
14.4
14.4
9.5
11.0
23.9
20.6
4.7
4.1
21.1
21.3
2.2
1.9
United Phosphorus
Neutral
552
-
23,638
13,698
15,752
17.6
17.6
32.1
38.5
17.2
14.3
3.4
2.8
21.4
21.3
1.8
1.5
Auto & Auto Ancillary
Ashok Leyland
Neutral
87
-
24,802
17,394
20,318
9.6
10.7
2.8
4.4
31.1
19.8
4.4
4.1
14.3
20.4
1.4
1.2
Bajaj Auto
Neutral
2,575
-
74,525
23,842
27,264
19.8
19.6
128.4
144.4
20.1
17.8
6.1
5.3
30.5
29.5
2.7
2.3
Eicher Motors
Accumulate
20,572
21,843
55,838
11,681
15,550
15.3
16.9
358.5
564.3
57.4
36.5
17.2
12.8
29.8
34.9
4.7
3.5
Hero Motocorp
Neutral
2,653
-
52,970
28,500
33,028
13.8
14.1
144.2
166.3
18.4
16.0
6.8
5.7
36.7
36.0
1.7
1.4
L G Balakrishnan & Bros Neutral
485
-
761
1,254
1,394
11.6
11.8
35.9
41.7
13.5
11.6
1.8
1.6
13.5
13.8
0.7
0.6
Mahindra and Mahindra Neutral
1,394
-
86,596
41,078
46,473
11.5
12.0
51.4
62.7
27.1
22.2
4.0
3.5
14.7
15.9
1.8
1.6
Maruti
Accumulate
4,452
4,735
134,486
58,102
68,587
16.7
16.9
182.0
225.5
24.5
19.7
4.9
4.2
19.9
21.0
2.1
1.7
Minda Industries
Accumulate
588
652
933
2,500
2,889
7.6
8.3
39.4
54.3
14.9
10.8
2.1
1.8
14.1
16.3
0.5
0.4
Rane Brake Lining
Accumulate
328
366
260
454
511
11.1
11.4
23.8
28.1
13.8
11.7
2.0
1.8
14.2
15.3
0.7
0.6
Setco Automotive
Accumulate
255
286
681
718
862
13.3
14.3
13.4
19.0
19.0
13.4
2.9
2.5
15.4
18.5
1.2
1.1
Tata Motors
Accumulate
383
425
110,551
258,457
276,275
13.3
13.7
29.3
35.2
13.1
10.9
1.4
1.3
11.4
12.2
0.6
0.6
TVS Motor
Accumulate
237
255
11,252
11,839
13,985
7.0
8.0
10.8
15.9
21.9
14.9
5.6
4.4
25.5
29.7
0.9
0.7
Amara Raja Batteries
Neutral
946
-
16,161
5,355
6,641
17.4
17.8
31.8
40.9
29.8
23.1
7.5
5.9
25.2
25.5
3.0
2.4
Exide Industries
Neutral
156
-
13,277
7,363
8,247
13.7
14.5
6.6
7.7
23.7
20.3
3.0
2.7
12.6
13.3
1.5
1.4
Apollo Tyres
Neutral
212
-
10,809
12,866
13,892
15.7
15.4
20.1
19.9
10.6
10.7
1.7
1.5
15.8
13.6
0.9
0.9
Ceat
Accumulate
972
1,059
3,932
6,041
6,770
14.3
13.9
101.5
117.7
9.6
8.3
1.9
1.6
20.0
19.2
0.8
0.7
JK Tyres
Buy
117
147
2,651
7,446
7,942
15.2
14.7
19.6
21.0
6.0
5.6
1.5
1.2
25.2
21.7
0.8
0.7
Swaraj Engines
Neutral
988
-
1,227
593
677
14.5
14.8
51.2
60.8
19.3
16.3
4.5
4.0
23.3
24.8
1.9
1.6
Subros
Neutral
94
-
565
1,268
1,488
11.6
11.9
3.7
6.6
25.5
14.3
1.7
1.6
6.8
11.4
0.8
0.6
Indag Rubber
Buy
209
247
550
283
329
17.0
17.2
13.0
15.4
16.2
13.6
3.5
2.9
21.8
21.6
1.7
1.4
Capital Goods
ACE
Neutral
52
-
516
660
839
4.7
8.2
1.0
3.9
52.2
13.4
1.6
1.5
3.2
11.3
0.9
0.7
BEML
Accumulate
1,519
1,607
6,325
3,277
4,006
6.0
8.9
29.2
64.3
52.0
23.6
2.9
2.6
5.7
11.7
2.0
1.6
BGR Energy
Neutral
137
-
985
3,615
3,181
9.5
9.4
16.7
12.4
8.2
11.0
0.8
0.8
10.0
7.0
0.7
0.9
BHEL
Neutral
282
-
69,071
33,722
35,272
10.8
11.7
10.5
14.2
26.9
19.9
2.0
1.9
7.0
9.0
2.1
2.0
Blue Star
Neutral
369
-
3,317
3,649
4,209
5.0
5.9
9.2
14.7
40.3
25.0
7.3
6.9
9.1
17.5
1.0
0.9
Crompton Greaves
Accumulate
186
204
11,645
13,484
14,687
4.9
6.2
4.5
7.1
41.3
26.2
2.9
2.7
7.2
10.8
1.0
0.9
Inox Wind
Buy
414
505
9,183
4,980
5,943
17.0
17.5
26.6
31.6
15.6
13.1
4.7
3.4
35.0
30.0
2.0
1.6
Market Outlook
August 07, 2015
Stock Watch
Company Name
Reco
CMP
Target
Mkt Cap
Sales ( Čcr )
OPM(%)
EPS (Č)
PER(x)
P/BV(x)
RoE(%)
EV/Sales(x)
(Č)
Price ( Č)
( Č cr )
FY16E
FY17E
FY16E
FY17E
FY16E
FY17E
FY16E
FY17E
FY16E
FY17E
FY16E
FY17E
FY16E
FY17E
Capital Goods
KEC International
Neutral
147
-
3,773
8,791
9,716
6.1
6.8
5.4
8.2
27.2
17.9
2.7
2.5
10.0
14.0
0.6
0.6
Thermax
Neutral
1,051
-
12,525
6,413
7,525
7.4
8.5
30.5
39.3
34.5
26.8
5.3
4.6
15.0
17.0
1.9
1.6
Cement
ACC
Accumulate
1,400
1,548
26,290
11,856
14,092
14.5
17.8
47.6
76.1
29.4
18.4
3.0
2.8
10.6
15.7
2.1
1.7
Ambuja Cements
Neutral
230
-
35,686
10,569
12,022
20.7
22.2
8.7
10.7
26.4
21.5
3.4
3.2
13.0
15.2
3.0
2.6
India Cements
Buy
88
132
2,711
4,716
5,133
14.9
15.8
1.0
4.5
88.3
19.6
0.9
0.9
1.0
4.5
0.9
0.8
JK Cement
Accumulate
671
767
4,688
4,056
4,748
14.5
17.0
22.6
41.1
29.7
16.3
2.7
2.4
9.3
15.3
1.6
1.3
J K Lakshmi Cement
Buy
373
443
4,387
3,004
3,618
17.6
19.9
13.9
27.2
26.8
13.7
3.0
2.6
11.8
20.5
1.9
1.5
Mangalam Cements
Buy
249
349
664
1,111
1,336
12.2
15.1
16.3
34.6
15.3
7.2
1.2
1.1
8.2
16.0
0.9
0.7
Orient Cement
Neutral
177
-
3,630
1,854
2,524
21.2
22.2
7.7
11.1
23.0
16.0
3.3
2.9
13.3
15.7
2.7
1.9
Ramco Cements
Neutral
364
-
8,671
4,036
4,545
20.8
21.3
15.1
18.8
24.1
19.4
3.0
2.6
12.9
14.3
2.7
2.3
Shree Cement^
Neutral
11,600
-
40,412
7,150
8,742
26.7
28.6
228.0
345.5
50.9
33.6
7.5
6.3
15.7
20.3
5.4
4.3
UltraTech Cement
Neutral
3,222
-
88,414
27,562
31,548
20.4
22.3
111.9
143.3
28.8
22.5
4.1
3.5
15.2
16.8
3.3
2.8
Construction
ITNL
Neutral
146
-
3,610
7,589
8,021
34.0
35.9
16.0
19.0
9.1
7.7
0.6
0.5
6.5
6.7
3.6
3.8
KNR Constructions
Neutral
562
-
1,601
915
1,479
14.3
13.9
20.3
37.2
27.7
15.1
2.5
2.2
9.6
15.6
1.9
1.2
Larsen & Toubro
Accumulate
1,827
2,013
170,038
68,920
82,446
10.9
11.5
57.0
73.0
32.1
25.0
2.9
2.7
13.6
15.5
2.7
2.2
Gujarat Pipavav Port
Neutral
216
-
10,423
793
694
53.0
50.9
9.0
8.0
24.0
27.0
5.2
4.2
25.9
18.4
12.8
14.5
MBL Infrastructures
Buy
268
395
1,112
2,507
2,986
12.4
14.4
21.5
20.5
12.5
13.1
1.5
1.4
12.6
12.7
1.2
1.1
PNC Infratech
Accumulate
462
445
2,372
1,719
2,003
13.0
13.5
21.0
28.0
22.0
16.5
1.9
1.7
11.0
10.9
1.5
1.3
Financials
Allahabad Bank
Neutral
95
-
5,408
8,859
9,817
3.0
3.0
23.7
30.1
4.0
3.1
0.5
0.4
10.6
12.3
-
-
Axis Bank
Buy
584
716
138,709
26,522
31,625
3.6
3.6
36.2
45.4
16.1
12.9
3.2
2.7
18.2
19.6
-
-
Bank of Baroda
Neutral
189
-
41,842
18,934
21,374
2.0
2.0
13.2
15.1
14.3
12.5
1.1
1.0
7.1
7.7
-
-
Bank of India
Neutral
174
-
11,583
17,402
20,003
2.0
2.1
40.3
50.7
4.3
3.4
0.4
0.4
9.0
10.4
-
-
Canara Bank
Neutral
312
-
16,056
15,805
17,745
2.0
2.2
64.3
73.5
4.9
4.2
0.6
0.5
10.8
11.3
-
-
Dena Bank
Neutral
45
-
2,539
3,580
4,040
2.1
2.2
8.4
10.9
5.4
4.2
0.5
0.4
6.8
8.4
-
-
Federal Bank
Neutral
68
-
11,618
3,522
4,045
3.2
3.2
12.2
14.1
5.6
4.8
0.7
0.6
12.9
13.4
-
-
HDFC
Neutral
1,304
-
205,631
11,198
13,321
3.5
3.5
45.1
53.7
28.9
24.3
6.0
5.4
27.2
28.2
-
-
HDFC Bank
Accumulate
1,096
1,255
275,482
38,629
47,500
4.5
4.7
52.6
66.4
20.8
16.5
3.8
3.2
19.6
21.2
-
-
ICICI Bank
Buy
311
370
180,703
36,037
41,647
3.5
3.6
22.9
26.7
13.6
11.7
2.3
2.0
15.7
15.9
-
-
IDBI Bank
Neutral
69
-
10,995
9,806
11,371
1.7
1.9
10.0
16.3
6.9
4.2
0.5
0.4
6.8
10.4
-
-
Market Outlook
August 07, 2015
Stock Watch
Company Name
Reco
CMP
Target
Mkt Cap
Sales ( Čcr )
OPM(%)
EPS (Č)
PER(x)
P/BV(x)
RoE(%)
EV/Sales(x)
(Č)
Price ( Č)
( Č cr )
FY16E FY17E
FY16E
FY17E
FY16E
FY17E
FY16E
FY17E
FY16E
FY17E
FY16E
FY17E
FY16E
FY17E
Financials
Indian Bank
Neutral
151
-
7,274
6,454
7,321
2.5
2.6
26.4
33.3
5.8
4.6
0.5
0.4
8.1
9.6
-
-
LIC Housing Finance
Accumulate
524
590
26,424
2,934
3,511
2.3
2.3
30.9
36.8
16.9
14.2
2.7
2.4
16.8
17.5
-
-
Oriental Bank
Neutral
184
-
5,505
7,930
8,852
2.5
2.5
51.8
57.1
3.5
3.2
0.4
0.4
9.3
9.5
-
-
Punjab Natl.Bank
Neutral
162
-
30,025
24,160
27,777
2.9
3.0
18.5
24.6
8.8
6.6
0.9
0.7
8.8
10.8
-
-
South Ind.Bank
Neutral
23
-
3,146
1,999
2,249
2.4
2.4
3.5
4.0
6.7
5.8
0.8
0.8
12.6
13.1
-
-
St Bk of India
Neutral
288
-
218,096
86,900
100,550
3.1
3.1
22.1
27.7
13.1
10.4
1.6
1.4
12.7
14.3
-
-
Union Bank
Neutral
213
-
13,529
12,995
14,782
2.4
2.4
32.3
40.9
6.6
5.2
0.8
0.7
10.7
12.3
-
-
Vijaya Bank
Neutral
41
-
3,497
3,474
3,932
1.8
1.9
5.9
7.2
6.9
5.7
0.6
0.5
8.1
9.3
-
-
Yes Bank
Buy
828
989
34,603
7,006
8,825
3.1
3.3
61.4
77.1
13.5
10.7
2.5
2.1
20.1
21.3
-
-
FMCG
Asian Paints
Neutral
914
-
87,714
16,553
19,160
16.0
16.2
17.7
21.5
51.7
42.5
13.7
12.4
29.4
31.2
5.1
4.4
Britannia
Neutral
3,142
-
37,698
8,065
9,395
9.6
10.2
47.2
65.5
66.6
48.0
22.1
20.9
38.3
41.2
4.5
3.9
Colgate
Neutral
2,030
-
27,609
4,836
5,490
19.5
19.7
48.5
53.2
41.9
38.2
30.7
26.7
99.8
97.5
5.6
4.9
Dabur India
Neutral
308
-
54,075
9,370
10,265
17.1
17.2
7.3
8.1
42.0
38.0
12.7
10.3
33.7
30.6
5.7
5.2
GlaxoSmith Con*
Neutral
6,326
-
26,604
4,919
5,742
17.2
17.4
168.3
191.2
37.6
33.1
10.7
9.1
28.8
28.9
5.0
4.2
Godrej Consumer
Neutral
1,378
-
46,927
10,168
12,886
16.1
16.1
32.1
38.4
42.9
35.9
8.7
8.1
19.7
21.0
4.7
3.7
HUL
Neutral
908
-
196,453
34,940
38,957
17.5
17.7
20.8
24.7
43.7
36.8
48.6
38.8
110.5
114.2
5.4
4.8
ITC
Buy
326
409
261,450
41,068
45,068
37.8
37.4
13.9
15.9
23.4
20.5
7.9
6.9
34.1
33.8
6.0
5.4
Marico
Neutral
440
-
28,400
6,551
7,766
15.7
16.0
10.4
12.5
42.4
35.2
12.3
10.2
33.2
32.4
4.3
3.6
Nestle*
Neutral
6,488
-
62,558
11,291
12,847
22.2
22.3
158.9
184.6
40.8
35.2
21.3
19.2
55.0
57.3
5.4
4.7
Tata Global
Accumulate
144
152
9,065
8,635
9,072
9.8
9.9
6.5
7.6
22.1
18.9
2.2
2.1
6.8
7.4
1.0
0.9
IT
HCL Tech^
Buy
946
1,100
133,013
41,535
46,519
24.0
23.4
56.6
61.1
16.7
15.5
3.5
2.7
20.8
17.7
3.1
2.6
Infosys
Buy
1,089
1,306
250,241
60,250
66,999
28.0
28.0
58.3
63.7
18.7
17.1
3.9
3.4
20.9
19.7
3.5
3.0
TCS
Buy
2,574
3,168
504,235
108,420
123,559
28.8
28.7
127.2
143.9
20.2
17.9
8.1
7.5
39.9
41.8
4.2
3.7
Tech Mahindra
Buy
534
646
51,351
25,566
28,890
16.0
17.0
26.3
31.9
20.3
16.7
3.7
3.1
17.9
18.6
1.8
1.5
Wipro
Buy
571
719
141,106
52,414
58,704
23.7
23.8
38.4
42.3
14.9
13.5
2.9
2.6
19.5
18.0
2.3
1.9
Media
D B Corp
Accumulate
327
356
6,002
2,241
2,495
27.8
27.9
21.8
25.6
15.0
12.8
3.9
3.5
26.7
28.5
2.6
2.3
HT Media
Neutral
87
-
2,034
2,495
2,603
11.2
11.2
7.3
8.6
12.0
10.2
1.0
0.9
7.4
8.1
0.3
0.3
Jagran Prakashan
Accumulate
138
156
4,520
1,939
2,122
26.0
26.0
8.3
9.2
16.7
15.0
2.9
2.6
17.5
17.1
2.3
2.1
Sun TV Network
Neutral
349
-
13,736
2,779
3,196
70.2
70.5
22.8
27.3
15.3
12.8
3.8
3.4
26.7
28.3
4.7
4.1
Market Outlook
August 07, 2015
Stock Watch
Company Name
Reco
CMP
Target
Mkt Cap
Sales ( Čcr )
OPM(%)
EPS (Č)
PER(x)
P/BV(x)
RoE(%)
EV/Sales(x)
(Č)
Price ( Č)
( Č cr )
FY16E FY17E
FY16E
FY17E
FY16E
FY17E
FY16E
FY17E
FY16E
FY17E
FY16E
FY17E
FY16E
FY17E
Media
Hindustan Media
Buy
245
292
1,795
920
1,031
20.0
20.0
19.2
20.9
12.7
11.7
2.1
1.8
16.4
15.3
1.5
1.3
Ventures
Metals & Mining
Coal India
Neutral
431
-
272,298
77,595
89,628
22.9
24.4
27.6
30.0
15.6
14.4
6.7
6.7
33.9
33.2
2.8
2.4
Hind. Zinc
Neutral
155
-
65,598
15,546
16,821
47.5
49.0
19.7
20.3
7.9
7.6
1.3
1.2
17.2
16.6
2.0
1.5
Hindalco
Neutral
109
-
22,426
112,328
119,817
7.7
7.9
16.3
20.1
6.7
5.4
0.5
0.5
8.0
8.5
0.7
0.6
JSW Steel
Neutral
902
-
21,796
48,125
53,595
18.8
21.0
46.9
97.5
19.2
9.3
0.9
0.9
4.4
9.5
1.3
1.1
NMDC
Neutral
103
-
40,718
12,544
13,330
59.5
59.7
16.3
16.5
6.3
6.2
1.1
1.1
5.1
9.9
2.0
1.9
SAIL
Neutral
61
-
25,379
56,365
63,383
6.9
8.0
7.1
8.2
8.6
7.5
0.5
0.5
7.0
7.1
1.0
0.9
Vedanta
Neutral
127
-
37,533
81,842
88,430
30.6
32.8
20.2
25.7
6.3
4.9
0.5
0.4
7.5
8.5
0.8
0.6
Tata Steel
Neutral
261
-
25,378
136,805
149,228
11.3
11.9
26.4
36.8
9.9
7.1
0.8
0.7
6.0
8.0
0.7
0.7
Oil & Gas
Cairn India
Neutral
166
-
31,066
12,617
14,513
33.7
40.0
25.5
27.7
6.5
6.0
0.5
0.5
7.4
7.7
1.1
0.9
GAIL
Neutral
343
-
43,515
75,595
85,554
8.6
8.0
31.8
36.1
10.8
9.5
1.2
1.1
10.7
11.4
0.7
0.6
ONGC
Neutral
270
-
231,298
174,773
192,517
22.7
24.8
34.6
38.2
7.8
7.1
1.1
1.0
14.2
14.9
1.4
1.3
Petronet LNG
Neutral
190
-
14,213
45,759
49,386
3.7
4.0
12.6
14.9
15.0
12.7
2.3
2.0
16.1
16.7
0.4
0.3
Reliance Industries
Accumulate
979
1,050
317,144
339,083
384,014
7.8
9.5
75.7
94.5
13.0
10.4
1.3
1.2
10.7
12.2
1.3
1.1
Pharmaceuticals
Alembic Pharma
Neutral
721
-
13,598
2,405
2,859
19.9
20.4
17.7
22.0
40.8
32.8
11.7
8.9
32.6
30.9
5.7
4.7
Aurobindo Pharma
Neutral
788
-
45,999
14,435
16,600
22.6
22.6
36.1
41.2
21.8
19.1
6.5
4.9
34.5
29.3
3.5
3.0
Aventis*
Neutral
4,195
-
9,662
2,156
2,455
15.1
16.8
109.7
133.9
38.2
31.3
5.2
4.3
18.4
22.5
4.2
3.5
Cadila Healthcare
Neutral
1,916
-
39,224
10,224
11,840
19.7
20.0
69.8
81.0
27.5
23.7
7.3
5.8
26.8
25.3
3.9
3.3
Cipla
Neutral
723
-
58,036
14,051
16,515
18.9
18.7
25.1
28.9
28.8
25.0
4.6
3.9
17.2
16.9
4.1
3.4
Dr Reddy's
Neutral
4,270
-
72,799
17,443
20,296
22.3
22.4
156.7
180.1
27.3
23.7
5.4
4.5
21.8
20.8
4.1
3.5
Dishman Pharma
Buy
199
278
1,603
1,716
1,888
20.2
20.2
16.3
21.6
12.2
9.2
1.1
1.0
9.7
11.7
1.1
0.9
GSK Pharma*
Neutral
3,716
-
31,474
2,870
3,158
20.0
22.1
59.5
68.3
62.5
54.4
18.4
18.9
28.5
34.3
10.5
9.6
Indoco Remedies
Neutral
344
-
3,170
1,088
1,262
18.2
18.2
13.1
15.5
26.3
22.2
5.1
4.3
21.2
21.1
3.0
2.6
Ipca labs
Neutral
754
-
9,518
3,533
4,109
18.6
19.6
28.2
34.8
26.8
21.7
3.7
3.2
15.0
15.9
2.9
2.5
Lupin
Neutral
1,703
-
76,630
14,864
17,244
26.9
26.9
62.1
71.1
27.4
24.0
6.7
5.3
27.4
24.6
4.9
4.1
Sun Pharma
Accumulate
847
950
203,699
27,839
33,542
27.7
29.7
18.9
26.9
44.8
31.5
4.0
3.6
13.0
14.6
6.7
5.3
Power
Tata Power
Neutral
70
-
18,865
38,302
38,404
14.1
13.1
5.1
6.0
13.6
11.7
1.3
1.2
9.2
10.3
1.4
1.4
NTPC
Neutral
136
-
111,850
89,067
98,329
15.9
16.5
12.1
13.1
11.2
10.4
1.2
1.2
11.0
11.6
2.3
2.3
Power Grid
Buy
141
170
73,608
19,986
22,702
86.2
86.3
11.1
12.7
12.7
11.1
1.7
1.5
14.4
14.7
8.8
8.2
Market Outlook
August 07, 2015
Stock Watch
Company Name
Reco
CMP
Target
Mkt Cap
Sales ( Čcr )
OPM(%)
EPS (Č)
PER(x)
P/BV(x)
RoE(%)
EV/Sales(x)
(Č)
Price ( Č)
( Č cr )
FY16E FY17E
FY16E
FY17E
FY16E
FY17E
FY16E
FY17E
FY16E
FY17E
FY16E
FY17E
FY16E
FY17E
Telecom
Bharti Airtel
Neutral
415
-
165,852
101,748
109,191
32.1
31.7
12.0
12.5
34.6
33.2
2.4
2.2
6.9
6.7
2.3
2.1
Idea Cellular
Neutral
168
-
60,566
34,282
36,941
32.0
31.5
5.9
6.2
28.5
27.2
2.6
2.4
9.9
9.3
2.3
2.2
zOthers
Abbott India
Neutral
4,781
-
10,159
2,713
3,141
13.7
13.5
127.8
145.7
37.4
32.8
8.7
7.1
25.9
23.9
3.5
2.9
Bajaj Electricals
Buy
274
341
2,759
4,719
5,287
5.2
5.8
8.6
12.7
32.0
21.6
3.7
3.2
11.4
14.8
0.6
0.5
Finolex Cables
Neutral
255
-
3,893
2,728
3,036
10.8
11.0
14.4
16.8
17.7
15.2
2.7
2.3
15.2
15.3
1.2
1.0
Goodyear India*
Neutral
640
-
1,476
1,536
1,683
9.6
10.0
41.8
48.0
15.3
13.3
2.6
2.3
18.2
18.3
0.7
0.6
Hitachi
Neutral
1,440
-
3,915
1,806
2,112
9.0
9.2
28.6
29.1
50.3
49.5
12.5
10.1
28.1
22.6
2.2
1.9
Jyothy Laboratories
Neutral
302
-
5,467
1,620
1,847
11.5
11.5
7.3
8.5
41.4
35.7
5.4
5.0
13.3
14.4
3.2
2.8
MRF
Neutral
44,730
-
18,971
20,727
14,841
19.3
18.6
4,905.8
3,351.9
9.1
13.3
2.9
2.4
37.6
19.6
0.9
1.2
Page Industries
Neutral
14,611
-
16,297
1,929
2,450
19.8
20.1
229.9
299.0
63.6
48.9
28.0
19.5
52.1
47.1
8.5
6.7
Relaxo Footwears
Neutral
565
-
6,774
1,767
2,152
12.3
12.5
19.3
25.1
29.3
22.5
7.2
5.5
27.7
27.8
3.9
3.2
Siyaram Silk Mills
Neutral
1,329
-
1,246
1,653
1,873
11.7
12.2
99.3
122.1
13.4
10.9
2.4
2.0
19.5
20.2
0.9
0.8
Styrolution ABS India*
Neutral
901
-
1,585
1,271
1,440
8.6
9.2
32.0
41.1
28.1
22.0
2.9
2.6
10.7
12.4
1.2
1.1
Tree House
Accumulate
401
433
1,697
259
324
56.8
56.8
17.0
21.7
23.6
18.5
2.4
2.1
10.1
11.5
6.5
5.3
TVS Srichakra
Neutral
2,874
-
2,201
2,112
2,389
11.9
12.1
168.5
202.5
17.1
14.2
5.9
4.4
39.6
35.5
1.1
1.0
HSIL
Buy
283
434
2,048
2,085
2,436
18.5
18.6
21.7
28.9
13.1
9.8
1.3
1.2
10.0
12.1
1.1
0.9
Kirloskar Engines India
Neutral
305
-
4,415
2,779
3,314
10.3
11.9
12.0
17.5
25.5
17.4
3.1
2.8
12.5
16.7
1.2
1.0
Ltd
M M Forgings
Buy
660
797
797
563
671
22.1
22.9
51.0
66.5
13.0
9.9
2.7
2.2
23.1
24.1
1.6
1.3
Banco Products (India)
Neutral
129
-
919
1,196
1,370
9.7
11.8
9.4
14.3
13.7
9.0
1.4
1.2
10.4
14.5
0.7
0.6
Competent Automobiles Neutral
217
-
133
1,007
1,114
3.1
3.1
23.7
28.2
9.2
7.7
1.3
1.1
13.9
14.6
0.1
0.1
Nilkamal
Neutral
1,101
-
1,643
1,948
2,147
10.6
10.3
60.0
67.0
18.4
16.4
2.9
2.5
16.8
16.1
0.9
0.8
Visaka Industries
Neutral
165
-
263
1,158
1,272
8.6
9.5
23.7
32.7
7.0
5.1
0.7
0.6
10.1
12.5
0.4
0.3
Transport Corporation of
Neutral
284
-
2,146
2,830
3,350
8.8
9.0
14.4
18.3
19.7
15.5
3.0
2.7
15.4
17.1
0.9
0.8
India
Elecon Engineering
Neutral
91
-
989
1,452
1,596
13.7
14.7
4.2
6.2
21.9
14.6
1.7
1.6
8.1
11.2
1.0
0.8
Surya Roshni
Neutral
156
-
685
2,992
3,223
8.4
8.7
15.2
19.3
10.3
8.1
1.0
0.9
10.1
11.5
0.5
0.5
MT Educare
Buy
119
141
472
275
355
18.3
17.3
7.4
8.8
16.0
13.4
3.2
2.8
20.2
21.1
1.6
1.2
Radico Khaitan
Accumulate
98
112
1,298
1,565
1,687
11.9
12.4
5.4
6.6
18.0
14.8
1.4
1.3
8.0
9.0
1.3
1.3
Garware Wall Ropes
Buy
298
390
652
875
983
10.4
10.6
23.1
27.8
12.9
10.7
1.8
1.6
14.1
14.8
0.7
0.6
Source: Company, Angel Research; Note: *December year end; #September year end; &October year end; Price as on August 06, 2015
Market Outlook
August 07, 2015
Research Team Tel: 022 - 39357800
DISCLAIMER
Angel Broking Private Limited (hereinafter referred to as “Angel”) is a registered Member of National Stock Exchange of India Limited,
Bombay Stock Exchange Limited and MCX Stock Exchange Limited. It is also registered as a Depository Participant with CDSL and
Portfolio Manager with SEBI. It also has registration with AMFI as a Mutual Fund Distributor. Angel Broking Private Limited is a registered
entity with SEBI for Research Analyst in terms of SEBI (Research Analyst) Regulations, 2014 vide registration number INH000000164.
Angel or its associates has not been debarred/ suspended by SEBI or any other regulatory authority for accessing /dealing in securities
Market. Angel or its associates including its relatives/analyst do not hold any financial interest/beneficial ownership of more than 1% in
the company covered by Analyst. Angel or its associates/analyst has not received any compensation / managed or co-managed public
offering of securities of the company covered by Analyst during the past twelve months. Angel/analyst has not served as an officer,
director or employee of company covered by Analyst and has not been engaged in market making activity of the company covered by
Analyst.
This document is solely for the personal information of the recipient, and must not be singularly used as the basis of any investment
decision. Nothing in this document should be construed as investment or financial advice. Each recipient of this document should make
such investigations as they deem necessary to arrive at an independent evaluation of an investment in the securities of the companies
referred to in this document (including the merits and risks involved), and should consult their own advisors to determine the merits and
risks of such an investment.
Reports based on technical and derivative analysis center on studying charts of a stock's price movement, outstanding positions and
trading volume, as opposed to focusing on a company's fundamentals and, as such, may not match with a report on a company's
fundamentals.
The information in this document has been printed on the basis of publicly available information, internal data and other reliable sources
believed to be true, but we do not represent that it is accurate or complete and it should not be relied on as such, as this document is for
general guidance only. Angel Broking Pvt. Limited or any of its affiliates/ group companies shall not be in any way responsible for any
loss or damage that may arise to any person from any inadvertent error in the information contained in this report. Angel Broking Pvt.
Limited has not independently verified all the information contained within this document. Accordingly, we cannot testify, nor make any
representation or warranty, express or implied, to the accuracy, contents or data contained within this document. While Angel Broking
Pvt. Limited endeavors to update on a reasonable basis the information discussed in this material, there may be regulatory, compliance,
or other reasons that prevent us from doing so.
This document is being supplied to you solely for your information, and its contents, information or data may not be reproduced,
redistributed or passed on, directly or indirectly.
Neither Angel Broking Pvt. Limited, nor its directors, employees or affiliates shall be liable for any loss or damage that may arise from or
in connection with the use of this information.
Note: Please refer to the important ‘Stock Holding Disclosure' report on the Angel website (Research Section). Also, please refer to the
latest update on respective stocks for the disclosure status in respect of those stocks. Angel Broking Pvt. Limited and its affiliates may have
investment positions in the stocks recommended in this report.