Market Outlook
July 07, 2016
Market Cues
Domestic Indices
Chg (%)
(Pts)
(Close)
Indian markets are expected to open positive tracking SGX Nifty.
BSE Sensex
(0.4)
(112)
27,167
Nifty
(0.4)
(35)
8,336
The US markets opened weak on Wednesday; however bargain haunting pulled
back the indices and the broader market closed in positive territory.
Mid Cap
(0.1)
(10)
11,917
Small Cap
(0.1)
(13)
11,993
European markets closed weak on Wednesday among fresh weakness in BGP and
Bankex
(0.5)
(94)
20,647
concerns over Britain’s exit from EU continues to impact the investor sentiments.
Weak German data also contributed to the weakness in the markets.
Global Indices
Chg (%)
(Pts)
(Close)
Indian markets closed down on Tuesday after successive gains in the previous
trading days. Though there was no broad based selling auto stocks saw some selling
Dow Jones
0.4
78
17,919
pressure. With results for Q1FY17 likely to start flowing in from next week markets
Nasdaq
0.8
36
4,859
will be focused on them rather than global events. However, after sharp rebound the
FTSE
(1.2)
(82)
6,464
European markets have turned weak again, after GBP weakened further.
Nikkei
(0.7)
(106)
15,669
News Analysis
Hang Seng
(1.5)
(308)
20,751
J.Kumar Infra-CRGT JV wins order worth `5012cr.
Shanghai Com
0.6
18
3,006
Detailed analysis on Pg2
Advances / Declines
BSE
NSE
Investor’s Ready Reckoner
Advances
1,282
707
Key Domestic & Global Indicators
Declines
1,503
890
Stock Watch: Latest investment recommendations on 150+ stocks
Unchanged
125
67
Refer Pg6 onwards
Top Picks
Volumes (` Cr)
CMP
Target
Upside
Company
Sector
Rating
(`)
(`)
(%)
BSE
3,164
Amara Raja
Auto/Auto Ancillary
Buy
856
1,076
25.8
NSE
17,203
HCL Tech
IT
Buy
738
1,000
35.5
LIC Housing
Financials
Buy
498
592
18.8
Net Inflows (` Cr)
Net
Mtd
Ytd
Bharat Electronics
Capital Goods
Accumulate
1,277
1,414
10.7
FII
149
(114)
19,429
Navkar Corporation Others
Buy
212
265
25.1
MFs
267
298
9,643
More Top Picks on Pg3
Key Upcoming Events
Top Gainers
Price (`)
Chg (%)
Previous
Consensus
Date
Region
Event Description
Jpassociat
12
28.0
Reading
Expectations
July 07 US
Initial Jobless claims
268.0
267.0
Jpinfratec
11
15.9
July 08 UK
Industrial Production(YoY)
1.6
0.5
Jppower
6
10.4
July 08 US
Unemployment Rate
4.7
4.8
Hcc
23
10.3
July 10 India
Imports YoY %
-13.2
--
Amtekauto
39
9.2
6.(
More Events on Pg4
Top Losers
Price (`)
Chg (%)
Coromandel
222
(11.6)
Ashokley
92
(5.6)
Eidparry
239
(4.8)
Mfsl
510
(3.5)
Balramchin
129
(3.4)
As on July 05, 2016
Market Outlook
July 07, 2016
J.Kumar Infra -CRGT JV receive orders worth `5,012cr.
The Mumbai Metro Rail Corporation Ltd has awarded series of contracts for the
Mumbai Metro Line 3. Which pave the way for a much needed improvement in the
city’s infrastructure. The Mumbai based J Kumar Infraprojects along with its JV
partner CRTG( China Rail Tunnel Group) has received an order worth `5,012cr
from the corporation.
One order worth `2,858cr is for the design and construction of underground
sections including four underground stations at Dharavi, BKC, Vidhyanagari and
Santacruz and associated tunnel works for the same.
While another order worth `2,153cr is for the design and construction of
underground sections including CSIA domestic airport, Sahar Road and CSIA
International airport and associated bored tunnels.
As on 31st March J.Kumar had an order book of `3,214cr, while it received
another order worth Rs 360 cr from Mumbai Metro Rail projects for the Dahisar -
Andheri Metro project. With the recent order win the order book of the company
swells upto `8,846cr, which is 6.3x its FY16 revenues. This lends decent revenue
visibility for the years to come.
In FY16 the company reported a revenue growth of 5% while its PAT growth stood
at 9%. For FY16 the company reported an EPS of Rs 14.9, which discounts the
current price by 16.2x. We don’t have a rating on the stock.
Economic and Political News
Slow 4G run rate casts shadow on Telecos.
Telecos may pump spend `1,00,000cr in spectrum auction this year
US praises Rajan’s monetary stewardship
Banking liquidity reaches neutral zone
Monsoon set to cover India, deficit wiped off
Corporate News
L&T to commence `5,273cr Mumbai Metro Line 3 project
Axis Bank gets Nod to Raise foreign shareholding limit to 74%
FITCH downgrades viability rating for Canara Bank & IDBI Bank
Market Outlook
July 07, 2016
Top Picks ★★★★★
Large Cap
Market Cap
CMP
Target
Upside
Company
Rationale
(` Cr)
(`)
(`)
(%)
To outpace battery industry growth due to better technological
Amara Raja Batteries
14,615
856
1,076
25.8
products leading to market share gains in both the automotive
OEM and replacement segments.
Uptick in defense capex by government, coupled with BELs
Bharat Electronics
30,648
1,277
1,414
10.7
strong market positioning, indicate good times ahead for BEL.
HCL Tech
1,04,086
738
1,000
35.5
Stock is trading at attractive valuations & factors all bad news.
Strong visibility for a robust 20% earnings trajectory, coupled
HDFC Bank
2,94,960
1,165
1,262
8.3
with high quality of earnings on account of high quality retail
business and strategic focus on highly rated corporates.
Back on the growth trend, expect a long term growth of 14% to
Infosys
2,69,994
1,175
1,374
16.9
be a US$20bn in FY2020.
Continues to grow its retail loan book at healthy pace with
LIC Housing Finance
25,142
498
592
18.8
improvement in asset quality. Expect LICHF to post a healthy
loan book which is likely to reflect in a strong earnings growth.
Huge bid pipeline of re-development works at Delhi and other
NBCC
11,700
195
220
12.8
State Governments and opportunity from Smart City, positions
NBCC to report strong growth, going forward.
Strong market positioning within the domestic AC markets to
Voltas
10,752
325
407
25.3
continue, EMP business set to revive
Source: Company, Angel Research
Mid Cap
Market Cap
CMP
Target
Upside
Company
Rationale
(` Cr)
(`)
(`)
(%)
Among the top 4 players in the consumer durables segment.
Bajaj Electricals
2,492
247
268
8.7
Improved profitability backed by turn around in E&P segment.
Strong order book lends earnings visibility.
Favourable outlook for AC industry to augur well for Cooling
Blue Star
3,932
437
495
13.3
products business. EMPPAC division's profitability to improve
once operating environment turns around.
With a focus on the low and medium income (LMI) consumer
Dewan Housing
6,169
211
270
27.7
segment, the company has increased its presence in tier-II & III
cities where the growth opportunity is immense.
Strong loan growth backed by diversified loan portfolio and
Equitas Holdings
6,339
189
235
24.3
adequate CAR. ROE & ROA likely to remain decent as risk of
dilution remains low. Attractive valuations considering growth.
Commencement of new projects, downtrend in the interest rate
IL&FS Transport
2,681
82
93
14.1
cycle, to lead to stock re-rating
Economic recovery to have favourable impact on advertising &
circulation revenue growth. Further, the acquisition of a radio
Jagran Prakashan
5,827
178
205
15.0
business (Radio City) would also boost the company's revenue
growth.
Speedier execution and speedier sales, strong revenue visibility
Mahindra Lifespace
1,885
459
554
20.6
in short-to-long run, attractive valuations
Massive capacity expansion along with rail advantage at ICD
Navkar Corporation
3,020
212
265
25.1
as well CFS augurs well for the company
Earnings boost on back of stable material prices and
Radico Khaitan
1,304
98
125
27.6
favourable pricing environment. Valuation discount to peers
provides additional comfort
Strong brands and distribution network would boost growth
Siyaram Silk Mills
1,022
1,090
1,347
23.6
going ahead. Stock currently trades at an inexpensive
valuation.
Source: Company, Angel Research
Market Outlook
July 7, 2016
Key Upcoming Events
Global economic events release calendar
Bloomberg Data
Date
Time
Country
Event Description
Unit
Period
Last Reported
Estimated
Jul 07, 2016
6:00 PM
US
Initial Jobless claims
Thousands
Jul 2
268.00
266.00
6:00 PM
US
Change in Nonfarm payrolls
Thousands
Jun
38.00
175.00
Jul 08, 2016
2:00 PM
UK Industrial Production (YoY)
% Change
May
1.60
0.50
6:00 PM
US
Unnemployment rate
%
Jun
4.70
4.80
Jul 10, 2016
India
Imports YoY%
% Change
Jun
-13.20
Jul 12, 2016
7:00 AM
China Consumer Price Index (YoY)
% Change
Jun
2.00
1.80
July 13, 2016
5:30 PM
India
Industrial Production YoY
% Change
May
-0.80
India
Exports YoY%
% Change
Jun
-0.80
China Exports YoY%
% Change
Jun
-4.10
-5.00
Jul 14, 2016
4:30 PM
UK BOE Announces rates
% Ratio
Jul 14
0.50
US
Producer Price Index (mom)
% Change
Jun
0.50
12:00 PM
India
Monthly Wholesale Prices YoY%
% Change
Jun
0.79
Jul 15, 2016
2:30 PM Euro Zone Euro-Zone CPI (YoY)
%
Jun F
0.10
6:00 PM
US
Consumer price index (mom)
% Change
Jun
0.20
0.30
6:45 PM
US
Industrial Production
%
Jun
(0.42)
0.10
7:30 AM
China Industrial Production (YoY)
% Change
Jun
6.00
5.90
6:00 PM
US
Housing Starts
Thousands
Jun
1,164.00
Jul 19, 2016
7:30 AM
China Real GDP (YoY)
% Change
2Q
6.70
6.60
6:00 PM
US
Building permits
Thousands
Jun
1,136.00
Source: Bloomberg, Angel Research
Market Outlook
July 07, 2016
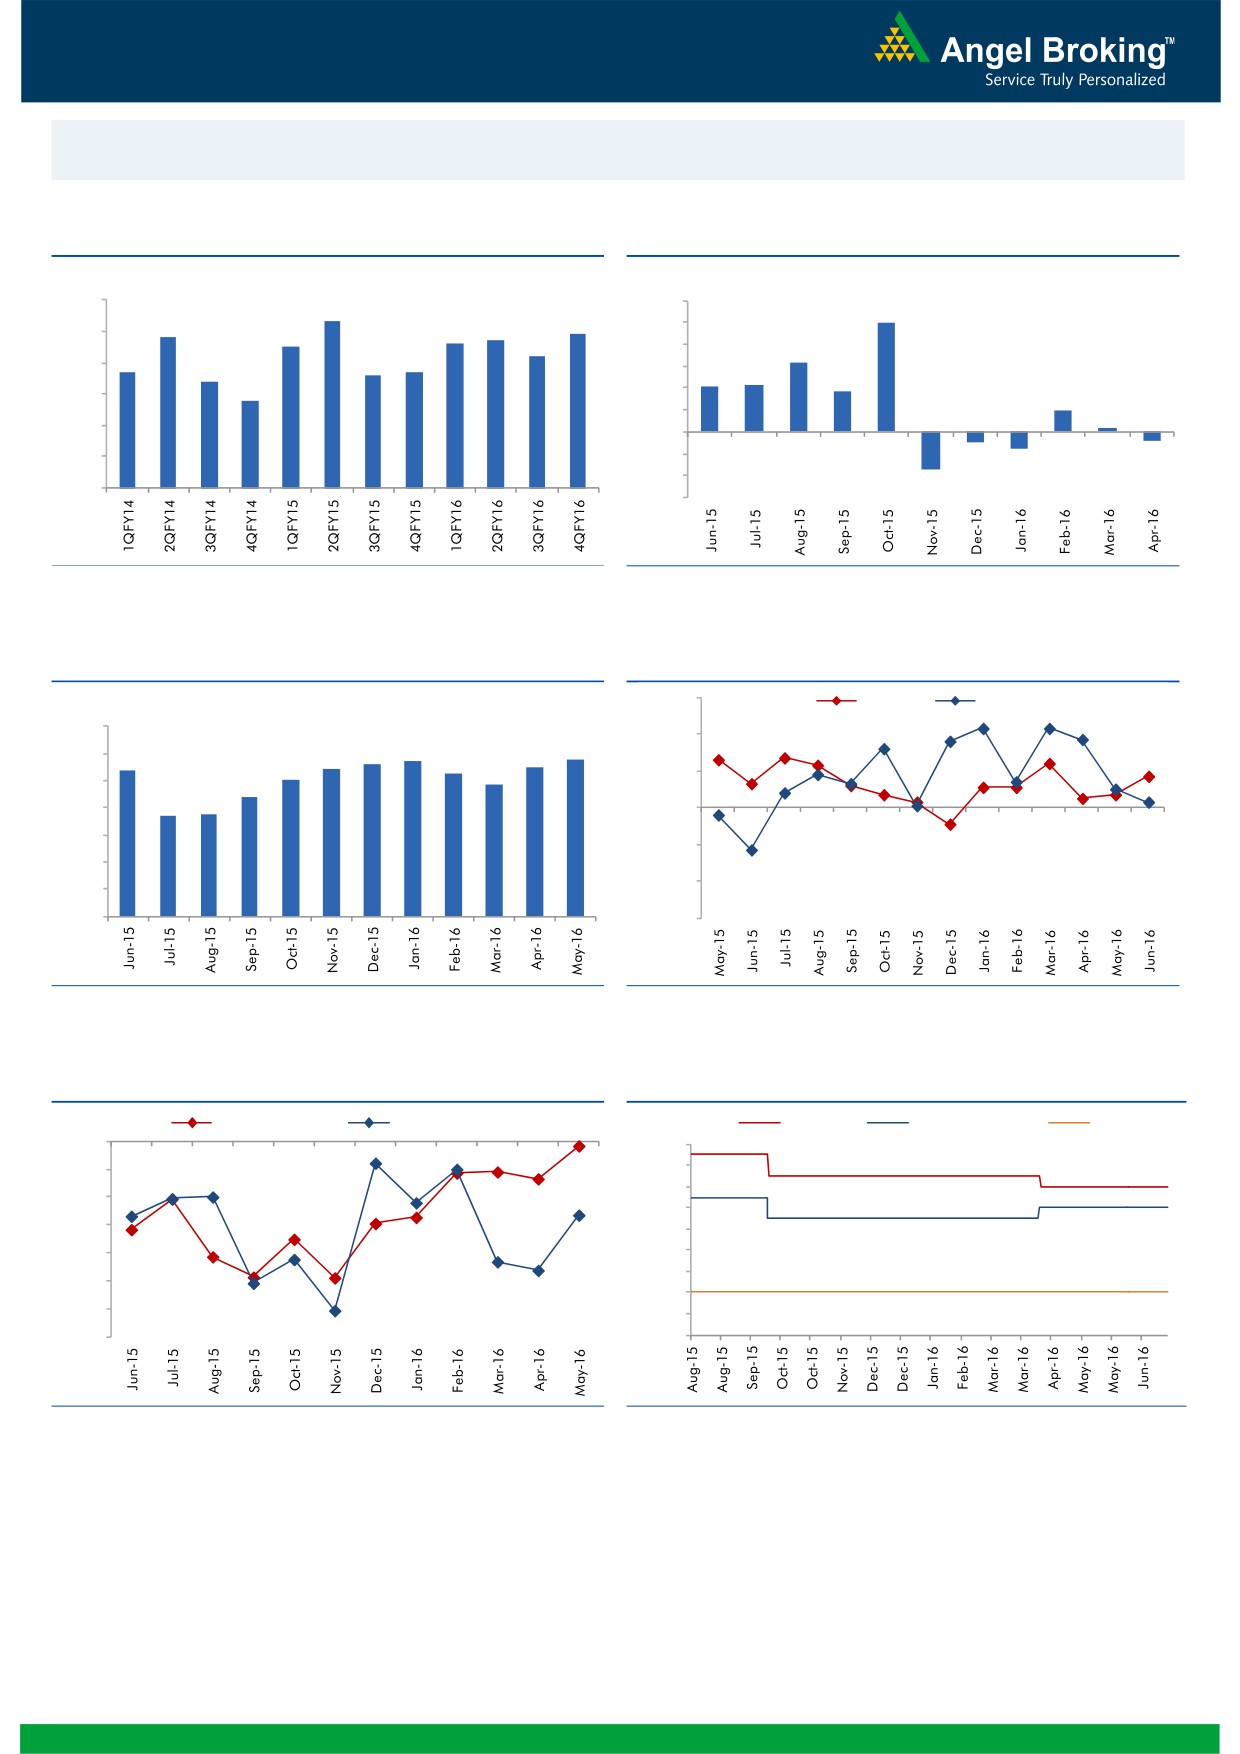
Macro watch
Exhibit 1: Quarterly GDP trends
Exhibit 2: IIP trends
(%)
(%)
9.0
12.0
8.3
9.9
7.8
7.7
7.9
10.0
8.0
7.5
7.6
7.2
8.0
6.3
6.7
6.6
6.7
7.0
6.4
6.0
4.2
4.3
3.7
5.8
4.0
6.0
2.0
2.0
0.3
5.0
-
4.0
(2.0)
(0.9)
(0.8)
(1.6)
(4.0)
3.0
(3.4)
(6.0)
Source: CSO, Angel Research
Source: MOSPI, Angel Research
Exhibit 3: Monthly CPI inflation trends
Exhibit 4: Manufacturing and services PMI
56.0
Mfg. PMI
Services PMI
(%)
7.0
54.0
5.6
5.7
5.8
5.4
5.4
5.5
6.0
5.3
5.0
4.8
52.0
5.0
4.4
3.7
3.7
4.0
50.0
3.0
48.0
2.0
46.0
1.0
-
44.0
Source: MOSPI, Angel Research
Source: Market, Angel Research; Note: Level above 50 indicates expansion
Exhibit 5: Exports and imports growth trends
Exhibit 6: Key policy rates
(%)
Exports yoy growth
Imports yoy growth
(%)
Repo rate
Reverse Repo rate
CRR
0.0
7.50
(5.0)
7.00
6.50
(10.0)
6.00
(15.0)
5.50
(20.0)
5.00
4.50
(25.0)
4.00
(30.0)
3.50
(35.0)
3.00
Source: Bloomberg, Angel Research
Source: RBI, Angel Research
Market Outlook
July 07, 2016
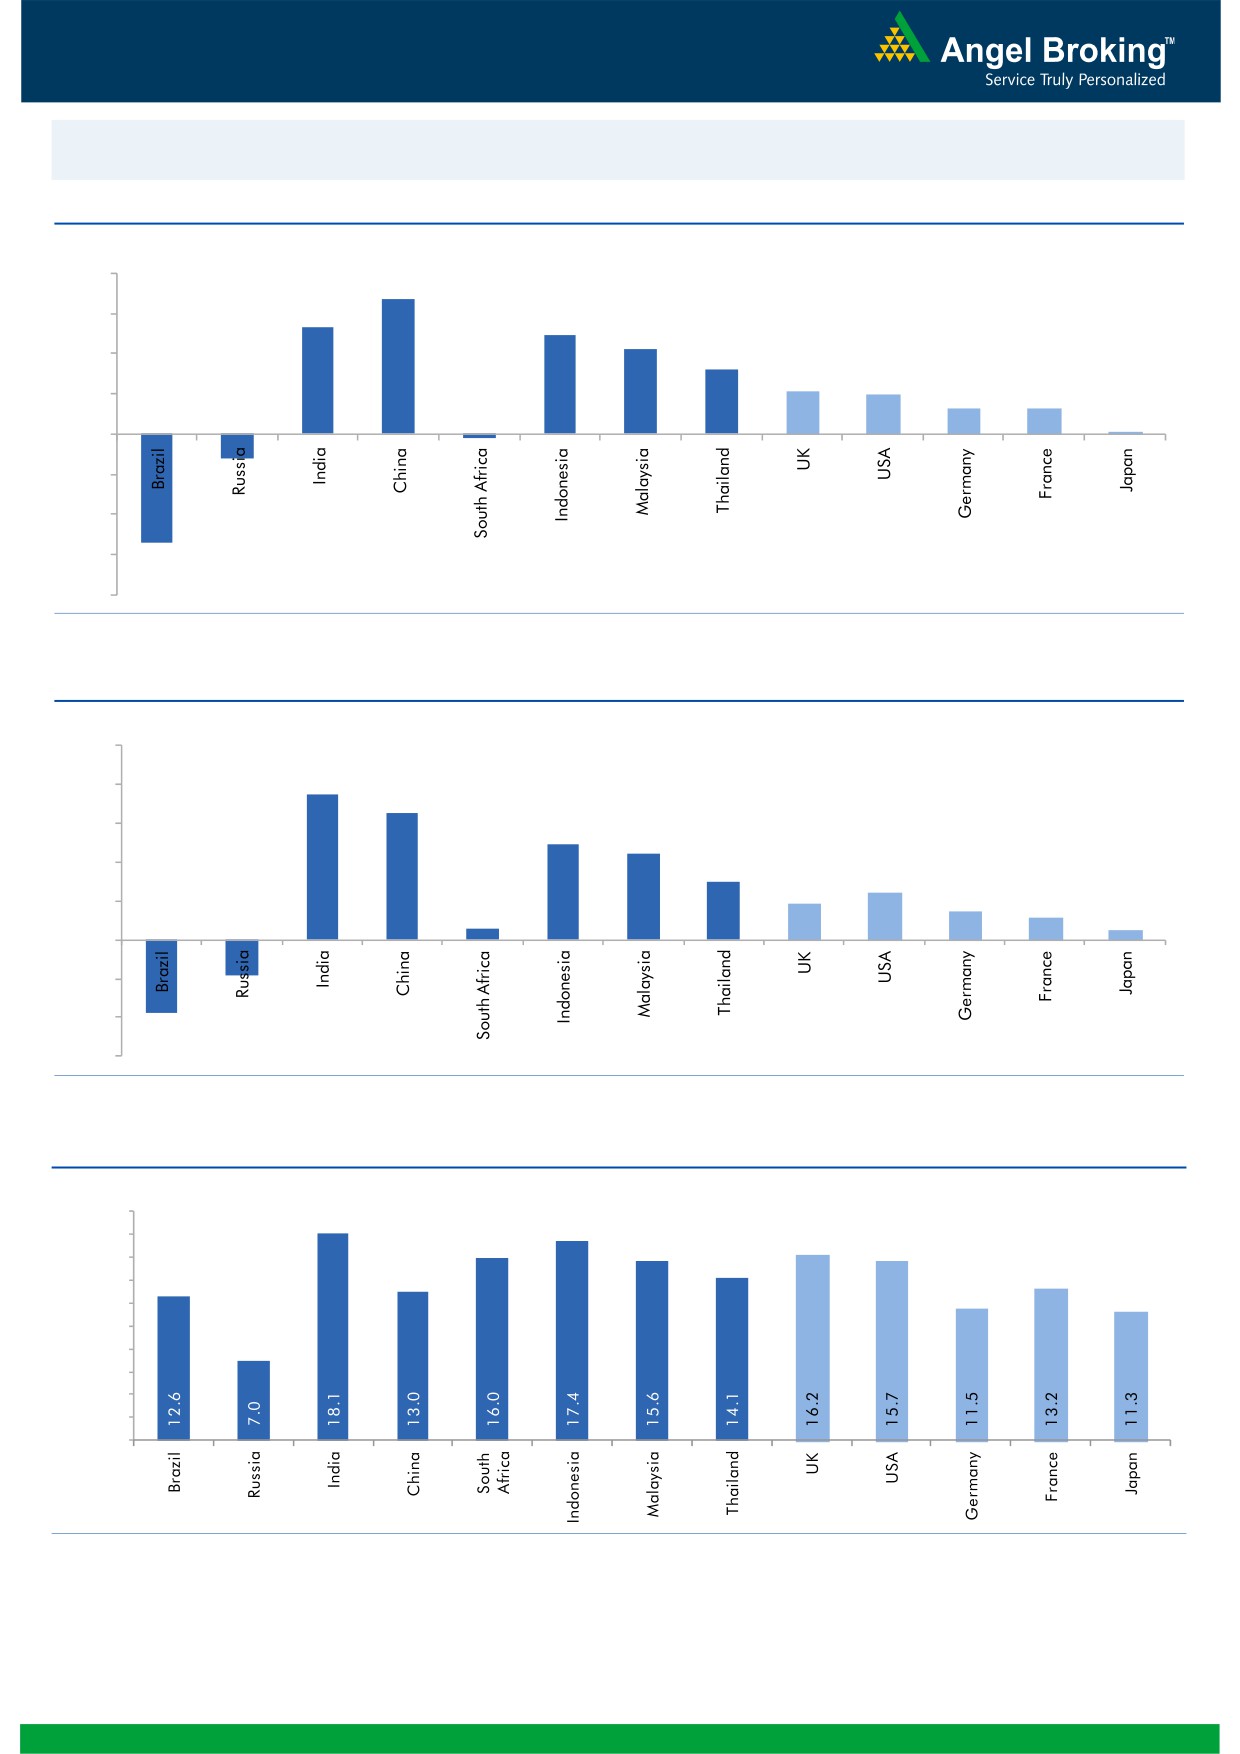
Global watch
Exhibit 1: Latest quarterly GDP Growth (%, yoy) across select developing and developed countries
(%)
8.0
6.7
6.0
5.3
4.9
4.2
4.0
3.2
2.1
2.0
2.0
1.3
1.3
0.1
-
(2.0)
(4.0)
(1.2)
(6.0)
(0.2)
(5.4)
(8.0)
Source: Bloomberg, Angel Research
Exhibit 2: 2016 GDP Growth projection by IMF (%, yoy) across select developing and developed countries
(%)
10.0
7.5
8.0
6.5
6.0
4.9
4.4
4.0
3.0
2.4
1.9
1.5
2.0
1.1
0.6
0.5
(3.8)
(1.8)
-
(2.0)
(4.0)
(6.0)
Source: IMF, Angel Research
Exhibit 3: One year forward P-E ratio across select developing and developed countries
(x)
20.0
18.0
16.0
14.0
12.0
10.0
8.0
6.0
4.0
2.0
-
Source: IMF, Angel Research
Market Outlook
July 07, 2016
Exhibit 4: Relative performance of indices across globe
Returns (%)
Country
Name of index
Closing price
1M
3M
1YR
Brazil
Bovespa
51,902
5.4
4.0
(2.7)
Russia
Micex
1,879
0.8
2.1
16.2
India
Nifty
8,336
1.8
8.2
0.6
China
Shanghai Composite
3,017
3.3
0.2
(33.6)
South Africa
Top 40
44,501
(3.1)
(0.2)
(1.3)
Mexico
Mexbol
45,305
1.5
2.2
3.1
Indonesia
LQ45
851
2.5
1.2
0.5
Malaysia
KLCI
1,651
1.2
(4.3)
(2.4)
Thailand
SET 50
914
1.7
0.5
(7.0)
USA
Dow Jones
17,919
0.9
0.9
1.5
UK
FTSE
6,464
5.4
6.2
0.8
Japan
Nikkei
15,379
(5.8)
(6.5)
(24.6)
Germany
DAX
9,373
(4.9)
(1.2)
(9.7)
France
CAC
4,085
(5.2)
(0.4)
(15.3)
Source: Bloomberg, Angel Research
Stock Watch
July 07, 2016
Company Name
Reco
CMP
Target
Mkt Cap
Sales ( Čcr )
OPM(%)
EPS (Č)
PER(x)
P/BV(x)
RoE(%)
EV/Sales(x)
(Č)
Price ( Č)
( Č cr )
FY16E FY17E
FY16E
FY17E
FY16E
FY17E
FY16E
FY17E
FY16E
FY17E
FY16E
FY17E
FY16E
FY17E
Agri / Agri Chemical
Rallis
Neutral
212
-
4,130
1,612
1,911
13.3
13.3
7.4
9.5
28.7
22.4
4.6
4.1
16.7
18.4
2.7
2.3
United Phosphorus
Buy
546
684
23,417
13,083
15,176
18.5
18.5
31.5
37.4
17.3
14.6
3.5
2.9
21.4
21.4
2.0
1.7
Auto & Auto Ancillary
Ashok Leyland
Accumulate
92
111
26,267
17,995
21,544
11.4
11.6
3.4
4.7
27.2
19.6
4.8
4.4
17.7
22.2
1.5
1.2
Bajaj Auto
Neutral
2,614
-
75,639
22,709
25,860
20.9
20.1
129.0
143.6
20.3
18.2
6.2
5.4
30.7
29.4
2.9
2.6
Bharat Forge
Accumulate
768
875
17,884
7,351
8,318
19.9
19.7
31.2
36.5
24.6
21.1
4.4
3.7
19.3
19.2
2.6
2.2
Eicher Motors
Neutral
19,392
-
52,672
15,556
16,747
15.5
17.3
464.8
597.5
41.7
32.5
15.2
11.2
36.2
34.3
3.3
3.0
Gabriel India
Accumulate
94
101
1,350
1,415
1,544
8.7
9.0
4.6
5.4
20.4
17.4
3.7
3.3
18.1
18.9
0.9
0.8
Hero Motocorp
Neutral
3,112
-
62,133
28,244
30,532
15.5
15.9
156.7
168.5
19.9
18.5
7.9
6.7
39.9
36.4
2.1
1.9
Jamna Auto Industries Neutral
171
-
1,365
1,281
1,473
11.2
11.5
7.6
9.2
22.5
18.6
5.7
4.7
25.4
25.2
1.1
1.0
L G Balakrishnan & Bros Neutral
475
-
746
1,254
1,394
11.6
11.8
35.9
41.7
13.2
11.4
1.8
1.6
13.5
13.8
0.7
0.6
Mahindra and Mahindra Neutral
1,457
-
90,484
38,416
42,904
13.7
13.9
54.8
63.4
26.6
23.0
4.1
3.6
15.4
15.8
2.0
1.7
Maruti
Neutral
4,170
-
125,972
57,865
68,104
16.4
16.7
176.3
225.5
23.7
18.5
4.6
3.9
19.4
21.2
2.0
1.6
Minda Industries
Neutral
1,150
-
1,825
2,523
2,890
8.7
9.0
55.0
65.4
20.9
17.6
4.0
3.3
19.3
18.7
0.8
0.7
Motherson Sumi
Accumulate
285
313
37,745
39,343
45,100
8.8
9.1
10.1
12.5
28.3
22.8
9.0
7.0
35.3
34.4
1.0
0.9
Rane Brake Lining
Buy
415
465
328
454
511
11.5
12.0
25.2
31.0
16.5
13.4
2.5
2.2
14.9
16.6
0.8
0.8
Setco Automotive
Neutral
49
-
660
594
741
12.7
13.7
1.7
3.2
29.1
15.4
3.1
2.6
10.4
16.9
1.6
1.3
Tata Motors
Neutral
461
-
132,970
259,686
273,957
13.0
13.4
25.9
29.5
17.8
15.6
2.3
2.0
8.0
9.0
0.7
0.7
TVS Motor
Accumulate
307
330
14,561
11,263
13,122
6.9
8.5
9.2
15.0
33.3
20.4
7.6
6.1
22.7
29.6
1.3
1.1
Amara Raja Batteries
Buy
856
1,076
14,615
4,690
5,429
17.5
17.5
28.5
35.3
30.1
24.2
7.0
5.7
23.1
25.9
3.1
2.7
Exide Industries
Neutral
171
-
14,527
6,950
7,784
14.4
14.8
6.6
7.3
25.9
23.4
3.3
3.0
12.6
12.8
1.9
1.7
Apollo Tyres
Buy
156
183
7,956
12,056
12,714
17.2
16.4
23.0
20.3
6.8
7.7
1.2
1.0
17.7
13.6
0.7
0.7
Ceat
Buy
869
1,119
3,514
6,041
6,597
14.1
13.7
99.5
111.9
8.7
7.8
1.7
1.4
19.6
18.5
0.7
0.6
JK Tyres
Neutral
92
-
2,096
7,446
7,669
15.2
14.0
19.6
18.4
4.7
5.0
1.2
1.0
25.2
19.5
0.7
0.6
Swaraj Engines
Neutral
1,245
-
1,546
552
630
14.2
14.7
44.6
54.1
27.9
23.0
6.5
5.9
23.2
25.6
2.6
2.2
Subros
Neutral
91
-
547
1,293
1,527
11.8
11.9
4.2
6.7
21.7
13.6
1.6
1.5
7.7
11.5
0.8
0.6
Indag Rubber
Neutral
188
-
494
283
329
17.0
17.2
13.0
15.4
14.5
12.2
3.2
2.6
21.8
21.6
1.5
1.2
Capital Goods
ACE
Neutral
46
-
454
660
839
4.7
8.2
1.0
3.9
45.9
11.8
1.4
1.3
3.2
11.3
0.8
0.7
BEML
Buy
905
1,157
3,767
3,277
4,006
6.0
8.9
36.2
64.3
25.0
14.1
1.7
1.6
5.7
11.7
1.2
0.9
Bharat Electronics
Accumulate
1,277
1,414
30,648
7,295
8,137
20.0
16.8
56.5
58.7
22.6
21.8
3.4
3.0
42.1
44.6
3.4
2.9
Stock Watch
July 07, 2016
Company Name
Reco
CMP
Target
Mkt Cap
Sales ( Čcr )
OPM(%)
EPS (Č)
PER(x)
P/BV(x)
RoE(%)
EV/Sales(x)
(Č)
Price ( Č)
( Č cr )
FY16E
FY17E
FY16E
FY17E
FY16E
FY17E
FY16E
FY17E
FY16E
FY17E
FY16E
FY17E
FY16E
FY17E
Capital Goods
Voltas
Buy
325
407
10,752
5,857
6,511
7.5
7.9
11.7
12.9
27.8
25.2
4.5
4.0
17.1
16.7
1.8
1.6
BGR Energy
Neutral
119
-
857
3,615
3,181
9.5
9.4
16.7
12.4
7.1
9.6
0.7
0.7
10.0
7.0
0.6
0.8
BHEL
Neutral
139
-
34,120
33,722
35,272
10.8
11.7
10.5
14.2
13.3
9.8
1.0
0.9
7.0
9.0
1.0
1.0
Blue Star
Accumulate
437
495
3,932
3,770
4,351
5.7
6.4
11.4
17.2
38.3
25.5
5.9
5.5
18.4
23.1
1.1
0.9
Crompton Greaves
Neutral
74
-
4,629
13,484
14,687
4.9
6.2
4.5
7.1
16.4
10.4
1.2
1.1
7.2
10.8
0.5
0.4
Greaves Cotton
Neutral
137
-
3,354
1,655
1,755
16.6
16.8
7.4
7.8
18.6
17.6
3.7
3.5
21.1
20.6
2.0
1.9
Inox Wind
Buy
235
286
5,214
4,406
5,605
15.5
15.7
20.4
24.8
11.5
9.5
2.6
1.9
27.9
25.9
1.4
1.1
KEC International
Neutral
143
-
3,673
8,791
9,716
6.1
6.8
5.4
8.2
26.5
17.4
2.7
2.4
10.0
14.0
0.6
0.6
Thermax
Neutral
851
-
10,141
6,413
7,525
7.4
8.5
30.5
39.3
27.9
21.7
4.3
3.7
15.0
17.0
1.6
1.3
VATech Wabag
Accumulate
593
681
3,232
2,722
3,336
7.9
8.1
19.5
24.6
30.4
24.1
3.2
2.8
11.1
12.4
1.3
1.1
Cement
ACC
Neutral
1,587
-
29,799
13,151
14,757
16.4
18.3
63.9
83.4
24.8
19.0
3.2
2.9
13.3
16.1
2.1
1.8
Ambuja Cements
Neutral
253
-
39,294
11,564
12,556
19.4
20.7
8.9
10.1
28.5
25.1
3.6
3.4
12.8
13.8
3.0
2.8
HeidelbergCement
Neutral
118
-
2,673
1,772
1,926
13.3
15.4
1.0
3.0
118.0
39.3
3.0
2.8
2.6
7.9
2.1
1.8
India Cements
Neutral
116
-
3,553
4,216
4,840
18.0
19.5
4.0
9.9
28.9
11.7
1.2
1.1
4.0
9.5
1.2
0.9
JK Cement
Neutral
700
-
4,895
3,661
4,742
10.1
15.8
7.5
28.5
93.3
24.6
2.8
2.5
7.5
22.9
1.8
1.3
J K Lakshmi Cement
Neutral
398
-
4,680
2,947
3,616
16.7
19.9
11.5
27.2
34.6
14.6
3.3
2.8
9.8
20.8
2.0
1.6
Mangalam Cements
Neutral
302
-
806
1,053
1,347
10.5
13.3
8.4
26.0
36.0
11.6
1.5
1.4
4.3
12.5
1.2
0.9
Orient Cement
Neutral
175
-
3,589
1,854
2,524
21.2
22.2
7.7
11.1
22.8
15.8
3.3
2.8
13.3
15.7
2.7
1.9
Ramco Cements
Neutral
568
-
13,529
4,036
4,545
20.8
21.3
15.1
18.8
37.6
30.2
4.6
4.1
12.9
14.3
3.9
3.4
Shree Cement^
Neutral
14,865
-
51,784
7,150
8,742
26.7
28.6
228.0
345.5
65.2
43.0
9.6
8.1
15.7
20.3
7.0
5.6
UltraTech Cement
Neutral
3,371
-
92,519
24,669
29,265
18.2
20.6
82.0
120.0
41.1
28.1
4.4
3.9
11.3
14.7
3.9
3.3
Construction
ITNL
Buy
82
93
2,681
7,360
8,682
34.0
32.2
7.0
8.6
11.6
9.5
0.4
0.4
3.2
2.5
3.7
3.6
KNR Constructions
Accumulate
570
603
1,603
937
1,470
14.3
14.0
44.2
38.6
12.9
14.8
2.6
2.2
15.4
15.4
1.7
1.1
Larsen & Toubro
Accumulate
1,575
1,700
146,759
58,870
65,708
8.3
10.3
42.0
53.0
37.5
29.7
2.6
2.4
8.8
11.2
2.7
2.4
Gujarat Pipavav Port
Neutral
166
-
8,011
629
684
51.0
52.2
6.4
5.9
25.9
28.1
3.4
3.1
15.9
12.7
12.1
10.9
MBL Infrastructures
Buy
133
285
550
2,313
2,797
12.2
14.6
19.0
20.0
7.0
6.6
0.7
0.7
11.3
10.6
0.9
0.8
Nagarjuna Const.
Neutral
78
-
4,328
7,892
8,842
8.8
9.1
3.0
5.3
26.0
14.7
1.3
1.2
5.0
8.5
0.8
0.7
PNC Infratech
Accumulate
567
647
2,908
1,873
2,288
13.2
13.5
24.0
32.0
23.6
17.7
2.3
2.0
12.1
12.3
1.7
1.4
Simplex Infra
Neutral
292
-
1,445
5,955
6,829
10.3
10.5
16.0
31.0
18.3
9.4
1.0
0.9
5.3
9.9
0.7
0.6
Stock Watch
July 07, 2016
Company Name
Reco
CMP
Target
Mkt Cap
Sales ( Čcr )
OPM(%)
EPS (Č)
PER(x)
P/BV(x)
RoE(%)
EV/Sales(x)
(Č)
Price ( Č)
( Č cr )
FY16E
FY17E
FY16E
FY17E
FY16E
FY17E
FY16E
FY17E
FY16E
FY17E
FY16E
FY17E
FY16E
FY17E
Construction
Power Mech Projects
Neutral
550
-
808
1,539
1,801
12.8
12.7
59.0
72.1
9.3
7.6
1.4
1.2
18.6
16.8
0.5
0.5
Sadbhav Engineering
Accumulate
292
298
5,009
3,186
3,598
10.2
10.3
8.0
9.0
36.5
32.4
3.4
3.0
9.4
9.9
1.9
1.6
NBCC
Accumulate
195
220
11,700
5,838
7,428
6.0
7.9
5.2
8.2
37.5
23.8
1.2
0.9
21.9
28.2
1.8
1.3
MEP Infra
Neutral
43
-
693
1,956
1,876
28.1
30.5
1.3
3.0
32.8
14.2
6.9
4.6
21.2
32.8
1.8
1.8
SIPL
Neutral
100
-
3,505
675
1,042
62.4
64.7
-
-
3.7
4.3
-
-
16.8
11.3
Engineers India
Neutral
210
-
7,077
1,667
1,725
13.5
16.0
9.7
11.4
21.7
18.4
2.5
2.5
11.7
13.4
3.0
3.0
Financials
Allahabad Bank
Neutral
77
-
5,538
8,569
9,392
2.8
2.9
16.3
27.5
4.7
2.8
0.4
0.4
7.6
11.9
-
-
Axis Bank
Neutral
540
-
128,789
26,204
29,738
3.6
3.5
34.5
35.4
15.6
15.2
2.5
2.2
16.8
14.9
-
-
Bank of Baroda
Neutral
160
-
36,751
18,802
21,088
2.0
2.2
(7.4)
13.0
12.3
1.3
1.0
(4.2)
7.3
-
-
Bank of India
Neutral
110
-
10,307
15,972
17,271
1.9
2.0
15.3
33.4
7.2
3.3
0.3
0.3
3.6
7.6
-
-
Canara Bank
Neutral
229
-
12,424
15,441
16,945
2.0
2.1
46.6
70.4
4.9
3.3
0.4
0.4
8.0
11.2
-
-
Dena Bank
Neutral
43
-
2,851
3,440
3,840
2.1
2.3
7.3
10.0
5.9
4.3
0.4
0.4
6.1
7.9
-
-
Dewan Housing Finance Buy
211
270
6,169
1,828
2,225
2.9
3.0
24.9
29.7
8.5
7.1
1.3
1.2
15.1
16.1
-
-
Equitas Holdings
Buy
189
235
6,339
679
1,076
12.4
11.7
6.2
6.7
30.5
28.2
3.8
2.8
13.3
12.5
-
-
Federal Bank
Neutral
60
-
10,343
3,279
3,787
2.8
2.9
3.9
5.5
15.3
10.9
1.2
1.1
8.4
10.8
-
-
HDFC
Neutral
1,259
-
199,091
10,358
11,852
3.3
3.3
41.1
47.0
30.7
26.8
5.8
5.3
24.7
24.9
-
-
HDFC Bank
Accumulate
1,165
1,262
294,960
38,606
47,696
4.4
4.5
48.8
61.4
23.9
19.0
4.1
3.5
18.7
20.0
-
-
ICICI Bank
Neutral
245
-
142,689
34,279
39,262
3.3
3.3
21.0
24.4
11.7
10.1
2.0
1.7
14.4
14.7
-
-
IDBI Bank
Neutral
77
-
15,801
9,625
10,455
1.8
1.8
8.5
14.2
9.0
5.4
0.6
0.5
5.9
9.3
-
-
Indian Bank
Neutral
150
-
7,202
6,160
6,858
2.5
2.5
24.5
29.8
6.1
5.0
0.5
0.4
7.7
8.6
-
-
LIC Housing Finance
Buy
498
592
25,142
3,179
3,758
2.6
2.6
32.9
40.6
15.2
12.3
2.8
2.4
19.6
20.7
-
-
Oriental Bank
Neutral
118
-
4,090
7,643
8,373
2.4
2.4
37.2
45.4
3.2
2.6
0.3
0.3
8.2
9.4
-
-
Punjab Natl.Bank
Neutral
114
-
22,365
23,122
26,022
2.8
2.8
7.0
21.6
16.3
5.3
0.8
0.7
3.4
10.0
-
-
South Ind.Bank
Neutral
22
-
2,923
1,965
2,185
2.5
2.5
2.5
3.3
8.7
6.6
0.9
0.8
9.5
11.7
-
-
St Bk of India
Neutral
223
-
173,110
79,958
86,061
2.6
2.6
13.4
20.7
16.7
10.8
1.4
1.3
11.5
12.8
-
-
Union Bank
Neutral
135
-
9,253
12,646
14,129
2.3
2.4
31.0
39.1
4.3
3.5
0.5
0.4
9.8
11.4
-
-
Vijaya Bank
Neutral
44
-
4,360
3,536
3,827
1.9
1.9
5.5
6.7
7.9
6.6
0.7
0.6
7.8
8.8
-
-
Yes Bank
Neutral
1,126
-
47,385
7,190
9,011
3.2
3.3
58.2
69.7
19.3
16.2
3.5
2.9
19.2
19.6
-
-
FMCG
Asian Paints
Neutral
985
-
94,500
15,534
17,445
17.7
16.8
18.4
19.6
53.6
50.3
19.0
17.9
34.6
35.6
6.1
5.4
Stock Watch
July 07, 2016
Company Name
Reco
CMP
Target
Mkt Cap
Sales ( Čcr )
OPM(%)
EPS (Č)
PER(x)
P/BV(x)
RoE(%)
EV/Sales(x)
(Č)
Price ( Č)
( Č cr )
FY16E FY17E
FY16E
FY17E
FY16E
FY17E
FY16E
FY17E
FY16E
FY17E
FY16E
FY17E
FY16E
FY17E
FMCG
Britannia
Neutral
2,834
-
34,004
8,481
9,795
14.0
14.1
65.5
78.3
43.3
36.2
20.5
16.8
38.3
41.2
3.9
3.4
Colgate
Neutral
938
-
25,520
4,136
4,632
22.5
23.3
22.2
25.3
42.3
37.1
25.7
22.9
68.6
67.5
5.9
5.3
Dabur India
Neutral
308
-
54,155
9,370
10,265
17.6
17.3
7.3
8.1
42.0
38.0
10.9
10.0
31.7
30.6
5.7
5.2
GlaxoSmith Con*
Neutral
6,142
-
25,829
4,519
5,142
19.6
19.8
164.3
191.2
37.4
32.1
10.4
8.8
30.8
29.9
5.0
4.4
Godrej Consumer
Neutral
1,659
-
56,505
9,003
10,335
18.1
18.7
34.1
41.8
48.7
39.7
10.5
9.0
23.9
24.8
6.3
5.5
HUL
Neutral
890
-
192,694
33,299
35,497
17.1
17.1
18.9
20.0
47.1
44.5
41.3
36.0
87.6
80.8
5.7
5.3
ITC
Buy
243
380
293,562
36,837
39,726
38.8
38.7
12.2
13.5
19.9
18.1
5.5
4.9
27.8
26.9
7.7
7.2
Marico
Neutral
272
-
35,048
6,151
6,966
17.2
17.3
5.4
6.4
50.3
42.5
15.8
12.5
33.2
32.4
5.5
4.9
Nestle*
Neutral
6,532
-
62,978
9,393
10,507
22.2
22.3
106.8
121.8
61.2
53.6
21.5
19.3
34.8
36.7
6.5
5.8
Tata Global
Neutral
134
-
8,441
8,635
9,072
9.8
9.9
5.8
7.2
23.1
18.6
2.1
2.0
6.8
7.4
1.0
1.0
Procter & Gamble
Buy
6,309
7,369
20,479
2,588
2,939
23.3
23.2
130.2
146.2
48.5
43.2
96.6
92.6
27.6
25.3
7.4
6.4
Hygiene
IT
HCL Tech^
Buy
738
1,000
104,086
37,061
30,781
21.5
20.5
51.4
40.0
14.4
18.5
3.7
2.7
20.1
20.3
2.5
2.7
Infosys
Buy
1,175
1,374
269,994
62,441
70,558
27.5
27.5
59.0
65.3
19.9
18.0
4.0
3.6
22.2
22.4
3.7
3.2
TCS
Buy
2,483
3,004
489,198
108,646
122,770
28.3
28.3
123.7
141.0
20.1
17.6
6.6
6.1
33.1
34.6
4.1
3.5
Tech Mahindra
Buy
514
700
49,880
26,494
30,347
16.3
17.0
32.2
37.5
16.0
13.7
3.5
3.0
21.7
21.8
1.6
1.4
Wipro
Buy
562
680
138,891
50,808
56,189
23.7
23.8
37.3
40.7
15.1
13.8
2.9
2.6
19.2
17.7
2.2
1.8
Media
D B Corp
Neutral
384
-
7,058
2,025
2,187
27.4
27.4
17.4
18.9
22.1
20.4
5.0
4.5
22.9
23.7
3.4
3.2
HT Media
Neutral
80
-
1,852
2,495
2,673
12.9
13.2
6.8
7.2
11.7
11.1
0.9
0.9
7.5
7.8
0.3
0.2
Jagran Prakashan
Accumulate
178
205
5,827
2,107
2,355
33.5
28.0
10.1
10.8
17.7
16.5
4.1
3.6
23.3
21.7
2.9
2.5
Sun TV Network
Neutral
370
-
14,585
2,510
2,763
71.8
71.5
21.9
24.8
16.9
14.9
4.0
3.6
22.8
24.3
5.3
4.8
Hindustan Media
Neutral
271
-
1,988
914
1,016
21.7
21.5
21.9
23.3
12.4
11.7
2.2
1.9
18.0
16.2
1.6
1.4
Ventures
Metals & Mining
Coal India
Buy
322
380
203,229
76,167
84,130
19.9
22.3
22.4
25.8
14.4
12.5
5.2
5.0
35.5
41.0
1.9
1.7
Hind. Zinc
Neutral
185
-
78,211
14,641
14,026
50.4
50.4
17.7
16.0
10.5
11.6
1.6
1.5
16.2
13.2
2.7
2.6
Hindalco
Neutral
124
-
25,523
104,356
111,186
8.7
9.5
6.7
11.1
18.4
11.2
0.7
0.6
3.5
5.9
0.8
0.7
JSW Steel
Neutral
1,477
-
35,704
42,308
45,147
16.4
20.7
(10.3)
49.5
29.8
1.7
1.6
(1.0)
5.6
1.9
1.8
NMDC
Neutral
95
-
37,843
8,237
10,893
46.6
44.5
10.0
11.7
9.6
8.2
1.1
0.9
12.5
13.0
4.3
3.3
SAIL
Neutral
48
-
19,618
45,915
53,954
7.2
10.5
1.5
4.4
31.5
10.9
0.5
0.5
2.3
4.1
1.1
0.9
Vedanta
Neutral
137
-
40,646
71,445
81,910
26.2
26.3
12.9
19.2
10.6
7.1
0.7
0.7
7.2
8.9
1.0
0.8
Tata Steel
Neutral
334
-
32,448
126,760
137,307
8.9
11.3
6.4
23.1
52.5
14.5
1.1
1.0
2.0
7.1
0.8
0.8
Stock Watch
July 07, 2016
Company Name
Reco
CMP
Target
Mkt Cap
Sales ( Čcr )
OPM(%)
EPS (Č)
PER(x)
P/BV(x)
RoE(%)
EV/Sales(x)
(Č)
Price ( Č)
( Č cr )
FY16E FY17E
FY16E
FY17E
FY16E
FY17E
FY16E
FY17E
FY16E
FY17E
FY16E
FY17E
FY16E
FY17E
Oil & Gas
Cairn India
Neutral
149
-
27,870
11,323
12,490
49.4
51.0
20.7
20.7
7.2
7.2
0.5
0.4
6.4
6.1
1.5
0.8
GAIL
Neutral
387
-
49,077
64,856
70,933
9.1
9.6
24.0
28.9
16.2
13.4
1.4
1.3
8.8
9.6
1.0
0.9
ONGC
Neutral
230
-
196,905
154,564
145,998
36.8
37.4
20.8
22.6
11.1
10.2
1.0
1.0
10.1
9.7
1.5
1.6
Petronet LNG
Neutral
295
-
22,140
29,691
31,188
5.8
6.2
12.8
13.4
23.1
22.0
3.4
3.1
15.8
14.8
0.8
0.8
Indian Oil Corp
Neutral
476
-
115,583
359,607
402,760
5.9
6.1
42.5
48.7
11.2
9.8
1.5
1.3
14.1
14.4
0.4
0.4
Reliance Industries
Neutral
993
-
321,959
304,775
344,392
12.6
13.4
91.3
102.6
10.9
9.7
1.2
1.1
11.8
12.0
1.0
0.8
Pharmaceuticals
Alembic Pharma
Neutral
577
-
10,877
3,145
3,483
31.9
16.2
38.2
18.7
15.1
30.9
6.8
5.7
57.9
20.1
3.4
3.1
Aurobindo Pharma
Neutral
769
-
45,008
13,651
15,702
21.7
21.7
33.9
38.4
22.7
20.0
6.4
4.9
32.5
27.7
3.4
3.0
Aventis*
Neutral
4,665
-
10,744
2,049
2,375
15.4
17.3
115.4
153.5
40.4
30.4
6.6
5.2
19.3
25.8
5.0
4.2
Cadila Healthcare
Buy
335
400
34,260
9,469
11,246
21.2
22.0
14.9
17.1
22.5
19.6
6.4
5.0
28.8
26.6
3.5
2.9
Cipla
Neutral
507
-
40,705
13,372
15,378
16.4
17.4
18.8
21.6
26.9
23.5
3.4
3.0
13.3
13.7
3.1
2.9
Dr Reddy's
Neutral
3,448
-
58,797
15,471
17,479
24.6
24.6
138.2
152.4
25.0
22.6
4.6
3.9
19.7
18.7
3.8
3.4
Dishman Pharma
Neutral
139
-
2,246
1,733
1,906
21.5
21.5
10.1
10.0
13.8
13.9
1.6
1.5
10.5
11.2
1.8
1.6
GSK Pharma*
Neutral
3,466
-
29,358
2,741
3,528
16.5
18.9
44.2
60.1
78.4
57.7
17.3
17.2
21.2
29.9
10.3
8.1
Indoco Remedies
Neutral
286
-
2,634
977
1,112
14.9
18.2
9.0
13.2
31.8
21.7
4.5
3.9
15.1
19.2
2.7
2.4
Ipca labs
Buy
481
613
6,068
2,844
3,799
10.6
15.3
10.6
17.3
45.4
27.8
2.6
2.4
5.9
9.1
2.3
1.7
Lupin
Buy
1,560
1,809
70,324
13,702
15,912
23.7
26.4
50.5
58.1
30.9
26.9
6.4
5.2
22.9
21.4
5.6
4.4
Sun Pharma
Buy
774
944
186,314
27,744
31,129
26.0
30.0
22.0
28.0
35.2
27.7
5.1
4.2
18.3
18.7
6.5
5.6
Power
Tata Power
Neutral
74
-
20,082
35,923
37,402
22.6
22.8
4.1
5.2
18.3
14.4
1.4
1.3
7.5
9.3
1.5
1.4
NTPC
Neutral
153
-
125,826
87,271
99,297
23.5
23.5
11.8
13.3
13.0
11.5
1.5
1.4
11.5
12.2
2.5
2.2
Power Grid
Neutral
161
-
84,281
20,702
23,361
86.7
86.4
12.1
13.2
13.3
12.2
2.0
1.7
15.6
15.1
9.1
8.4
Real Estate
MLIFE
Buy
459
554
1,885
826
1,011
20.1
21.9
22.7
30.7
20.2
15.0
1.2
1.1
6.0
7.4
4.2
3.2
Telecom
Bharti Airtel
Neutral
366
-
146,225
101,748
109,191
32.1
31.7
12.0
12.5
30.5
29.3
2.1
2.0
6.9
6.7
2.1
1.9
Idea Cellular
Neutral
105
-
37,934
34,282
36,941
32.0
31.5
5.9
6.2
17.9
17.0
1.6
1.5
9.9
9.3
1.7
1.6
zOthers
Abbott India
Neutral
4,710
-
10,007
2,715
3,153
14.5
14.1
134.3
152.2
35.1
30.9
8.8
7.2
27.4
25.6
3.4
2.9
Bajaj Electricals
Accumulate
247
268
2,492
4,612
5,351
5.6
5.7
23.4
18.0
10.5
13.7
3.2
2.9
12.5
14.4
0.5
0.5
Finolex Cables
Neutral
371
-
5,673
2,520
2,883
12.2
12.0
12.7
14.2
29.3
26.1
4.0
3.5
13.6
13.5
1.9
1.7
Goodyear India*
Buy
532
631
1,226
1,800
1,600
11.7
11.5
58.7
52.9
9.1
10.0
2.0
1.8
24.6
18.7
0.5
0.4
Hitachi
Neutral
1,372
-
3,731
1,779
2,081
7.8
8.8
21.8
33.4
62.9
41.0
10.2
8.2
17.4
22.1
2.2
1.8
Stock Watch
July 07, 2016
Company Name
Reco
CMP
Target
Mkt Cap
Sales ( Čcr )
OPM(%)
EPS (Č)
PER(x)
P/BV(x)
RoE(%)
EV/Sales(x)
(Č)
Price ( Č)
( Č cr )
FY16E
FY17E
FY16E
FY17E
FY16E
FY17E
FY16E
FY17E
FY16E
FY17E
FY16E
FY17E
FY16E
FY17E
zOthers
Jyothy Laboratories
Neutral
304
-
5,506
1,620
1,847
11.5
11.5
7.3
8.5
41.7
35.9
5.4
5.0
13.3
14.4
3.2
2.7
MRF
Buy
34,696
45,575
14,715
20,316
14,488
21.4
21.1
5,488.0
3,798.0
6.3
9.1
2.2
1.8
41.1
21.2
0.7
0.9
Page Industries
Neutral
13,792
-
15,384
1,929
2,450
19.8
20.1
229.9
299.0
60.0
46.1
26.5
18.4
52.1
47.1
8.2
6.4
Relaxo Footwears
Neutral
490
-
5,885
1,767
2,152
12.3
12.5
19.3
25.1
25.5
19.6
6.3
4.8
27.7
27.8
3.4
2.8
Siyaram Silk Mills
Buy
1,090
1,347
1,022
1,619
1,799
11.6
11.6
93.5
104.9
11.7
10.4
2.0
1.7
17.1
16.4
0.9
0.8
Styrolution ABS India* Neutral
653
-
1,148
1,271
1,440
8.6
9.2
32.0
41.1
20.4
15.9
2.1
1.9
10.7
12.4
0.9
0.7
TVS Srichakra
Buy
2,423
2,932
1,855
2,035
2,252
15.9
15.3
248.6
268.1
9.8
9.0
4.3
3.1
43.6
33.9
0.9
0.8
HSIL
Accumulate
286
310
2,069
2,123
2,384
16.1
16.5
15.0
18.9
19.0
15.2
1.5
1.4
8.0
9.4
1.3
1.1
Kirloskar Engines India
Neutral
270
-
3,903
2,403
2,554
8.6
9.9
9.2
10.5
29.4
25.7
2.8
2.7
9.7
10.7
1.3
1.2
Ltd
M M Forgings
Buy
444
546
536
511
615
21.7
21.6
43.1
55.8
10.3
8.0
1.9
1.5
19.9
21.2
1.3
1.0
Banco Products (India) Neutral
156
-
1,114
1,208
1,353
11.0
12.3
10.8
14.5
14.5
10.8
1.7
1.5
11.9
14.5
0.9
0.8
Competent Automobiles Neutral
150
-
92
1,040
1,137
3.2
3.1
25.7
28.0
5.8
5.4
0.9
0.8
15.0
14.3
0.1
0.1
Nilkamal
Neutral
1,219
-
1,819
1,871
2,031
10.7
10.5
63.2
69.8
19.3
17.5
3.1
2.7
17.6
16.6
1.0
0.9
Visaka Industries
Neutral
157
-
249
1,020
1,120
8.7
9.1
13.9
20.1
11.3
7.8
0.7
0.7
6.4
8.7
0.5
0.4
Transport Corporation of
Neutral
337
-
2,577
2,830
3,350
8.8
9.0
14.4
18.3
23.4
18.4
3.6
3.1
15.4
17.1
1.0
0.8
India
Elecon Engineering
Neutral
65
-
704
1,359
1,482
10.3
13.7
0.8
3.9
80.5
16.6
1.3
1.3
1.6
7.8
0.9
0.8
Surya Roshni
Buy
164
201
719
2,992
3,223
8.1
8.4
14.7
18.3
11.2
8.9
1.0
0.9
9.7
11.0
0.5
0.5
MT Educare
Neutral
168
-
669
286
366
18.3
17.7
7.7
9.4
21.8
17.9
4.6
4.0
20.2
21.1
2.2
1.7
Radico Khaitan
Buy
98
125
1,304
1,543
1,659
12.6
13.0
5.8
6.3
17.0
15.5
1.4
1.3
8.5
8.6
1.3
1.2
Garware Wall Ropes
Buy
399
460
873
828
898
11.2
10.3
28.3
29.0
14.1
13.8
2.4
2.1
16.8
14.9
1.0
0.9
Wonderla Holidays
Neutral
398
-
2,249
206
308
44.0
43.6
9.0
12.9
44.2
30.9
6.0
5.5
13.7
17.8
10.9
7.3
Linc Pen & Plastics
Neutral
243
-
359
344
382
9.1
9.1
12.4
13.1
19.6
18.5
3.5
3.1
18.0
16.7
1.1
1.0
The Byke Hospitality
Neutral
159
-
639
222
287
20.5
20.5
5.6
7.6
28.3
21.1
5.3
4.4
18.9
20.8
2.9
2.2
Interglobe Aviation
Neutral
1,017
-
36,664
17,022
21,122
20.7
14.5
63.9
53.7
15.9
19.0
23.9
19.6
149.9
103.2
2.2
1.7
Coffee Day Enterprises
Neutral
258
-
5,315
2,692
2,964
17.0
18.6
-
4.7
-
54.5
3.2
3.0
0.2
5.5
2.4
2.2
Ltd
Navneet Education
Neutral
100
-
2,376
998
1,062
24.1
24.0
5.8
6.1
17.3
16.4
3.8
3.4
22.0
20.6
2.4
2.3
Navkar Corporation
Buy
212
265
3,020
347
408
43.2
42.9
6.7
6.8
31.8
31.3
2.3
2.2
7.3
6.9
9.2
8.4
UFO Moviez
Neutral
554
-
1,529
558
619
32.0
33.2
22.5
30.0
24.6
18.5
3.0
2.6
12.0
13.8
2.7
2.3
VRL Logistics
Neutral
312
-
2,842
1,725
1,902
16.5
16.7
12.2
14.6
25.6
21.4
5.3
4.7
20.8
21.9
1.8
1.6
Stock Watch
July 07, 2016
Company Name
Reco
CMP
Target Mkt Cap
Sales ( Čcr )
OPM(%)
EPS (Č)
PER(x)
P/BV(x)
RoE(%)
EV/Sales(x)
(Č)
Price ( Č)
( Č cr )
FY16E FY17E FY16E FY17E FY16E FY17E FY16E FY17E FY16E FY17E FY16E FY17E FY16E FY17E
zOthers
Team Lease Serv.
Neutral
1,096
-
1,874
2,565
3,229
1.3
1.5
15.2
22.8
72.2
48.1
5.8
5.2
8.0
10.7
0.6
0.5
S H Kelkar & Co.
Neutral
211
-
3,046
928
1,036
15.3
15.1
4.9
6.1
42.7
34.5
4.0
3.7
9.4
10.7
3.2
2.8
Quick Heal
Neutral
286
-
2,001
339
408
27.8
27.3
7.1
7.7
40.4
36.9
3.4
3.4
8.5
9.3
4.5
3.7
Narayana Hrudaya
Neutral
313
-
6,396
1,603
1,873
10.9
11.5
1.0
2.6
328.6
118.3
7.9
7.3
2.4
6.1
4.1
3.5
Manpasand Bever.
Neutral
582
-
2,913
540
836
19.9
19.6
10.2
16.9
56.8
34.5
4.6
4.1
8.1
12.0
4.9
3.1
Parag Milk Foods
#N/A
307
2,578
1,645
1,919
9.0
9.3
6.7
9.5
45.6
32.5
6.0
5.0
13.1
15.5
Source: Company, Angel Research; Note: *December year end; #September year end; &October year end; Price as on July 05, 2016
Market Outlook
July 07, 2016
Research Team Tel: 022 - 39357800
DISCLAIMER
Angel Broking Private Limited (hereinafter referred to as “Angel”) is a registered Member of National Stock Exchange of India Limited,
Bombay Stock Exchange Limited and Metropolitian Stock Exchange of India Limited. It is also registered as a Depository Participant with
CDSL and Portfolio Manager with SEBI. It also has registration with AMFI as a Mutual Fund Distributor. Angel Broking Private Limited is a
registered entity with SEBI for Research Analyst in terms of SEBI (Research Analyst) Regulations, 2014 vide registration number
INH000000164. Angel or its associates has not been debarred/ suspended by SEBI or any other regulatory authority for accessing
/dealing in securities Market. Angel or its associates including its relatives/analyst do not hold any financial interest/beneficial ownership
of more than 1% in the company covered by Analyst. Angel or its associates/analyst has not received any compensation / managed or co
-managed public offering of securities of the company covered by Analyst during the past twelve months. Angel/analyst has not served as
an officer, director or employee of company covered by Analyst and has not been engaged in market making activity of the company
covered by Analyst.
This document is solely for the personal information of the recipient, and must not be singularly used as the basis of any investment
decision. Nothing in this document should be construed as investment or financial advice. Each recipient of this document should make
such investigations as they deem necessary to arrive at an independent evaluation of an investment in the securities of the companies
referred to in this document (including the merits and risks involved), and should consult their own advisors to determine the merits and
risks of such an investment.
Reports based on technical and derivative analysis center on studying charts of a stock's price movement, outstanding positions and
trading volume, as opposed to focusing on a company's fundamentals and, as such, may not match with a report on a company's
fundamentals.
The information in this document has been printed on the basis of publicly available information, internal data and other reliable sources
believed to be true, but we do not represent that it is accurate or complete and it should not be relied on as such, as this document is for
general guidance only. Angel Broking Pvt. Limited or any of its affiliates/ group companies shall not be in any way responsible for any
loss or damage that may arise to any person from any inadvertent error in the information contained in this report. Angel Broking Pvt.
Limited has not independently verified all the information contained within this document. Accordingly, we cannot testify, nor make any
representation or warranty, express or implied, to the accuracy, contents or data contained within this document. While Angel Broking
Pvt. Limited endeavors to update on a reasonable basis the information discussed in this material, there may be regulatory, compliance,
or other reasons that prevent us from doing so.
This document is being supplied to you solely for your information, and its contents, information or data may not be reproduced,
redistributed or passed on, directly or indirectly.
Neither Angel Broking Pvt. Limited, nor its directors, employees or affiliates shall be liable for any loss or damage that may arise from or
in connection with the use of this information.
Note: Please refer to the important ‘Stock Holding Disclosure' report on the Angel website (Research Section). Also, please refer to the
latest update on respective stocks for the disclosure status in respect of those stocks. Angel Broking Pvt. Limited and its affiliates may have
investment positions in the stocks recommended in this report.