Market Outlook
November 6, 2015
Market Cues
Domestic Indices
Chg (%)
(Pts)
(Close)
Indian markets are expected to open in green tracking SGX Nifty & Asian peers.
BSE Sensex
(1.0)
(249)
26,304
U.S. stocks ended Thursday’s session modestly lower for second consecutive day, as
Nifty
(1.1)
(85)
7,955
investors turned cautious ahead of an important employment report due on Friday.
Mid Cap
(1.5)
(163)
10,871
Key indexes swung between small gains and losses before ending the day slightly
Small Cap
(1.6)
(180)
11,119
lower, as investors were weighing a possible rate hike in December, 2015. Notably,
Bankex
(1.5)
(290)
19,373
Energy, Utilities and Materials were the biggest decliners.
European stock ended the day in red, as the pound dropped after Bank of England
Global Indices
Chg (%)
(Pts)
(Close)
gave a downcast outlook for the British economy, saying that weakness in emerging
markets will drag on the growth and inflation prospects. Poor quarterly earnings led
Dow Jones
(0.0)
(4)
17,863
to correction across the Wm. Morrison Supermarkets and Randgold Resources stocks
Nasdaq
(0.3)
(15)
5,128
on Thursday.
FTSE
(0.8)
(48)
6,365
Indian markets ended the day in red for second consecutive trading session. With
Nikkei
1.0
190
19,116
outcome of Bihar Exit polls later in the evening, investors turned cautious. Key
Hang Seng
(0.0)
(3)
23,051
indices witnessed correction in the afternoon trade and they closed 1% lower.
Shanghai Com
1.9
63
3,523
News & Result Analysis
Gold monetization scheme, Sovereign Bonds to help curb gold imports
Advances / Declines
BSE
NSE
Result Review: Cipla, Garware Wall Ropes, Tata Steel, Goodyear
Advances
874
339
Result Preview: Aurobindo Pharma
Declines
1,825
1,157
Detailed analysis on Pg2
Unchanged
116
72
Investor’s Ready Reckoner
Key Domestic & Global Indicators
Volumes (` Cr)
Stock Watch: Latest investment recommendations on 150+ stocks
BSE
3,704
Refer P9 onwards
NSE
14,054
Top Picks
CMP
Target
Upside
Net Inflows (` Cr)
Net
Mtd
Ytd
Company
Sector
Rating
(`)
(`)
(%)
FII
(306)
(313)
(15,132)
Axis Bank
Financials
Buy
465
630
35.5
MFs
262
429
50,776
HCL Tech
IT
Buy
877
1,132
29.1
ICICI Bank
Financials
Buy
270
348
28.7
Top Gainers
Price (`)
Chg (%)
Ashok Leyland
Automobiles
Buy
87
111
27.9
Arvind
282
5.1
Larsen & Toubro
Construction
Buy
1,369
1,646
20.2
More Top Picks on Pg6
Neyvelilig
83
2.3
Coalindia
337
2.1
Key Upcoming Events
Gdl
346
2.0
Previous
Consensus
Date
Region
Event Description
Reading
Expectations
Pipavavdoc
58
1.6
Nov 6
GBP
Manufacturing Production (MOM) (Sep)
0.5%
0.4%
Nov 6
US
Nonfarm Payrolls (Oct)
142k
180k
Top Losers
Price (`)
Chg (%)
Nov 6
US
Unemployment Rate (Oct)
5.1%
5.1%
Unitech
7
(6.8)
Nov 7
CNY
Trade Balance (Oct)
60.34B
64.75B
Jubilant
397
(5.9)
Ashokley
87
(5.8)
Bajajelec
241
(5.3)
Jublfood
1,381
(5.2)
As on November 05, 2015
Market Outlook
November 6, 2015
Gold monetization scheme, Sovereign Bonds to help curb gold
imports
The Union Cabinet gave its approval for introduction of Gold Monetization
Schemes as announced in the Union Budget 2015-16, which will replace the
existing Gold Deposit Scheme, 1999. India has 20,000 tonnes of gold lying idle
and the objective of this scheme is to put this gold to productive use. As part of
these schemes, banks will collect gold for up to 15 years to auction them off or to
lend to jewellers.
Government expects to reduce the country’s reliance on the import of gold to meet
domestic demand. India imported an estimated $34 billion worth gold in 2014-
15. Huge gold imports had pushed India's current account deficit to a record $190
billion in 2013, prompting the government to hike its duty on imports to a record
10%.
The revamped gold deposit scheme will help the government mobilize idle gold
lying as an idle asset with households, trusts and various institutions in India.
Government is hoping to succeed in mobilizing gold with this scheme by offering
interest rates (2.25-2.50% p.a.) higher than previous rates of ~1%. The deposits
can be made for a short-term period of 1-3 years, a medium-term period of 5-7
years and a long-term period, of 12-15 years. Like a fixed deposit, breaking of
lock-in period will be allowed by paying a penalty.
Under the revamped gold metal loan scheme, a gold account denominated in
grams of gold, will be opened by the bank for jewellers. The gold mobilized
through the revamped GDS, under the short-term option, will be provided to
jewellers on loan, on the basis of the terms and conditions set-out by banks, under
the guidance of RBI. The tenor of the GML at present is 180 days. We expect the
gems & jewellery players such as Titan and PC Jeweller to be the key beneficiaries
of these schemes.
The Reserve Bank of India, in consultation with Government of India, has also
decided to issue Sovereign Gold Bonds on November 26, 2015, applications for
which will be accepted from November 05-20, 2015. The bond will pay a fixed
rate of 2.75% p.a. payable semi-annually on the initial value of investment. The
tenor of the Bond will be for a period of 8 years with exit option from 5th year and
the bonds will also be listed on the exchanges. Investors can purchase a minimum
of 2 units (1 unit = 1 gram) and a maximum of 500 grams per person per fiscal.
Gold bonds offer investors an ideal way to add gold exposure to their portfolio,
while earn interest from the bond to augment their returns.
Result Review
Cipla (CMP: `659 / TP: /Upside:)
Cipla for 2QFY2016 posted more or less in line numbers on sales and net profit
front while beating our estimates on OPM front, where the company has posted a
better than expected numbers. On sales the company, posted sales of `3,362c V/s
`3,343cr expected and `2,630cr, yoy growth of 27.8%. The growth on the topline
came through a 52.3% yoy growth in exports driven by formulation exports (on
back of generic nexium). Export API, on the other hand posted a 61.4% yoy growth
Market Outlook
November 6, 2015
during the quarter. Domestic formulation (`1,262cr) posted a flat growth of 0.9%
yoy. On the operating front, the gross margins came in at 63.8% v/s 61.4% in
2QFY2015, leading the margin expansion. OPMs’ came in at 20.8% V/s 16.0% in
2QFY2015 and expected 19.7%, driven by gross margin expansion and higher
sales growth. However, inspite of a 66.0% rise in operating profit, the PAT rose
only by 44.5% yoy, on back of an 80.0% yoy rise in tax expenses. Thus, the Net
Profit came in at `432cr V/s `458cr expected and `299cr in 2QFY2015, a yoy
44.5%. We currently have a neutral rating on the stock.
Y/E
Sales OPM
PAT
EPS ROE P/E P/BV EV/EBITDA EV/Sales
March
(` cr)
(%)
(` cr)
(`)
(%)
(x)
(x)
(x)
(x)
FY2016E
14,359
21.3
2,283
28.4
19.3
23.2
4.1
17.3
3.7
FY2017E
16,884
19.7
2,449
30.5
17.5
21.6
3.5
15.5
3.1
Garware Wall Ropes (CMP: `345 / TP: `423/ Upside:23% )
Garware Wall Ropes (GWRL)’s 2QFY2016 results outperformed our bottom-line
estimates. The company’s top-line grew by ~6% YoY to ~`214cr (which is below
our estimates of ~`232cr), mainly due to lower growth of ~3% in Synthetic
cordage segment. However, fibre & Industrial products segment reported strong
growth of
~14%. On the operating front, the company reported
margin improvement (up by 188bp YoY to 12.4%), primarily on account of lower
raw material costs (Key raw material for GWRL is High Density Polyethylene,
Polyethylene etc which corrected by 783bp YoY) and lower employee expenses.
The reported net profit grew by ~42% YoY to ~`15.4cr (our estimates was of
~`12.7cr) on account of falling material prices and lower interest cost (in FY2015
the company has repaid a significant amount of its debt).
Going ahead, we expect GWRL to report a healthy top-line owing to strong
domestic as well as export sales. On the domestic front, we expect demand to pick
up due to growth in agriculture and fisheries segments in the country. Further, we
expect the company to continue reporting strong numbers on back of higher
demand for aquaculture and sports products globally and also with the company
tapping new geographies. We are positive on the stock
Tata Steel (CMP: `226 / TP: /Upside: )
Tata Steel standalone revenues declined 12% on a yoy basis and 5% sequentially
to `9,531cr, 7% ahead of our estimate of `8,879cr. Realisation per tonne at
$629/tonne was higher than our estimate of
~$586/tonne. Material costs
however increased significantly at `2,739cr (~28.7% of revenues) vs. our estimate
of `2,084cr. Led by the higher than expected raw material expenses, EBITDA was
lower than expectations at `1,861cr vs. our estimate of `1,918cr. EBITDA per
tonne remained flat sequentially at $123 as against $124 in 1Q16 (our estimate -
$127). Corus reported an EBITDA loss of `139cr as against our expectations of
EBITDA profit of `984cr. Corus volumes were 7% below our estimate at 3.27MT,
while revenue was in line with estimate led by higher than expected realisation.
Raw Material expenses too were in line with expectations indicating higher than
expected operating expenses. Consolidated revenue declined
18% YOY at
`29,305cr, as against our expectation of `28,504cr. Consolidated EBITDA came
in at `1,705, down 54% yoy, and well below our expectations of `2,632cr.
Market Outlook
November 6, 2015
Consolidated net profit increased 22% to `1,528cr as led by a jump in other
income (sale of investments). We retain our neutral rating on the stock.
Y/E
Sales OPM
PAT EPS ROE P/E P/BV EV/EBITDA EV/Sales
March
(` cr)
(%)
(` cr)
(`)
(%) (x)
(x)
(x)
(x)
FY2016E
1,16,562
8.6
(243)
(2.5) (0.8) NM
0.8
9.6
0.8
FY2017E
1,20,692
11.1
803
8.3
2.7
28.7
0.8
7.5
0.8
Goodyear India (CMP: `573/ TP: `622/ Upside: 8.7%)
Note- Goodyear is extending its Financial Year by one quarter to March 31, 2016. Hence
our FY2016E numbers account for 5 quarters.
For 3QFY2016, Goodyear reported a disappointing set of numbers. The top-line witnessed
a decline of 5.0% on the yoy basis to `382cr which is below our estimate of `412cr. Poor
tractor sales coupled with declining realizations on account of lower raw material prices
have resulted in subdued top-line. The raw material cost declined by 495bp yoy to 63.4% of
sales while employee and other expense increased by 193bp yoy and 100bp yoy to 7.7%
and 16.9% of sales respectively. As a result, EBITDA margin expanded by 202bp yoy to
11.9%. On the back of lower raw material cost, the net profit for the quarter increased by
15.2% yoy to `29cr.
In the near term, we believe that poor tractor sales are likely to curb top-line growth for the
company (which is evident in the past three quarter where the growth has been
disappointing). However the company is looking to enter newer segments and is also
focusing on increasing its presence in passenger car OEM and aftermarket segment.
Goodyear India remains one of the cheapest MNCs available (market cap range of
`1,000cr-`5000cr), trading at TTM PE of 14.0x while most MNC peers trade at multiples of
20.0x or above. At current market price of `573, the stock is trading at 10.1x its FY2017E
earnings. We have an Accumulate rating on the stock with a target price of `622.
Y/E
Sales OPM
PAT
EPS ROE P/E P/BV EV/EBITDA EV/Sales
Mar
(` cr)
(%)
(` cr)
(`)
(%)
(x)
(x)
(x)
(x)
FY2016E
1,888
12.1
144
62.2 25.9
9.2
2.2
3.9
0.5
FY2017E
1,680
11.9
130
56.6 19.7 10.1
1.8
4.0
0.5
Result Preview
Aurobindo Pharma (CMP: `820 / TP: `872 /Upside: 6.4%)
Aurobindo Pharma for 2QFY2016, is expected to post a robust numbers. On sales
the company, is expected to post sales of `3,320cr V/s `2,862cr in 2QFY2015,
yoy growth of 16.0%. The growth on the topline, will come through formulations.
On the operating front, the OPMs’ are expected to come in at 21.8% V/s 21.6% in
2QFY2015. Thus, the Adj. Net Profit is expected to come in at `477cr V/s `384cr
in 2QFY2015, a yoy 24.5%. We currently have an accumulate rating on the stock,
with a price target of `872.
Market Outlook
November 6, 2015
Y/E
Sales OPM
PAT
EPS ROE P/E P/BV EV/EBITDA EV/Sales
March
(` cr)
(%)
(` cr)
(`)
(%)
(x)
(x)
(x)
(x)
FY2016E
14,923
23.0
2,233
38.2
36.0
21.5
6.6
15.5
3.6
FY2017E
17,162
23.0
2,548
43.6
30.2
18.8
5.0
13.2
3.2
Economic and Political News
Grand Alliance gets 4-2 lead in Bihar exit polls
Rescue package for discoms gets Cabinet nod
Telcos allowed to liberalise 800 & 1,800 MHz
Centre raises support price for pulses by `250/qtl
Corporate News
Virtusa to buy 53% stake in Polaris for `1,173cr
Blow for Tata Motors' defence ambitions
ABB's India biz to get a global play
Market Outlook
November 6, 2015
Top Picks ★★★★★
Large Cap
Market Cap
CMP
Target
Upside
Company
Rationale
(` Cr)
(`)
(`)
(%)
To outpace battery industry growth due to better technological
Amara Raja Batteries
15,055
881
1,040
18.0
products leading to market share gains in both the automotive
OEM and replacement segments.
Earnings to grow strongly given the MHCV cyclical upturn.
Ashok Leyland
24,702
87
111
27.9
Focus on exports and LCV's provides additional growth
avenue.
Healthy pace of branch expansion, backed by distribution
Axis Bank
110,475
465
630
35.5
network, will be the driving force for the bank’s retail business
and overall earnings.
The stock is trading at attractive valuations and is factoring all
HCL Tech
123,367
877
1,132
29.1
the bad news.
Strong visibility for a robust 20% earnings trajectory, coupled
HDFC Bank
271,751
1,079
1,262
17.0
with high quality of earnings on account of high quality retail
business and strategic focus on highly rated corporates.
Due to its robust franchise and capital adequacy position, the
bank is well positioned to grow by at least a few percentage
ICICI Bank
156,894
270
348
28.7
points higher than the average industry growth rate from a
structural point of view.
Back on the growth trend, expect a long term growth of 14% to
Infosys
257,821
1,122
1,306
16.4
be a US$20bn in FY2020.
Well positioned to benefit from such expected gradual recovery
in the overall domestic capex cycle, given its presence across
Larsen & Toubro
127,440
1,369
1,646
20.2
various infrastructure segments, its execution capabilities, and
its strong balance sheet.
LICHF continues to grow its retail loan book at a healthy pace
with improvement in asset quality. We expect the company to
LIC Housing Finance
23,280
461
571
23.8
post a healthy loan book which is likely to reflect in a strong
earnings growth.
Source: Company, Angel Research
Mid Cap
Market Cap
CMP
Target
Upside
Company
Rationale
(` Cr)
(`)
(`)
(%)
Government thrust on Renewable sector and strong order
Inox Wind
8,497
383
505
31.9
book would drive future growth.
Change in business focus towards high-margin chronic and
Ipca labs
9,253
733
900
22.7
lifestyle segments and increasing penetration in Europe and
US
Economic recovery to have favourable impact on advertising &
circulation revenue growth. Further, the acquisition of a radio
Jagran Prakashan
4,683
143
169
18.0
business (Radio City) would also boost the company's revenue
growth.
Strong brand & quality teaching with innovative technologies
MT Educare
544
137
169
23.7
& higher government educational spending to boost growth
Earnings boost on back of stable material prices and
Radico Khaitan
1,398
105
119
13.3
favourable pricing environment. Valuation discount to peers
provides additional comfort
Strong brands and distribution network would boost growth
Siyaram Silk Mills
876
934
1,145
22.6
going ahead. Stock currently trades at an inexpensive
valuation.
Structural shift in the Lighting industry towards LED lighting will
Surya Roshni
566
129
183
41.6
drive growth.
Source: Company, Angel Research
Market Outlook
November 6, 2015
Quarterly Bloomberg Brokers Consensus Estimate
Aurobindo Pharma (Consol.) - November 6, 2015
Particulars (` cr)
2QFY16E
2QFY15
y-o-y (%)
1QFY16
q-o-q (%)
Net sales
3,439
2,862
20.2
3,264
5.4
EBITDA
751
637
17.9
724
3.7
EBITDA margin (%)
21.8
22.3
22.2
Net profit
471
372
26.6
432
9.0
Bank of Baroda - November 6, 2015
Particulars (` cr)
2QFY16E
2QFY15
y-o-y (%)
1QFY16
q-o-q (%)
PAT
1,061
1,104
(3.9)
1,052
0.9
Bharat Heavy Electricals Ltd - November 6, 2015
Particulars (` cr)
2QFY16E
2QFY15
y-o-y (%)
1QFY16
q-o-q (%)
Net sales
5,665
6,027
(6.0)
4,500
25.9
EBITDA
242
291
(16.8)
(209)
(215.8)
EBITDA margin (%)
4.3
4.8
-4.6
Net profit
172
125
37.6
34
405.9
Bosch Ltd - November 6, 2015
Particulars (` cr)
2QFY16E
2QFY15
y-o-y (%)
1QFY16
q-o-q (%)
Net sales
2,838
2,457
15.5
2,532
12.1
EBITDA
537
438
22.6
486
10.5
EBITDA margin (%)
18.9
17.8
19.2
Net profit
363
306
18.6
344
5.5
Eicher Motors Ltd - November 6, 2015
Particulars (` cr)
3QCY15E
3QCY14
y-o-y (%)
2QCY15
q-o-q (%)
Net sales
3,080
2,251
36.8
2,872
7.3
EBITDA
486
305
59.2
432
12.6
EBITDA margin (%)
15.8
13.6
15.0
Net profit
267
186
43.5
257
4.0
Mahindra & Mahindra Ltd - November 6, 2015
Particulars (` cr)
2QFY16E
2QFY15
y-o-y (%)
1QFY16
q-o-q (%)
Net sales
8,761
9,908
(11.6)
10,338
(15.3)
EBITDA
1,112
1,009
10.2
1,252
(11.2)
EBITDA margin (%)
12.7
10.2
12.1
Net profit
911
947
(3.8)
852
6.9
Oil & Natural Gas Corp Ltd - November 6, 2015
Particulars (` cr)
2QFY16E
2QFY15
y-o-y (%)
1QFY16
q-o-q (%)
Net sales
20,523
20,426
0.5
22,696
(9.6)
EBITDA
10,831
9,029
20.0
10,583
2.3
EBITDA margin (%)
52.8
44.2
46.6
Net profit
4,660
5,445
(14.4)
5,460
(14.7)
Market Outlook
November 6, 2015
Punjab National Bank - November 6, 2015
Particulars (` cr)
2QFY16E
2QFY15
y-o-y (%)
1QFY16
q-o-q (%)
PAT
890
575
54.7
720
23.6
Reliance Communications Ltd (Consol.) - November 6, 2015
Particulars (` cr)
2QFY16E
2QFY15
y-o-y (%)
1QFY16
q-o-q (%)
Net sales
5,508
5,091
8.2
5,429
1.5
EBITDA
1,862
1,711
8.8
1,827
1.9
EBITDA margin (%)
33.8
33.6
33.7
Net profit
169
212
(20.3)
189
(10.6)
State Bank of India - November 6, 2015
Particulars (` cr)
2QFY16E
2QFY15
y-o-y (%)
1QFY16
q-o-q (%)
PAT
4,581
4,124
11.1
4,713
(2.8)
Tata Motors Ltd (Consol.) - November 6, 2015
Particulars (` cr)
2QFY16E
2QFY15
y-o-y (%)
1QFY16
q-o-q (%)
Net sales
57,729
60,956
(5.3)
60,181
(4.1)
EBITDA
7,646
9,566
(20.1)
8,992
(15.0)
EBITDA margin (%)
13.2
15.7
14.9
Net profit
2,190
3,307
(33.8)
2,788
(21.5)
Tata Chemicals Ltd (Consol.) - November 6, 2015
Particulars (` cr)
2QFY16E
2QFY15
y-o-y (%)
1QFY16
q-o-q (%)
Net sales
5,008
4,742
5.6
4,016
24.7
EBITDA
646
591
9.4
491
31.6
EBITDA margin (%)
12.9
12.5
12.2
Net profit
244
334
(26.9)
207
17.7
Union Bank of India - November 6, 2015
Particulars (` cr)
2QFY16E
2QFY15
y-o-y (%)
1QFY16
q-o-q (%)
PAT
518
371
39.5
519
(0.2)
Sun Pharmaceutical Industries Ltd (Consol.) - November 7, 2015
Particulars (` cr)
2QFY16E
2QFY15
y-o-y (%)
1QFY16
q-o-q (%)
Net sales
6,918
4,751
45.6
6,522
6.1
EBITDA
2,001
2,180
(8.2)
1,165
71.8
EBITDA margin (%)
28.9
45.9
17.9
Net profit
1,272
1,847
(31.1)
680
87.1
Market Outlook
November 6, 2015
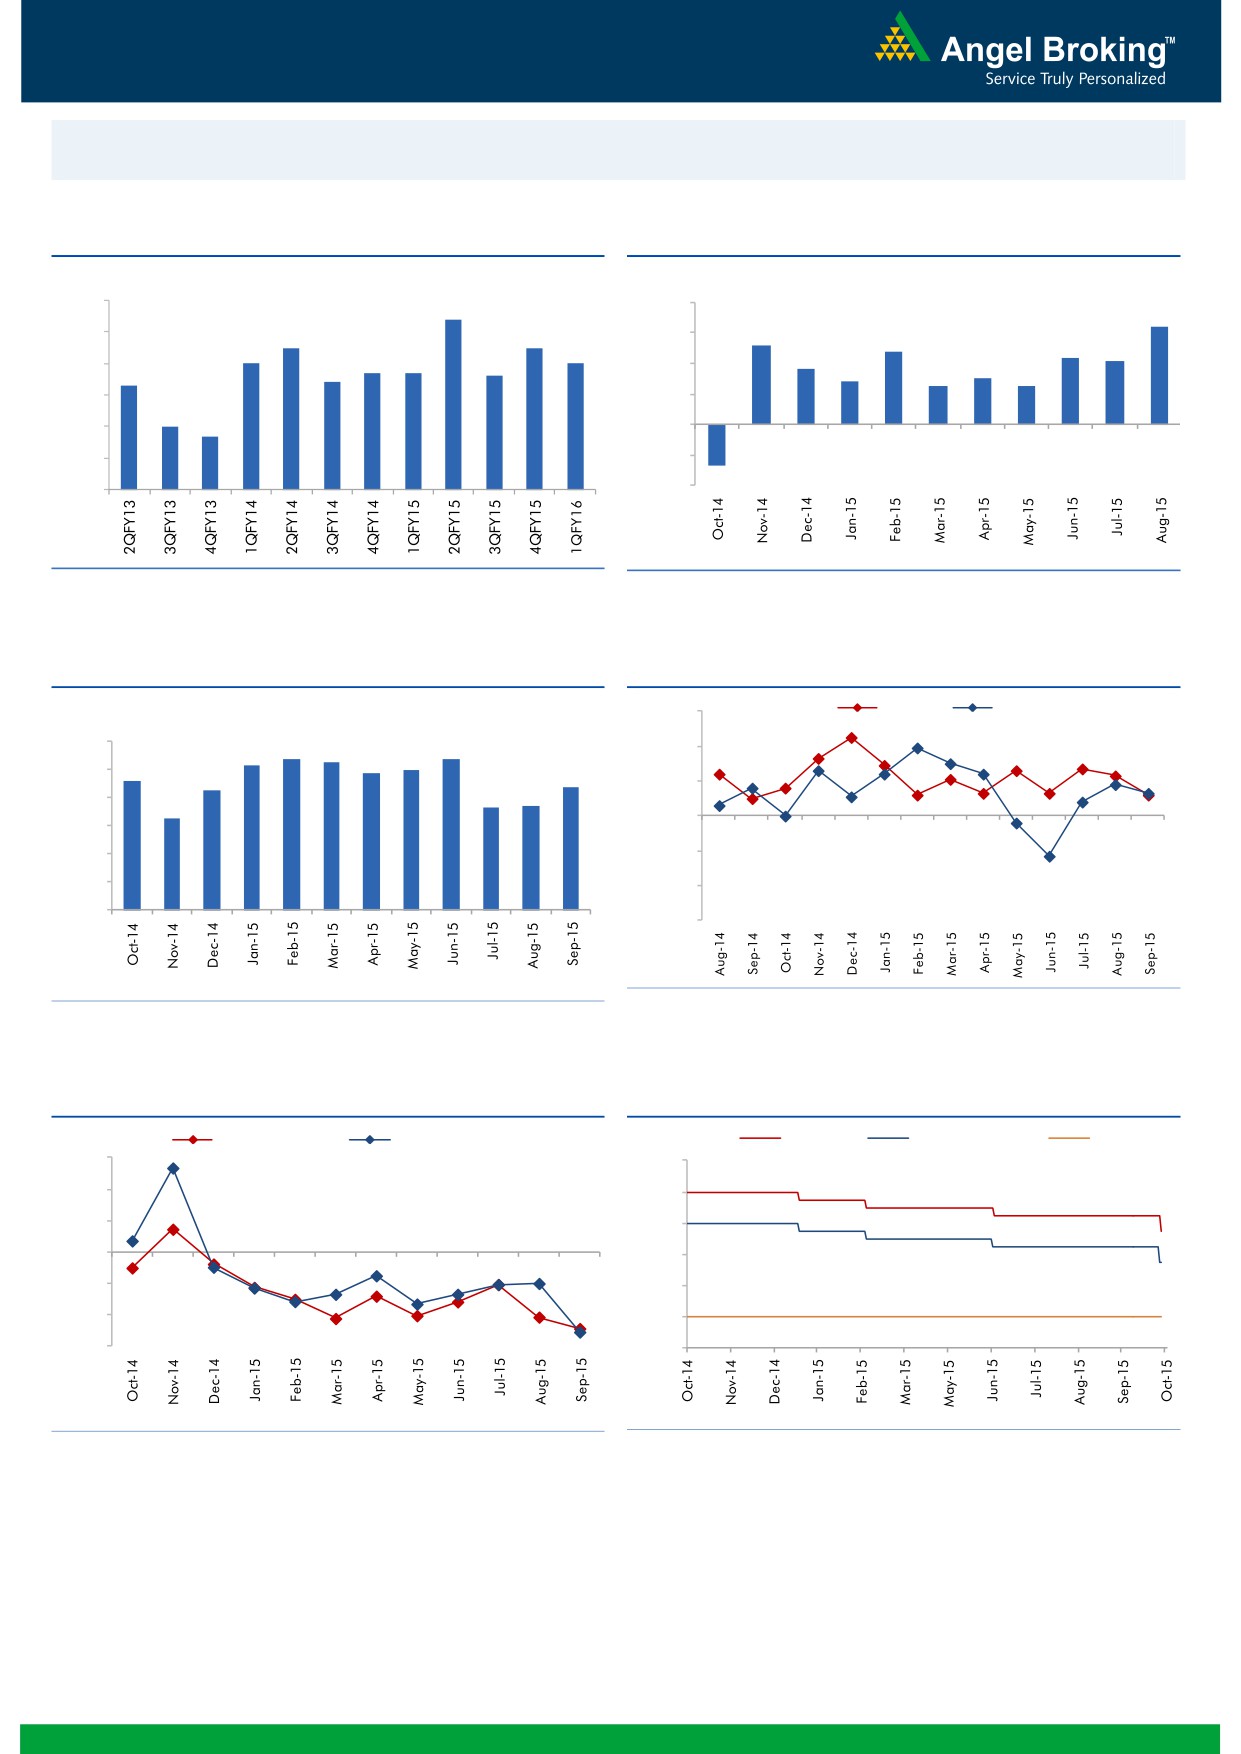
Macro watch
Exhibit 1: Quarterly GDP trends
Exhibit 2: IIP trends
(%)
(%)
9.0
8.4
8.0
6.4
7.5
7.5
5.2
8.0
6.0
4.8
7.0
7.0
4.4
4.1
6.7
6.7
3.6
7.0
6.4
6.6
4.0
2.8
3.0
6.3
2.5
2.5
6.0
2.0
5.0
4.7
5.0
-
4.0
(2.0)
3.0
(4.0)
(2.7)
Source: CSO, Angel Research
Source: MOSPI, Angel Research
Exhibit 3: Monthly CPI inflation trends
Exhibit 4: Manufacturing and services PMI
(%)
56.0
Mfg. PMI
Services PMI
6.0
5.4
5.3
5.4
54.0
5.2
5.0
4.9
4.6
5.0
4.3
4.4
52.0
3.7
3.7
4.0
3.3
50.0
3.0
2.0
48.0
1.0
46.0
-
44.0
Source: Market, Angel Research; Note: Level above 50 indicates expansion
Source: MOSPI, Angel Research
Exhibit 5: Exports and imports growth trends
Exhibit 6: Key policy rates
(%)
Exports yoy growth
Imports yoy growth
(%)
Repo rate
Reverse Repo rate
CRR
30.0
9.00
20.0
8.00
10.0
7.00
0.0
6.00
(10.0)
5.00
(20.0)
4.00
(30.0)
3.00
Source: Bloomberg, Angel Research
Source: RBI, Angel Research
Market Outlook
November 6, 2015
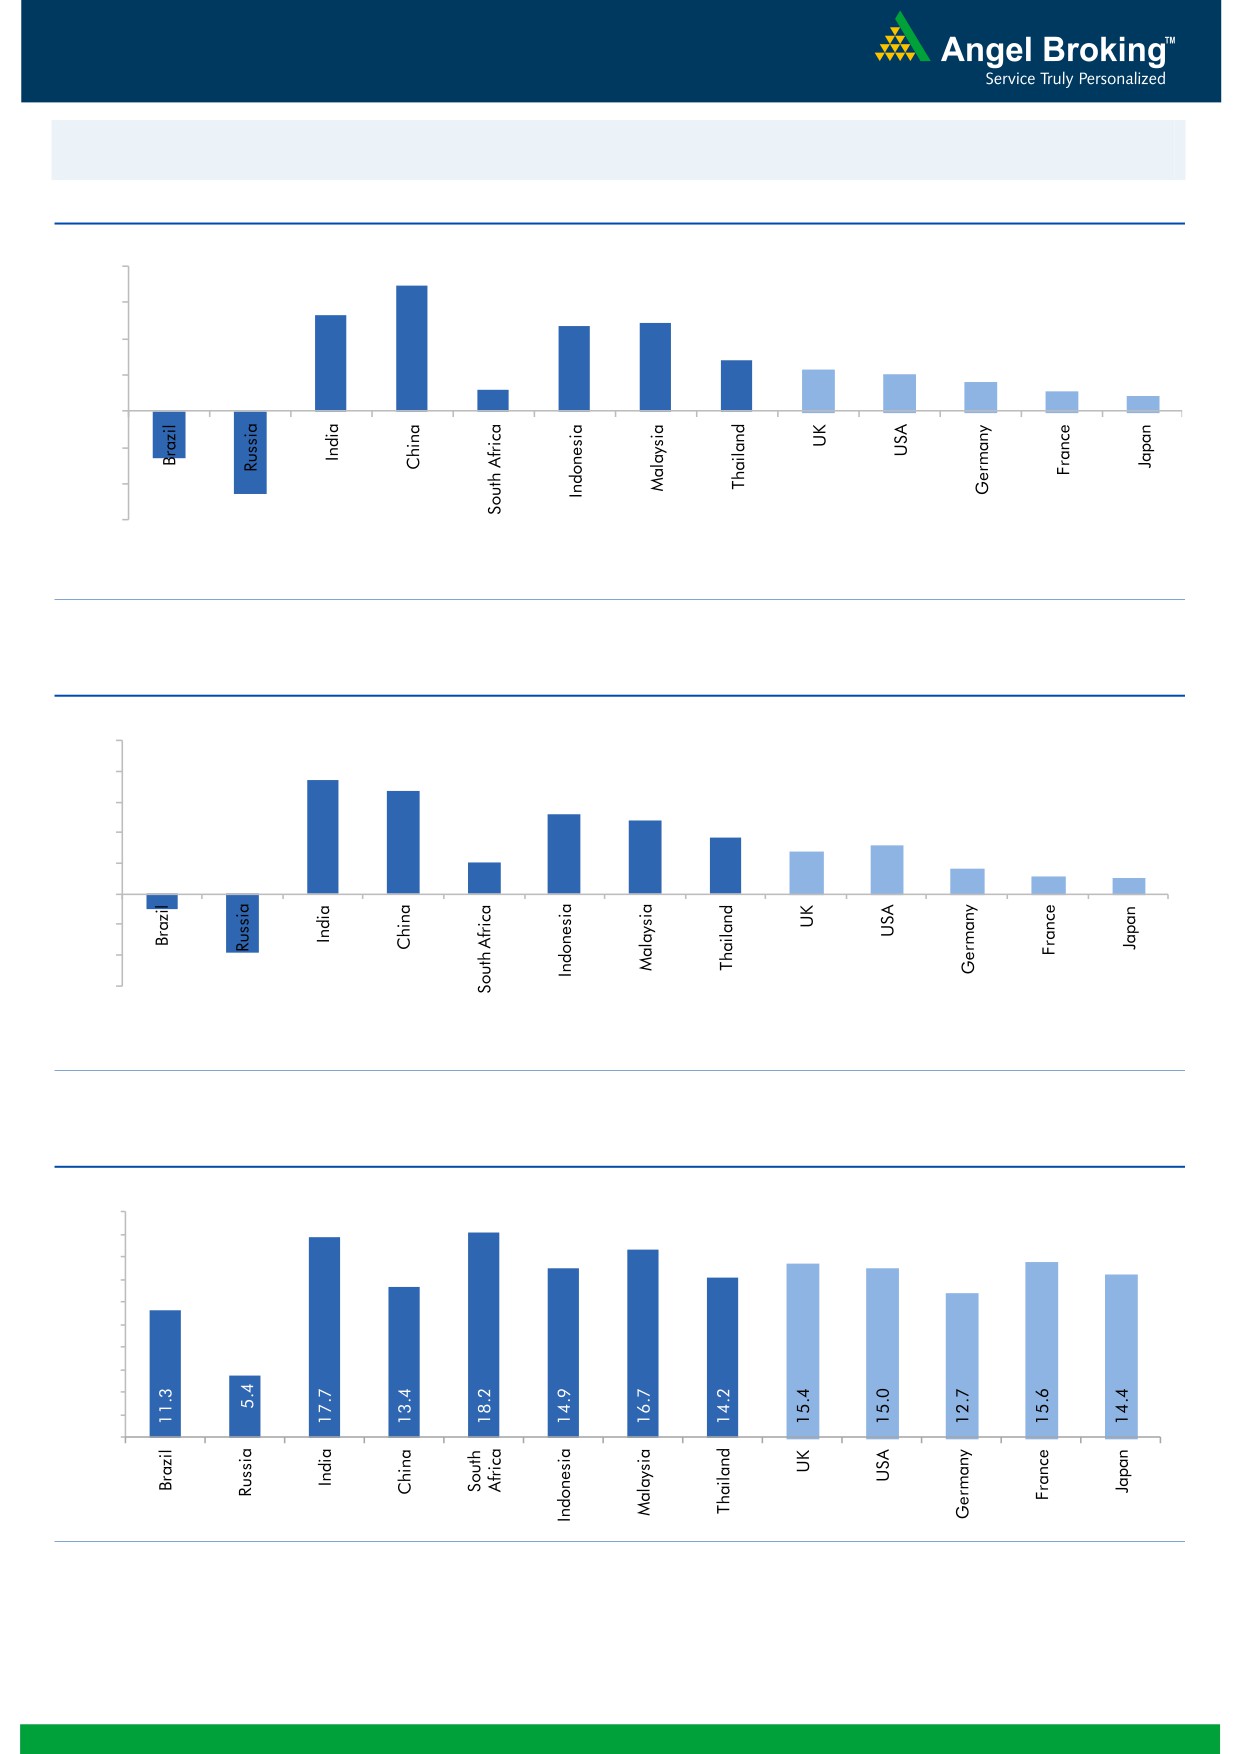
Global watch
Exhibit 1: Latest quarterly GDP Growth (%, yoy) across select developing and developed countries
(%)
8.0
6.9
5.3
6.0
4.9
4.7
4.0
2.8
2.3
2.0
1.6
2.0
1.2
1.1
0.8
(2.6)
-
(2.0)
(4.0)
(4.6)
(6.0)
Source: Bloomberg, Angel Research
Exhibit 2: 2015 GDP Growth projection by IMF (%, yoy) across select developing and developed countries
(%)
10.0
7.5
8.0
6.8
5.2
6.0
4.8
3.7
3.1
4.0
2.7
2.0
1.6
2.0
1.2
1.0
-
(2.0)
(4.0)
(1.0)
(3.8)
(6.0)
Source: IMF, Angel Research
Exhibit 3: One year forward P-E ratio across select developing and developed countries
(x)
20.0
18.0
16.0
14.0
12.0
10.0
8.0
6.0
4.0
2.0
-
Source: IMF, Angel Research
Market Outlook
November 6, 2015
Exhibit 4: Relative performance of indices across globe
Returns (%)
Country
Name of index
Closing price
1M
3M
1YR
Brazil
Bovespa
48,514
1.6
(3.0)
(8.5)
Russia
Micex
1,766
5.7
5.4
18.0
India
Nifty
7,955
(2.2)
(7.4)
(4.6)
China
Shanghai Composite
3,523
15.4
(3.8)
45.6
South Africa
Top 40
48,554
4.1
3.5
9.6
Mexico
Mexbol
45,196
3.8
0.6
0.8
Indonesia
LQ45
787
7.3
4.0
(8.9)
Malaysia
KLCI
1,689
2.5
(0.3)
(8.2)
Thailand
SET 50
913
3.6
(2.6)
(13.1)
USA
Dow Jones
17,863
6.5
2.5
2.2
UK
FTSE
6,365
0.6
(5.7)
(2.8)
Japan
Nikkei
19,116
6.1
8.1
12.9
Germany
DAX
10,888
9.9
(6.0)
16.1
France
CAC
4,980
6.9
(4.1)
17.8
Source: Bloomberg, Angel Research
Stock Watch
November 06, 2015
Company Name
Reco
CMP
Target
Mkt Cap
Sales ( Čcr )
OPM(%)
EPS (Č)
PER(x)
P/BV(x)
RoE(%)
EV/Sales(x)
(Č)
Price ( Č)
( Č cr )
FY16E FY17E
FY16E
FY17E
FY16E
FY17E
FY16E
FY17E
FY16E
FY17E
FY16E
FY17E
FY16E
FY17E
Agri / Agri Chemical
Rallis
Neutral
197
-
3,840
2,075
2,394
14.4
14.4
9.5
11.0
20.8
18.0
4.1
3.6
21.1
21.3
1.9
1.6
United Phosphorus
Buy
439
510
18,824
13,698
15,752
17.6
17.6
32.1
38.5
13.7
11.4
2.7
2.2
21.4
21.3
1.5
1.2
Auto & Auto Ancillary
Ashok Leyland
Buy
87
111
24,702
18,763
22,357
11.1
11.2
3.6
4.8
24.1
18.1
4.5
4.1
18.7
22.6
1.3
1.0
Bajaj Auto
Accumulate
2,414
2,672
69,860
24,115
27,600
21.3
21.0
136.8
157.2
17.7
15.4
5.7
4.8
32.2
31.5
2.5
2.1
Eicher Motors
Buy
17,693
22,900
48,023
11,809
15,609
15.5
17.0
362.9
567.0
48.8
31.2
14.8
11.0
30.1
35.0
4.0
3.0
Hero Motocorp
Neutral
2,639
-
52,690
28,561
31,559
14.7
14.7
151.1
163.2
17.5
16.2
6.8
5.8
38.7
35.6
1.7
1.5
L G Balakrishnan & Bros Neutral
448
-
702
1,254
1,394
11.6
11.8
35.9
41.7
12.5
10.7
1.7
1.5
13.5
13.8
0.7
0.6
Mahindra and Mahindra Neutral
1,260
-
78,267
37,231
41,710
12.4
12.8
48.8
58.3
25.8
21.6
3.6
3.2
14.0
14.9
1.8
1.5
Maruti
Accumulate
4,524
4,960
136,675
57,865
68,104
16.4
16.7
176.3
225.5
25.7
20.1
5.0
4.2
19.4
21.2
2.1
1.8
Minda Industries
Accumulate
704
809
1,116
2,567
2,965
8.0
8.3
46.1
57.8
15.3
12.2
2.6
2.1
16.7
17.3
0.5
0.4
Rane Brake Lining
Accumulate
326
366
258
454
511
11.1
11.4
23.8
28.1
13.7
11.6
1.9
1.8
14.2
15.3
0.7
0.6
Setco Automotive
Neutral
216
-
578
594
741
12.7
13.7
8.4
15.8
25.7
13.7
2.7
2.3
10.4
16.9
1.4
1.2
Tata Motors
Accumulate
404
424
116,585
264,038
297,882
13.8
13.9
34.5
38.9
11.7
10.4
2.0
1.7
17.6
16.8
0.6
0.6
TVS Motor
Accumulate
281
313
13,359
11,845
14,040
7.2
9.0
10.4
17.4
27.0
16.2
6.8
5.2
25.1
32.0
1.1
0.9
Amara Raja Batteries
Buy
881
1,040
15,055
4,892
5,871
17.4
17.6
28.8
37.1
30.6
23.8
7.1
5.7
23.4
24.1
3.0
2.5
Exide Industries
Accumulate
145
162
12,321
6,950
7,784
14.4
14.8
6.6
7.3
22.0
19.9
2.8
2.5
12.6
12.8
1.5
1.3
Apollo Tyres
Neutral
159
-
8,106
12,576
12,978
16.8
16.1
22.3
19.9
7.1
8.0
1.2
1.1
17.2
13.4
0.7
0.8
Ceat
Accumulate
1,026
1,119
4,151
6,041
6,597
14.1
13.7
99.5
111.9
10.3
9.2
2.0
1.7
19.6
18.5
0.8
0.7
JK Tyres
Neutral
96
-
2,179
7,446
7,669
15.2
14.0
19.6
18.4
4.9
5.2
1.2
1.0
25.2
19.5
0.7
0.6
Swaraj Engines
Neutral
944
-
1,173
552
630
14.2
14.7
44.6
54.1
21.2
17.5
4.9
4.5
23.2
25.6
2.0
1.7
Subros
Neutral
83
-
499
1,268
1,488
11.6
11.9
3.7
6.6
22.5
12.6
1.5
1.4
6.8
11.4
0.7
0.6
Indag Rubber
Neutral
201
-
529
283
329
17.0
17.2
13.0
15.4
15.6
13.1
3.4
2.8
21.8
21.6
1.6
1.3
Capital Goods
ACE
Neutral
44
-
440
660
839
4.7
8.2
1.0
3.9
44.5
11.4
1.4
1.2
3.2
11.3
0.8
0.6
BEML
Neutral
1,097
-
4,568
3,277
4,006
6.0
8.9
29.2
64.3
37.6
17.1
2.1
1.9
5.7
11.7
1.5
1.2
BGR Energy
Neutral
111
-
804
3,615
3,181
9.5
9.4
16.7
12.4
6.7
9.0
0.6
0.6
10.0
7.0
0.6
0.8
BHEL
Neutral
194
-
47,532
33,722
35,272
10.8
11.7
10.5
14.2
18.5
13.7
1.4
1.3
7.0
9.0
1.5
1.4
Blue Star
Accumulate
357
387
3,213
3,649
4,209
5.0
5.9
9.2
14.7
39.1
24.3
7.1
6.6
9.1
17.5
1.0
0.8
Crompton Greaves
Buy
169
204
10,620
13,484
14,687
4.9
6.2
4.5
7.1
37.7
23.9
2.7
2.5
7.2
10.8
0.9
0.8
Inox Wind
Buy
383
505
8,497
4,980
5,943
17.0
17.5
26.6
31.6
14.4
12.1
4.3
3.2
35.0
30.0
1.9
1.5
Stock Watch
November 06, 2015
Company Name
Reco
CMP
Target
Mkt Cap
Sales ( Čcr )
OPM(%)
EPS (Č)
PER(x)
P/BV(x)
RoE(%)
EV/Sales(x)
(Č)
Price ( Č)
( Č cr )
FY16E
FY17E
FY16E
FY17E
FY16E
FY17E
FY16E
FY17E
FY16E
FY17E
FY16E
FY17E
FY16E
FY17E
Capital Goods
KEC International
Neutral
136
-
3,498
8,791
9,716
6.1
6.8
5.4
8.2
25.2
16.6
2.5
2.3
10.0
14.0
0.6
0.6
Thermax
Neutral
854
-
10,180
6,413
7,525
7.4
8.5
30.5
39.3
28.0
21.7
4.3
3.8
15.0
17.0
1.6
1.3
Cement
ACC
Buy
1,387
1,630
26,046
13,151
14,757
16.4
18.3
63.9
83.4
21.7
16.6
2.8
2.6
13.3
16.1
1.8
1.5
Ambuja Cements
Accumulate
208
233
32,342
11,564
12,556
19.4
20.7
8.9
10.1
23.4
20.6
2.9
2.8
12.8
13.8
2.4
2.2
India Cements
Buy
78
112
2,404
4,216
4,840
18.0
19.5
4.0
9.9
19.6
7.9
0.8
0.7
4.0
9.5
0.9
0.7
JK Cement
Accumulate
651
744
4,549
3,661
4,742
10.1
15.8
18.0
61.0
36.2
10.7
2.6
2.3
7.5
22.9
1.7
1.3
J K Lakshmi Cement
Buy
359
430
4,224
2,947
3,616
16.7
19.9
11.5
27.2
31.2
13.2
3.0
2.6
9.8
20.8
1.8
1.5
Mangalam Cements
Neutral
217
-
580
1,053
1,347
10.5
13.3
8.4
26.0
25.9
8.4
1.1
1.0
4.3
12.5
0.9
0.7
Orient Cement
Accumulate
166
183
3,410
1,854
2,524
21.2
22.2
7.7
11.1
21.6
15.0
3.1
2.7
13.3
15.7
2.6
1.8
Ramco Cements
Neutral
367
-
8,747
4,036
4,545
20.8
21.3
15.1
18.8
24.3
19.5
3.0
2.6
12.9
14.3
2.7
2.3
Shree Cement^
Neutral
11,993
-
41,780
7,150
8,742
26.7
28.6
228.0
345.5
52.6
34.7
7.7
6.5
15.7
20.3
5.6
4.5
UltraTech Cement
Buy
2,834
3,282
77,780
25,021
30,023
19.1
21.6
89.0
132.0
31.9
21.5
3.7
3.2
12.2
15.9
3.2
2.7
Construction
ITNL
Neutral
91
-
2,989
7,360
8,825
34.0
35.9
1.0
5.0
90.9
18.2
0.4
0.4
0.3
1.4
3.8
3.7
KNR Constructions
Neutral
578
-
1,624
915
1,479
14.3
13.9
20.3
37.2
28.5
15.5
2.6
2.3
9.6
15.6
1.9
1.2
Larsen & Toubro
Buy
1,369
1,646
127,440
64,148
73,241
11.5
11.7
62.0
66.0
22.1
20.8
2.3
2.1
13.4
14.0
2.2
1.9
Gujarat Pipavav Port
Neutral
163
-
7,887
629
684
51.0
52.2
6.4
5.9
25.5
27.7
3.4
3.1
15.9
12.7
12.2
11.0
MBL Infrastructures
Buy
207
285
856
2,313
2,797
12.2
14.6
19.0
20.0
10.9
10.3
1.1
1.0
11.3
10.6
1.1
1.0
Nagarjuna Const.
Neutral
76
-
4,197
7,892
8,842
8.3
9.1
2.4
5.3
31.5
14.3
1.3
1.2
4.2
8.6
0.8
0.7
PNC Infratech
Neutral
519
-
2,663
1,798
2,132
13.2
13.5
22.0
30.0
23.6
17.3
2.1
1.9
11.5
11.4
1.6
1.3
Simplex Infra
Neutral
312
-
1,546
6,241
7,008
10.4
10.7
20.0
36.0
15.6
8.7
1.3
1.2
6.8
11.1
0.8
0.6
Financials
Allahabad Bank
Neutral
75
-
4,474
8,332
9,259
2.8
2.8
21.0
25.6
3.5
2.9
0.4
0.3
9.8
10.9
-
-
Axis Bank
Buy
465
630
110,475
26,473
31,527
3.5
3.6
35.7
43.5
13.0
10.7
2.5
2.2
17.9
18.9
-
-
Bank of Baroda
Neutral
160
-
36,751
19,105
21,474
2.0
2.0
19.1
24.8
8.3
6.5
0.9
0.8
10.2
12.1
-
-
Bank of India
Neutral
132
-
10,461
15,972
17,271
1.9
2.0
15.3
33.4
8.6
4.0
0.4
0.3
3.6
7.6
-
-
Canara Bank
Neutral
270
-
14,661
15,251
16,725
2.0
2.0
59.3
68.6
4.6
3.9
0.5
0.4
10.1
10.7
-
-
Dena Bank
Neutral
42
-
2,357
3,440
3,840
2.1
2.3
7.3
10.0
5.8
4.2
0.4
0.4
6.1
7.9
-
-
Federal Bank
Neutral
55
-
9,363
3,477
3,999
3.0
3.0
5.0
6.2
10.9
8.7
1.1
1.0
10.6
11.9
-
-
HDFC
Neutral
1,208
-
190,607
10,358
11,852
3.3
3.3
41.1
47.0
29.4
25.7
5.6
5.1
24.7
24.9
-
-
HDFC Bank
Buy
1,079
1,262
271,751
38,309
47,302
4.3
4.3
49.3
61.1
21.9
17.7
3.8
3.3
18.5
19.7
-
-
Stock Watch
November 06, 2015
Company Name
Reco
CMP
Target
Mkt Cap
Sales ( Čcr )
OPM(%)
EPS (Č)
PER(x)
P/BV(x)
RoE(%)
EV/Sales(x)
(Č)
Price ( Č)
( Č cr )
FY16E
FY17E
FY16E
FY17E
FY16E
FY17E
FY16E
FY17E
FY16E
FY17E
FY16E
FY17E
FY16E
FY17E
Financials
ICICI Bank
Buy
270
348
156,894
35,168
40,517
3.4
3.4
21.4
25.2
12.6
10.7
2.2
1.8
14.7
15.2
-
-
IDBI Bank
Neutral
85
-
13,594
9,625
10,455
1.8
1.8
8.5
14.2
9.9
6.0
0.6
0.6
5.9
9.3
-
-
Indian Bank
Neutral
127
-
6,117
6,160
6,858
2.5
2.5
24.5
29.8
5.2
4.3
0.4
0.4
7.7
8.6
-
-
LIC Housing Finance
Buy
461
571
23,280
3,101
3,745
2.5
2.5
33.0
40.2
14.0
11.5
2.6
2.2
19.7
20.5
-
-
Oriental Bank
Neutral
141
-
4,235
7,643
8,373
2.4
2.4
37.2
45.4
3.8
3.1
0.3
0.3
8.2
9.4
-
-
Punjab Natl.Bank
Neutral
130
-
25,448
23,638
26,557
2.8
2.8
17.9
27.2
7.3
4.8
0.7
0.6
8.5
12.0
-
-
South Ind.Bank
Neutral
21
-
2,775
1,965
2,185
2.5
2.5
2.5
3.3
8.3
6.2
0.8
0.7
9.5
11.7
-
-
St Bk of India
Buy
234
295
181,804
82,520
93,299
2.7
2.8
20.0
24.5
11.7
9.6
1.3
1.1
11.5
12.8
-
-
Union Bank
Neutral
162
-
11,137
12,646
14,129
2.3
2.4
31.0
39.1
5.2
4.2
0.6
0.5
9.8
11.4
-
-
Vijaya Bank
Neutral
35
-
2,968
3,536
3,827
1.9
1.9
5.5
6.7
6.3
5.2
0.5
0.5
7.8
8.8
-
-
Yes Bank
Buy
761
914
31,883
7,228
9,043
3.2
3.3
57.7
69.4
13.2
11.0
2.4
2.0
19.1
19.6
-
-
FMCG
Asian Paints
Neutral
807
-
77,364
16,553
19,160
16.0
16.2
17.7
21.5
45.6
37.5
12.1
10.9
29.4
31.2
4.5
3.9
Britannia
Neutral
3,180
-
38,150
8,065
9,395
9.6
10.2
47.2
65.5
67.4
48.6
22.4
21.2
38.3
41.2
4.6
3.9
Colgate
Neutral
939
-
25,549
4,836
5,490
19.5
19.7
48.5
53.2
19.4
17.7
14.2
12.4
99.8
97.5
5.2
4.6
Dabur India
Neutral
266
-
46,705
9,370
10,265
17.1
17.2
7.3
8.1
36.2
32.8
10.9
8.9
33.7
30.6
4.9
4.5
GlaxoSmith Con*
Neutral
5,856
-
24,628
4,919
5,742
17.2
17.4
168.3
191.2
34.8
30.6
9.9
8.4
28.8
28.9
4.6
3.9
Godrej Consumer
Neutral
1,248
-
42,504
10,168
12,886
16.1
16.1
32.1
38.4
38.9
32.5
7.9
7.3
19.7
21.0
4.3
3.4
HUL
Neutral
804
-
173,921
34,940
38,957
17.5
17.7
20.8
24.7
38.6
32.5
43.0
34.4
110.5
114.2
4.8
4.3
ITC
Buy
338
409
270,934
41,068
45,068
37.8
37.4
13.9
15.9
24.3
21.2
8.1
7.2
34.1
33.8
6.2
5.6
Marico
Neutral
404
-
26,039
6,551
7,766
15.7
16.0
10.4
12.5
38.9
32.3
11.3
9.4
33.2
32.4
3.9
3.3
Nestle*
Accumulate
6,182
6,646
59,602
11,291
12,847
22.2
22.3
158.9
184.6
38.9
33.5
20.3
18.3
55.0
57.3
5.1
4.5
Tata Global
Accumulate
128
144
8,066
8,635
9,072
9.8
9.9
6.5
7.6
19.7
16.8
2.0
1.9
6.8
7.4
0.9
0.8
IT
HCL Tech^
Buy
877
1,132
123,367
42,038
47,503
23.2
23.5
55.8
62.9
15.7
14.0
3.6
2.8
23.0
19.8
2.5
2.0
Infosys
Buy
1,122
1,306
257,821
60,250
66,999
28.0
28.0
58.3
63.7
19.3
17.6
4.0
3.5
20.9
19.7
3.6
3.1
TCS
Buy
2,491
3,165
490,784
111,274
126,852
28.4
28.7
125.4
143.9
19.9
17.3
7.9
7.2
39.9
42.2
4.0
3.5
Tech Mahindra
Buy
536
646
51,526
25,566
28,890
16.0
17.0
26.3
31.9
20.4
16.8
3.7
3.1
17.9
18.6
1.8
1.5
Wipro
Buy
572
719
141,290
52,414
58,704
23.7
23.8
38.4
42.3
14.9
13.5
2.9
2.6
19.5
18.0
2.3
1.9
Media
D B Corp
Accumulate
312
356
5,724
2,241
2,495
27.8
27.9
21.8
25.6
14.3
12.2
3.7
3.3
26.7
28.5
2.5
2.2
HT Media
Neutral
78
-
1,815
2,495
2,603
11.2
11.2
7.3
8.6
10.7
9.1
0.9
0.8
7.4
8.1
0.2
0.2
Stock Watch
November 06, 2015
Company Name
Reco
CMP
Target
Mkt Cap
Sales ( Čcr )
OPM(%)
EPS (Č)
PER(x)
P/BV(x)
RoE(%)
EV/Sales(x)
(Č)
Price ( Č)
( Č cr )
FY16E FY17E
FY16E
FY17E
FY16E
FY17E
FY16E
FY17E
FY16E
FY17E
FY16E
FY17E
FY16E
FY17E
Media
Jagran Prakashan
Buy
143
169
4,683
2,170
2,355
27.0
27.6
12.8
10.3
11.2
13.9
3.1
2.9
21.8
19.4
1.9
1.6
Sun TV Network
Neutral
382
-
15,060
2,779
3,196
70.2
70.5
22.8
27.3
16.8
14.0
4.1
3.7
26.7
28.3
5.2
4.5
Hindustan Media
Neutral
273
-
2,004
920
1,031
20.0
20.0
19.2
20.9
14.2
13.1
2.3
2.0
16.4
15.3
1.7
1.5
Ventures
Metals & Mining
Coal India
Buy
337
400
213,051
77,508
85,330
21.4
23.7
24.8
27.6
13.6
12.2
5.2
5.0
38.6
41.6
2.1
1.8
Hind. Zinc
Accumulate
155
175
65,514
14,641
14,026
50.4
50.4
17.7
16.0
8.8
9.7
1.3
1.2
16.2
13.2
2.1
1.9
Hindalco
Neutral
81
-
16,737
104,356
111,186
8.7
9.5
6.7
11.1
12.1
7.3
0.4
0.4
3.5
5.9
0.7
0.6
JSW Steel
Neutral
872
-
21,071
42,308
45,147
16.4
20.7
(10.3)
49.5
17.6
1.0
0.9
(1.0)
5.6
1.5
1.4
NMDC
Neutral
94
-
37,249
8,237
10,893
46.6
44.5
10.0
11.7
9.5
8.1
1.1
0.9
12.5
13.0
4.3
3.3
SAIL
Neutral
49
-
20,258
45,915
53,954
7.2
10.5
1.5
4.4
32.6
11.2
0.5
0.5
2.3
4.1
1.1
1.0
Vedanta
Neutral
94
-
27,898
71,445
81,910
26.2
26.3
12.9
19.2
7.3
4.9
0.5
0.5
7.2
8.9
0.8
0.6
Tata Steel
Neutral
226
-
21,911
126,760
137,307
8.9
11.3
6.4
23.1
35.5
9.8
0.7
0.7
2.0
7.1
0.8
0.7
Oil & Gas
Cairn India
Neutral
150
-
28,179
11,323
12,490
49.4
51.0
20.7
20.7
7.3
7.3
0.5
0.5
6.4
6.1
1.6
0.9
GAIL
Neutral
295
-
37,445
64,856
70,933
9.1
9.6
24.0
28.9
12.3
10.2
1.1
1.0
8.8
9.6
0.8
0.7
ONGC
Neutral
251
-
214,828
154,564
167,321
36.8
37.4
28.6
32.5
8.8
7.7
1.1
1.0
12.7
13.5
1.6
1.5
Petronet LNG
Neutral
201
-
15,094
29,691
31,188
5.8
6.2
12.8
13.4
15.7
15.0
2.4
2.1
15.8
14.8
0.6
0.5
Indian Oil Corp
Accumulate
409
455
99,218
359,607
402,760
5.9
6.1
42.5
48.7
9.6
8.4
1.3
1.1
14.1
14.4
0.4
0.3
Reliance Industries
Accumulate
937
1,050
303,392
304,775
344,392
12.6
13.4
91.3
102.6
10.3
9.1
1.2
1.0
11.8
12.0
0.9
0.8
Pharmaceuticals
Alembic Pharma
Neutral
675
-
12,729
2,601
3,115
21.2
20.2
20.8
23.9
32.5
28.3
10.4
7.9
37.2
31.8
4.9
4.0
Aurobindo Pharma
Accumulate
820
872
47,906
14,923
17,162
23.0
23.0
38.2
43.6
21.5
18.8
6.6
5.0
36.0
30.2
3.6
3.0
Aventis*
Neutral
4,276
-
9,848
2,082
2,371
17.4
20.8
118.2
151.5
36.2
28.2
5.3
4.3
19.9
25.5
4.4
3.7
Cadila Healthcare
Neutral
429
-
43,934
10,224
11,840
21.0
22.0
14.6
17.6
29.4
24.4
8.1
6.3
30.8
29.0
4.4
3.7
Cipla
Neutral
659
-
52,884
14,359
16,884
21.3
19.7
28.4
30.5
23.2
21.6
4.1
3.5
19.3
17.5
3.7
3.1
Dr Reddy's
Neutral
4,253
-
72,514
18,213
21,214
22.6
22.7
163.0
192.5
26.1
22.1
5.4
4.4
22.5
20.0
3.9
3.3
Dishman Pharma
Neutral
402
-
3,241
1,716
1,888
20.2
20.2
16.3
21.6
24.6
18.6
2.3
2.1
9.7
11.7
2.1
1.7
GSK Pharma*
Neutral
3,191
-
27,025
2,870
3,158
20.0
22.1
59.5
68.3
53.6
46.7
15.8
16.3
28.5
34.3
8.9
8.2
Indoco Remedies
Neutral
310
-
2,857
1,088
1,262
18.2
18.2
13.1
15.5
23.7
20.0
4.6
3.9
21.2
21.1
2.7
2.3
Ipca labs
Buy
733
900
9,253
3,363
3,909
12.9
18.6
13.4
28.0
54.7
26.2
7.1
5.7
7.4
14.0
3.0
2.6
Lupin
Neutral
1,838
-
82,741
14,864
17,244
26.9
26.9
62.1
71.1
29.6
25.9
7.2
5.7
27.4
24.6
5.3
4.4
Sun Pharma
Buy
816
950
196,329
28,163
32,610
25.8
30.7
17.4
26.9
46.9
30.3
4.5
3.9
13.0
16.6
6.4
5.3
Stock Watch
November 06, 2015
Company Name
Reco
CMP
Target
Mkt Cap
Sales ( Čcr )
OPM(%)
EPS (Č)
PER(x)
P/BV(x)
RoE(%)
EV/Sales(x)
(Č)
Price ( Č)
( Č cr )
FY16E FY17E
FY16E
FY17E
FY16E
FY17E
FY16E
FY17E
FY16E
FY17E
FY16E
FY17E
FY16E
FY17E
Power
Tata Power
Neutral
69
-
18,527
35,923
37,402
22.6
22.8
4.1
5.2
16.9
13.3
1.3
1.2
7.5
9.3
1.5
1.3
NTPC
Buy
136
157
112,138
87,064
98,846
23.5
23.5
11.7
13.2
11.6
10.3
1.3
1.2
11.4
12.1
2.3
2.1
Power Grid
Buy
131
170
68,403
20,702
23,361
86.7
86.4
12.1
13.2
10.8
9.9
1.6
1.4
15.6
15.1
8.2
7.7
Telecom
Bharti Airtel
Neutral
336
-
134,273
101,748
109,191
32.1
31.7
12.0
12.5
28.0
26.9
1.9
1.8
6.9
6.7
2.0
1.8
Idea Cellular
Neutral
139
-
50,017
34,282
36,941
32.0
31.5
5.9
6.2
23.6
22.4
2.2
2.0
9.9
9.3
2.0
1.9
zOthers
Abbott India
Neutral
5,464
-
11,610
2,715
3,153
14.5
14.1
134.3
152.2
40.7
35.9
10.2
8.4
27.4
25.6
4.0
3.4
Bajaj Electricals
Buy
241
341
2,429
4,719
5,287
5.2
5.8
8.6
12.7
28.1
19.0
3.2
2.8
11.4
14.8
0.5
0.5
Finolex Cables
Neutral
242
-
3,703
2,728
3,036
10.8
11.0
14.4
16.8
16.8
14.5
2.6
2.2
15.2
15.3
1.1
0.9
Goodyear India*
Accumulate
573
655
1,321
1,953
1,766
12.4
12.0
67.4
59.6
8.5
9.6
2.1
1.8
27.7
20.2
0.5
0.4
Hitachi
Neutral
1,323
-
3,596
1,779
2,081
7.8
8.8
21.8
33.4
60.7
39.6
9.8
7.9
17.4
22.1
2.1
1.8
Jyothy Laboratories
Neutral
303
-
5,493
1,620
1,847
11.5
11.5
7.3
8.5
41.6
35.8
5.4
5.0
13.3
14.4
3.3
2.8
MRF
Buy
38,531
45,575
16,342
20,316
14,488
21.4
21.1
5,488.0
3,798.0
7.0
10.2
2.4
1.9
41.1
21.2
0.8
1.0
Page Industries
Neutral
13,610
-
15,180
1,929
2,450
19.8
20.1
229.9
299.0
59.2
45.5
26.1
18.2
52.1
47.1
7.9
6.2
Relaxo Footwears
Neutral
522
-
6,259
1,767
2,152
12.3
12.5
19.3
25.1
27.1
20.8
6.7
5.1
27.7
27.8
3.6
2.9
Siyaram Silk Mills
Buy
934
1,145
876
1,636
1,815
11.5
11.5
89.9
104.1
10.4
9.0
1.7
1.5
17.9
17.8
0.7
0.6
Styrolution ABS India*
Neutral
735
-
1,293
1,271
1,440
8.6
9.2
32.0
41.1
23.0
17.9
2.3
2.1
10.7
12.4
1.0
0.9
Tree House
Buy
268
347
1,135
259
324
56.8
56.8
17.0
21.7
15.8
12.4
1.6
1.4
10.1
11.5
4.3
3.6
TVS Srichakra
Buy
2,791
3,210
2,137
2,127
2,388
15.2
14.9
237.7
267.5
11.7
10.4
5.0
3.6
51.7
39.8
1.1
0.9
HSIL
Accumulate
280
302
2,024
2,182
2,404
16.3
16.5
15.8
18.9
17.7
14.8
1.4
1.3
8.4
9.4
1.3
1.1
Kirloskar Engines India
Neutral
262
-
3,794
2,634
3,252
10.1
12.0
10.9
17.4
24.1
15.0
2.7
2.4
11.4
16.8
1.1
0.8
Ltd
M M Forgings
Buy
526
670
635
541
634
21.7
21.4
47.8
55.9
11.0
9.4
2.2
1.8
21.8
20.9
1.3
1.1
Banco Products (India)
Neutral
131
-
938
1,208
1,353
11.0
12.3
10.8
14.5
12.2
9.1
1.4
1.2
11.9
14.5
0.7
0.6
Competent Automobiles Neutral
138
-
85
1,007
1,114
3.1
3.1
23.7
28.2
5.8
4.9
0.8
0.7
13.9
14.6
0.1
0.1
Nilkamal
Neutral
1,082
-
1,615
1,948
2,147
10.6
10.3
60.0
67.0
18.0
16.2
2.8
2.4
16.8
16.1
0.9
0.8
Visaka Industries
Buy
130
166
207
1,158
1,272
8.6
9.5
23.7
32.7
5.5
4.0
0.6
0.5
10.1
12.5
0.3
0.3
Transport Corporation of
Neutral
274
-
2,087
2,830
3,350
8.8
9.0
14.4
18.3
19.1
15.0
2.9
2.6
15.4
17.1
0.9
0.7
India
Elecon Engineering
Neutral
78
-
851
1,452
1,596
14.0
14.7
4.4
6.2
17.7
12.5
1.5
1.3
8.6
11.2
0.9
0.7
Surya Roshni
Buy
129
183
566
2,992
3,223
8.3
8.5
14.7
18.3
8.8
7.1
0.8
0.7
9.7
11.0
0.5
0.4
MT Educare
Buy
137
169
544
286
366
18.3
17.7
7.7
9.4
17.7
14.6
3.7
3.3
20.2
21.1
1.8
1.4
Stock Watch
November 06, 2015
Company Name
Reco
CMP
Target Mkt Cap
Sales ( Čcr )
OPM(%)
EPS (Č)
PER(x)
P/BV(x)
RoE(%)
EV/Sales(x)
(Č)
Price ( Č)
( Č cr )
FY16E FY17E FY16E FY17E FY16E FY17E FY16E FY17E FY16E FY17E FY16E FY17E FY16E FY17E
zOthers
Radico Khaitan
Accumulate
105
119
1,398
1,565
1,687
11.9
12.4
5.4
6.6
19.4
16.0
1.6
1.4
8.0
9.0
1.4
1.3
Garware Wall Ropes
Buy
345
423
755
875
983
10.4
10.6
23.1
27.8
14.9
12.4
2.1
1.8
14.1
14.8
0.9
0.7
Wonderla Holidays
Neutral
330
-
1,864
206
308
44.0
43.6
9.0
12.9
36.7
25.6
5.0
4.5
13.7
17.8
9.0
6.0
Linc Pen & Plastics
Accumulate
168
185
248
340
371
8.3
8.9
10.8
13.2
15.6
12.7
2.5
2.2
16.0
17.1
0.8
0.7
The Byke Hospitality
Buy
154
181
619
222
287
20.5
20.5
5.6
7.6
27.4
20.4
5.2
4.2
18.9
20.8
2.8
2.2
Source: Company, Angel Research; Note: *December year end; #September year end; &October year end; Price as on November 05, 2015
Market Outlook
November 06, 2015
Research Team Tel: 022 - 39357800
DISCLAIMER
Angel Broking Private Limited (hereinafter referred to as “Angel”) is a registered Member of National Stock Exchange of India Limited,
Bombay Stock Exchange Limited and Metropolitian Stock Exchange of India Limited. It is also registered as a Depository Participant with
CDSL and Portfolio Manager with SEBI. It also has registration with AMFI as a Mutual Fund Distributor. Angel Broking Private Limited is a
registered entity with SEBI for Research Analyst in terms of SEBI (Research Analyst) Regulations, 2014 vide registration number
INH000000164. Angel or its associates has not been debarred/ suspended by SEBI or any other regulatory authority for accessing
/dealing in securities Market. Angel or its associates including its relatives/analyst do not hold any financial interest/beneficial ownership
of more than 1% in the company covered by Analyst. Angel or its associates/analyst has not received any compensation / managed or co
-managed public offering of securities of the company covered by Analyst during the past twelve months. Angel/analyst has not served as
an officer, director or employee of company covered by Analyst and has not been engaged in market making activity of the company
covered by Analyst.
This document is solely for the personal information of the recipient, and must not be singularly used as the basis of any investment
decision. Nothing in this document should be construed as investment or financial advice. Each recipient of this document should make
such investigations as they deem necessary to arrive at an independent evaluation of an investment in the securities of the companies
referred to in this document (including the merits and risks involved), and should consult their own advisors to determine the merits and
risks of such an investment.
Reports based on technical and derivative analysis center on studying charts of a stock's price movement, outstanding positions and
trading volume, as opposed to focusing on a company's fundamentals and, as such, may not match with a report on a company's
fundamentals.
The information in this document has been printed on the basis of publicly available information, internal data and other reliable sources
believed to be true, but we do not represent that it is accurate or complete and it should not be relied on as such, as this document is for
general guidance only. Angel Broking Pvt. Limited or any of its affiliates/ group companies shall not be in any way responsible for any
loss or damage that may arise to any person from any inadvertent error in the information contained in this report. Angel Broking Pvt.
Limited has not independently verified all the information contained within this document. Accordingly, we cannot testify, nor make any
representation or warranty, express or implied, to the accuracy, contents or data contained within this document. While Angel Broking
Pvt. Limited endeavors to update on a reasonable basis the information discussed in this material, there may be regulatory, compliance,
or other reasons that prevent us from doing so.
This document is being supplied to you solely for your information, and its contents, information or data may not be reproduced,
redistributed or passed on, directly or indirectly.
Neither Angel Broking Pvt. Limited, nor its directors, employees or affiliates shall be liable for any loss or damage that may arise from or
in connection with the use of this information.
Note: Please refer to the important ‘Stock Holding Disclosure' report on the Angel website (Research Section). Also, please refer to the
latest update on respective stocks for the disclosure status in respect of those stocks. Angel Broking Pvt. Limited and its affiliates may have
investment positions in the stocks recommended in this report.