Market Outlook
April 6, 2016
Market Cues
Domestic Indices
Chg (%)
(Pts)
(Close)
Indian market is expected to open on a flat note tracking the SGX Nifty and Asian
BSE Sensex
(2.0)
(516)
24,884
markets.
Nifty
(2.0)
(156)
7,603
U.S. markets came under pressure for a second straight day as the recent rally lost
Mid Cap
(1.5)
(157)
10,511
steam amid investor concerns about the coming earnings season and renewed
Small Cap
(1.4)
(150)
10,546
selling in the oil patch.
Bankex
(3.2)
(592)
17,858
The European markets ended Tuesday's session firmly in negative territory. The
markets got off to a weak start due to falling crude oil prices and the disappointing
Global Indices
Chg (%)
(Pts)
(Close)
performance of the Asian markets. The mood among investors soured further after
Dow Jones
(0.8)
(134)
17,603
the release of some weaker than expected economic data.
Nasdaq
(1.0)
(48)
4,844
Indian markets fell sharply on Tuesday, tracking weak cues from Asia and Europe
FTSE
(1.2)
(73)
6,091
as oil prices hit one-month low and a slew of European data rekindled growth
Nikkei
(2.4)
(390)
15,733
worries.
Hang Seng
(1.6)
(322)
20,177
News & Result Analysis
Shanghai Com
1.4
44
3,053
Lupin Launches Generic Intermezzo® Sublingual Tablets in the US
Mahindra launches tractor YUVO
Advances / Declines
BSE
NSE
Detailed analysis on Pg2
Advances
870
435
Investor’s Ready Reckoner
Declines
1,667
1,122
Key Domestic & Global Indicators
Unchanged
117
51
Stock Watch: Latest investment recommendations on 150+ stocks
Refer Pg5 onwards
Volumes (` Cr)
BSE
2,853
Top Picks
CMP
Target
Upside
NSE
16,425
Company
Sector
Rating
(`)
(`)
(%)
Amara Raja
Auto & Auto Ancillary
Buy
887
1,040
17.2
Net Inflows (` Cr)
Net
Mtd
Ytd
HCL Tech
IT
Buy
844
1,038
23.0
FII
405
405
(11,409)
LIC Housing
Financials
Buy
468
592
26.6
MFs
111
(7,943)
67,174
Bharat Electronics
Capital Goods
Buy
1,181
1,414
19.7
Navkar Corporation Others
Buy
174
265
51.9
More Top Picks on Pg3
Top Gainers
Price (`)
Chg (%)
Biocon
527
7.4
Key Upcoming Events
L&Tfh
69
7.0
Previous
Consensus
Date
Region
Event Description
Reading
Expectations
Atul
1,595
3.5
Apr 7 US
Initial Jobless claims
276.00
270.00
Sanofi
4,234
3.5
Apr 8 India
Import (yoy %)
5.00
-
Ajantpharm
1,416
3.4
Apr 8 India
Export (yoy %)
5.66
-
Apr 8 UK
Industrial Production (YoY)
0.20
-
6.(6.(
Top Losers
Price (`)
Chg (%)
More Events on Pg4
Adanient
74
(7.5)
Ibrealest
53
(6.4)
Dhfl
190
(6.2)
Orientbank
90
(6.2)
Adaniports
227
(6.2)
As on April 05, 2016
Market Outlook
April 6, 2016
Lupin Launches Generic Intermezzo® Sublingual Tablets in the
US
Pharma Major Lupin Limited announced today that its US subsidiary, Lupin
Pharmaceuticals Inc. (collectively Lupin) has launched the first product from its
GAVIS pipeline, Zolpidem Sublingual Tablets, 1.75 mg & 3.5 mg to market a
generic equivalent of Purdue Pharma L.P’s Intermezzo® Sublingual Tablets, 1.75
mg & 3.5 mg, having received final approval from the United States Food & Drug
Administration (FDA) earlier, as well as final clearance from the FTC with 180 days
of exclusivity. Zolpidem Sublingual Tablets, 1.75 mg & 3.5 mg are AB-rated
generic equivalent of Purdue Pharma L.P’s Intermezzo® Sublingual Tablets, 1.75
mg & 3.5 mg and is indicated for use as needed for the treatment of insomnia
when a middle-of-the-night awakening is followed by difficulty returning to sleep.
Intermezzo® had US sales of US$9.46mn (IMS MAT December 2015). Given the
small size of the product it’s unlikely to contribute significantly to the numbers, we
maintain our accumulate rating on the stock with a price target of `1560.
Mahindra launches tractor YUVO
Mahindra & Mahindra Limited has launched a new platform for tractors - YUVO -
seeking to consolidate its market share in the domestic market, and stepping up
exports to select markets. The versatile YUVO platform has the flexibility to roll out
tractors in 32, 35, 40, 42 and 45 HP categories, covering over 75 per cent of the
tractor industry in India. According to management, YUVO will cater to the
evolving needs of the progressive farmer. The company has invested `250cr on
developing the NOVO platform and now `300cr for the new YUVO platform. This
is the second platform developed by the company from its Chennai facility within
20 months of the launch of NOVO that handles 50 plus HP capacity tractors. No
other manufacturer has developed two new platforms in such a short time.
M&M is the largest player in the country’s tractor market, with a market share of
41 per cent. Last year, the country’s tractor market closed with cumulative sales
volume of 4,93,000 units. After hitting a peak of 6,30,000 units, the last two years
saw lower sales in the country’s tractor market, due to poor monsoons directly
impacting sales. However, management felt this year could see more than 10 per
cent growth, backed by good monsoon.
Economic and Political News
Govt allots `25,834 crore food subsidy to FCI
Liquidity matters: RBI’s measures will lead to quicker transmission of rate cuts
Nitish Kumar imposes complete ban on sale of liquor in Bihar
Corporate News
Power and steel companies owe `11,700cr to Coal India
L&T wins `2,125cr contracts including major Karnataka highway project
Narayana Hrudayalaya to sell Hyderabad hospital
Market Outlook
April 6, 2016
Top Picks ★★★★★
Large Cap
Market Cap
CMP
Target
Upside
Company
Rationale
(` Cr)
(`)
(`)
(%)
To outpace battery industry growth due to better technological
Amara Raja Batteries
15,153
887
1,040
17.2
products leading to market share gains in both the automotive
OEM and replacement segments.
Uptick in defense capex by government when coupled with
Bharat Electronics
28,345
1,181
1,414
19.7
BELs strong market positioning, indicate that good times are
ahead for BEL.
The stock is trading at attractive valuations and is factoring all
HCL Tech
1,18,994
844
1,038
23.0
the bad news.
Strong visibility for a robust 20% earnings trajectory, coupled
HDFC Bank
2,67,558
1,058
1,262
19.3
with high quality of earnings on account of high quality retail
business and strategic focus on highly rated corporates.
Back on the growth trend, expect a long term growth of 14%
Infosys
2,80,820
1,219
1,347
10.5
to be a US$20bn in FY2020.
LICHF continues to grow its retail loan book at a healthy pace
with improvement in asset quality. We expect the company to
LIC Housing Finance
23,593
468
592
26.6
post a healthy loan book which is likely to reflect in a strong
earnings growth.
Huge bid pipeline of re-development works at Delhi and other
NBCC
11,321
943
1,089
15.4
State Governments and opportunity from Smart City, positions
NBCC to report strong growth, going forward.
Source: Company, Angel Research
Mid Cap
Market Cap
CMP
Target
Upside
Company
Rationale
(` Cr)
(`)
(`)
(%)
Favorable outlook for the AC industry to augur well for
Cooling products business which is out pacing the market
Blue Star
3,531
393
458
16.7
growth. EMPPAC division's profitability to improve once
operating environment turns around.
We expect the company to post a healthy loan book CAGR of
20% over FY2015-18E, which is likely to translate in a
Dewan Housing
5,547
189
270
43.0
earnings CAGR of 21.3%, over the same period. The stock
currently trades at 0.8x FY2018E ABV.
Commencement of new projects, downtrend in the interest
IL&FS Transport
2,433
74
93
25.8
rate cycle, to lead to stock re-rating
Economic recovery to have favourable impact on advertising &
circulation revenue growth. Further, the acquisition of a radio
Jagran Prakashan
5,180
158
189
19.3
business (Radio City) would also boost the company's revenue
growth.
Speedier execution and speedier sales, strong revenue visibilty
Mahindra Lifespace
1,781
434
554
27.6
in short-to-long run, attractive valuations
Massive capacity expansion along with rail advantage at ICD
Navkar Corporation
2,488
174
265
51.9
as well CFS augurs well for the company
Earnings boost on back of stable material prices and
Radico Khaitan
1,279
96
156
62.3
favourable pricing environment. Valuation discount to peers
provides additional comfort
Strong brands and distribution network would boost growth
Siyaram Silk Mills
920
981
1,354
38.0
going ahead. Stock currently trades at an inexpensive
valuation.
Source: Company, Angel Research
Market Outlook
April 6, 2016
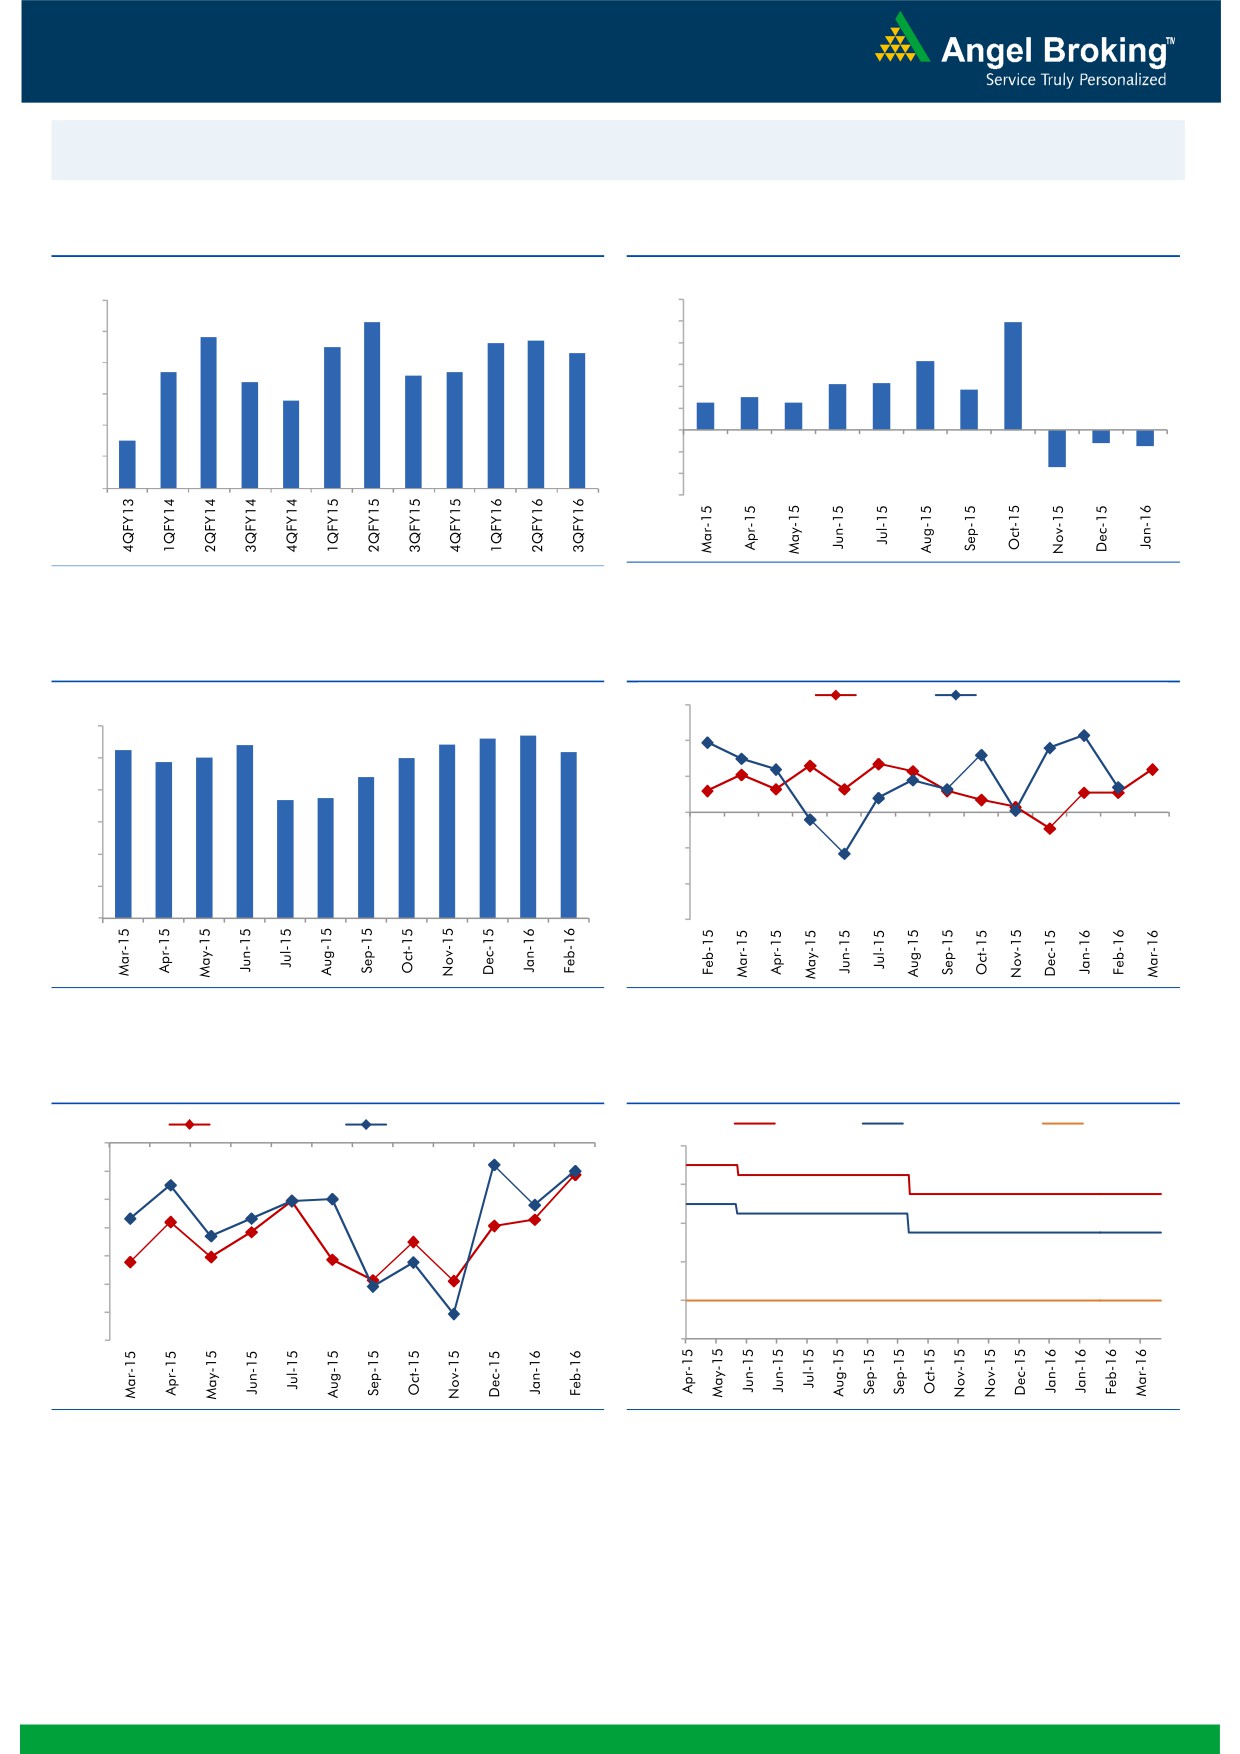
Macro watch
Exhibit 1: Quarterly GDP trends
Exhibit 2: IIP trends
(%)
(%)
9.0
8.3
12.0
9.9
7.8
7.7
10.0
8.0
7.5
7.6
7.3
8.0
6.3
6.7
6.6
6.7
7.0
6.4
6.0
4.2
4.3
3.7
5.8
4.0
2.5
3.0
2.5
6.0
2.0
5.0
4.5
-
4.0
(2.0)
(1.2)
(1.5)
(4.0)
3.0
(3.4)
(6.0)
Source: CSO, Angel Research
Source: MOSPI, Angel Research
Exhibit 3: Monthly CPI inflation trends
Exhibit 4: Manufacturing and services PMI
Mfg. PMI
Services PMI
(%)
56.0
5.6
5.7
6.0
5.4
5.4
5.3
5.2
4.9
5.0
5.0
54.0
5.0
4.4
52.0
3.7
3.7
4.0
50.0
3.0
48.0
2.0
1.0
46.0
-
44.0
Source: MOSPI, Angel Research
Source: Market, Angel Research; Note: Level above 50 indicates expansion
Exhibit 5: Exports and imports growth trends
Exhibit 6: Key policy rates
(%)
Exports yoy growth
Imports yoy growth
(%)
Repo rate
Reverse Repo rate
CRR
0.0
8.00
(5.0)
7.00
(10.0)
(15.0)
6.00
(20.0)
5.00
(25.0)
4.00
(30.0)
(35.0)
3.00
Source: Bloomberg, Angel Research
Source: RBI, Angel Research
Market Outlook
April 6, 2016
Global watch
Exhibit 1: Latest quarterly GDP Growth (%, yoy) across select developing and developed countries
(%)
8.0
6.8
6.0
5.3
5.0
4.5
4.0
2.8
2.1
2.0
2.1
1.4
2.0
0.6
0.7
-
(2.0)
(4.0)
(3.8)
(6.0)
(5.9)
(8.0)
Source: Bloomberg, Angel Research
Exhibit 2: 2015 GDP Growth projection by IMF (%, yoy) across select developing and developed countries
(%)
8.0
7.3
6.8
6.0
4.7
4.7
4.0
2.5
2.5
2.6
1.4
1.5
2.0
1.2
0.6
-
(2.0)
(3.0)
(4.0)
(3.8)
(6.0)
Source: IMF, Angel Research
Exhibit 3: One year forward P-E ratio across select developing and developed countries
(x)
18.0
16.0
14.0
12.0
10.0
8.0
6.0
4.0
2.0
-
Source: IMF, Angel Research
Market Outlook
April 6, 2016
Exhibit 4: Relative performance of indices across globe
Returns (%)
Country
Name of index
Closing price
1M
3M
1YR
Brazil
Bovespa
49,054
3.9
12.4
(3.0)
Russia
Micex
1,857
(0.1)
5.3
10.4
India
Nifty
7,603
5.3
(4.3)
(10.5)
China
Shanghai Composite
3,053
5.7
(14.8)
(17.7)
South Africa
Top 40
45,113
1.1
(1.5)
(2.2)
Mexico
Mexbol
45,186
2.2
5.1
0.7
Indonesia
LQ45
845
(0.3)
6.7
(10.8)
Malaysia
KLCI
1,718
1.5
1.5
(5.7)
Thailand
SET 50
874
(1.8)
11.2
(12.0)
USA
Dow Jones
17,603
3.9
1.0
(1.5)
UK
FTSE
6,091
(0.9)
(0.0)
(12.2)
Japan
Nikkei
15,733
(7.2)
(17.3)
(19.2)
Germany
DAX
9,563
(2.2)
(7.0)
(20.5)
France
CAC
4,250
(3.9)
(6.0)
(19.1)
Source: Bloomberg, Angel Research
Stock Watch
April 06, 2016
Company Name
Reco
CMP
Target
Mkt Cap
Sales ( Čcr )
OPM(%)
EPS (Č)
PER(x)
P/BV(x)
RoE(%)
EV/Sales(x)
(Č)
Price ( Č)
( Č cr )
FY16E FY17E
FY16E
FY17E
FY16E
FY17E
FY16E
FY17E
FY16E
FY17E
FY16E
FY17E
FY16E
FY17E
Agri / Agri Chemical
Rallis
Neutral
171
-
3,323
2,097
2,415
14.4
14.4
9.5
11.0
18.0
15.5
3.6
3.1
21.1
21.3
1.6
1.4
United Phosphorus
Neutral
459
-
19,654
12,500
14,375
18.3
18.3
29.8
35.9
15.4
12.8
2.8
2.4
20.0
20.3
1.7
1.4
Auto & Auto Ancillary
Ashok Leyland
Neutral
109
-
30,963
17,995
21,544
11.4
11.6
3.4
4.7
32.0
23.2
5.6
5.2
17.7
22.2
1.7
1.4
Bajaj Auto
Accumulate
2,396
2,585
69,345
22,709
25,860
20.9
20.1
129.0
143.6
18.6
16.7
5.7
4.9
30.7
29.4
2.6
2.2
Bharat Forge
Accumulate
829
875
19,309
7,351
8,318
19.9
19.7
31.2
36.5
26.6
22.7
4.8
4.0
19.3
19.2
2.8
2.4
Eicher Motors
Accumulate
18,736
20,044
50,888
15,556
16,747
15.5
17.3
464.8
597.5
40.3
31.4
14.7
10.8
36.2
34.3
3.2
2.9
Gabriel India
Accumulate
90
101
1,289
1,415
1,544
8.7
9.0
4.6
5.4
19.5
16.6
3.5
3.1
18.1
18.9
0.9
0.8
Hero Motocorp
Neutral
2,956
-
59,033
28,244
30,532
15.5
15.9
156.7
168.5
18.9
17.5
7.5
6.4
39.9
36.4
1.9
1.8
Jamna Auto Industries Accumulate
142
160
1,134
1,281
1,473
11.2
11.5
7.6
9.2
18.7
15.4
4.7
3.9
25.4
25.2
0.9
0.8
L G Balakrishnan & Bros Neutral
468
-
735
1,254
1,394
11.6
11.8
35.9
41.7
13.1
11.2
1.8
1.6
13.5
13.8
0.7
0.6
Mahindra and Mahindra Accumulate
1,216
1,364
75,525
38,416
42,904
13.7
13.9
54.8
63.4
22.2
19.2
3.4
3.0
15.4
15.8
1.6
1.4
Maruti
Neutral
3,546
-
107,131
57,865
68,104
16.4
16.7
176.3
225.5
20.1
15.7
3.9
3.3
19.4
21.2
1.6
1.3
Minda Industries
Neutral
1,008
-
1,600
2,523
2,890
8.7
9.0
55.0
65.4
18.3
15.4
3.5
2.9
19.3
18.7
0.7
0.6
Motherson Sumi
Buy
252
313
33,319
39,343
45,100
8.8
9.1
10.1
12.5
24.9
20.2
7.9
6.2
35.3
34.4
0.9
0.8
Rane Brake Lining
Buy
374
465
296
454
511
11.5
12.0
25.2
31.0
14.8
12.1
2.2
2.0
14.9
16.6
0.8
0.7
Setco Automotive
Neutral
30
-
406
594
741
12.7
13.7
1.7
3.2
17.9
9.5
1.9
1.6
10.4
16.9
1.1
0.9
Tata Motors
Neutral
371
-
106,971
259,686
273,957
13.0
13.4
25.9
29.5
14.3
12.6
1.9
1.6
8.0
9.0
0.6
0.6
TVS Motor
Neutral
315
-
14,944
11,263
13,122
6.9
8.5
9.2
15.0
34.2
21.0
7.8
6.2
22.7
29.6
1.3
1.1
Amara Raja Batteries
Buy
887
1,040
15,153
4,892
5,871
17.4
17.6
28.8
37.1
30.8
23.9
7.2
5.8
23.4
24.1
3.1
2.5
Exide Industries
Buy
135
162
11,471
6,950
7,784
14.4
14.8
6.6
7.3
20.5
18.5
2.6
2.4
12.6
12.8
1.4
1.2
Apollo Tyres
Accumulate
166
183
8,427
12,056
12,714
17.2
16.4
23.0
20.3
7.2
8.2
1.3
1.1
17.7
13.6
0.7
0.8
Ceat
Accumulate
1,048
1,119
4,237
6,041
6,597
14.1
13.7
99.5
111.9
10.5
9.4
2.1
1.7
19.6
18.5
0.9
0.7
JK Tyres
Neutral
83
-
1,883
7,446
7,669
15.2
14.0
19.6
18.4
4.2
4.5
1.1
0.9
25.2
19.5
0.7
0.6
Swaraj Engines
Accumulate
871
919
1,081
552
630
14.2
14.7
44.6
54.1
19.5
16.1
4.5
4.1
23.2
25.6
1.8
1.5
Subros
Neutral
89
-
533
1,293
1,527
11.8
11.9
4.2
6.7
21.1
13.3
1.6
1.5
7.7
11.5
0.7
0.6
Indag Rubber
Neutral
173
-
454
283
329
17.0
17.2
13.0
15.4
13.4
11.2
2.9
2.4
21.8
21.6
1.3
1.1
Capital Goods
ACE
Neutral
38
-
374
660
839
4.7
8.2
1.0
3.9
37.8
9.7
1.2
1.1
3.2
11.3
0.7
0.6
BEML
Buy
973
1,157
4,052
3,277
4,006
6.0
8.9
36.2
64.3
26.9
15.1
1.9
1.7
5.7
11.7
1.3
1.0
Bharat Electronics
Buy
1,181
1,414
28,345
7,737
8,634
16.8
17.2
54.0
61.5
21.9
19.2
3.1
2.8
39.3
45.6
2.8
2.4
Stock Watch
April 06, 2016
Company Name
Reco
CMP
Target
Mkt Cap
Sales ( Čcr )
OPM(%)
EPS (Č)
PER(x)
P/BV(x)
RoE(%)
EV/Sales(x)
(Č)
Price ( Č)
( Č cr )
FY16E
FY17E
FY16E
FY17E
FY16E
FY17E
FY16E
FY17E
FY16E
FY17E
FY16E
FY17E
FY16E
FY17E
Capital Goods
Voltas
Buy
274
353
9,058
5,363
5,963
8.0
9.1
11.0
13.8
24.9
19.8
3.8
3.4
16.2
17.9
1.6
1.5
BGR Energy
Neutral
104
-
748
3,615
3,181
9.5
9.4
16.7
12.4
6.2
8.4
0.6
0.6
10.0
7.0
0.6
0.8
BHEL
Neutral
113
-
27,609
33,722
35,272
10.8
11.7
10.5
14.2
10.7
7.9
0.8
0.8
7.0
9.0
0.9
0.9
Blue Star
Buy
393
458
3,531
3,548
3,977
6.3
6.9
13.7
17.2
28.7
22.9
7.2
4.7
26.1
25.4
1.1
0.9
Crompton Greaves
Neutral
49
-
3,077
13,484
14,687
4.9
6.2
4.5
7.1
10.9
6.9
0.8
0.7
7.2
10.8
0.4
0.3
Greaves Cotton
Neutral
125
-
3,054
1,655
1,755
16.6
16.8
7.4
7.8
16.9
16.0
3.4
3.2
21.1
20.6
1.8
1.7
Inox Wind
Buy
246
458
5,461
4,980
5,943
17.0
17.5
26.6
31.6
9.3
7.8
2.8
2.0
35.0
30.0
1.2
1.0
KEC International
Neutral
124
-
3,179
8,791
9,716
6.1
6.8
5.4
8.2
22.9
15.1
2.3
2.1
10.0
14.0
0.6
0.5
Thermax
Neutral
751
-
8,952
6,413
7,525
7.4
8.5
30.5
39.3
24.6
19.1
3.8
3.3
15.0
17.0
1.4
1.1
VATech Wabag
Neutral
520
-
2,834
2,722
3,336
7.9
8.1
19.5
24.6
26.7
21.1
2.8
2.5
11.1
12.4
1.1
0.9
Cement
ACC
Neutral
1,390
-
26,104
13,151
14,757
16.4
18.3
63.9
83.4
21.8
16.7
2.8
2.6
13.3
16.1
1.8
1.5
Ambuja Cements
Neutral
226
-
35,096
11,564
12,556
19.4
20.7
8.9
10.1
25.4
22.4
3.2
3.0
12.8
13.8
2.7
2.4
HeidelbergCement
Neutral
86
-
1,938
1,772
1,926
13.3
15.4
1.0
3.0
85.5
28.5
2.2
2.0
2.6
7.9
1.7
1.4
India Cements
Neutral
84
-
2,583
4,216
4,840
18.0
19.5
4.0
9.9
21.0
8.5
0.8
0.8
4.0
9.5
0.9
0.8
JK Cement
Neutral
648
-
4,532
3,661
4,742
10.1
15.8
7.5
28.5
86.4
22.7
2.6
2.3
7.5
22.9
1.7
1.3
J K Lakshmi Cement
Neutral
328
-
3,855
2,947
3,616
16.7
19.9
11.5
27.2
28.5
12.1
2.7
2.3
9.8
20.8
1.7
1.4
Mangalam Cements
Neutral
225
-
602
1,053
1,347
10.5
13.3
8.4
26.0
26.8
8.7
1.1
1.0
4.3
12.5
0.9
0.7
Orient Cement
Neutral
148
-
3,028
1,854
2,524
21.2
22.2
7.7
11.1
19.2
13.3
2.8
2.4
13.3
15.7
2.4
1.7
Ramco Cements
Neutral
407
-
9,698
4,036
4,545
20.8
21.3
15.1
18.8
27.0
21.7
3.3
2.9
12.9
14.3
2.9
2.5
Shree Cement^
Neutral
12,077
-
42,071
7,150
8,742
26.7
28.6
228.0
345.5
53.0
35.0
7.8
6.5
15.7
20.3
5.6
4.5
UltraTech Cement
Neutral
3,101
-
85,102
24,669
29,265
18.2
20.6
82.0
120.0
37.8
25.8
4.1
3.6
11.3
14.7
3.5
3.0
Construction
ITNL
Buy
74
93
2,433
7,360
8,825
34.0
35.9
7.0
9.0
10.6
8.2
0.4
0.3
3.2
3.7
3.7
3.6
KNR Constructions
Buy
517
603
1,454
937
1,470
14.3
14.0
44.2
38.6
11.7
13.4
2.3
2.0
15.4
15.4
1.6
1.1
Larsen & Toubro
Accumulate
1,195
1,310
111,307
58,870
65,708
8.3
10.3
42.0
53.0
28.5
22.6
2.0
1.8
8.8
11.2
2.1
1.9
Gujarat Pipavav Port
Neutral
173
-
8,385
629
684
51.0
52.2
6.4
5.9
27.1
29.4
3.6
3.3
15.9
12.7
13.0
11.7
MBL Infrastructures
Buy
155
285
642
2,313
2,797
12.2
14.6
19.0
20.0
8.2
7.8
0.9
0.8
11.3
10.6
1.0
0.9
Nagarjuna Const.
Neutral
73
-
4,050
7,892
8,842
8.8
9.1
3.0
5.3
24.3
13.8
1.2
1.1
5.0
8.5
0.8
0.6
PNC Infratech
Accumulate
527
558
2,704
1,873
2,288
13.2
13.5
24.0
32.0
22.0
16.5
2.1
1.9
12.1
12.3
1.6
1.3
Simplex Infra
Neutral
246
-
1,215
5,955
6,829
10.3
10.5
16.0
31.0
15.4
7.9
0.8
0.7
5.3
9.9
0.7
0.6
Stock Watch
April 06, 2016
Company Name
Reco
CMP
Target
Mkt Cap
Sales ( Čcr )
OPM(%)
EPS (Č)
PER(x)
P/BV(x)
RoE(%)
EV/Sales(x)
(Č)
Price ( Č)
( Č cr )
FY16E
FY17E
FY16E
FY17E
FY16E
FY17E
FY16E
FY17E
FY16E
FY17E
FY16E
FY17E
FY16E
FY17E
Construction
Power Mech Projects
Neutral
576
-
847
1,539
1,801
12.8
12.7
59.0
72.1
9.8
8.0
1.5
1.2
18.6
16.8
0.6
0.5
Sadbhav Engineering
Neutral
280
-
4,796
3,481
4,219
10.7
10.8
8.2
11.7
34.1
23.9
3.3
2.9
10.3
13.5
1.6
1.4
NBCC
Buy
943
1,089
11,321
5,816
7,382
6.9
7.7
29.6
39.8
31.9
23.7
5.7
4.5
24.1
26.7
1.7
1.3
MEP Infra
Neutral
38
-
624
1,956
1,876
28.1
30.5
1.3
3.0
29.5
12.8
6.2
4.2
21.2
32.8
1.7
1.7
SIPL
Neutral
99
-
3,475
675
1,042
62.4
64.7
-
-
3.7
4.2
-
-
16.8
11.3
Engineers India
Neutral
168
-
5,659
1,667
1,725
13.5
16.0
9.7
11.4
17.3
14.7
2.0
2.0
11.7
13.4
2.2
2.2
Financials
Allahabad Bank
Neutral
54
-
3,270
8,569
9,392
2.8
2.9
16.3
27.5
3.3
2.0
0.3
0.3
7.6
11.9
-
-
Axis Bank
Accumulate
432
494
102,978
26,473
31,527
3.5
3.6
35.7
43.5
12.1
9.9
2.0
1.8
17.9
18.9
-
-
Bank of Baroda
Neutral
144
-
33,249
18,485
21,025
1.9
2.0
13.5
21.1
10.7
6.8
0.9
0.8
7.3
10.6
-
-
Bank of India
Neutral
94
-
7,648
15,972
17,271
1.9
2.0
15.3
33.4
6.2
2.8
0.3
0.2
3.6
7.6
-
-
Canara Bank
Neutral
187
-
10,130
15,441
16,945
2.0
2.1
46.6
70.4
4.0
2.7
0.4
0.3
8.0
11.2
-
-
Dena Bank
Neutral
29
-
1,894
3,440
3,840
2.1
2.3
7.3
10.0
4.1
2.9
0.3
0.3
6.1
7.9
-
-
Federal Bank
Neutral
44
-
7,516
3,477
3,999
3.0
3.0
5.0
6.2
8.7
7.0
0.9
0.8
10.6
11.9
-
-
HDFC
Neutral
1,103
-
174,320
10,358
11,852
3.3
3.3
41.1
47.0
26.9
23.5
5.1
4.6
24.7
24.9
-
-
HDFC Bank
Buy
1,058
1,262
267,558
38,309
47,302
4.3
4.3
49.3
61.1
21.5
17.3
3.7
3.2
18.5
19.7
-
-
ICICI Bank
Accumulate
226
254
131,112
34,279
39,262
3.3
3.3
21.0
24.4
10.8
9.3
1.8
1.5
14.4
14.7
-
-
IDBI Bank
Neutral
68
-
14,021
9,625
10,455
1.8
1.8
8.5
14.2
8.0
4.8
0.5
0.5
5.9
9.3
-
-
Indian Bank
Neutral
102
-
4,911
6,160
6,858
2.5
2.5
24.5
29.8
4.2
3.4
0.3
0.3
7.7
8.6
-
-
LIC Housing Finance
Buy
468
592
23,593
3,101
3,745
2.5
2.5
33.0
40.2
14.2
11.6
2.7
2.3
19.7
20.5
-
-
Oriental Bank
Neutral
90
-
2,684
7,643
8,373
2.4
2.4
37.2
45.4
2.4
2.0
0.2
0.2
8.2
9.4
-
-
Punjab Natl.Bank
Neutral
83
-
16,268
23,638
26,557
2.8
2.8
17.9
27.2
4.6
3.0
0.5
0.4
8.5
12.0
-
-
South Ind.Bank
Neutral
18
-
2,363
1,965
2,185
2.5
2.5
2.5
3.3
7.0
5.3
0.7
0.6
9.5
11.7
-
-
St Bk of India
Neutral
185
-
143,223
79,958
86,061
2.6
2.6
13.4
20.7
13.8
8.9
1.1
1.1
11.5
12.8
-
-
Union Bank
Neutral
129
-
8,895
12,646
14,129
2.3
2.4
31.0
39.1
4.2
3.3
0.5
0.4
9.8
11.4
-
-
Vijaya Bank
Neutral
32
-
2,706
3,536
3,827
1.9
1.9
5.5
6.7
5.7
4.7
0.5
0.4
7.8
8.8
-
-
Yes Bank
Neutral
829
-
34,873
7,190
9,011
3.2
3.3
58.2
69.7
14.2
11.9
2.5
2.2
19.2
19.6
-
-
FMCG
Asian Paints
Neutral
869
-
83,378
16,553
19,160
16.0
16.2
17.7
21.5
49.2
40.4
13.1
11.8
29.4
31.2
4.9
4.2
Britannia
Neutral
2,636
-
31,629
8,481
9,795
14.0
14.1
65.5
78.3
40.3
33.7
19.1
15.6
38.3
41.2
3.6
3.1
Colgate
Neutral
832
-
22,641
4,836
5,490
19.5
19.7
48.5
53.2
17.2
15.6
12.6
11.0
99.8
97.5
4.6
4.0
Stock Watch
April 06, 2016
Company Name
Reco
CMP
Target
Mkt Cap
Sales ( Čcr )
OPM(%)
EPS (Č)
PER(x)
P/BV(x)
RoE(%)
EV/Sales(x)
(Č)
Price ( Č)
( Č cr )
FY16E FY17E
FY16E
FY17E
FY16E
FY17E
FY16E
FY17E
FY16E
FY17E
FY16E
FY17E
FY16E
FY17E
FMCG
Dabur India
Accumulate
246
267
43,205
9,370
10,265
17.1
17.2
7.3
8.1
33.5
30.3
10.1
8.2
33.7
30.6
4.5
4.1
GlaxoSmith Con*
Neutral
6,034
-
25,376
4,919
5,742
17.2
17.4
168.3
191.2
35.9
31.6
10.2
8.7
28.8
28.9
4.7
4.0
Godrej Consumer
Neutral
1,354
-
46,103
10,168
12,886
16.1
16.1
32.1
38.4
42.2
35.3
8.6
7.9
19.7
21.0
4.6
3.6
HUL
Neutral
868
-
187,884
34,940
38,957
17.5
17.7
20.8
24.7
41.7
35.2
46.4
37.1
110.5
114.2
5.2
4.6
ITC
Accumulate
327
359
262,741
36,804
38,776
37.9
37.9
12.2
12.9
26.8
25.3
7.4
6.5
27.7
25.8
6.7
6.4
Marico
Neutral
245
-
31,577
6,551
7,766
15.7
16.0
10.4
12.5
23.6
19.6
6.8
5.7
33.2
32.4
4.7
4.0
Nestle*
Buy
5,724
6,646
55,189
11,291
12,847
22.2
22.3
158.9
184.6
36.0
31.0
18.8
16.9
55.0
57.3
4.7
4.1
Tata Global
Buy
118
144
7,463
8,635
9,072
9.8
9.9
6.5
7.6
18.2
15.6
1.8
1.7
6.8
7.4
0.8
0.8
IT
HCL Tech^
Buy
844
1,038
118,994
42,038
47,503
21.2
21.5
51.5
57.7
16.4
14.6
3.5
2.7
21.5
18.8
2.4
2.0
Infosys
Accumulate
1,219
1,347
280,820
61,850
69,981
27.5
27.5
59.4
65.7
20.5
18.6
4.4
3.7
21.2
20.1
3.8
3.2
TCS
Buy
2,463
2,854
485,247
108,487
122,590
28.3
28.5
122.8
138.4
20.1
17.8
7.6
6.9
38.0
38.9
4.1
3.5
Tech Mahindra
Accumulate
462
530
44,756
26,524
29,177
16.2
17.0
28.8
33.6
16.1
13.8
3.1
2.6
19.3
19.1
1.5
1.3
Wipro
Buy
560
680
138,248
50,808
56,189
23.7
23.8
37.3
40.7
15.0
13.8
2.9
2.6
19.2
17.7
2.2
1.8
Media
D B Corp
Buy
305
356
5,601
2,241
2,495
27.8
27.9
21.8
25.6
14.0
11.9
3.7
3.2
26.7
28.5
2.4
2.2
HT Media
Neutral
76
-
1,779
2,495
2,603
11.2
11.2
7.3
8.6
10.5
8.9
0.8
0.8
7.4
8.1
0.2
0.2
Jagran Prakashan
Buy
158
189
5,180
2,170
2,355
27.2
26.2
8.9
9.9
17.8
16.0
3.7
3.3
20.9
20.5
2.3
2.1
Sun TV Network
Neutral
359
-
14,161
2,779
3,196
70.2
70.5
22.8
27.3
15.8
13.2
3.9
3.5
26.7
28.3
4.8
4.2
Hindustan Media
Neutral
245
-
1,800
920
1,031
20.0
20.0
19.2
20.9
12.8
11.8
2.1
1.8
16.4
15.3
1.5
1.3
Ventures
Metals & Mining
Coal India
Buy
276
380
174,395
76,167
84,130
19.9
22.3
22.4
25.8
12.3
10.7
4.4
4.3
35.5
41.0
1.6
1.4
Hind. Zinc
Neutral
187
-
79,035
14,641
14,026
50.4
50.4
17.7
16.0
10.6
11.7
1.6
1.5
16.2
13.2
3.0
2.9
Hindalco
Neutral
85
-
17,532
104,356
111,186
8.7
9.5
6.7
11.1
12.6
7.7
0.5
0.4
3.5
5.9
0.7
0.6
JSW Steel
Neutral
1,257
-
30,375
42,308
45,147
16.4
20.7
(10.3)
49.5
25.4
1.4
1.4
(1.0)
5.6
1.8
1.6
NMDC
Neutral
98
-
38,755
8,237
10,893
46.6
44.5
10.0
11.7
9.8
8.4
1.1
1.0
12.5
13.0
4.5
3.4
SAIL
Neutral
42
-
17,532
45,915
53,954
7.2
10.5
1.5
4.4
28.2
9.7
0.4
0.4
2.3
4.1
1.0
0.9
Vedanta
Neutral
86
-
25,452
71,445
81,910
26.2
26.3
12.9
19.2
6.7
4.5
0.5
0.4
7.2
8.9
0.8
0.6
Tata Steel
Neutral
312
-
30,312
126,760
137,307
8.9
11.3
6.4
23.1
49.1
13.5
1.0
1.0
2.0
7.1
0.8
0.8
Oil & Gas
Cairn India
Neutral
147
-
27,467
11,323
12,490
49.4
51.0
20.7
20.7
7.1
7.1
0.5
0.4
6.4
6.1
1.5
0.8
GAIL
Neutral
340
-
43,166
64,856
70,933
9.1
9.6
24.0
28.9
14.2
11.8
1.2
1.1
8.8
9.6
0.9
0.8
ONGC
Neutral
206
-
175,858
154,564
167,321
36.8
37.4
28.6
32.5
7.2
6.3
0.9
0.8
12.7
13.5
1.3
1.3
Stock Watch
April 06, 2016
Company Name
Reco
CMP
Target
Mkt Cap
Sales ( Čcr )
OPM(%)
EPS (Č)
PER(x)
P/BV(x)
RoE(%)
EV/Sales(x)
(Č)
Price ( Č)
( Č cr )
FY16E FY17E
FY16E
FY17E
FY16E
FY17E
FY16E
FY17E
FY16E
FY17E
FY16E
FY17E
FY16E
FY17E
Oil & Gas
Petronet LNG
Neutral
245
-
18,338
29,691
31,188
5.8
6.2
12.8
13.4
19.1
18.2
2.9
2.5
15.8
14.8
0.7
0.7
Indian Oil Corp
Accumulate
402
455
97,640
359,607
402,760
5.9
6.1
42.5
48.7
9.5
8.3
1.3
1.1
14.1
14.4
0.4
0.3
Reliance Industries
Accumulate
1,028
1,150
333,143
304,775
344,392
12.6
13.4
91.3
102.6
11.3
10.0
1.3
1.1
11.8
12.0
1.0
0.9
Pharmaceuticals
Alembic Pharma
Neutral
589
-
11,095
3,274
3,802
26.9
19.4
35.0
28.7
16.8
20.5
7.5
5.6
55.6
31.2
3.4
2.8
Aurobindo Pharma
Accumulate
751
856
43,940
14,923
17,162
22.0
23.0
35.7
42.8
21.0
17.5
6.2
4.7
34.0
30.2
3.3
2.8
Aventis*
Neutral
4,198
-
9,668
2,082
2,371
17.4
20.8
118.2
151.5
35.5
27.7
5.2
4.2
19.9
25.5
4.3
3.6
Cadila Healthcare
Accumulate
318
352
32,576
10,224
11,840
21.0
22.0
14.6
17.6
21.8
18.1
6.0
4.7
30.8
29.0
3.3
2.7
Cipla
Buy
504
605
40,491
13,979
16,447
20.2
18.6
25.7
27.5
19.6
18.3
3.2
2.8
17.6
16.1
2.9
2.4
Dr Reddy's
Buy
2,996
3,933
51,092
16,838
19,575
25.0
23.1
167.5
178.8
17.9
16.8
3.8
3.1
23.1
20.4
3.0
2.5
Dishman Pharma
Neutral
331
-
2,670
1,733
1,906
21.5
21.5
17.0
19.9
19.5
16.6
2.0
1.8
10.5
11.2
2.1
1.8
GSK Pharma*
Neutral
3,699
-
31,327
2,870
3,158
20.0
22.1
59.5
68.3
62.2
54.2
18.3
18.8
28.5
34.3
10.4
9.5
Indoco Remedies
Neutral
274
-
2,528
1,033
1,199
15.9
18.2
9.4
13.6
29.2
20.2
4.3
3.7
15.7
19.7
2.5
2.2
Ipca labs
Buy
557
900
7,024
3,363
3,909
12.9
18.6
13.4
28.0
41.5
19.9
3.0
2.6
7.4
14.0
2.4
2.0
Lupin
Accumulate
1,463
1,560
65,923
13,092
16,561
25.0
27.0
50.4
68.3
29.0
21.4
6.0
4.7
22.8
24.7
4.8
3.6
Sun Pharma
Buy
801
950
192,666
28,163
32,610
25.8
30.7
17.4
26.9
46.0
29.8
4.4
3.8
13.0
16.6
6.3
5.2
Power
Tata Power
Neutral
67
-
18,121
35,923
37,402
22.6
22.8
4.1
5.2
16.5
13.0
1.3
1.2
7.5
9.3
1.5
1.3
NTPC
Buy
127
146
104,717
87,271
99,297
23.5
23.5
11.8
13.3
10.8
9.6
1.2
1.1
11.5
12.2
2.2
2.0
Power Grid
Buy
139
170
72,719
20,702
23,361
86.7
86.4
12.1
13.2
11.5
10.5
1.7
1.5
15.6
15.1
8.4
7.8
Real Estate
MLIFE
Buy
434
554
1,781
697
1,011
14.9
19.3
13.8
20.1
31.5
21.6
1.2
1.1
3.8
5.3
3.8
2.6
Telecom
Bharti Airtel
Neutral
330
-
132,054
101,748
109,191
32.1
31.7
12.0
12.5
27.5
26.4
1.9
1.8
6.9
6.7
1.9
1.7
Idea Cellular
Neutral
109
-
39,372
34,282
36,941
32.0
31.5
5.9
6.2
18.5
17.6
1.7
1.5
9.9
9.3
1.7
1.6
zOthers
Abbott India
Neutral
4,593
-
9,760
2,715
3,153
14.5
14.1
134.3
152.2
34.2
30.2
8.5
7.0
27.4
25.6
3.3
2.8
Bajaj Electricals
Accumulate
208
237
2,098
4,719
5,287
5.2
5.8
8.6
12.7
24.3
16.4
2.8
2.4
11.4
14.8
0.4
0.4
Finolex Cables
Neutral
286
-
4,370
2,520
2,883
12.2
12.0
12.7
14.2
22.6
20.1
3.1
2.7
13.6
13.5
1.5
1.3
Goodyear India*
Buy
498
582
1,148
1,800
1,600
11.7
11.5
58.7
52.9
8.5
9.4
1.9
1.6
24.6
18.7
0.4
0.4
Hitachi
Neutral
1,168
-
3,177
1,779
2,081
7.8
8.8
21.8
33.4
53.6
35.0
8.7
7.0
17.4
22.1
1.9
1.6
Jyothy Laboratories
Neutral
298
-
5,391
1,620
1,847
11.5
11.5
7.3
8.5
40.8
35.1
5.3
4.9
13.3
14.4
3.2
2.7
MRF
Buy
35,776
45,575
15,173
20,316
14,488
21.4
21.1
5,488.0
3,798.0
6.5
9.4
2.2
1.8
41.1
21.2
0.7
0.9
Page Industries
Neutral
12,096
-
13,492
1,929
2,450
19.8
20.1
229.9
299.0
52.6
40.5
23.2
16.1
52.1
47.1
7.0
5.5
Stock Watch
April 06, 2016
Company Name
Reco
CMP
Target
Mkt Cap
Sales ( Čcr )
OPM(%)
EPS (Č)
PER(x)
P/BV(x)
RoE(%)
EV/Sales(x)
(Č)
Price ( Č)
( Č cr )
FY16E
FY17E
FY16E
FY17E
FY16E
FY17E
FY16E
FY17E
FY16E
FY17E
FY16E
FY17E
FY16E
FY17E
zOthers
Relaxo Footwears
Neutral
503
-
6,038
1,767
2,152
12.3
12.5
19.3
25.1
26.1
20.1
6.4
4.9
27.7
27.8
3.5
2.8
Siyaram Silk Mills
Buy
981
1,354
920
1,636
1,815
11.5
11.5
89.9
104.1
10.9
9.4
1.8
1.6
17.9
17.8
0.7
0.6
Styrolution ABS India* Neutral
581
-
1,021
1,271
1,440
8.6
9.2
32.0
41.1
18.1
14.1
1.9
1.7
10.7
12.4
0.8
0.7
TVS Srichakra
Buy
2,379
3,217
1,821
2,035
2,252
15.9
15.3
248.6
268.1
9.6
8.9
4.2
3.0
43.6
33.9
0.9
0.8
HSIL
Neutral
300
-
2,166
2,123
2,384
16.1
16.5
15.0
18.9
19.9
15.9
1.6
1.4
8.0
9.4
1.4
1.2
Kirloskar Engines India
Neutral
216
-
3,124
2,403
2,554
8.6
9.9
9.2
10.5
23.5
20.6
2.3
2.2
9.7
10.7
0.9
0.9
Ltd
M M Forgings
Buy
456
614
551
511
615
21.7
21.6
43.1
55.8
10.6
8.2
1.9
1.6
19.9
21.2
1.3
1.0
Banco Products (India) Neutral
111
-
796
1,208
1,353
11.0
12.3
10.8
14.5
10.3
7.7
1.2
1.1
11.9
14.5
0.6
0.5
Competent Automobiles Neutral
135
-
83
1,040
1,137
3.2
3.1
25.7
28.0
5.3
4.8
0.8
0.7
15.0
14.3
0.1
0.1
Nilkamal
Neutral
1,102
-
1,644
1,871
2,031
10.7
10.5
63.2
69.8
17.4
15.8
2.8
2.4
17.6
16.6
0.9
0.8
Visaka Industries
Buy
110
144
174
1,086
1,197
9.9
10.3
21.5
28.8
5.1
3.8
0.5
0.4
9.6
11.6
0.4
0.3
Transport Corporation of
Neutral
273
-
2,078
2,830
3,350
8.8
9.0
14.4
18.3
19.0
14.9
2.9
2.6
15.4
17.1
0.9
0.7
India
Elecon Engineering
Neutral
59
-
645
1,359
1,482
10.3
13.7
0.8
3.9
73.8
15.2
1.2
1.2
1.6
7.8
0.8
0.8
Surya Roshni
Buy
140
201
613
2,992
3,223
8.1
8.4
14.7
18.3
9.5
7.6
0.9
0.8
9.7
11.0
0.5
0.4
MT Educare
Neutral
164
-
652
286
366
18.3
17.7
7.7
9.4
21.2
17.5
4.5
3.9
20.2
21.1
2.2
1.7
Radico Khaitan
Buy
96
156
1,279
1,517
1,635
12.7
13.4
5.8
7.1
16.5
13.5
1.4
1.3
8.6
9.6
1.3
1.2
Garware Wall Ropes
Buy
325
473
712
862
974
11.2
11.2
24.9
29.6
13.1
11.0
2.0
1.7
15.1
15.4
0.8
0.7
Wonderla Holidays
Neutral
380
-
2,150
206
308
44.0
43.6
9.0
12.9
42.3
29.5
5.8
5.2
13.7
17.8
10.3
6.9
Linc Pen & Plastics
Neutral
193
-
286
340
371
8.3
8.9
10.8
13.2
17.9
14.7
2.9
2.5
16.0
17.1
0.9
0.8
The Byke Hospitality
Neutral
152
-
610
222
287
20.5
20.5
5.6
7.6
27.0
20.1
5.1
4.2
18.9
20.8
2.8
2.1
Interglobe Aviation
Neutral
973
-
35,079
17,022
21,122
20.7
14.5
63.9
53.7
15.2
18.1
22.8
18.7
149.9
103.2
2.1
1.7
Coffee Day Enterprises
Neutral
227
-
4,667
2,692
2,964
17.0
18.6
-
4.7
-
47.8
2.8
2.6
0.2
5.5
2.1
2.0
Ltd
Navneet Education
Neutral
82
-
1,962
998
1,062
24.1
24.0
5.8
6.1
14.3
13.5
3.2
2.8
22.0
20.6
2.1
1.9
Navkar Corporation
Buy
174
265
2,488
365
436
38.3
37.5
5.6
5.9
30.9
29.7
1.9
1.8
6.3
6.1
7.6
6.6
UFO Moviez
Neutral
453
-
1,247
558
619
32.0
33.2
22.5
30.0
20.1
15.1
2.4
2.1
12.0
13.8
2.1
1.7
VRL Logistics
Neutral
369
-
3,371
1,725
1,902
16.5
16.7
12.2
14.6
30.4
25.4
6.3
5.6
20.8
21.9
2.1
1.9
Team Lease Serv.
Neutral
882
-
1,508
2,565
3,229
1.3
1.5
15.2
22.8
58.1
38.7
4.7
4.2
8.0
10.7
0.5
0.4
S H Kelkar & Co.
Neutral
227
-
3,284
928
1,036
15.3
15.1
4.9
6.1
46.0
37.2
4.3
4.0
9.4
10.7
3.4
3.0
Quick Heal
Neutral
219
-
1,531
339
408
27.8
27.3
7.1
7.7
30.9
28.2
2.6
2.6
8.5
9.3
3.4
2.9
Stock Watch
April 06, 2016
Company Name
Reco
CMP
Target Mkt Cap
Sales ( Čcr )
OPM(%)
EPS (Č)
PER(x)
P/BV(x)
RoE(%)
EV/Sales(x)
(Č)
Price ( Č)
( Č cr )
FY16E FY17E FY16E FY17E FY16E FY17E FY16E FY17E FY16E FY17E FY16E FY17E FY16E FY17E
zOthers
Narayana Hrudaya
Neutral
296
-
6,053
1,603
1,873
10.9
11.5
1.0
2.6
310.9
112.0
7.5
6.9
2.4
6.1
3.9
3.3
Manpasand Bever.
Neutral
452
-
2,260
540
836
19.9
19.6
10.2
16.9
44.1
26.7
3.6
3.2
8.1
12.0
3.9
2.4
Source: Company, Angel Research; Note: *December year end; #September year end; &October year end; Price as on April 05, 2016
Market Outlook
April 06, 2016
Research Team Tel: 022 - 39357800
DISCLAIMER
Angel Broking Private Limited (hereinafter referred to as “Angel”) is a registered Member of National Stock Exchange of India Limited,
Bombay Stock Exchange Limited and Metropolitian Stock Exchange of India Limited. It is also registered as a Depository Participant with
CDSL and Portfolio Manager with SEBI. It also has registration with AMFI as a Mutual Fund Distributor. Angel Broking Private Limited is a
registered entity with SEBI for Research Analyst in terms of SEBI (Research Analyst) Regulations, 2014 vide registration number
INH000000164. Angel or its associates has not been debarred/ suspended by SEBI or any other regulatory authority for accessing
/dealing in securities Market. Angel or its associates including its relatives/analyst do not hold any financial interest/beneficial ownership
of more than 1% in the company covered by Analyst. Angel or its associates/analyst has not received any compensation / managed or co
-managed public offering of securities of the company covered by Analyst during the past twelve months. Angel/analyst has not served as
an officer, director or employee of company covered by Analyst and has not been engaged in market making activity of the company
covered by Analyst.
This document is solely for the personal information of the recipient, and must not be singularly used as the basis of any investment
decision. Nothing in this document should be construed as investment or financial advice. Each recipient of this document should make
such investigations as they deem necessary to arrive at an independent evaluation of an investment in the securities of the companies
referred to in this document (including the merits and risks involved), and should consult their own advisors to determine the merits and
risks of such an investment.
Reports based on technical and derivative analysis center on studying charts of a stock's price movement, outstanding positions and
trading volume, as opposed to focusing on a company's fundamentals and, as such, may not match with a report on a company's
fundamentals.
The information in this document has been printed on the basis of publicly available information, internal data and other reliable sources
believed to be true, but we do not represent that it is accurate or complete and it should not be relied on as such, as this document is for
general guidance only. Angel Broking Pvt. Limited or any of its affiliates/ group companies shall not be in any way responsible for any
loss or damage that may arise to any person from any inadvertent error in the information contained in this report. Angel Broking Pvt.
Limited has not independently verified all the information contained within this document. Accordingly, we cannot testify, nor make any
representation or warranty, express or implied, to the accuracy, contents or data contained within this document. While Angel Broking
Pvt. Limited endeavors to update on a reasonable basis the information discussed in this material, there may be regulatory, compliance,
or other reasons that prevent us from doing so.
This document is being supplied to you solely for your information, and its contents, information or data may not be reproduced,
redistributed or passed on, directly or indirectly.
Neither Angel Broking Pvt. Limited, nor its directors, employees or affiliates shall be liable for any loss or damage that may arise from or
in connection with the use of this information.
Note: Please refer to the important ‘Stock Holding Disclosure' report on the Angel website (Research Section). Also, please refer to the
latest update on respective stocks for the disclosure status in respect of those stocks. Angel Broking Pvt. Limited and its affiliates may have
investment positions in the stocks recommended in this report.