Market Outlook
January 6, 2016
Market Cues
Domestic Indices
Chg (%)
(Pts)
(Close)
Indian markets are expected to open on a Flat note tracking the SGX Nifty and most
BSE Sensex
(0.2)
(43)
25,580
Global markets.
Nifty
(0.1)
(7)
7,785
U.S. stocks traded on a mixed note on Tuesday, following the sell-off seen in the
Mid Cap
0.6
62
11,172
previous session post slide in Chinese markets. The markets lacked direction as
Small Cap
0.8
93
11,901
traders expressed uncertainty about the outlook.
Bankex
(0.3)
(61)
18,883
Majority of European markets closed on a positive note. Investors remained cautious
and markets fluctuated despite of better than expected labor data out of Germany
Global Indices
Chg (%)
(Pts)
(Close)
and construction sector data in UK.
Dow Jones
0.1
10
17,159
Indian markets gave up early gains and closed in the negative territory as decline in
Nasdaq
(0.2)
(12)
4,891
Chinese stocks and disappointing manufacturing data kept investors cautious. The
broader markets managed to outperform Sensex and Nifty.
FTSE
0.7
44
6,137
Nikkei
(0.4)
(77)
18,374
News & Result Analysis
Hang Seng
(0.6)
(138)
21,189
Zydus expands animal health business with a strategic acquisition
Shanghai Com
(0.3)
(9)
3,288
Spicejet increases flights, seating capacity
Stock Update: Bharat Electronics
Detailed analysis on Pg2
Advances / Declines
BSE
NSE
Advances
2,085
1,099
Investor’s Ready Reckoner
Declines
840
478
Key Domestic & Global Indicators
Unchanged
92
49
Stock Watch: Latest investment recommendations on 150+ stocks
Refer P4 onwards
Volumes (` Cr)
Top Picks
BSE
3,523
CMP
Target
Upside
Company
Sector
Rating
NSE
17,658
(`)
(`)
(%)
Axis Bank
Financials
Buy
436
630
44.3
HCL Tech
IT
Buy
842
1,132
34.4
Net Inflows (` Cr)
Net
Mtd
Ytd
ICICI Bank
Financials
Buy
257
354
37.9
FII
(575)
(294)
17,280
Ashok Leyland
Automobiles
Buy
93
111
19.2
MFs
(49)
(49)
69,152
Larsen & Toubro
Construction
Buy
1,257
1,646
30.9
More Top Picks on Pg3
Top Gainers
Price (`)
Chg (%)
Key Upcoming Events
Sreinfra
67
8.7
Previous
Consensus
Date
Region
Event Description
Igl
558
7.4
Reading
Expectations
Ifci
29
7.3
Jan 6
Germany
PMI Services
55.4
55.4
Jan 7
US
Initial Jobless claims
287.0
-
Gspl
150
7.1
Euro Zone
Euro-Zone Consumer Confidence
(5.7)
(5.7)
Tatasteel
274
6.7
Jan 8
US
Change in Nonfarm payrolls
211.0
200.0
Top Losers
Price (`)
Chg (%)
Ttkprestig
4,574
(3.5)
Concor
1,312
(2.7)
Eidparry
197
(2.7)
Repcohome
661
(2.7)
Ipcalab
713
(2.5)
As on January 5, 2015
Market Outlook
January 6, 2016
Zydus expands animal health business with a strategic
acquisition
Zydus Group through its division Zydus Animal Health has announced the strategic
acquisition of select brand and manufacturing operations in Haridwar of Zoetis Inc
which is a global animal health company. As a result, Zydus gains access to a
wide range of nutrition as well as therapeutic products, which have strong brand
equity and a combined turnover of `171cr and add new dimensions to growth in
the animal health business. The animal health business accounted for ~4% of total
turnover in FY2015.
Spicejet increases flights, seating capacity
Spicejet is said have increased its frequencies in existing sectors and upgraded seat
capacity on various routes across its domestic and international network to service
additional demand from markets. The airline has also increased seating capacity
on select domestic routes by upgrading its aircraft from Bombardier Q400 which
has 78 seats to Boeing 737 which has 186 seats. As of FY2015, of its total fleet
size of 34, 41% or 14 airplanes were Q400s while the rest were either B737-800
(186 seats) or B737-900 (212). Higher number of seat count in the mix will result
in higher Available Seat Kilometer which was at 14,541mn in FY2015.
Stock Update: Bharat Electronics
We had initiated coverage on BEL stock on Dec 17, 2015 at the then CMP of
`1,206 with a price target of `1,414. The said target price has been achieved on
Jan 4, 2016 thereby generating 17.2% returns. We maintain neutral view on the
stock and wait for the quarterly results, before making any change in our rating.
Economic and Political News
Government removes export duty on iron ore pellets
Government starts probe into dumping of Chinese auto part
NHAI unveils stringent norms to weed out ‘non-serious’ players in highways
After spike in Q3, investments to fall in Q4 as projects stall
Corporate News
Income tax officials raid properties of Apollo Hospitals group
CERC initiates probe into Tata Power’s Mundra overbilling
Philip Morris eyes Godfrey Brands; in talks to take control of cigarette brands
Market Outlook
January 6, 2016
Top Picks
Large Cap
M
arket Cap
CM
P
T
arget
Upsid
e
Company
Rationale
(` Cr)
(`)
(`)
(%)
To outpace battery industry growth due to better technological
Amara Raja Batteries
14,852
870
1,040
19.6
products leading to market share gains in both the automotive
OEM and replacement segments.
Earnings to grow strongly given the MHCV cyclical upturn.
Ashok Leyland
26,495
93
111
19.2
Focus on exports and LCV's provides additional growth
avenue.
Healthy pace of branch expansion, backed by distribution
Axis Bank
1,03,802
436
630
44.3
network, will be the driving force for the bank’s retail business
and overall earnings.
The stock is trading at attractive valuations and is factoring all
HCL Tech
1,18,470
842
1,132
34.4
the bad news.
Strong visibility for a robust 20% earnings trajectory, coupled
HDFC Bank
2,68,101
1,062
1,262
18.9
with high quality of earnings on account of high quality retail
business and strategic focus on highly rated corporates.
Due to its robust franchise and capital adequacy position, the
bank is well positioned to grow by at least a few percentage
ICICI Bank
1,49,228
257
354
37.9
points higher than the average industry growth rate from a
structural point of view.
Back on the growth trend, expect a long term growth of 14%
Infosys
2,46,876
1,075
1,306
21.5
to be a US$20bn in FY2020.
Well positioned to benefit from such expected gradual
recovery in the overall domestic capex cycle, given its presence
Larsen & Toubro
1,17,086
1,257
1,646
30.9
across various infrastructure segments, its execution
capabilities, and its strong balance sheet.
LICHF continues to grow its retail loan book at a healthy pace
with improvement in asset quality. We expect the company to
LIC Housing Finance
25,296
501
592
18.0
post a healthy loan book which is likely to reflect in a strong
earnings growth.
Source: Company, Angel Research
Mid Cap
M
arket Cap
CM
P
T
arget
Upsid
e
Company
Rationale
(` Cr)
(`)
(`)
(%)
Favourable outlook for the AC industry to augur well for
Cooling products business which is out pacing the market
Blue Star
3,404
379
439
16.0
growth. EMPPAC division's profitability to improve once
operating environment turns around.
Change in business focus towards high-margin chronic &
Ipca labs
8,996
713
900
26.2
lifestyle segments and increasing penetration in Europe and
US
Economic recovery to have favourable impact on advertising &
circulation revenue growth. Further, the acquisition of a radio
Jagran Prakashan
5,435
166
189
13.7
business (Radio City) would also boost the company's revenue
growth.
Earnings boost on back of stable material prices and
Radico Khaitan
1,534
115
156
35.3
favourable pricing environment. Valuation discount to peers
provides additional comfort
Strong brands and distribution network would boost growth
Siyaram Silk Mills
1,123
1,198
1,354
13.0
going ahead. Stock currently trades at an inexpensive
valuation.
Structural shift in the Lighting industry towards LED lighting will
Surya Roshni
767
175
201
14.9
drive growth.
Massive capacity expansion along with rail advantage at ICD
Navkar Corporation
2,990
210
265
26.4
as well CFS augurs well for the company
Source: Company, Angel Research
Market Outlook
January 06, 2016
Key Upcoming Events
Global economic events release calendar
Date
Time
Country
Event Description
Unit
Period
Bloomberg Data
Last Reported Estimated
Jan 6, 2016
2:25PM
Germany
PMI Services
Value
Dec F
55.40
55.40
Jan 7, 2016
7:00PM
US
Initial Jobless claims
Thousands
Jan 2
287.00
275.00
3:30PM
Euro Zone
Euro-Zone Consumer Confidence
Value
Dec F
(5.70)
(5.70)
Jan 8, 2016
7:00PM
US
Change in Nonfarm payrolls
Thousands
Dec
211.00
200.00
7:00PM
US
Unnemployment rate
%
Dec
5.00
5.00
Jan 9, 2016
7:00AM
China
Consumer Price Index (YoY)
% Change
Dec
1.50
1.60
Jan 11, 2016
India
Imports YoY%
% Change
Dec
(30.26)
--
India
Exports YoY%
% Change
Dec
(24.43)
--
Jan 12, 2016
5:30PM
India
Industrial Production YoY
% Change
Nov
9.80
--
3:00PM
UK
Industrial Production (YoY)
% Change
Nov
1.70
--
Jan 13, 2016
China
Exports YoY%
% Change
Dec
(6.80)
(7.80)
Jan 14, 2016
12:00PM
India
Monthly Wholesale Prices YoY%
% Change
Dec
(1.99)
--
5:30PM
UK
BOE Announces rates
% Ratio
Jan 14
0.50
0.50
Jan 15, 2016
7:45PM
US
Industrial Production
%
Dec
(0.56)
(0.10)
US
Producer Price Index (mom)
% Change
Dec
0.10
--
Jan 19, 2016
3:00PM
UK
CPI (YoY)
% Change
Dec
0.10
--
7:30AM
China
Industrial Production (YoY)
% Change
Dec
6.20
--
7:30AM
China
Real GDP (YoY)
% Change
4Q
6.90
--
Jan 20, 2016
7:00PM
US
Housing Starts
Thousands
Dec
1,173.00
--
7:00PM
US
Building permits
Thousands
Dec
1,282.00
--
3:00PM
UK
Jobless claims change
% Change
Dec
3.90
--
7:00PM
US
Consumer price index (mom)
% Change
Dec
--
--
Jan 21, 2016
3:30PM
Euro Zone
Euro-Zone CPI (YoY)
%
Dec F
0.20
--
6:15PM
Euro Zone
ECB announces interest rates
%
Jan 21
0.05
--
Jan 22, 2016
2:00PM
Germany
PMI Manufacturing
Value
Jan P
53.20
--
8:30PM
US
Existing home sales
Million
Dec
4.76
--
Jan 26, 2016
8:30PM
US
Consumer Confidence
S.A./ 1985=100
Jan
96.50
--
Jan 27, 2016
8:30PM
US
New home sales
Thousands
Dec
490.00
--
Jan 28, 2016
3:00PM
UK
GDP (YoY)
% Change
4Q A
2.10
--
12:30AM
US
FOMC rate decision
%
Jan 27
0.50
0.50
Jan 29, 2016
7:00PM
US
GDP Qoq (Annualised)
% Change
4Q A
2.00
--
Feb 1, 2016
3:00PM
UK
PMI Manufacturing
Value
Jan
51.90
--
6:30AM
China
PMI Manufacturing
Value
Jan
49.70
--
Feb 2, 2016
11:00AM
India
RBI Reverse Repo rate
%
Feb 2
5.75
--
11:00AM
India
RBI Repo rate
%
Feb 2
6.75
--
11:00AM
India
RBI Cash Reserve ratio
%
Feb 2
4.00
--
Source: Bloomberg, Angel Research
Market Outlook
January 6, 2016
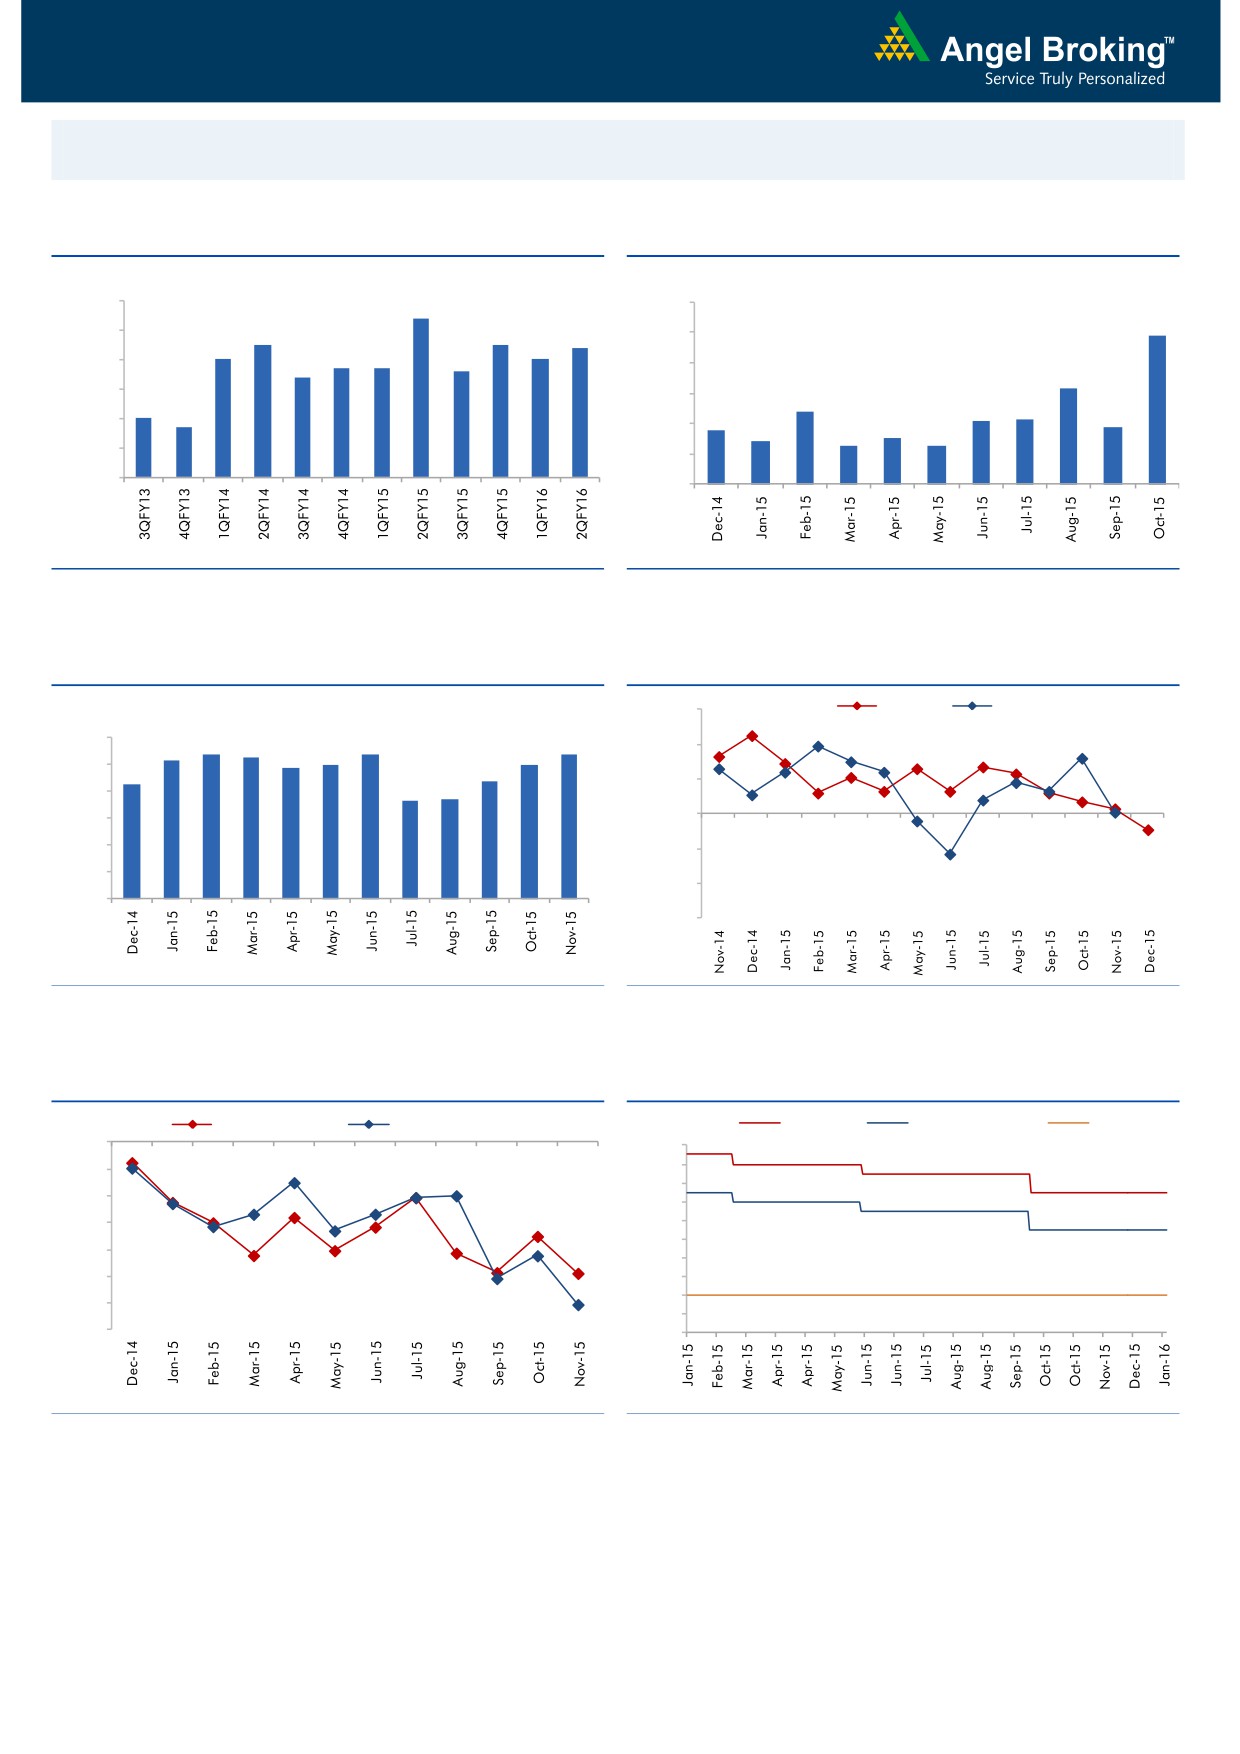
Macro watch
Exhibit 1: Quarterly GDP trends
Exhibit 2: IIP trends
(%)
(%)
9.0
8.4
12.0
9.8
8.0
7.5
7.5
7.4
10.0
7.0
7.0
6.7
6.7
6.6
7.0
6.4
8.0
6.3
6.0
6.0
4.8
5.0
4.2
4.3
4.7
3.6
3.8
5.0
4.0
3.0
2.8
2.5
2.5
4.0
2.0
3.0
-
Source: CSO, Angel Research
Source: MOSPI, Angel Research
Exhibit 3: Monthly CPI inflation trends
Exhibit 4: Manufacturing and services PMI
(%)
56.0
Mfg. PMI
Services PMI
6.0
5.4
5.3
5.4
5.4
5.2
5.0
5.0
54.0
4.9
5.0
4.3
4.4
3.7
3.7
52.0
4.0
3.0
50.0
2.0
48.0
1.0
46.0
-
44.0
Source: MOSPI, Angel Research
Source: Market, Angel Research; Note: Level above 50 indicates expansion
Exhibit 5: Exports and imports growth trends
Exhibit 6: Key policy rates
(%)
Exports yoy growth
Imports yoy growth
(%)
Repo rate
Reverse Repo rate
CRR
0.0
8.00
(5.0)
7.50
7.00
(10.0)
6.50
(15.0)
6.00
5.50
(20.0)
5.00
(25.0)
4.50
4.00
(30.0)
3.50
(35.0)
3.00
Source: Bloomberg, Angel Research
Source: RBI, Angel Research
Market Outlook
January 6, 2016
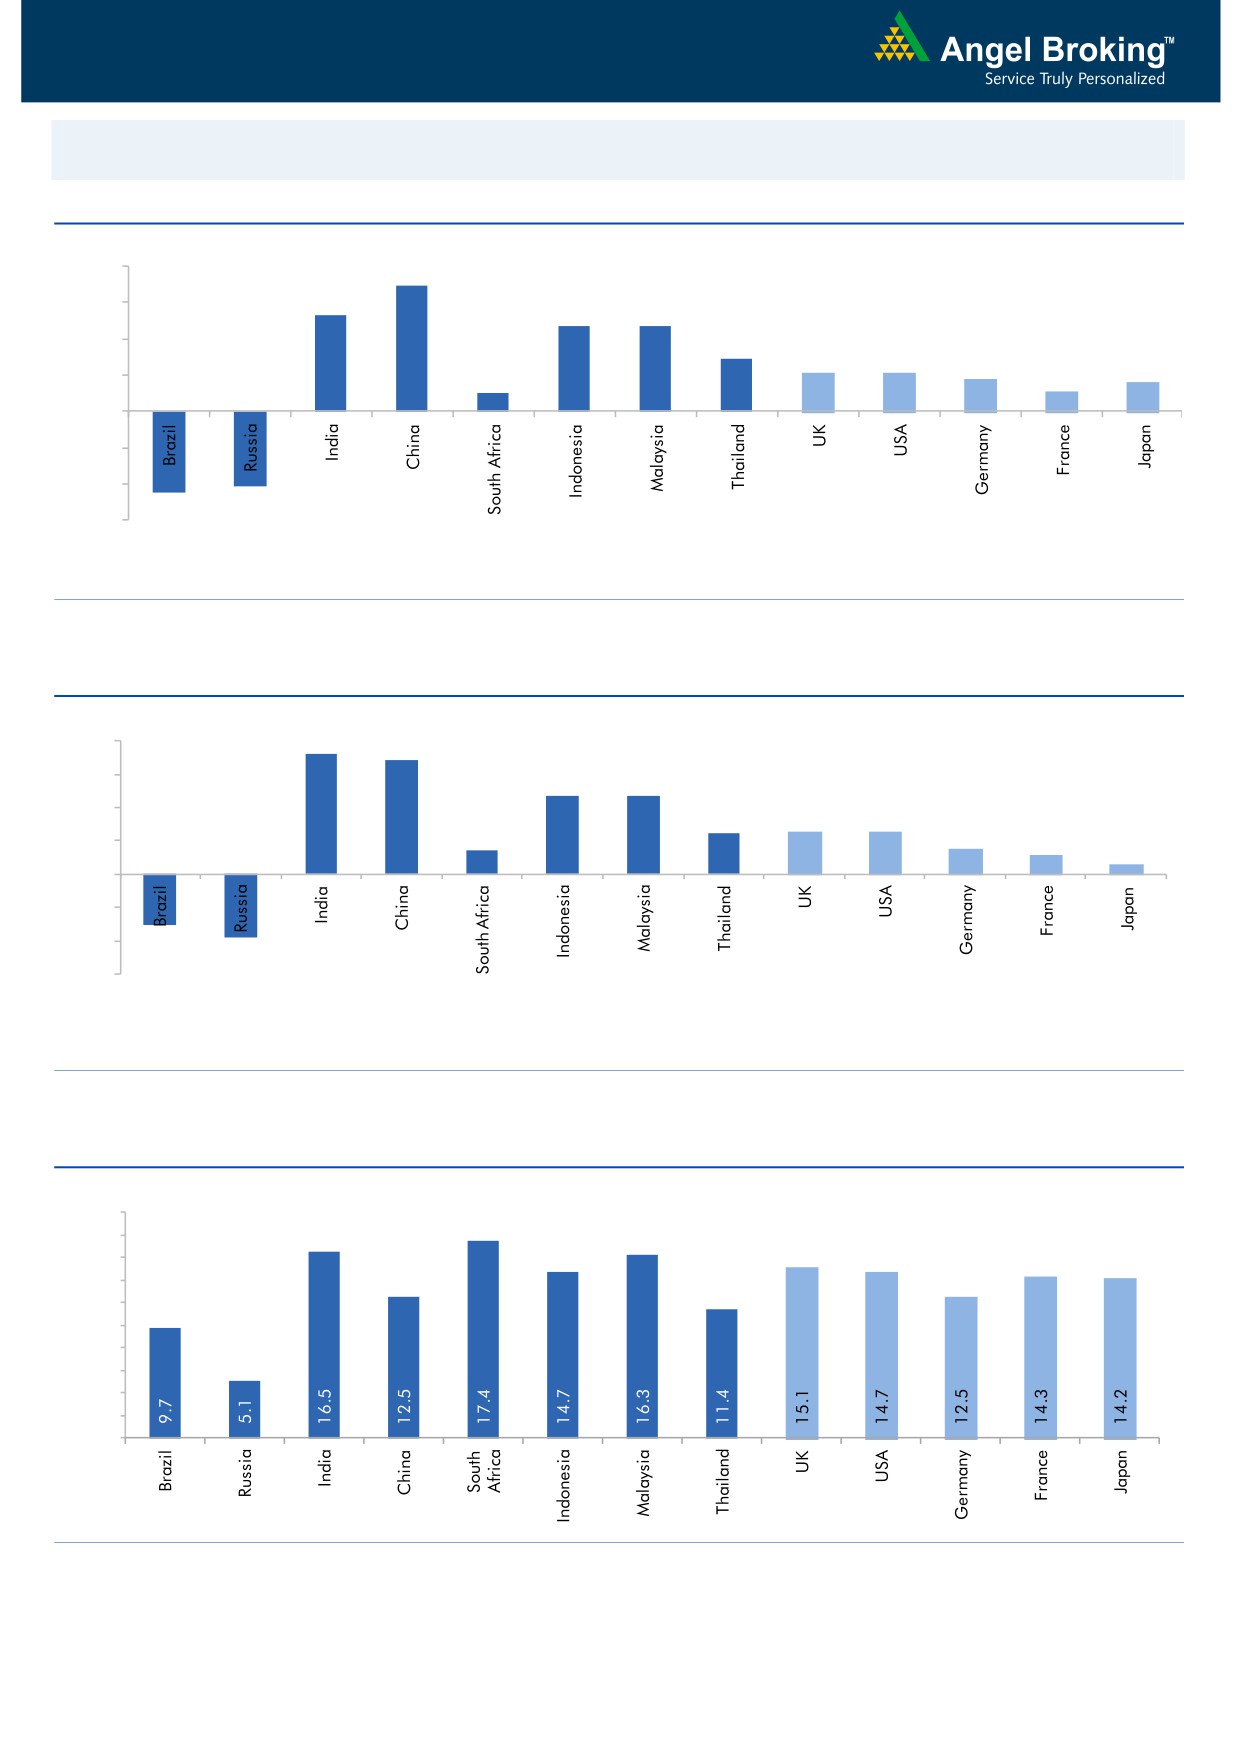
Global watch
Exhibit 1: Latest quarterly GDP Growth (%, yoy) across select developing and developed countries
(%)
8.0
6.9
5.3
6.0
4.7
4.7
4.0
2.9
2.1
2.1
1.8
2.0
1.0
1.1
1.6
-
(2.0)
(4.0)
(4.1)
(4.5)
(6.0)
Source: Bloomberg, Angel Research
Exhibit 2: 2015 GDP Growth projection by IMF (%, yoy) across select developing and developed countries
(%)
7.3
8.0
6.8
6.0
4.7
4.7
4.0
2.5
2.5
2.6
1.4
1.5
2.0
1.2
0.6
-
(2.0)
(4.0)
(3.0)
(3.8)
(6.0)
Source: IMF, Angel Research
Exhibit 3: One year forward P-E ratio across select developing and developed countries
(x)
20.0
18.0
16.0
14.0
12.0
10.0
8.0
6.0
4.0
2.0
-
Source: IMF, Angel Research
Market Outlook
January 6, 2016
Exhibit 4: Relative performance of indices across globe
Returns (%)
Country
Name of index
Closing price
1M
3M
1YR
Brazil
Bovespa
42,419
(6.0)
(3.5)
(16.6)
Russia
Micex
1,754
(0.9)
8.8
22.2
India
Nifty
7,785
(1.0)
(2.1)
(6.0)
China
Shanghai Composite
3,288
(6.6)
7.8
7.1
South Africa
Top 40
44,673
(3.5)
(2.2)
6.4
Mexico
Mexbol
42,042
(3.2)
(1.5)
2.3
Indonesia
LQ45
790
0.3
13.3
(10.9)
Malaysia
KLCI
1,666
(1.0)
2.8
(5.6)
Thailand
SET 50
786
(9.6)
(9.6)
(23.6)
USA
Dow Jones
17,159
(3.2)
4.2
(1.2)
UK
FTSE
6,137
(4.0)
0.1
(4.4)
Japan
Nikkei
18,374
(8.2)
8.5
4.2
Germany
DAX
10,310
(9.4)
8.4
8.3
France
CAC
4,538
(7.5)
(1.7)
7.3
Source: Bloomberg, Angel Research
Stock Watch
January 06, 2016
Company Name
Reco
CMP
Target
Mkt Cap
Sales ( Čcr )
OPM(%)
EPS (Č)
PER(x)
P/BV(x)
RoE(%)
EV/Sales(x)
(Č)
Price ( Č)
( Č cr )
FY16E FY17E
FY16E
FY17E
FY16E
FY17E
FY16E
FY17E
FY16E
FY17E
FY16E
FY17E
FY16E
FY17E
Agri / Agri Chemical
Rallis
Neutral
176
-
3,425
2,075
2,394
14.4
14.4
9.5
11.0
18.5
16.0
3.7
3.2
21.1
21.3
1.7
1.5
United Phosphorus
Buy
435
510
18,636
13,698
15,752
17.6
17.6
32.1
38.5
13.6
11.3
2.7
2.2
21.4
21.3
1.5
1.2
Auto & Auto Ancillary
Ashok Leyland
Buy
93
111
26,495
17,995
21,544
11.4
11.6
3.4
4.7
27.4
19.8
4.8
4.4
17.7
22.2
1.4
1.2
Bajaj Auto
Accumulate
2,497
2,728
72,256
23,695
27,298
21.3
20.4
134.6
151.5
18.6
16.5
5.9
5.0
31.8
30.6
2.6
2.2
Bharat Forge
Accumulate
858
943
19,974
7,867
8,881
20.0
20.3
34.4
41.0
24.9
20.9
4.8
4.0
21.1
20.9
2.7
2.3
Eicher Motors
Accumulate
17,160
19,036
46,596
15,379
16,498
15.6
16.6
473.2
574.8
36.3
29.9
13.4
10.0
36.7
33.2
3.0
2.7
Gabriel India
Neutral
97
-
1,400
1,415
1,544
8.7
9.0
4.6
5.4
21.2
18.1
3.8
3.4
18.1
18.9
1.0
0.9
Hero Motocorp
Accumulate
2,621
2,774
52,339
28,561
31,559
14.7
14.7
151.1
163.2
17.4
16.1
6.7
5.7
38.7
35.6
1.7
1.5
Jamna Auto Industries Neutral
144
-
1,147
1,292
1,486
9.3
9.8
6.0
7.5
23.9
19.2
5.0
4.2
20.7
21.8
1.0
0.8
L G Balakrishnan & Bros Neutral
505
-
793
1,254
1,394
11.6
11.8
35.9
41.7
14.1
12.1
1.9
1.7
13.5
13.8
0.7
0.7
Mahindra and Mahindra Buy
1,248
1,449
77,515
39,031
44,440
13.8
13.9
57.9
67.6
21.6
18.5
3.5
3.1
16.1
16.6
1.6
1.4
Maruti
Neutral
4,568
-
138,001
57,865
68,104
16.4
16.7
176.3
225.5
25.9
20.3
5.0
4.3
19.4
21.2
2.2
1.8
Minda Industries
Neutral
940
-
1,491
2,567
2,965
8.0
8.3
46.1
57.8
20.4
16.3
3.4
2.8
16.7
17.3
0.7
0.6
Motherson Sumi
Accumulate
290
313
38,293
39,343
45,100
8.8
9.1
10.1
12.5
28.7
23.2
9.1
7.1
35.3
34.4
1.1
0.9
Rane Brake Lining
Neutral
350
-
277
454
511
11.1
11.4
23.8
28.1
14.7
12.5
2.1
1.9
14.2
15.3
0.7
0.7
Setco Automotive
Neutral
41
-
546
594
741
12.7
13.7
1.7
3.2
24.1
12.8
2.5
2.2
10.4
16.9
1.4
1.1
Tata Motors
Accumulate
375
402
108,169
266,022
312,667
12.8
13.1
26.3
38.3
14.3
9.8
1.9
1.6
8.4
12.1
0.6
0.5
TVS Motor
Buy
287
338
13,633
11,569
13,648
7.3
8.7
10.3
16.1
27.9
17.8
6.9
5.4
24.8
30.5
1.2
1.0
Amara Raja Batteries
Buy
870
1,040
14,852
4,892
5,871
17.4
17.6
28.8
37.1
30.2
23.4
7.1
5.6
23.4
24.1
3.0
2.4
Exide Industries
Accumulate
142
162
12,104
6,950
7,784
14.4
14.8
6.6
7.3
21.6
19.5
2.7
2.5
12.6
12.8
1.5
1.3
Apollo Tyres
Accumulate
157
171
8,002
12,146
12,689
16.8
16.0
21.2
19.0
7.4
8.3
1.2
1.1
16.5
13.0
0.7
0.8
Ceat
Accumulate
1,060
1,119
4,289
6,041
6,597
14.1
13.7
99.5
111.9
10.7
9.5
2.1
1.8
19.6
18.5
0.9
0.7
JK Tyres
Neutral
116
-
2,627
7,446
7,669
15.2
14.0
19.6
18.4
5.9
6.3
1.5
1.2
25.2
19.5
0.8
0.7
Swaraj Engines
Neutral
961
-
1,194
552
630
14.2
14.7
44.6
54.1
21.6
17.8
5.0
4.6
23.2
25.6
2.0
1.7
Subros
Neutral
108
-
646
1,268
1,488
11.6
11.9
3.7
6.6
29.1
16.3
2.0
1.8
6.8
11.4
0.8
0.7
Indag Rubber
Neutral
213
-
560
283
329
17.0
17.2
13.0
15.4
16.5
13.8
3.6
3.0
21.8
21.6
1.7
1.4
Capital Goods
ACE
Neutral
47
-
467
660
839
4.7
8.2
1.0
3.9
47.2
12.1
1.5
1.3
3.2
11.3
0.9
0.7
BEML
Neutral
1,271
-
5,293
3,277
4,006
6.0
8.9
29.2
64.3
43.5
19.8
2.4
2.2
5.7
11.7
1.7
1.3
Bharat Electronics
Neutral
1,366
-
32,788
7,737
8,634
16.8
17.2
54.0
61.0
25.3
22.4
3.6
3.2
39.3
45.6
3.4
2.9
Stock Watch
January 06, 2016
Company Name
Reco
CMP
Target
Mkt Cap
Sales ( Čcr )
OPM(%)
EPS (Č)
PER(x)
P/BV(x)
RoE(%)
EV/Sales(x)
(Č)
Price ( Č)
( Č cr )
FY16E
FY17E
FY16E
FY17E
FY16E
FY17E
FY16E
FY17E
FY16E
FY17E
FY16E
FY17E
FY16E
FY17E
Capital Goods
Voltas
Buy
306
353
10,118
5,363
5,963
8.0
9.1
11.0
13.8
27.8
22.2
4.3
3.7
16.2
17.9
1.8
1.6
BGR Energy
Neutral
133
-
961
3,615
3,181
9.5
9.4
16.7
12.4
8.0
10.7
0.8
0.7
10.0
7.0
0.7
0.8
BHEL
Neutral
166
-
40,740
33,722
35,272
10.8
11.7
10.5
14.2
15.9
11.7
1.2
1.1
7.0
9.0
1.3
1.2
Blue Star
Buy
379
439
3,404
3,548
3,977
6.3
6.9
13.7
17.2
27.6
22.1
7.0
4.5
26.1
25.4
1.1
0.9
Crompton Greaves
Neutral
198
-
12,385
13,484
14,687
4.9
6.2
4.5
7.1
43.9
27.8
3.1
2.9
7.2
10.8
1.0
1.0
Inox Wind
Buy
359
458
7,970
4,980
5,943
17.0
17.5
26.6
31.6
13.5
11.4
4.0
3.0
35.0
30.0
1.7
1.4
KEC International
Neutral
152
-
3,899
8,791
9,716
6.1
6.8
5.4
8.2
28.1
18.5
2.8
2.6
10.0
14.0
0.7
0.6
Thermax
Neutral
882
-
10,507
6,413
7,525
7.4
8.5
30.5
39.3
28.9
22.4
4.5
3.9
15.0
17.0
1.6
1.3
Cement
ACC
Buy
1,344
1,630
25,225
13,151
14,757
16.4
18.3
63.9
83.4
21.0
16.1
2.7
2.5
13.3
16.1
1.8
1.5
Ambuja Cements
Accumulate
204
233
31,635
11,564
12,556
19.4
20.7
8.9
10.1
22.9
20.2
2.9
2.7
12.8
13.8
2.4
2.2
HeidelbergCement
Neutral
78
-
1,757
1,772
1,926
13.3
15.4
1.0
3.0
77.6
25.9
2.0
1.8
2.6
7.9
1.6
1.3
India Cements
Accumulate
102
112
3,119
4,216
4,840
18.0
19.5
4.0
9.9
25.4
10.3
1.0
0.9
4.0
9.5
1.1
0.9
JK Cement
Buy
581
744
4,062
3,661
4,742
10.1
15.8
18.0
61.0
32.3
9.5
2.3
2.1
7.5
22.9
1.6
1.2
J K Lakshmi Cement
Buy
334
430
3,927
2,947
3,616
16.7
19.9
11.5
27.2
29.0
12.3
2.8
2.4
9.8
20.8
1.7
1.4
Mangalam Cements
Neutral
197
-
525
1,053
1,347
10.5
13.3
8.4
26.0
23.4
7.6
1.0
0.9
4.3
12.5
0.9
0.6
Orient Cement
Buy
155
183
3,165
1,854
2,524
21.2
22.2
7.7
11.1
20.1
13.9
2.9
2.5
13.3
15.7
2.4
1.7
Ramco Cements
Neutral
399
-
9,499
4,036
4,545
20.8
21.3
15.1
18.8
26.4
21.2
3.2
2.9
12.9
14.3
2.9
2.5
Shree Cement^
Neutral
11,121
-
38,741
7,150
8,742
26.7
28.6
228.0
345.5
48.8
32.2
7.2
6.0
15.7
20.3
5.2
4.2
UltraTech Cement
Buy
2,739
3,282
75,163
25,021
30,023
19.1
21.6
89.0
132.0
30.8
20.8
3.6
3.1
12.2
15.9
3.1
2.6
Construction
ITNL
Neutral
93
-
3,058
7,360
8,825
34.0
35.9
7.0
9.0
13.3
10.3
0.5
0.4
3.2
3.7
3.8
3.7
KNR Constructions
Buy
572
673
1,609
937
1,470
14.3
14.0
33.5
38.6
17.1
14.8
2.6
2.2
15.4
15.4
1.8
1.2
Larsen & Toubro
Buy
1,257
1,646
117,086
65,065
77,009
11.5
11.7
61.5
65.6
20.4
19.2
2.1
1.9
13.4
14.0
2.0
1.7
Gujarat Pipavav Port
Neutral
158
-
7,636
629
684
51.0
52.2
6.4
5.9
24.7
26.8
3.3
3.0
15.9
12.7
11.8
10.6
MBL Infrastructures
Buy
218
285
905
2,313
2,797
12.2
14.6
19.0
20.0
11.5
10.9
1.2
1.1
11.3
10.6
1.1
1.0
Nagarjuna Const.
Neutral
77
-
4,306
7,892
8,842
8.8
9.1
3.0
5.3
25.8
14.6
1.3
1.2
5.0
8.5
0.8
0.7
PNC Infratech
Neutral
542
-
2,782
1,873
2,288
13.2
13.5
24.0
32.0
22.6
17.0
2.2
2.0
12.1
12.3
1.6
1.3
Simplex Infra
Neutral
312
-
1,543
5,955
6,829
10.3
10.5
16.0
31.0
19.5
10.1
1.0
0.9
5.3
9.9
0.8
0.7
Power Mech Projects
Neutral
660
-
971
1,539
1,801
12.8
12.7
59.0
72.1
11.2
9.2
1.7
1.4
18.6
16.8
0.6
0.5
Sadbhav Engineering
Neutral
331
-
5,670
3,481
4,219
10.7
10.8
8.0
12.0
41.3
27.6
3.8
3.4
10.3
13.5
1.9
1.6
Stock Watch
January 06, 2016
Company Name
Reco
CMP
Target
Mkt Cap
Sales ( Čcr )
OPM(%)
EPS (Č)
PER(x)
P/BV(x)
RoE(%)
EV/Sales(x)
(Č)
Price ( Č)
( Č cr )
FY16E
FY17E
FY16E
FY17E
FY16E
FY17E
FY16E
FY17E
FY16E
FY17E
FY16E
FY17E
FY16E
FY17E
Construction
NBCC
Accumulate
986
1,089
11,829
7,382
9,506
7.7
8.6
39.8
54.4
24.8
18.1
6.0
4.7
26.7
29.1
1.4
1.0
MEP Infra
Neutral
46
-
750
1,956
1,876
28.1
30.5
1.3
3.0
35.5
15.4
7.4
5.0
21.2
32.8
1.8
1.8
SIPL
Neutral
96
-
3,381
675
1,042
62.4
64.7
-
-
3.6
4.1
-
-
16.7
11.2
Financials
Allahabad Bank
Neutral
68
-
4,081
8,569
9,392
2.8
2.9
16.3
27.5
4.2
2.5
0.4
0.3
7.6
11.9
-
-
Axis Bank
Buy
436
630
103,802
26,473
31,527
3.5
3.6
35.7
43.5
12.2
10.0
2.4
2.1
17.9
18.9
-
-
Bank of Baroda
Neutral
148
-
34,044
18,485
21,025
1.9
2.0
13.5
21.1
11.0
7.0
0.9
0.8
7.3
10.6
-
-
Bank of India
Neutral
114
-
9,040
15,972
17,271
1.9
2.0
15.3
33.4
7.5
3.4
0.3
0.3
3.6
7.6
-
-
Canara Bank
Neutral
231
-
12,516
15,441
16,945
2.0
2.1
46.6
70.4
5.0
3.3
0.4
0.4
8.0
11.2
-
-
Dena Bank
Neutral
41
-
2,617
3,440
3,840
2.1
2.3
7.3
10.0
5.6
4.0
0.4
0.3
6.1
7.9
-
-
Federal Bank
Neutral
56
-
9,583
3,477
3,999
3.0
3.0
5.0
6.2
11.1
8.9
1.1
1.0
10.6
11.9
-
-
HDFC
Neutral
1,209
-
190,884
10,358
11,852
3.3
3.3
41.1
47.0
29.4
25.7
5.6
5.1
24.7
24.9
-
-
HDFC Bank
Buy
1,062
1,262
268,101
38,309
47,302
4.3
4.3
49.3
61.1
21.5
17.4
3.7
3.2
18.5
19.7
-
-
ICICI Bank
Buy
257
354
149,228
34,279
39,262
3.3
3.3
21.0
24.4
12.2
10.5
2.1
1.7
14.4
14.7
-
-
IDBI Bank
Neutral
84
-
13,505
9,625
10,455
1.8
1.8
8.5
14.2
9.9
5.9
0.6
0.6
5.9
9.3
-
-
Indian Bank
Neutral
113
-
5,420
6,160
6,858
2.5
2.5
24.5
29.8
4.6
3.8
0.4
0.3
7.7
8.6
-
-
LIC Housing Finance
Buy
501
592
25,296
3,101
3,745
2.5
2.5
33.0
40.2
15.2
12.5
2.8
2.4
19.7
20.5
-
-
Oriental Bank
Neutral
137
-
4,093
7,643
8,373
2.4
2.4
37.2
45.4
3.7
3.0
0.3
0.3
8.2
9.4
-
-
Punjab Natl.Bank
Neutral
111
-
21,776
23,638
26,557
2.8
2.8
17.9
27.2
6.2
4.1
0.6
0.5
8.5
12.0
-
-
South Ind.Bank
Neutral
20
-
2,694
1,965
2,185
2.5
2.5
2.5
3.3
8.0
6.0
0.8
0.7
9.5
11.7
-
-
St Bk of India
Buy
218
283
169,423
82,520
93,299
2.7
2.8
20.0
24.5
10.9
8.9
1.2
1.1
11.5
12.8
-
-
Union Bank
Neutral
142
-
9,793
12,646
14,129
2.3
2.4
31.0
39.1
4.6
3.7
0.5
0.4
9.8
11.4
-
-
Vijaya Bank
Neutral
34
-
2,925
3,536
3,827
1.9
1.9
5.5
6.7
6.2
5.1
0.5
0.5
7.8
8.8
-
-
Yes Bank
Buy
708
921
29,692
7,190
9,011
3.2
3.3
58.2
69.7
12.2
10.2
2.2
1.9
19.2
19.6
-
-
FMCG
Asian Paints
Neutral
901
-
86,409
16,553
19,160
16.0
16.2
17.7
21.5
51.0
41.9
13.5
12.2
29.4
31.2
5.1
4.4
Britannia
Neutral
2,965
-
35,570
8,065
9,395
9.6
10.2
47.2
65.5
62.8
45.3
20.9
19.7
38.3
41.2
4.3
3.7
Colgate
Neutral
973
-
26,461
4,836
5,490
19.5
19.7
48.5
53.2
20.1
18.3
14.7
12.8
99.8
97.5
5.4
4.7
Dabur India
Neutral
276
-
48,579
9,370
10,265
17.1
17.2
7.3
8.1
37.7
34.1
11.4
9.2
33.7
30.6
5.1
4.6
GlaxoSmith Con*
Neutral
6,573
-
27,641
4,919
5,742
17.2
17.4
168.3
191.2
39.1
34.4
11.1
9.4
28.8
28.9
5.2
4.4
Godrej Consumer
Neutral
1,315
-
44,773
10,168
12,886
16.1
16.1
32.1
38.4
41.0
34.2
8.3
7.7
19.7
21.0
4.5
3.5
Stock Watch
January 06, 2016
Company Name
Reco
CMP
Target
Mkt Cap
Sales ( Čcr )
OPM(%)
EPS (Č)
PER(x)
P/BV(x)
RoE(%)
EV/Sales(x)
(Č)
Price ( Č)
( Č cr )
FY16E FY17E
FY16E
FY17E
FY16E
FY17E
FY16E
FY17E
FY16E
FY17E
FY16E
FY17E
FY16E
FY17E
FMCG
HUL
Neutral
848
-
183,453
34,940
38,957
17.5
17.7
20.8
24.7
40.8
34.3
45.3
36.2
110.5
114.2
5.1
4.5
ITC
Buy
325
382
260,951
41,068
45,068
37.8
37.4
13.9
15.9
23.3
20.4
7.8
6.9
34.1
33.8
6.0
5.4
Marico
Buy
231
363
29,790
6,551
7,766
15.7
16.0
10.4
12.5
22.3
18.5
6.5
5.4
33.2
32.4
4.5
3.8
Nestle*
Buy
5,660
6,646
54,570
11,291
12,847
22.2
22.3
158.9
184.6
35.6
30.7
18.6
16.8
55.0
57.3
4.7
4.1
Tata Global
Neutral
148
-
9,363
8,635
9,072
9.8
9.9
6.5
7.6
22.8
19.5
2.3
2.2
6.8
7.4
1.0
1.0
IT
HCL Tech^
Buy
842
1,132
118,470
42,038
47,503
23.2
23.5
55.8
62.9
15.1
13.4
3.5
2.7
23.0
19.8
2.4
1.9
Infosys
Buy
1,075
1,306
246,876
60,250
66,999
28.0
28.0
58.3
63.7
18.4
16.9
3.9
3.3
20.9
19.7
3.4
2.9
TCS
Buy
2,350
3,165
463,120
111,274
126,852
28.4
28.7
125.4
143.9
18.7
16.3
7.4
6.8
39.9
42.2
3.8
3.3
Tech Mahindra
Buy
521
646
50,334
25,566
28,890
16.0
17.0
26.3
31.9
19.8
16.3
3.6
3.0
17.9
18.6
1.7
1.5
Wipro
Buy
557
719
137,600
52,414
58,704
23.7
23.8
38.4
42.3
14.5
13.2
2.8
2.5
19.5
18.0
2.2
1.8
Media
D B Corp
Accumulate
326
356
5,982
2,241
2,495
27.8
27.9
21.8
25.6
15.0
12.7
3.9
3.4
26.7
28.5
2.6
2.3
HT Media
Neutral
90
-
2,098
2,495
2,603
11.2
11.2
7.3
8.6
12.4
10.5
1.0
0.9
7.4
8.1
0.3
0.3
Jagran Prakashan
Accumulate
166
189
5,435
2,170
2,355
27.2
26.2
8.9
9.9
18.7
16.8
3.9
3.4
20.9
20.5
2.4
2.2
Sun TV Network
Neutral
426
-
16,790
2,779
3,196
70.2
70.5
22.8
27.3
18.7
15.6
4.6
4.2
26.7
28.3
5.8
5.0
Hindustan Media
Neutral
289
-
2,122
920
1,031
20.0
20.0
19.2
20.9
15.1
13.9
2.5
2.1
16.4
15.3
1.8
1.6
Ventures
Metals & Mining
Coal India
Buy
326
380
205,945
76,167
84,130
19.9
22.3
22.4
25.8
14.5
12.6
5.2
5.1
35.5
41.0
2.0
1.8
Hind. Zinc
Buy
151
175
63,718
14,641
14,026
50.4
50.4
17.7
16.0
8.5
9.4
1.3
1.2
16.2
13.2
2.0
1.8
Hindalco
Neutral
83
-
17,098
104,356
111,186
8.7
9.5
6.7
11.1
12.3
7.5
0.4
0.4
3.5
5.9
0.7
0.6
JSW Steel
Neutral
1,083
-
26,183
42,308
45,147
16.4
20.7
(10.3)
49.5
21.9
1.2
1.2
(1.0)
5.6
1.7
1.6
NMDC
Neutral
93
-
36,971
8,237
10,893
46.6
44.5
10.0
11.7
9.4
8.0
1.0
0.9
12.5
13.0
4.3
3.3
SAIL
Neutral
51
-
21,043
45,915
53,954
7.2
10.5
1.5
4.4
33.8
11.6
0.5
0.5
2.3
4.1
1.1
1.0
Vedanta
Neutral
92
-
27,394
71,445
81,910
26.2
26.3
12.9
19.2
7.2
4.8
0.5
0.4
7.2
8.9
0.8
0.6
Tata Steel
Neutral
274
-
26,621
126,760
137,307
8.9
11.3
6.4
23.1
43.1
11.9
0.9
0.8
2.0
7.1
0.8
0.7
Oil & Gas
Cairn India
Neutral
140
-
26,323
11,323
12,490
49.4
51.0
20.7
20.7
6.8
6.8
0.4
0.4
6.4
6.1
1.4
0.8
GAIL
Neutral
373
-
47,295
64,856
70,933
9.1
9.6
24.0
28.9
15.6
12.9
1.3
1.2
8.8
9.6
0.9
0.8
ONGC
Neutral
242
-
206,872
154,564
167,321
36.8
37.4
28.6
32.5
8.5
7.4
1.1
1.0
12.7
13.5
1.5
1.4
Petronet LNG
Neutral
260
-
19,504
29,691
31,188
5.8
6.2
12.8
13.4
20.3
19.4
3.0
2.7
15.8
14.8
0.7
0.7
Indian Oil Corp
Neutral
443
-
107,473
359,607
402,760
5.9
6.1
42.5
48.7
10.4
9.1
1.4
1.2
14.1
14.4
0.4
0.4
Reliance Industries
Neutral
1,005
-
325,573
304,775
344,392
12.6
13.4
91.3
102.6
11.0
9.8
1.2
1.1
11.8
12.0
1.0
0.8
Stock Watch
January 06, 2016
Company Name
Reco
CMP
Target
Mkt Cap
Sales ( Čcr )
OPM(%)
EPS (Č)
PER(x)
P/BV(x)
RoE(%)
EV/Sales(x)
(Č)
Price ( Č)
( Č cr )
FY16E FY17E
FY16E
FY17E
FY16E
FY17E
FY16E
FY17E
FY16E
FY17E
FY16E
FY17E
FY16E
FY17E
Pharmaceuticals
Alembic Pharma
Neutral
676
-
12,747
2,658
3,112
24.1
20.2
24.6
23.9
27.5
28.3
9.9
7.6
42.5
30.2
4.8
4.0
Aurobindo Pharma
Neutral
864
-
50,460
14,923
17,162
23.0
23.0
38.2
43.6
22.6
19.8
7.0
5.2
36.0
30.2
3.7
3.2
Aventis*
Neutral
4,287
-
9,873
2,082
2,371
17.4
20.8
118.2
151.5
36.3
28.3
5.3
4.3
19.9
25.5
4.4
3.7
Cadila Healthcare
Neutral
314
-
32,099
10,224
11,840
21.0
22.0
14.6
17.6
21.5
17.8
5.9
4.6
30.8
29.0
3.2
2.7
Cipla
Neutral
641
-
51,500
14,211
16,611
20.6
19.0
27.0
28.9
23.8
22.2
4.0
3.5
18.4
16.8
3.6
3.0
Dr Reddy's
Buy
3,067
3,933
52,297
16,838
19,575
25.0
23.1
167.5
178.8
18.3
17.2
3.9
3.2
23.1
20.4
3.0
2.6
Dishman Pharma
Neutral
350
-
2,820
1,733
1,906
21.5
21.5
17.0
19.9
20.6
17.6
2.1
1.9
10.5
11.2
2.1
1.8
GSK Pharma*
Neutral
3,266
-
27,667
2,870
3,158
20.0
22.1
59.5
68.3
54.9
47.8
16.2
16.6
28.5
34.3
9.1
8.4
Indoco Remedies
Neutral
325
-
2,996
1,033
1,199
15.9
18.2
9.4
13.6
34.6
23.9
5.1
4.4
15.7
19.7
3.0
2.6
Ipca labs
Buy
713
900
8,996
3,363
3,909
12.9
18.6
13.4
28.0
53.2
25.5
3.8
3.3
7.4
14.0
3.0
2.5
Lupin
Neutral
1,783
-
80,310
13,092
16,561
25.0
27.0
50.4
68.3
35.4
26.1
7.3
5.8
22.8
24.7
5.9
4.5
Sun Pharma
Buy
801
950
192,829
28,163
32,610
25.8
30.7
17.4
26.9
46.1
29.8
4.4
3.8
13.0
16.6
6.3
5.2
Power
Tata Power
Neutral
69
-
18,757
35,923
37,402
22.6
22.8
4.1
5.2
17.1
13.5
1.3
1.2
7.5
9.3
1.5
1.4
NTPC
Accumulate
142
157
117,374
87,064
98,846
23.5
23.5
11.7
13.2
12.2
10.8
1.4
1.3
11.4
12.1
2.4
2.1
Power Grid
Buy
139
170
72,771
20,702
23,361
86.7
86.4
12.1
13.2
11.5
10.5
1.7
1.5
15.6
15.1
8.4
7.9
Telecom
Bharti Airtel
Neutral
324
-
129,536
101,748
109,191
32.1
31.7
12.0
12.5
27.0
25.9
1.9
1.7
6.9
6.7
1.9
1.7
Idea Cellular
Neutral
136
-
48,803
34,282
36,941
32.0
31.5
5.9
6.2
23.0
21.9
2.1
1.9
9.9
9.3
2.0
1.9
zOthers
Abbott India
Neutral
5,885
-
12,505
2,715
3,153
14.5
14.1
134.3
152.2
43.8
38.7
10.9
9.0
27.4
25.6
4.3
3.7
Bajaj Electricals
Buy
205
290
2,071
4,719
5,287
5.2
5.8
8.6
12.7
24.0
16.2
2.7
2.4
11.4
14.8
0.4
0.4
Finolex Cables
Neutral
251
-
3,842
2,520
2,883
12.2
12.0
12.7
14.2
19.8
17.7
2.7
2.4
13.6
13.5
1.3
1.1
Goodyear India*
Accumulate
565
622
1,303
1,888
1,680
12.1
11.9
62.2
56.6
9.1
10.0
2.1
1.8
25.9
19.7
0.5
0.5
Hitachi
Neutral
1,323
-
3,598
1,779
2,081
7.8
8.8
21.8
33.4
60.7
39.6
9.8
7.9
17.4
22.1
2.1
1.8
Jyothy Laboratories
Neutral
306
-
5,548
1,620
1,847
11.5
11.5
7.3
8.5
42.0
36.2
5.4
5.0
13.3
14.4
3.3
2.8
MRF
Accumulate
40,581
45,575
17,211
20,316
14,488
21.4
21.1
5,488.0
3,798.0
7.4
10.7
2.5
2.1
41.1
21.2
0.8
1.1
Page Industries
Neutral
13,721
-
15,304
1,929
2,450
19.8
20.1
229.9
299.0
59.7
45.9
26.3
18.3
52.1
47.1
8.0
6.2
Relaxo Footwears
Neutral
504
-
6,052
1,767
2,152
12.3
12.5
19.3
25.1
26.2
20.1
6.4
4.9
27.7
27.8
3.5
2.8
Siyaram Silk Mills
Accumulate
1,198
1,354
1,123
1,636
1,815
11.5
11.5
89.9
104.1
13.3
11.5
2.2
1.9
17.9
17.8
0.8
0.8
Styrolution ABS India*
Neutral
769
-
1,352
1,271
1,440
8.6
9.2
32.0
41.1
24.0
18.7
2.5
2.2
10.7
12.4
1.0
0.9
TVS Srichakra
Buy
2,810
3,240
2,152
2,101
2,338
15.7
15.0
248.6
270.0
11.3
10.4
4.9
3.5
43.6
34.0
1.1
0.9
Stock Watch
January 06, 2016
Company Name
Reco
CMP
Target
Mkt Cap
Sales ( Čcr )
OPM(%)
EPS (Č)
PER(x)
P/BV(x)
RoE(%)
EV/Sales(x)
(Č)
Price ( Č)
( Č cr )
FY16E
FY17E
FY16E
FY17E
FY16E
FY17E
FY16E
FY17E
FY16E
FY17E
FY16E
FY17E
FY16E
FY17E
zOthers
HSIL
Neutral
298
-
2,152
2,123
2,384
16.1
16.5
15.0
18.9
19.8
15.8
1.5
1.4
8.0
9.4
1.4
1.2
Kirloskar Engines India
Neutral
246
-
3,560
2,471
2,826
8.8
10.4
9.1
13.3
27.0
18.5
2.6
2.4
9.7
13.4
1.1
0.9
Ltd
M M Forgings
Buy
532
614
642
511
615
21.7
21.6
43.1
55.8
12.3
9.5
2.3
1.8
19.9
21.2
1.5
1.1
Banco Products (India) Neutral
145
-
1,038
1,208
1,353
11.0
12.3
10.8
14.5
13.5
10.0
1.5
1.4
11.9
14.5
0.8
0.7
Competent Automobiles Neutral
162
-
100
1,040
1,137
3.2
3.1
25.7
28.0
6.3
5.8
0.9
0.8
15.0
14.3
0.1
0.1
Nilkamal
Neutral
1,396
-
2,083
1,910
2,083
10.5
10.3
63.3
69.2
22.1
20.2
3.6
3.1
17.6
16.5
1.2
1.0
Visaka Industries
Accumulate
125
144
199
1,086
1,197
9.9
10.3
21.5
28.8
5.8
4.4
0.6
0.5
9.6
11.6
0.4
0.3
Transport Corporation of
Neutral
300
-
2,279
2,830
3,350
8.8
9.0
14.4
18.3
20.9
16.4
3.2
2.8
15.4
17.1
0.9
0.8
India
Elecon Engineering
Neutral
83
-
905
1,369
1,533
13.7
14.9
3.3
6.1
25.0
13.7
1.6
1.5
6.6
11.4
1.0
0.9
Surya Roshni
Accumulate
175
201
767
2,992
3,223
8.1
8.4
14.7
18.3
11.9
9.5
1.1
1.0
9.7
11.0
0.5
0.5
MT Educare
Neutral
189
-
753
286
366
18.3
17.7
7.7
9.4
24.5
20.2
5.2
4.5
20.2
21.1
2.5
1.9
Radico Khaitan
Buy
115
156
1,534
1,565
1,687
12.2
13.0
5.7
7.1
20.2
16.2
1.7
1.6
8.3
9.6
1.4
1.3
Garware Wall Ropes
Accumulate
420
473
919
861
967
10.9
10.9
24.0
28.2
17.5
14.9
2.6
2.2
14.6
14.9
1.1
0.9
Wonderla Holidays
Neutral
394
-
2,225
206
308
44.0
43.6
9.0
12.9
43.8
30.5
6.0
5.4
13.7
17.8
10.7
7.1
Linc Pen & Plastics
Neutral
220
-
326
340
371
8.3
8.9
10.8
13.2
20.4
16.7
3.3
2.8
16.0
17.1
1.0
0.9
The Byke Hospitality
Neutral
159
-
639
222
287
20.5
20.5
5.6
7.6
28.3
21.1
5.3
4.4
18.9
20.8
2.9
2.2
Interglobe Aviation
Neutral
1,253
-
45,151
17,022
21,122
20.7
14.5
63.9
53.7
19.6
23.3
29.4
24.1
149.9
103.2
2.7
2.2
Coffee Day Enterprises
Neutral
282
-
5,819
2,692
2,964
17.0
18.6
-
4.7
-
59.6
3.5
3.3
0.2
5.5
2.6
2.4
Ltd
Navneet Education
Neutral
96
-
2,284
998
1,062
24.1
24.0
5.8
6.1
16.7
15.8
3.7
3.2
22.0
20.6
2.4
2.2
Navkar Corporation
Buy
210
265
2,990
365
436
38.3
37.5
5.6
5.9
37.2
35.7
2.3
2.2
6.3
6.1
9.0
7.7
Source: Company, Angel Research; Note: *December year end; #September year end; &October year end; Price as on January 05, 2016
Market Outlook
January 06, 2016
Research Team Tel: 022 - 39357800
DISCLAIMER
Angel Broking Private Limited (hereinafter referred to as “Angel”) is a registered Member of National Stock Exchange of India Limited,
Bombay Stock Exchange Limited and Metropolitian Stock Exchange of India Limited. It is also registered as a Depository Participant with
CDSL and Portfolio Manager with SEBI. It also has registration with AMFI as a Mutual Fund Distributor. Angel Broking Private Limited is a
registered entity with SEBI for Research Analyst in terms of SEBI (Research Analyst) Regulations, 2014 vide registration number
INH000000164. Angel or its associates has not been debarred/ suspended by SEBI or any other regulatory authority for accessing
/dealing in securities Market. Angel or its associates including its relatives/analyst do not hold any financial interest/beneficial ownership
of more than 1% in the company covered by Analyst. Angel or its associates/analyst has not received any compensation / managed or co
-managed public offering of securities of the company covered by Analyst during the past twelve months. Angel/analyst has not served as
an officer, director or employee of company covered by Analyst and has not been engaged in market making activity of the company
covered by Analyst.
This document is solely for the personal information of the recipient, and must not be singularly used as the basis of any investment
decision. Nothing in this document should be construed as investment or financial advice. Each recipient of this document should make
such investigations as they deem necessary to arrive at an independent evaluation of an investment in the securities of the companies
referred to in this document (including the merits and risks involved), and should consult their own advisors to determine the merits and
risks of such an investment.
Reports based on technical and derivative analysis center on studying charts of a stock's price movement, outstanding positions and
trading volume, as opposed to focusing on a company's fundamentals and, as such, may not match with a report on a company's
fundamentals.
The information in this document has been printed on the basis of publicly available information, internal data and other reliable sources
believed to be true, but we do not represent that it is accurate or complete and it should not be relied on as such, as this document is for
general guidance only. Angel Broking Pvt. Limited or any of its affiliates/ group companies shall not be in any way responsible for any
loss or damage that may arise to any person from any inadvertent error in the information contained in this report. Angel Broking Pvt.
Limited has not independently verified all the information contained within this document. Accordingly, we cannot testify, nor make any
representation or warranty, express or implied, to the accuracy, contents or data contained within this document. While Angel Broking
Pvt. Limited endeavors to update on a reasonable basis the information discussed in this material, there may be regulatory, compliance,
or other reasons that prevent us from doing so.
This document is being supplied to you solely for your information, and its contents, information or data may not be reproduced,
redistributed or passed on, directly or indirectly.
Neither Angel Broking Pvt. Limited, nor its directors, employees or affiliates shall be liable for any loss or damage that may arise from or
in connection with the use of this information.
Note: Please refer to the important ‘Stock Holding Disclosure' report on the Angel website (Research Section). Also, please refer to the
latest update on respective stocks for the disclosure status in respect of those stocks. Angel Broking Pvt. Limited and its affiliates may have
investment positions in the stocks recommended in this report.