Market Outlook
October 05, 2015
Market Cues
Domestic Indices
Chg (%)
(Pts)
(Close)
Indian markets are expected to open in positive tracking the SGX Nifty and the Asian
BSE Sensex
0.3
66
26,221
cues.
Nifty
0.0
2
7,951
The US markets after falling sharply at the open, stocks staged a remarkable
Mid Cap
0.2
19
10,819
turnaround over the course of the trading day on Friday. The major averages
Small Cap
0.2
22
11,043
bounced well off their lows for the session and into positive territory, with the Dow
Bankex
(0.4)
(73)
19,608
showing a nearly 460-point swing on the day.
The European markets bounced back into the green in late trade on Friday, as U.S.
Global Indices
Chg (%)
(Pts)
(Close)
equity markets began to reverse and recover from the lows. The European markets
Dow Jones
1.2
200
16,472
were trading in green early Friday. However, the markets began to pare those gains
Nasdaq
1.7
81
4,708
and dropped into the red after the U.S. jobs report for September came in weaker
FTSE
0.9
58
6,130
than expected. The disappointing data has many investors thinking that an interest
Nikkei
0.0
3
17,725
rate hike by the Federal Reserve later this month is unlikely.
Hang Seng
3.2
660
21,506
The Indian markets posted modest gains on Thursday, with a firm rupee and positive
Shanghai Com
0.5
15
3,053
global cues supporting sentiment. Stocks finished off their day's highs as traders
locked in some profits at higher levels ahead of the long weekend. The stock
Advances / Declines
Bse
Nse
markets were closed on Friday on account of Gandhi Jayanti.
Advances
1,375
756
News Analysis
Declines
1,325
739
El Nino Takes a Toll on Auto, FMCG Stocks
Unchanged
118
69
Government exploring options to dilute stake in IDBI Bank
Detailed analysis on Pg2
Volumes (` Cr)
Investor’s Ready Reckoner
BSE
2,937
Key Domestic & Global Indicators
NSE
17,400
Stock Watch: Latest investment recommendations on 150+ stocks
Refer Pg4 onwards
Net Inflows (` Cr)
Net
Mtd
Ytd
FII
222
(5,696) 1,18,065
Top Picks
CMP
Target
Upside
MFs
1,032
7,708
78,356
Company
Sector
Rating
(`)
(`)
(%)
Axis Bank
Financials
Buy
496
701
41.5
Top Gainers
Price (`)
Chg (%)
ICICI Bank
Financials
Buy
267
370
38.4
Infratel
397
11.9
Power Grid
Power
Buy
130
170
30.3
Indiacem
82
5.5
TCS
IT
Buy
2,640
3,168
20.0
Pmcfin
1
5.0
Aurobindo Pharma Pharmaceuticals Accumulate
770
872
13.2
More Top Picks on Pg3
Vakrangee
133
4.3
Frl
126
3.8
Key Upcoming Events
Previous
Consensus
Date
Region
Event Description
Reading
Expectations
Top Losers
Price (`)
Chg (%)
Oct 07
UK
Industrial Production YoY
0.8
---
Hcltech
858
(12.7)
Oct 08
UK
BOE Announces rates
0.50
0.50
Jswenergy
89
(4.9)
Oct 09
India
Imports YoY%
(9.95)
--
Essaroil
190
(3.8)
India
Exports YoY%
(20.66)
--
Gvkpil
7
(3.6)
Oct 12
India
Industrial Production YoY
(4.20)
--
Oberoirlty
264
(3.2)
Oct 13
UK
CPI (YoY)
--
--
As on October 01, 2015
Market Outlook
October 05, 2015
El Nino Takes a Toll on Auto, FMCG Stocks
Shares of automobile manufacturers, consumer-oriented companies, and
agriculture-related firms, whose prospects are partly tied to rural consumers, could
slip as a below-average monsoon this year may hurt their quarterly earnings. India
received 14% below-normal rains between June and September, the lowest since
2009, as the strongest El Nino in almost two decades left vast tracts of land
parched, affecting crops.
Shares of Hero MotoCorp, M&M and HUL could face pressure as rural income
and consumption may get impacted by a sub-par monsoon. The contribution of
rural consumers to sales of these firms is quite significant. Auto firms, especially
twowheeler makers such as Hero MotoCorp and Bajaj Auto, have a lot riding on
the monsoon, as nearly half the two-wheeler sales come from semi-urban and
rural India. A weak monsoon will also directly impact sales of farm equipment,
affecting companies such as M&M, which gets almost a third of its revenue from
tractor sales.
Government exploring options to dilute stake in IDBI Bank
The government is looking to dilute stake in IDBI Bank through strategic sale or
public offering. Various options are being considered, including strategic sale and
offer for sale (OFS), for dilution of the government stake in IDBI Bank, but these
are at a preliminary stage.
IDBI Bank came into existence, with Parliament passing the IDBI Repeal Act in
2003. In terms of provisions of the Repeal Act, IDBI has been functioning as a
bank in addition to its earlier role of a financial institution.
Citing the example of Axis Bank, he had wondered if IDBI Bank can follow that
model. The government indirectly controls 29.19 per cent in Axis Bank through
the administrator of the Specified Undertaking of the Unit Trust of India (SUUTI), the
Life Insurance Corporation and four other public sector general insurance companies.
In the case of IDBI Bank, the government holding stands at 76.5 per cent.
However, IDBI Bank in a regulatory filing to stock exchanges said it has not
received any communication from the government on this.
We are willing to look at all other changes, including bringing down government
equity to 52 per cent (in state-run banks), and therefore giving additional financial
strength and teeth to the banking institutions themselves," he had said. We
currently have a Neutral Rating on the stock.
Economic and Political News
Manufacturing PMI Hits 7-month Low on Poor Demand
Advance tax from steel, banking sectors falls
Indian e-commerce market to grow 36% in 2015-20: study
Corporate News
Jet Airways Gets `700 cr in Fresh Investment from Etihad SPV
L&T Metro Keen to Raise $180 mn via ECB Route
HDFC to Raise `10,000 cr Through NCDs, Warrants
Market Outlook
October 05, 2015
Top Picks ★★★★★
Large Cap
Market Cap
CMP
Target
Upside
Company
Rationale
(` Cr)
(`)
(`)
(%)
Robust US sales along with the acquisations, will aid the growth
Aurobindo
44,965
770
872
13.2
and stable margins.
Healthy pace of branch expansion, backed by distribution
Axis Bank
1,17,820
496
701
41.5
network.
Robust franchise and capital adequacy position will help the
ICICI Bank
1,55,268
267
370
38.4
bank to outperform the industry average.
Back on the growth trend, expect a long term growth of 14% to
Infosys
2,69,489
1,173
1,306
11.3
be a US$20bn in FY2020.
Government thrust on Renewable sector and strong order book
Inox Wind
7,914
357
505
41.6
would drive future growth.
LICHF continues to grow its retail loan book at a healthy pace
LIC HFL
23,371
463
570
23.1
with improvement in asset quality.
Direct beneficiary of the huge investments lined up in the power
Power Grid
68,246
130
170
30.3
transmission sector.
Growth to pick up from 2HFY2017, attractive given the risk-
TCS
5,17,045
2,640
3,168
20.0
reward.
Tech Mahindra
54,158
563
646
14.8
Acquisitions, to drive growth, normalised valuations attractive.
An improving liability franchise, capital adequacy well above
Yes Bank
30,499
728
953
30.9
Basel III requirements and lowest NPA ratio in the industry.
FY2017, to be a good year for the company in terms of growth
Sun Pharma
2,14,353
891
950
6.7
and margins.
Source: Company, Angel Research
Mid Cap
Market Cap
CMP
Target
Upside
Company
Rationale
(` Cr)
(`)
(`)
(%)
Bajaj Electricals
2,522
250
341
36.4
Visible turnaround in E&P business to drive the earnings.
Garware Wall Ropes
769
351
390
11.0
Higher exports & easing material prices to drive profitability.
Comfortable balance sheet to support strong growth; this
MBL Infrastructures
1,016
245
360
46.9
coupled with attractive valuation to lead to rerating.
New product introductions and increased sourcing by clients to
Minda Industries
805
507
652
28.5
enable outpace industry growth.
Strong brand & quality teaching with innovative technologies &
MT Educare
513
129
169
31.3
higher government educational spending to boost growth.
Earnings boost on back of stable material prices and favourable
Radico Khaitan
1,154
87
112
29.1
pricing environment. Valuation discount to peers provides
additional comfort.
Structural shift in the Lighting industry towards LED lighting will
Surya Roshni
571
130
183
40.6
drive growth.
Tree House
1,329
314
449
43.0
Robust expansion plan for pre-schools to drive growth.
Source: Company, Angel Research
Market Outlook
October 05, 2015
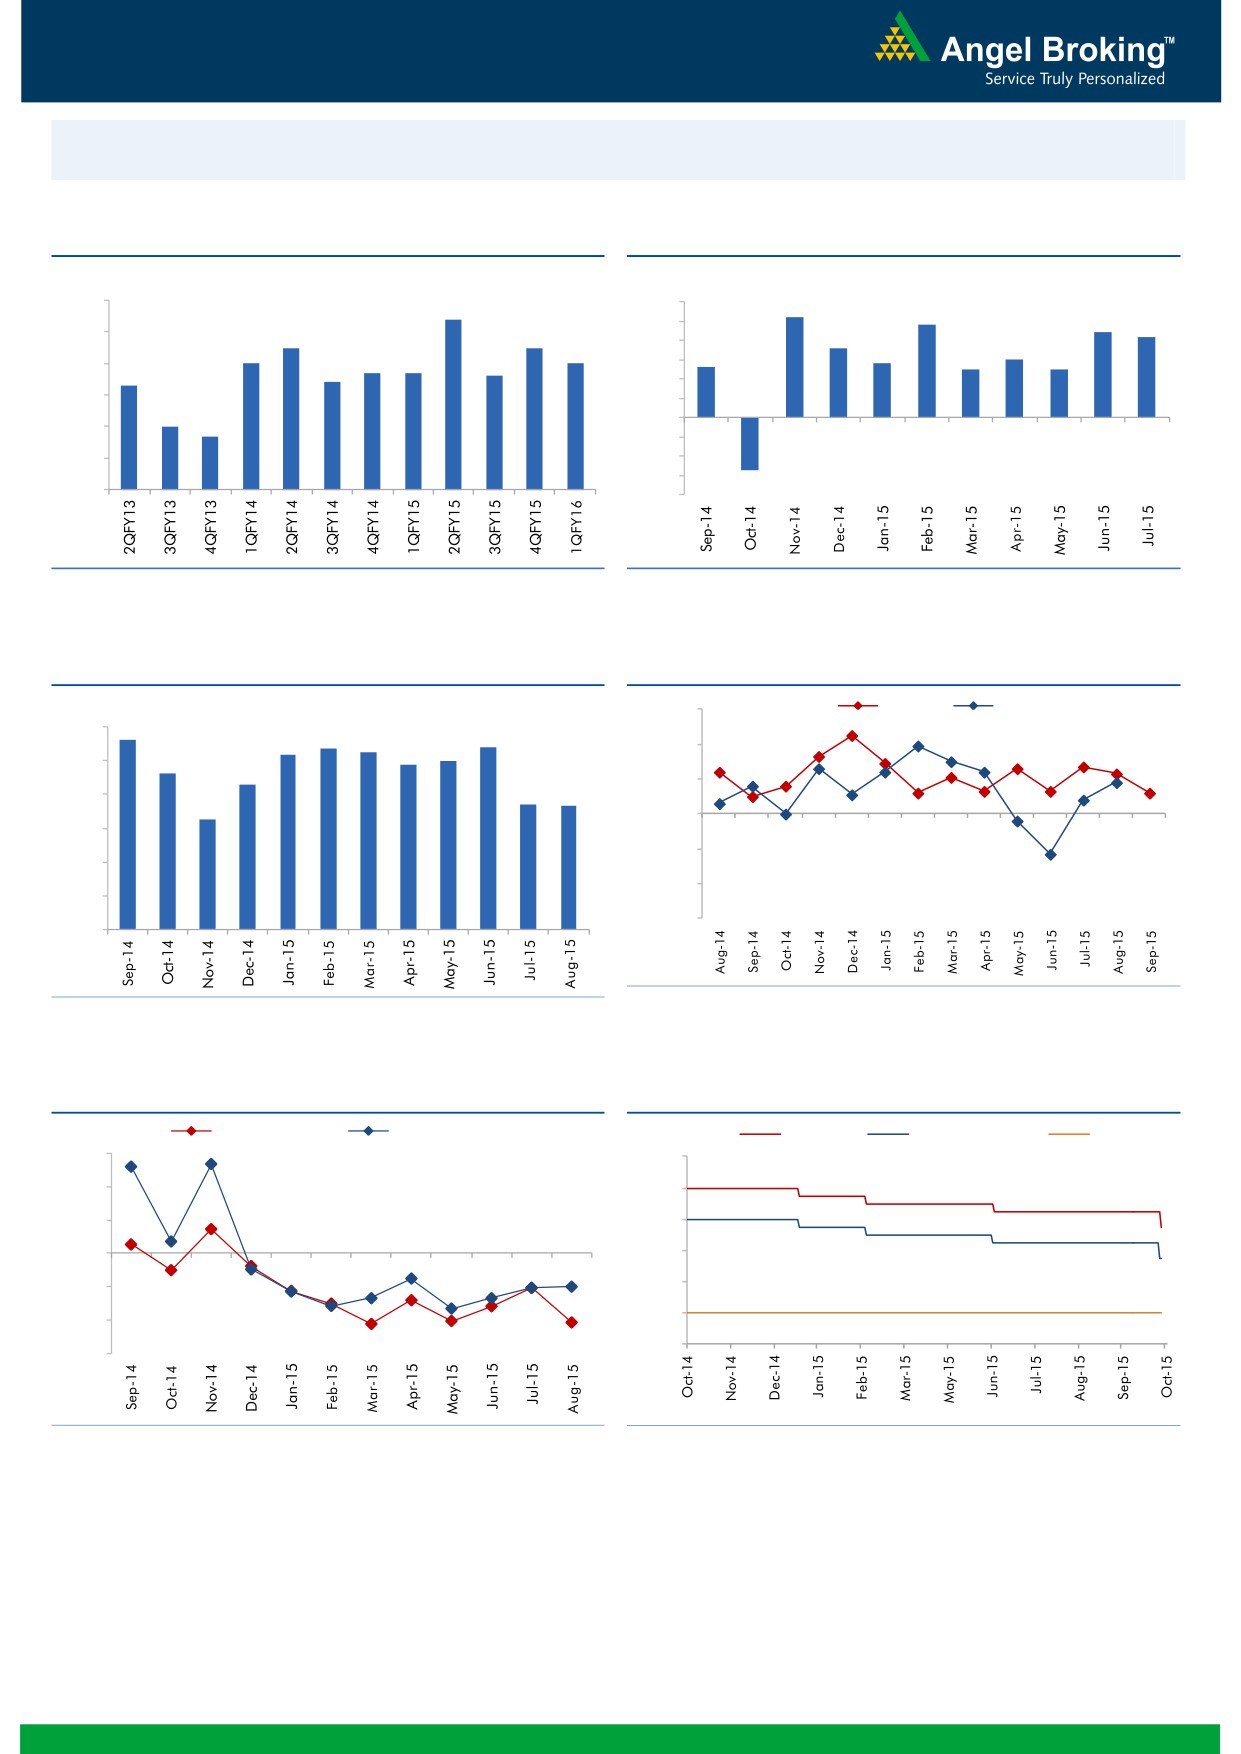
Macro watch
Exhibit 1: Quarterly GDP trends
Exhibit 2: IIP trends
(%)
(%)
9.0
8.4
6.0
5.2
4.8
5.0
4.4
4.2
8.0
7.5
7.5
3.6
4.0
3.0
7.0
7.0
2.8
6.7
6.7
2.6
2.5
2.5
7.0
6.6
3.0
6.3
6.4
2.0
6.0
1.0
5.0
4.7
-
5.0
(1.0)
4.0
(2.0)
(3.0)
3.0
(2.7)
(4.0)
Source: CSO, Angel Research
Source: MOSPI, Angel Research
Exhibit 3: Monthly CPI inflation trends
Exhibit 4: Manufacturing and services PMI
(%)
56.0
Mfg. PMI
Services PMI
5.6
6.0
5.4
5.4
5.2
5.3
5.0
54.0
4.9
5.0
4.6
4.3
52.0
3.7
3.7
4.0
3.3
50.0
3.0
48.0
2.0
46.0
1.0
44.0
-
Source: Market, Angel Research; Note: Level above 50 indicates expansion
Source: MOSPI, Angel Research
Exhibit 5: Exports and imports growth trends
Exhibit 6: Key policy rates
(%)
Exports yoy growth
Imports yoy growth
(%)
Repo rate
Reverse Repo rate
CRR
30.0
9.00
20.0
8.00
10.0
7.00
0.0
6.00
5.00
(10.0)
4.00
(20.0)
3.00
(30.0)
Source: Bloomberg, Angel Research
Source: RBI, Angel Research
Market Outlook
October 05, 2015
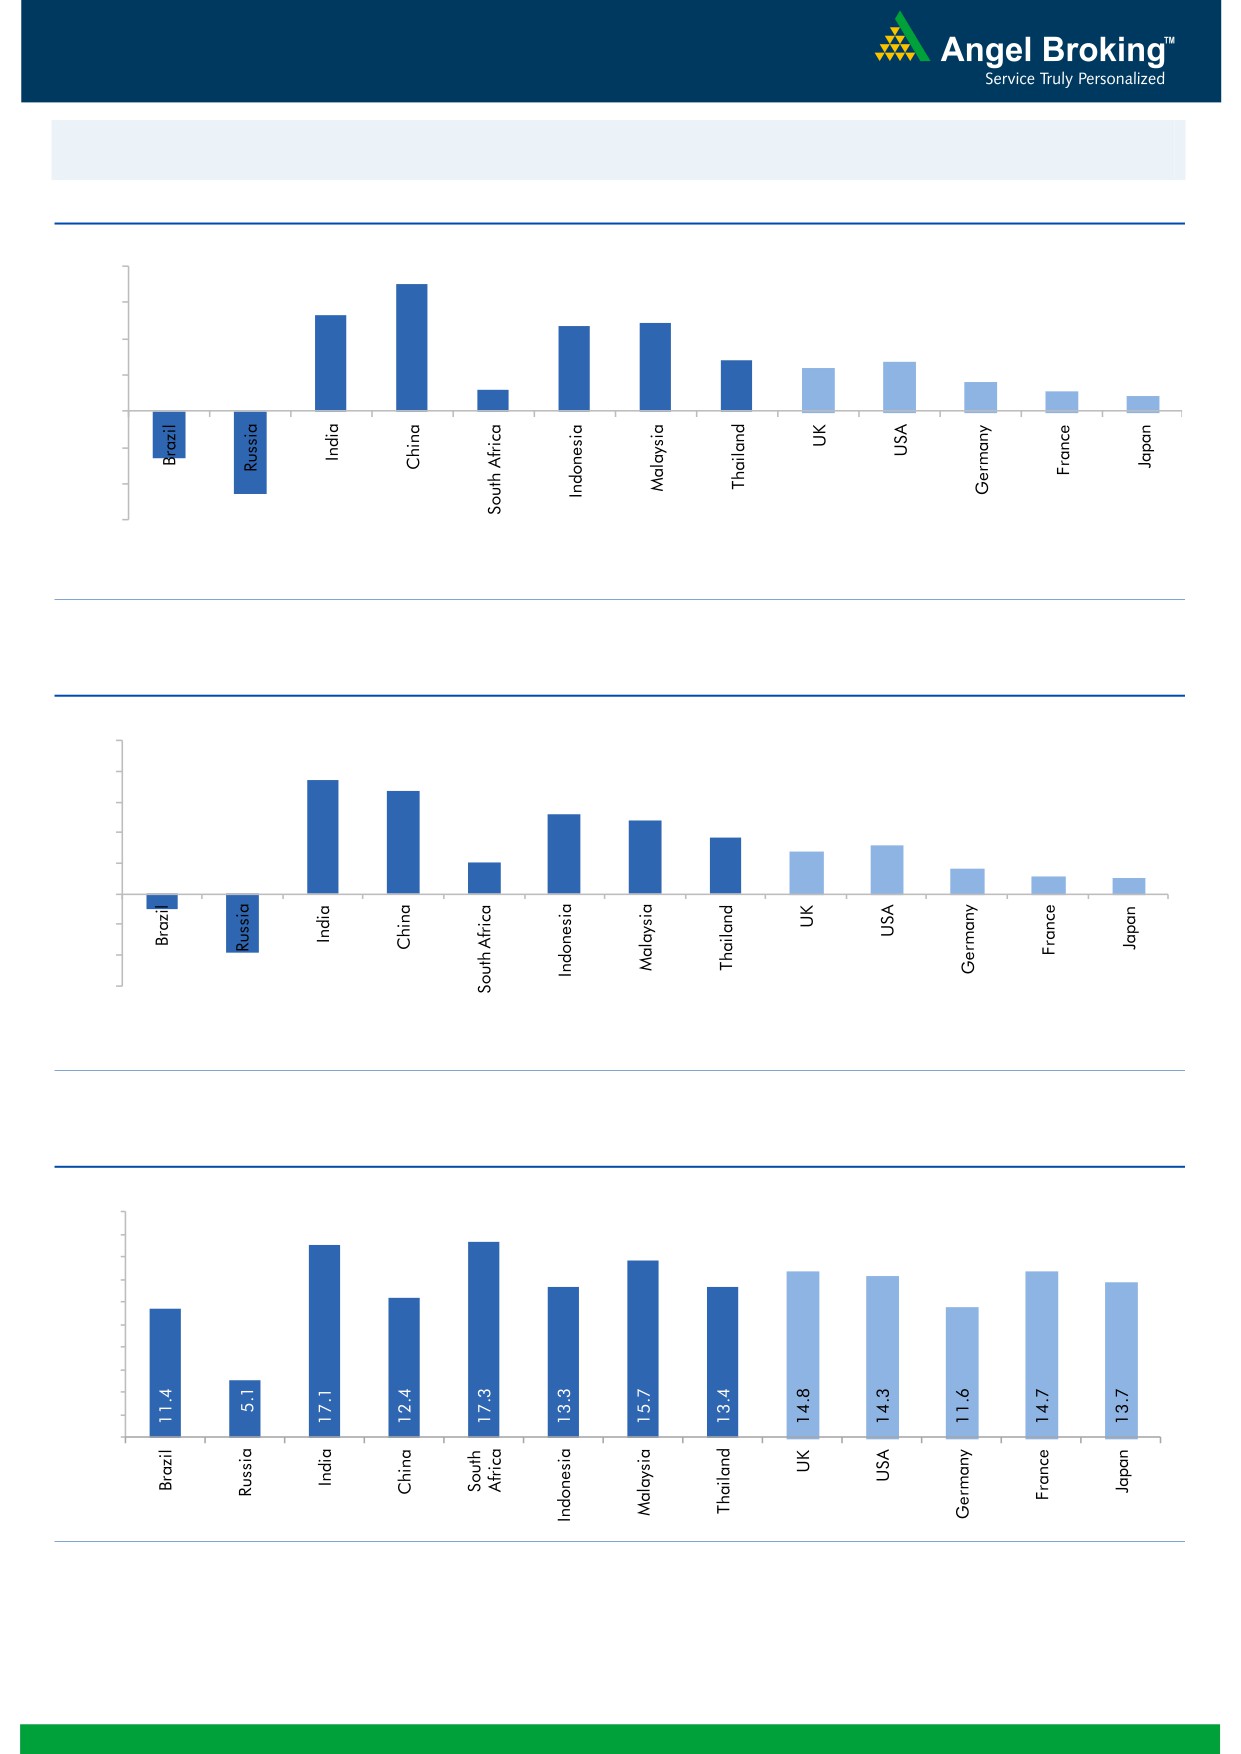
Global watch
Exhibit 1: Latest quarterly GDP Growth (%, yoy) across select developing and developed countries
(%)
8.0
7.0
5.3
6.0
4.9
4.7
4.0
2.8
2.7
2.4
1.6
2.0
1.2
1.1
0.8
-
(2.0)
(2.6)
(4.0)
(4.6)
(6.0)
Source: Bloomberg, Angel Research
Exhibit 2: 2015 GDP Growth projection by IMF (%, yoy) across select developing and developed countries
(%)
10.0
7.5
8.0
6.8
5.2
6.0
4.8
3.7
3.1
4.0
2.7
2.0
1.6
2.0
1.2
1.0
-
(2.0)
(4.0)
(1.0)
(3.8)
(6.0)
Source: IMF, Angel Research
Exhibit 3: One year forward P-E ratio across select developing and developed countries
(x)
20.0
18.0
16.0
14.0
12.0
10.0
8.0
6.0
4.0
2.0
-
Source: IMF, Angel Research
Market Outlook
October 05, 2015
Exhibit 4: Relative performance of indices across globe
Returns (%)
Country
Name of index
Closing price
1M
3M
1YR
Brazil
Bovespa
47,033
(4.4)
(15.1)
(19.5)
Russia
Micex
1,613
(5.2)
0.1
16.7
India
Nifty
7,951
(0.0)
(5.0)
(2.4)
China
Shanghai Composite
3,053
(1.0)
(28.6)
31.1
South Africa
Top 40
45,668
1.1
(2.7)
1.5
Mexico
Mexbol
42,735
(1.5)
(5.1)
(5.2)
Indonesia
LQ45
701
(8.3)
(15.9)
(19.6)
Malaysia
KLCI
1,629
1.0
(4.6)
(11.5)
Thailand
SET 50
868
(4.1)
(12.8)
(17.8)
USA
Dow Jones
16,472
(2.2)
(7.6)
(3.1)
UK
FTSE
6,130
0.8
(6.9)
(6.6)
Japan
Nikkei
17,725
(7.4)
(12.4)
9.4
Germany
DAX
9,553
(5.8)
(13.0)
2.0
France
CAC
4,459
(4.2)
(7.9)
3.9
Source: Bloomberg, Angel Research
Stock Watch
October 05, 2015
Company Name
Reco
CMP
Target
Mkt Cap
Sales ( Čcr )
OPM(%)
EPS (Č)
PER(x)
P/BV(x)
RoE(%)
EV/Sales(x)
(Č)
Price ( Č)
( Č cr )
FY16E FY17E
FY16E
FY17E
FY16E
FY17E
FY16E
FY17E
FY16E
FY17E
FY16E
FY17E
FY16E
FY17E
Agri / Agri Chemical
Rallis
Neutral
215
-
4,187
2,075
2,394
14.4
14.4
9.5
11.0
22.7
19.6
4.5
3.9
21.1
21.3
2.1
1.8
United Phosphorus
Accumulate
454
510
19,454
13,698
15,752
17.6
17.6
32.1
38.5
14.1
11.8
2.8
2.3
21.4
21.3
1.5
1.3
Auto & Auto Ancillary
Ashok Leyland
Accumulate
94
102
26,822
18,763
22,357
11.1
11.2
3.6
4.8
26.2
19.6
4.8
4.5
18.7
22.6
1.4
1.1
Bajaj Auto
Accumulate
2,314
2,438
66,955
23,544
27,245
19.8
19.8
127.0
143.4
18.2
16.1
5.5
4.7
30.3
29.4
2.4
2.1
Eicher Motors
Buy
18,286
22,859
49,634
11,681
15,550
15.3
16.9
358.5
564.3
51.0
32.4
15.3
11.4
29.8
34.9
4.1
3.1
Hero Motocorp
Accumulate
2,413
2,672
48,192
28,500
32,764
14.1
14.3
146.9
167.0
16.4
14.5
6.2
5.3
37.8
36.5
1.5
1.3
L G Balakrishnan & Bros Neutral
437
-
686
1,254
1,394
11.6
11.8
35.9
41.7
12.2
10.5
1.7
1.5
13.5
13.8
0.7
0.6
Mahindra and Mahindra Accumulate
1,249
1,357
77,543
37,986
42,660
12.8
13.2
51.6
61.9
24.2
20.2
3.6
3.2
14.6
15.6
1.7
1.4
Maruti
Accumulate
4,580
4,960
138,348
58,102
68,587
16.7
16.9
182.0
225.5
25.2
20.3
5.0
4.3
19.9
21.0
2.2
1.8
Minda Industries
Buy
507
652
805
2,567
2,965
7.3
8.0
38.8
54.3
13.1
9.3
1.9
1.6
14.4
16.8
0.4
0.3
Rane Brake Lining
Buy
284
366
225
454
511
11.1
11.4
23.8
28.1
12.0
10.1
1.7
1.5
14.2
15.3
0.6
0.6
Setco Automotive
Neutral
232
-
619
594
741
12.7
13.7
8.4
15.8
27.6
14.7
2.9
2.5
10.4
16.9
1.5
1.2
Tata Motors
Neutral
297
-
85,750
264,038
297,882
13.8
13.9
34.5
38.9
8.6
7.6
1.5
1.2
17.6
16.8
0.5
0.5
TVS Motor
Neutral
230
-
10,908
11,702
13,713
6.8
7.7
10.1
14.5
22.7
15.8
5.6
4.5
24.5
28.3
0.9
0.8
Amara Raja Batteries
Neutral
1,030
-
17,587
5,101
6,224
17.8
17.6
31.1
39.2
33.1
26.3
8.2
6.5
24.8
24.8
3.4
2.7
Exide Industries
Neutral
152
-
12,899
7,363
8,247
13.7
14.5
6.6
7.7
23.0
19.7
2.9
2.6
12.6
13.3
1.5
1.3
Apollo Tyres
Neutral
182
-
9,277
12,576
12,978
16.8
16.1
22.3
19.9
8.2
9.2
1.4
1.2
17.2
13.4
0.8
0.8
Ceat
Neutral
1,261
-
5,101
6,041
6,597
14.3
14.2
101.5
116.6
12.4
10.8
2.5
2.1
20.0
19.1
1.0
0.9
JK Tyres
Neutral
101
-
2,296
7,446
7,669
15.2
14.0
19.6
18.4
5.2
5.5
1.3
1.1
25.2
19.5
0.7
0.6
Swaraj Engines
Neutral
872
-
1,083
593
677
14.5
14.8
51.2
60.8
17.0
14.3
4.0
3.6
23.3
24.8
1.7
1.4
Subros
Neutral
76
-
458
1,268
1,488
11.6
11.9
3.7
6.6
20.7
11.6
1.4
1.3
6.8
11.4
0.7
0.5
Indag Rubber
Neutral
181
-
476
283
329
17.0
17.2
13.0
15.4
14.0
11.8
3.1
2.5
21.8
21.6
1.4
1.2
Capital Goods
ACE
Neutral
37
-
363
660
839
4.7
8.2
1.0
3.9
36.7
9.4
1.2
1.0
3.2
11.3
0.7
0.6
BEML
Neutral
1,243
-
5,178
3,277
4,006
6.0
8.9
29.2
64.3
42.6
19.3
2.4
2.2
5.7
11.7
1.7
1.3
BGR Energy
Neutral
109
-
789
3,615
3,181
9.5
9.4
16.7
12.4
6.5
8.8
0.6
0.6
10.0
7.0
0.6
0.8
BHEL
Neutral
200
-
48,879
33,722
35,272
10.8
11.7
10.5
14.2
19.0
14.1
1.4
1.3
7.0
9.0
1.5
1.5
Blue Star
Accumulate
340
387
3,056
3,649
4,209
5.0
5.9
9.2
14.7
37.2
23.1
6.7
6.3
9.1
17.5
0.9
0.8
Crompton Greaves
Buy
169
204
10,611
13,484
14,687
4.9
6.2
4.5
7.1
37.6
23.9
2.7
2.5
7.2
10.8
0.9
0.8
Inox Wind
Buy
357
505
7,914
4,980
5,943
17.0
17.5
26.6
31.6
13.4
11.3
4.0
3.0
35.0
30.0
1.7
1.4
Stock Watch
October 05, 2015
Company Name
Reco
CMP
Target
Mkt Cap
Sales ( Čcr )
OPM(%)
EPS (Č)
PER(x)
P/BV(x)
RoE(%)
EV/Sales(x)
(Č)
Price ( Č)
( Č cr )
FY16E
FY17E
FY16E
FY17E
FY16E
FY17E
FY16E
FY17E
FY16E
FY17E
FY16E
FY17E
FY16E
FY17E
Capital Goods
KEC International
Neutral
141
-
3,616
8,791
9,716
6.1
6.8
5.4
8.2
26.1
17.2
2.6
2.4
10.0
14.0
0.6
0.6
Thermax
Neutral
842
-
10,034
6,413
7,525
7.4
8.5
30.5
39.3
27.6
21.4
4.3
3.7
15.0
17.0
1.5
1.3
Cement
ACC
Accumulate
1,360
1,548
25,540
11,856
14,092
14.5
17.8
47.6
76.1
28.6
17.9
2.9
2.7
10.6
15.7
2.0
1.6
Ambuja Cements
Accumulate
210
233
32,582
10,569
12,022
20.7
22.2
8.7
10.7
24.1
19.6
3.1
2.9
13.0
15.2
2.7
2.4
India Cements
Buy
82
112
2,531
4,716
5,133
15.9
16.9
3.7
7.5
22.3
11.0
0.8
0.8
3.8
7.3
0.8
0.7
JK Cement
Buy
647
767
4,522
4,056
4,748
14.5
17.0
22.6
41.1
28.6
15.7
2.6
2.3
9.3
15.3
1.5
1.3
J K Lakshmi Cement
Accumulate
378
430
4,453
2,947
3,616
16.7
19.9
11.5
27.2
32.9
13.9
3.1
2.7
9.8
20.8
1.9
1.5
Mangalam Cements
Neutral
223
-
594
1,053
1,347
10.5
13.3
8.4
26.0
26.5
8.6
1.1
1.0
4.3
12.5
0.9
0.7
Orient Cement
Buy
159
183
3,256
1,854
2,524
21.2
22.2
7.7
11.1
20.6
14.3
3.0
2.6
13.3
15.7
2.5
1.7
Ramco Cements
Neutral
336
-
7,987
4,036
4,545
20.8
21.3
15.1
18.8
22.2
17.9
2.7
2.4
12.9
14.3
2.5
2.1
Shree Cement^
Neutral
11,968
-
41,695
7,150
8,742
26.7
28.6
228.0
345.5
52.5
34.6
7.7
6.5
15.7
20.3
5.6
4.5
UltraTech Cement
Buy
2,774
3,282
76,117
27,562
31,548
20.4
22.3
111.9
143.3
24.8
19.4
3.5
3.0
15.2
16.8
2.8
2.4
Construction
ITNL
Neutral
99
-
2,445
7,360
8,825
34.0
35.9
1.0
5.0
99.1
19.8
0.4
0.4
0.3
1.4
3.8
3.7
KNR Constructions
Neutral
560
-
1,575
915
1,479
14.3
13.9
20.3
37.2
27.6
15.1
2.5
2.2
9.6
15.6
1.8
1.2
Larsen & Toubro
Buy
1,489
2,013
138,603
68,920
82,446
10.9
11.5
57.0
73.0
26.1
20.4
2.4
2.2
13.6
15.5
2.2
1.9
Gujarat Pipavav Port
Neutral
185
-
8,934
721
784
53.1
53.6
8.2
9.1
22.5
20.3
3.6
2.9
20.0
18.3
12.0
10.6
MBL Infrastructures
Buy
245
360
1,016
2,313
2,797
12.2
14.6
19.0
20.0
12.9
12.3
1.3
1.2
11.3
10.6
1.1
1.0
Nagarjuna Const.
Neutral
75
-
4,150
7,892
8,842
8.3
9.1
2.4
5.3
31.1
14.1
1.2
1.2
4.2
8.6
0.8
0.6
PNC Infratech
Neutral
507
-
2,600
1,798
2,132
13.2
13.5
22.0
30.0
23.0
16.9
2.1
1.9
11.5
11.4
1.5
1.3
Simplex Infra
Neutral
295
-
1,460
6,241
7,008
10.4
10.7
20.0
36.0
14.8
8.2
1.2
1.1
6.8
11.1
0.7
0.6
Financials
Allahabad Bank
Neutral
75
-
4,291
8,438
9,521
2.8
2.8
21.9
27.0
3.4
2.8
0.4
0.3
10.2
11.5
-
-
Axis Bank
Buy
496
701
117,820
26,941
32,298
3.5
3.6
37.4
46.4
13.3
10.7
2.7
2.3
18.7
20.0
-
-
Bank of Baroda
Neutral
181
-
40,094
19,027
21,737
1.9
2.0
16.9
24.5
10.7
7.4
1.0
0.9
9.1
12.1
-
-
Bank of India
Neutral
134
-
8,940
16,438
18,706
1.9
2.0
19.2
40.9
7.0
3.3
0.4
0.3
4.5
9.1
-
-
Canara Bank
Neutral
279
-
14,395
15,491
17,269
2.0
2.0
61.6
70.9
4.5
3.9
0.5
0.5
10.5
11.1
-
-
Dena Bank
Neutral
40
-
2,225
3,498
3,977
2.1
2.3
7.8
10.7
5.1
3.7
0.4
0.3
6.5
8.4
-
-
Federal Bank
Neutral
65
-
11,202
3,527
4,135
3.0
3.1
5.2
6.7
12.6
9.8
1.3
1.2
10.8
12.7
-
-
HDFC
Neutral
1,199
-
189,203
10,883
12,799
3.5
3.4
43.0
50.6
27.9
23.7
5.5
5.0
25.9
26.7
-
-
HDFC Bank
Buy
1,068
1,255
269,056
38,059
46,851
4.4
4.5
50.0
62.7
21.4
17.0
3.7
3.2
18.8
20.2
-
-
Stock Watch
October 05, 2015
Company Name
Reco
CMP
Target
Mkt Cap
Sales ( Čcr )
OPM(%)
EPS (Č)
PER(x)
P/BV(x)
RoE(%)
EV/Sales(x)
(Č)
Price ( Č)
( Č cr )
FY16E
FY17E
FY16E
FY17E
FY16E
FY17E
FY16E
FY17E
FY16E
FY17E
FY16E
FY17E
FY16E
FY17E
Financials
ICICI Bank
Buy
267
370
155,268
35,810
41,871
3.4
3.5
22.0
26.2
12.2
10.2
2.1
1.8
15.0
15.6
-
-
IDBI Bank
Neutral
79
-
12,735
9,860
10,978
1.8
1.9
9.3
15.6
8.6
5.1
0.6
0.5
6.4
10.1
-
-
Indian Bank
Neutral
134
-
6,426
6,267
7,171
2.4
2.5
25.4
32.1
5.3
4.2
0.4
0.4
8.0
9.3
-
-
LIC Housing Finance
Buy
463
570
23,371
2,934
3,511
2.3
2.3
30.9
36.8
15.0
12.6
2.4
2.1
16.8
17.5
-
-
Oriental Bank
Neutral
131
-
3,921
7,730
8,595
2.4
2.5
38.8
47.4
3.4
2.8
0.3
0.3
8.6
9.8
-
-
Punjab Natl.Bank
Neutral
133
-
24,582
23,446
26,624
2.8
2.9
17.8
27.5
7.5
4.8
0.7
0.6
8.5
12.1
-
-
South Ind.Bank
Neutral
22
-
3,024
1,930
2,215
2.4
2.4
2.6
3.6
8.6
6.2
0.9
0.8
9.9
12.5
-
-
St Bk of India
Buy
235
307
178,109
83,847
96,307
2.8
2.8
20.1
25.1
11.7
9.4
1.3
1.1
11.5
13.1
-
-
Union Bank
Neutral
174
-
11,059
12,755
14,439
2.3
2.4
31.5
39.9
5.5
4.4
0.6
0.5
9.9
11.6
-
-
Vijaya Bank
Neutral
34
-
2,930
3,594
3,969
1.8
1.9
5.8
7.1
5.9
4.8
0.5
0.5
8.2
9.3
-
-
Yes Bank
Buy
728
953
30,499
7,204
9,078
3.2
3.2
57.8
69.5
12.6
10.5
2.2
1.9
19.6
22.6
-
-
FMCG
Asian Paints
Neutral
839
-
80,462
16,553
19,160
16.0
16.2
17.7
21.5
47.5
39.0
12.6
11.3
29.4
31.2
4.7
4.1
Britannia
Neutral
3,124
-
37,480
8,065
9,395
9.6
10.2
47.2
65.5
66.2
47.7
22.0
20.8
38.3
41.2
4.5
3.9
Colgate
Neutral
964
-
26,218
4,836
5,490
19.5
19.7
48.5
53.2
19.9
18.1
14.6
12.7
99.8
97.5
5.3
4.7
Dabur India
Neutral
279
-
48,989
9,370
10,265
17.1
17.2
7.3
8.1
38.0
34.4
11.5
9.3
33.7
30.6
5.1
4.7
GlaxoSmith Con*
Neutral
6,020
-
25,319
4,919
5,742
17.2
17.4
168.3
191.2
35.8
31.5
10.2
8.6
28.8
28.9
4.7
4.0
Godrej Consumer
Neutral
1,227
-
41,768
10,168
12,886
16.1
16.1
32.1
38.4
38.2
31.9
7.8
7.2
19.7
21.0
4.2
3.3
HUL
Neutral
815
-
176,258
34,940
38,957
17.5
17.7
20.8
24.7
39.2
33.0
43.6
34.8
110.5
114.2
4.9
4.3
ITC
Buy
329
409
263,911
41,068
45,068
37.8
37.4
13.9
15.9
23.6
20.7
7.9
7.0
34.1
33.8
6.1
5.5
Marico
Neutral
399
-
25,758
6,551
7,766
15.7
16.0
10.4
12.5
38.5
31.9
11.2
9.3
33.2
32.4
3.9
3.3
Nestle*
Neutral
6,401
-
61,714
11,291
12,847
22.2
22.3
158.9
184.6
40.3
34.7
21.1
18.9
55.0
57.3
5.3
4.6
Tata Global
Accumulate
130
144
8,201
8,635
9,072
9.8
9.9
6.5
7.6
20.0
17.1
2.0
1.9
6.8
7.4
0.9
0.8
IT
HCL Tech^
Buy
858
1,132
120,639
42,038
47,503
23.5
23.5
56.4
62.9
15.2
13.6
3.5
2.7
23.2
19.8
2.5
2.0
Infosys
Accumulate
1,173
1,306
269,489
60,250
66,999
28.0
28.0
58.3
63.7
20.1
18.4
4.2
3.6
20.9
19.7
3.8
3.3
TCS
Buy
2,640
3,168
517,045
108,420
123,559
28.8
28.7
127.2
143.9
20.8
18.3
8.3
7.7
39.9
41.8
4.4
3.8
Tech Mahindra
Accumulate
563
646
54,158
25,566
28,890
16.0
17.0
26.3
31.9
21.4
17.7
3.9
3.3
17.9
18.6
1.9
1.6
Wipro
Buy
599
719
147,943
52,414
58,704
23.7
23.8
38.4
42.3
15.6
14.2
3.0
2.7
19.5
18.0
2.4
2.0
Media
D B Corp
Accumulate
322
356
5,912
2,241
2,495
27.8
27.9
21.8
25.6
14.8
12.6
3.9
3.4
26.7
28.5
2.6
2.3
HT Media
Neutral
84
-
1,950
2,495
2,603
11.2
11.2
7.3
8.6
11.5
9.7
0.9
0.8
7.4
8.1
0.3
0.3
Stock Watch
October 05, 2015
Company Name
Reco
CMP
Target
Mkt Cap
Sales ( Čcr )
OPM(%)
EPS (Č)
PER(x)
P/BV(x)
RoE(%)
EV/Sales(x)
(Č)
Price ( Č)
( Č cr )
FY16E FY17E
FY16E
FY17E
FY16E
FY17E
FY16E
FY17E
FY16E
FY17E
FY16E
FY17E
FY16E
FY17E
Media
Jagran Prakashan
Accumulate
142
156
4,644
1,939
2,122
26.0
26.0
8.3
9.2
17.1
15.4
2.9
2.6
17.5
17.1
2.4
2.1
Sun TV Network
Neutral
366
-
14,437
2,779
3,196
70.2
70.5
22.8
27.3
16.1
13.4
4.0
3.6
26.7
28.3
4.9
4.3
Hindustan Media
Buy
241
292
1,768
920
1,031
20.0
20.0
19.2
20.9
12.5
11.5
2.1
1.8
16.4
15.3
1.5
1.3
Ventures
Metals & Mining
Coal India
Buy
328
400
207,303
72,015
78,415
21.2
21.5
21.7
25.3
15.1
13.0
5.1
5.1
33.1
39.1
2.1
2.0
Hind. Zinc
Neutral
139
-
58,753
15,258
16,495
44.2
45.6
17.6
19.2
7.9
7.3
1.2
1.1
15.9
15.3
1.6
1.1
Hindalco
Neutral
71
-
14,599
104,356
111,186
8.7
9.5
6.7
11.1
10.5
6.4
0.4
0.4
3.5
5.9
0.7
0.6
JSW Steel
Neutral
875
-
21,160
48,125
53,595
18.8
21.0
46.9
97.5
18.7
9.0
0.9
0.8
4.4
9.5
1.3
1.1
NMDC
Neutral
94
-
37,229
8,237
10,893
46.6
44.5
10.0
11.7
9.4
8.1
1.1
0.9
12.5
13.0
4.3
3.3
SAIL
Neutral
51
-
20,960
45,915
53,954
7.2
10.5
1.5
4.4
33.7
11.6
0.5
0.5
2.3
4.1
1.1
1.0
Vedanta
Neutral
83
-
24,726
71,445
81,910
26.2
26.3
12.9
19.2
6.5
4.4
0.5
0.4
7.2
8.9
0.8
0.6
Tata Steel
Neutral
212
-
20,604
136,805
149,228
11.3
11.9
26.4
36.8
8.0
5.8
0.6
0.6
6.0
8.0
0.7
0.6
Oil & Gas
Cairn India
Neutral
153
-
28,657
11,323
12,490
49.4
51.0
20.7
20.7
7.4
7.4
0.5
0.5
6.4
6.1
1.6
0.9
GAIL
Neutral
294
-
37,325
64,856
70,933
9.1
9.6
24.0
28.9
12.3
10.2
1.1
1.0
8.8
9.6
0.8
0.7
ONGC
Neutral
232
-
198,744
154,564
167,321
36.8
37.4
28.6
32.5
8.1
7.2
1.0
1.0
12.7
13.5
1.5
1.4
Petronet LNG
Buy
176
210
13,174
39,007
40,785
3.8
4.2
9.2
11.0
19.2
16.0
2.1
2.0
11.6
12.7
0.4
0.4
Indian Oil Corp
Accumulate
401
455
97,422
359,607
402,760
5.9
6.1
42.5
48.7
9.5
8.2
1.3
1.1
14.1
14.4
0.4
0.3
Reliance Industries
Accumulate
862
930
279,250
313,085
362,904
13.1
13.8
78.4
92.9
11.0
9.3
1.2
1.1
10.8
11.6
1.4
1.2
Pharmaceuticals
Alembic Pharma
Neutral
700
-
13,189
2,601
3,115
21.2
20.2
20.8
23.9
33.6
29.3
10.8
8.2
37.2
31.8
5.1
4.2
Aurobindo Pharma
Accumulate
770
872
44,965
14,923
17,162
23.0
23.0
38.2
43.6
20.2
17.7
6.2
4.7
36.0
30.2
3.4
2.9
Aventis*
Neutral
4,082
-
9,402
2,156
2,455
15.1
16.8
109.7
133.9
37.2
30.5
5.1
4.2
18.4
22.5
4.1
3.4
Cadila Healthcare
Neutral
2,101
-
43,010
10,224
11,840
20.0
21.0
71.0
85.6
29.6
24.5
7.9
6.3
30.1
28.5
4.3
3.6
Cipla
Accumulate
635
671
51,013
14,359
16,884
21.3
19.7
28.4
30.5
22.4
20.8
4.0
3.4
19.3
17.5
3.5
2.9
Dr Reddy's
Neutral
4,230
-
72,129
18,213
21,214
22.6
22.7
163.0
192.5
26.0
22.0
5.3
4.4
22.5
20.0
3.9
3.3
Dishman Pharma
Neutral
354
-
2,853
1,716
1,888
20.2
20.2
16.3
21.6
21.7
16.4
2.0
1.8
9.7
11.7
1.8
1.5
GSK Pharma*
Neutral
3,340
-
28,287
2,870
3,158
20.0
22.1
59.5
68.3
56.1
48.9
16.6
17.0
28.5
34.3
9.4
8.6
Indoco Remedies
Neutral
312
-
2,878
1,088
1,262
18.2
18.2
13.1
15.5
23.8
20.2
4.7
3.9
21.2
21.1
2.7
2.3
Ipca labs
Accumulate
737
800
9,296
3,507
4,078
17.6
18.6
25.8
32.0
28.6
23.0
3.7
3.2
13.8
14.9
2.9
2.5
Lupin
Neutral
2,107
-
94,835
14,864
17,244
26.9
26.9
62.1
71.1
33.9
29.6
8.2
6.5
27.4
24.6
6.1
5.1
Sun Pharma
Accumulate
891
950
214,353
28,163
32,610
25.8
30.7
17.4
26.9
51.2
33.1
4.9
4.2
13.0
16.6
7.1
5.9
Stock Watch
October 05, 2015
Company Name
Reco
CMP
Target
Mkt Cap
Sales ( Čcr )
OPM(%)
EPS (Č)
PER(x)
P/BV(x)
RoE(%)
EV/Sales(x)
(Č)
Price ( Č)
( Č cr )
FY16E FY17E
FY16E
FY17E
FY16E
FY17E
FY16E
FY17E
FY16E
FY17E
FY16E
FY17E
FY16E
FY17E
Power
Tata Power
Neutral
66
-
17,810
35,923
37,402
22.6
22.8
4.1
5.2
16.2
12.8
1.2
1.2
7.5
9.3
1.4
1.3
NTPC
Buy
124
157
101,996
87,064
98,846
23.5
23.5
11.7
13.2
10.6
9.4
1.2
1.1
11.4
12.1
2.2
2.0
Power Grid
Buy
130
170
68,246
20,702
23,361
86.7
86.4
12.1
13.2
10.8
9.9
1.6
1.4
15.6
15.1
8.2
7.7
Telecom
Bharti Airtel
Neutral
340
-
135,812
101,748
109,191
32.1
31.7
12.0
12.5
28.3
27.2
1.9
1.8
6.9
6.7
2.0
1.8
Idea Cellular
Neutral
150
-
54,012
34,282
36,941
32.0
31.5
5.9
6.2
25.4
24.2
2.3
2.1
9.9
9.3
2.2
2.0
zOthers
Abbott India
Neutral
5,737
-
12,191
2,715
3,153
14.5
14.1
134.3
152.2
42.7
37.7
10.7
8.8
27.4
25.6
4.2
3.6
Bajaj Electricals
Buy
250
341
2,522
4,719
5,287
5.2
5.8
8.6
12.7
29.2
19.7
3.3
2.9
11.4
14.8
0.5
0.5
Finolex Cables
Neutral
235
-
3,598
2,728
3,036
10.8
11.0
14.4
16.8
16.3
14.0
2.5
2.2
15.2
15.3
1.1
0.9
Goodyear India*
Buy
569
655
1,313
1,953
1,766
12.4
12.0
67.4
59.6
8.4
9.6
2.1
1.8
27.7
20.2
0.5
0.4
Hitachi
Neutral
1,488
-
4,045
1,806
2,112
9.0
9.2
28.6
29.1
52.0
51.2
12.9
10.4
28.1
22.6
2.3
2.0
Jyothy Laboratories
Neutral
316
-
5,720
1,620
1,847
11.5
11.5
7.3
8.5
43.3
37.3
5.6
5.2
13.3
14.4
3.4
2.9
MRF
Neutral
41,567
-
17,629
20,727
14,841
19.3
18.6
4,905.8
3,351.9
8.5
12.4
2.7
2.2
37.6
19.6
0.8
1.1
Page Industries
Neutral
13,352
-
14,893
1,929
2,450
19.8
20.1
229.9
299.0
58.1
44.7
25.6
17.8
52.1
47.1
7.8
6.1
Relaxo Footwears
Neutral
531
-
6,378
1,767
2,152
12.3
12.5
19.3
25.1
27.6
21.2
6.8
5.2
27.7
27.8
3.7
3.0
Siyaram Silk Mills
Buy
977
1,221
916
1,653
1,873
11.7
12.2
99.3
122.1
9.8
8.0
1.8
1.5
19.5
20.2
0.7
0.6
Styrolution ABS India*
Neutral
740
-
1,302
1,271
1,440
8.6
9.2
32.0
41.1
23.1
18.0
2.4
2.1
10.7
12.4
1.0
0.9
Tree House
Buy
314
449
1,329
259
324
56.8
56.8
17.0
21.7
18.5
14.5
1.9
1.7
10.1
11.5
5.0
4.2
TVS Srichakra
Buy
2,594
3,210
1,986
2,127
2,388
15.2
14.9
237.7
267.5
10.9
9.7
4.6
3.3
51.7
39.8
1.0
0.8
HSIL
Accumulate
269
302
1,943
2,182
2,404
16.3
16.5
15.8
18.9
17.0
14.2
1.4
1.3
8.4
9.4
1.2
1.1
Kirloskar Engines India
Accumulate
279
297
4,030
2,634
3,252
10.1
12.0
10.9
17.4
25.6
16.0
2.9
2.6
11.4
16.8
1.2
0.9
Ltd
M M Forgings
Buy
545
797
658
563
671
22.1
22.9
51.0
66.5
10.7
8.2
2.2
1.8
23.1
24.1
1.3
1.1
Banco Products (India)
Neutral
119
-
850
1,208
1,353
11.0
12.3
10.8
14.5
11.0
8.2
1.3
1.1
11.9
14.5
0.7
0.6
Competent Automobiles Neutral
145
-
89
1,007
1,114
3.1
3.1
23.7
28.2
6.1
5.2
0.9
0.8
13.9
14.6
0.1
0.1
Nilkamal
Neutral
971
-
1,449
1,948
2,147
10.6
10.3
60.0
67.0
16.2
14.5
2.5
2.2
16.8
16.1
0.8
0.7
Visaka Industries
Buy
132
166
210
1,158
1,272
8.6
9.5
23.7
32.7
5.6
4.0
0.6
0.5
10.1
12.5
0.4
0.3
Transport Corporation of
Buy
244
293
1,858
2,830
3,350
8.8
9.0
14.4
18.3
17.0
13.3
2.6
2.3
15.4
17.1
0.8
0.7
India
Elecon Engineering
Buy
72
87
789
1,452
1,596
14.0
14.7
4.4
6.2
16.4
11.6
1.4
1.2
8.6
11.2
0.8
0.7
Surya Roshni
Buy
130
183
571
2,992
3,223
8.3
8.5
14.7
18.3
8.9
7.1
0.8
0.8
9.8
11.0
0.5
0.4
MT Educare
Buy
129
169
513
286
366
18.3
17.7
7.7
9.4
16.7
13.7
3.5
3.1
20.2
21.1
1.7
1.3
Stock Watch
October 05, 2015
Company Name
Reco
CMP
Target Mkt Cap
Sales ( Čcr )
OPM(%)
EPS (Č)
PER(x)
P/BV(x)
RoE(%)
EV/Sales(x)
(Č)
Price ( Č)
( Č cr )
FY16E FY17E FY16E FY17E FY16E FY17E FY16E FY17E FY16E FY17E FY16E FY17E FY16E FY17E
zOthers
Radico Khaitan
Buy
87
112
1,154
1,565
1,687
11.9
12.4
5.4
6.6
16.0
13.2
1.3
1.2
8.0
9.0
1.2
1.2
Garware Wall Ropes
Accumulate
351
390
769
875
983
10.4
10.6
23.1
27.8
15.2
12.6
2.2
1.9
14.1
14.8
0.9
0.8
Wonderla Holidays
Accumulate
287
322
1,619
206
308
44.0
43.6
9.0
12.9
31.8
22.2
4.4
3.9
13.7
17.8
7.8
5.2
Linc Pen & Plastics
Buy
155
185
229
340
371
8.3
8.9
10.8
13.2
14.3
11.7
2.3
2.0
16.0
17.1
0.7
0.6
The Byke Hospitality
Accumulate
161
181
647
222
287
20.5
20.5
5.6
7.6
28.6
21.3
5.4
4.4
18.9
20.8
2.9
2.3
Source: Company, Angel Research; Note: *December year end; #September year end; &October year end; Price as on October 01, 2015
Market Outlook
October 05, 2015
Research Team Tel: 022 - 39357800
DISCLAIMER
Angel Broking Private Limited (hereinafter referred to as “Angel”) is a registered Member of National Stock Exchange of India Limited,
Bombay Stock Exchange Limited and Metropolitian Stock Exchange of India Limited. It is also registered as a Depository Participant with
CDSL and Portfolio Manager with SEBI. It also has registration with AMFI as a Mutual Fund Distributor. Angel Broking Private Limited is a
registered entity with SEBI for Research Analyst in terms of SEBI (Research Analyst) Regulations, 2014 vide registration number
INH000000164. Angel or its associates has not been debarred/ suspended by SEBI or any other regulatory authority for accessing
/dealing in securities Market. Angel or its associates including its relatives/analyst do not hold any financial interest/beneficial ownership
of more than 1% in the company covered by Analyst. Angel or its associates/analyst has not received any compensation / managed or co
-managed public offering of securities of the company covered by Analyst during the past twelve months. Angel/analyst has not served as
an officer, director or employee of company covered by Analyst and has not been engaged in market making activity of the company
covered by Analyst.
This document is solely for the personal information of the recipient, and must not be singularly used as the basis of any investment
decision. Nothing in this document should be construed as investment or financial advice. Each recipient of this document should make
such investigations as they deem necessary to arrive at an independent evaluation of an investment in the securities of the companies
referred to in this document (including the merits and risks involved), and should consult their own advisors to determine the merits and
risks of such an investment.
Reports based on technical and derivative analysis center on studying charts of a stock's price movement, outstanding positions and
trading volume, as opposed to focusing on a company's fundamentals and, as such, may not match with a report on a company's
fundamentals.
The information in this document has been printed on the basis of publicly available information, internal data and other reliable sources
believed to be true, but we do not represent that it is accurate or complete and it should not be relied on as such, as this document is for
general guidance only. Angel Broking Pvt. Limited or any of its affiliates/ group companies shall not be in any way responsible for any
loss or damage that may arise to any person from any inadvertent error in the information contained in this report. Angel Broking Pvt.
Limited has not independently verified all the information contained within this document. Accordingly, we cannot testify, nor make any
representation or warranty, express or implied, to the accuracy, contents or data contained within this document. While Angel Broking
Pvt. Limited endeavors to update on a reasonable basis the information discussed in this material, there may be regulatory, compliance,
or other reasons that prevent us from doing so.
This document is being supplied to you solely for your information, and its contents, information or data may not be reproduced,
redistributed or passed on, directly or indirectly.
Neither Angel Broking Pvt. Limited, nor its directors, employees or affiliates shall be liable for any loss or damage that may arise from or
in connection with the use of this information.
Note: Please refer to the important ‘Stock Holding Disclosure' report on the Angel website (Research Section). Also, please refer to the
latest update on respective stocks for the disclosure status in respect of those stocks. Angel Broking Pvt. Limited and its affiliates may have
investment positions in the stocks recommended in this report.