Market Outlook
November 4, 2015
Market Cues
Domestic Indices
Chg (%)
(Pts)
(Close)
Indian markets are expected to open positive tracking the SGX Nifty and Asian
BSE Sensex
0.1
31
26,591
markets.
Nifty
0.1
10
8,061
US market climbed on the day extended the rally that was seen over the course of
Mid Cap
0.3
30
11,014
the previous session. While buying interest faded late in the session as report from
Small Cap
0.4
44
11,336
the Commerce Department showed factory orders saw further downside in the
month of September. The factory orders fell by 1.0 percent in September after
Bankex
(0.1)
21
19,758
tumbling by a revised 2.1 percent in August.
European markets ended yesterday’s session on mixed note. Due to a lack of global
Global Indices
Chg (%)
(Pts)
(Close)
economic data, corporate news was in focus. Financial stocks were under pressure,
Dow Jones
0.5
89
17,918
due to news out of UBS and Standard Chartered. Volkswagen emission scandal has
Nasdaq
0.4
18
5,145
worsened after further allegations from the United States. Meanwhile, energy stocks
FTSE
0.3
22
6,384
were among the best performing stocks, due to rising crude oil prices.
Nikkei
(2.1)
(400)
18,683
Indian markets snapped a six-day losing streak on Tuesday as positive global cues
Hang Seng
0.9
198
22,568
and encouraging core sector data helped spur some bargain hunting in beaten-
Shanghai Com
(0.3)
(8)
3,317
down stocks. However, with investors eagerly awaiting the Bihar election results,
stocks pared much of their early gains.
Advances / Declines
BSE
NSE
News & Result Analysis
Advances
1,482
843
Result Review: Tech Mahindra, HSIL, Finolex Cables, PowerGrid
Declines
1,217
651
Result Preview: Ashok Leyland
Detailed analysis on Pg2
Unchanged
128
84
Investor’s Ready Reckoner
Volumes (` Cr)
Key Domestic & Global Indicators
BSE
2,583
Stock Watch: Latest investment recommendations on 150+ stocks
NSE
14,993
Refer P7 onwards
Net Inflows (` Cr)
Net
Mtd
Ytd
Top Picks
CMP
Target
Upside
FII
(7)
(7)
(14,826)
Company
Sector
Rating
(`)
(`)
(%)
MFs
167
167
50,514
Axis Bank
Financials
Buy
475
630
32.5
HCL Tech
IT
Buy
876
1,132
29.3
Top Gainers
Price (`)
Chg (%)
ICICI Bank
Financials
Buy
279
348
24.6
Ashok Leyland
Automobiles
Buy
90
111
22.9
Amtekauto
44
14.3
Larsen & Toubro
Construction
Buy
1,372
1,646
20.0
Ifci
3,432
5.6
More Top Picks on Pg5
Eidparry
186
5.6
Tvsmotor
288
4.9
Key Upcoming Events
Previous
Consensus
Atul
1,764
4.8
Date
Region
Event Description
Reading
Expectations
Nov 4
US
ISM Non-Manufacturing PMI
56.9
56.5
Top Losers
Price (`)
Chg (%)
Nov 5
GBP
Interest Rate Decision
0.5%
0.5%
Oberoirlty
285
(6.0)
Nov 6
US
Unemployment Rate (Oct)
5.1%
5.1%
Jpinfratec
12
(5.1)
Nov 6
GBP
Manufacturing Production (MOM) (Sep)
0.5%
0.4%
Suzlon
23
(5.0)
Pmcfin
1
(4.9)
Escorts
166
(4.0)
As on November 03, 2015
Market Outlook
November 4, 2015
Result Review
Tech Mahindra (CMP: `557 / TP: `646 /Upside: 15.9%)
Tech Mahindra, posted a better than expected results in 2QFY2016.Tech
Mahindra posted a 2.2% qoq growth to end the period at US$1,011mn expected
V/s US$1,004mn and V/s US$989mn in 1QFY2016. In Constant currency terms
(CC), the company posted a 3.0% qoq. In rupee terms, the company posted a
5.1% qoq growth of `6,616cr V/s `6,577cr expected and `6,294cr in 1QFY2016.
The growth was primarily driven by the USA, which contributed around 48.9% of
sales in 2QFY2016 and 47.7% of sales in 1QFY2016. Amongst the verticals, the
Communication and the Technology, media and Entertainment industries drove
growth with these industries contributing 52.9% of sales ( 52.7% of sales in
1QFY2016) and 8.2% of sales ( 7.3% of sales in 1QFY2016) respectively.
On the EBIDTA front, the margins came in at 16.6% V/s 15.9% expected and
14.9% in 1QFY2016. On EBIT front, the company posted a 13.7% EBIT V/s 13.1%
expected and V/s 12.1% in 1QFY2016. The margin expansion was driven by the
improved capacity utilization, which moved up from 74% in 1QFY2016 to 77% in
2QFY2016. Excluding the trainee, the utilization inched up to 79% V/s 75% in
1QFY2016. The attrition rate during the quarter was 20% V/s 19% in 1QFY2016.
Thus, the Net Profit came in at `786cr V/s `725cr expected and `676cr in
1QFY2016, a qoq growth of 16.2%. During the quarter, the company added 18
clients , with one client added in US$50mn+, 2 in US$10mn+. We currently have
buy rating on the stock with a price target of `646.
Y/E
Sales OPM
PAT
EPS ROE P/E P/BV EV/EBITDA EV/Sales
March
(` cr)
(%)
(` cr)
(`)
(%)
(x)
(x)
(x)
(x)
FY2016E
25,566
16.0
2,528
26.3
17.9
21.1
3.8
12.2
2.0
FY2017E
28,890
17.0
3,066
31.9
18.6
17.5
3.2
9.8
1.7
HSIL Ltd (CMP: `278/ TP: `302/ Upside: 8.5%)
HSIL reported a mixed set of numbers for 2QFY2016. The top-line was muted,
managing to grow by mere 1.3% on yoy basis to `429cr. This was lower than our
estimate of `452cr. The Building Products business managed to grow by 8.9% yoy
to `247cr while Packaging Products business proved to be a drag, posting a 7.5%
yoy decline to `182cr.
The raw material cost declined by 54bp yoy to 30.3% of sales and other expenses
declined by 120bp yoy to 39.1% of sales. However, employee cost increased by
178bp yoy to 13.0% of sales and as a result, EBITDA margin remained flat at
17.6%, which is more or less in line with our estimate of 18.0%. The EBIT margin
for the Building Products declined by 307bp yoy to 15.4% but the same has
increased by 156bp on qoq basis. The packaging products business margin
increased by 325bp yoy and 227bp qoq to 10.2%.
The company has lowered the debt in the past year by ~`374cr (Partially from the
QIP proceeds) and as a result, the interest expense has come down by 51.4% yoy
to `9cr, thus adding to the bottom line. Mainly on account of lower interest
expense, the bottom line grew by 27.6% yoy to `24 against our estimate of `28cr.
Market Outlook
November 4, 2015
At the moment, the Packaging products business has been facing slowdown from
the FMCG industry and there is excess capacity in the industry that seems to be
hampering the top-line. Although the Building products business has maintained
the momentum, the real estate/construction sector in general is facing slowdown.
Although the near term outlook remains stable, long term prospects are intact
especially for the Building Products segment.
At current market price, the stock is trading at 14.7x its FY2017 earnings. We
maintain our Accumulate rating on the stock with a target price of `302. We may
change our rating post 2QFY2016 result conference call
Y/E
Sales OPM
PAT
EPS ROE P/E P/BV EV/EBITDA EV/Sales
March
(` cr)
(%)
(` cr)
(`)
(%)
(x)
(x)
(x)
(x)
FY2015E
2,123
16.1
109
15.0
8.0
18.5
1.4
6.4
1.3
FY2016E
2,384
16.5
136
18.9
9.4
14.7
1.3
5.6
1.1
Finolex Cables Ltd. (CMP: `248 /TP: -/ Upside: -)
Finolex cables reported numbers that were below our estimates. The top-line
declined by 4.9% yoy to `605cr, same was below our estimate of `691cr. The de-
growth was on account of lower commodity prices which was passed on resulting
in lower realizations. In terms of volume growth, Electrical Cables posted modest
growth numbers while that of Communication Cables was more than 20%. The
raw material cost declined by 178bp yoy to 72.1% of sales but the same was
negated by 59bp yoy increase in employee cost to 4.3% of sales and 131bp yoy
increase in other expenses to 11.1% of sales. This resulted in EBITDA margin
contracting by 12bp to 12.5%. Other income during the quarter declined by
24.4% yoy to `28cr, but the same was in-line with our estimate of `27cr. As a
result, the net profit declined by 17.8% yoy to `65cr against `79cr in the same
quarter of the previous year.
Currently, we have a Neutral rating on the stock and considering that the numbers
have come in below our expectations, we maintain our Neutral stance. We will
revisit our rating post management discussion.
Y/E
Sales OPM
PAT
EPS ROE P/E P/BV EV/EBITDA EV/Sales
Mar
(` cr)
(%)
(` cr)
(`)
(%)
(x)
(x)
(x)
(x)
FY2016E
2,499
12.0
191.7
12.5 13.5 19.8
2.7
10.5
1.3
FY2017E
2,882
11.7
213.8
14.0 13.4 17.8
2.4
9.1
1.1
Power Grid Corp CMP: `131 / TP: `170 / Upside: 30%)
Power Grid 2Q2016 total revenues increased 18% yoy to `4,918cr, 2.8% below
our estimate of `5,062cr. Transmission revenues came in 3.5% below our estimate
at `4,708cr, increasing 17% yoy (vs. our estimate of 21%). Consultancy revenues
once again surprised positively at `99cr as against our estimate of `89cr. Telecom
revenues too came ahead of expectations this quarter at `97cr vs. our estimate of
`64cr. Transmission expenses as a percentage of transmission revenues was 30bp
lower than estimate at 7.7%, while employee expenses was much lower than
expected at `239cr as against our expectation of `304cr. This led to a 190bp yoy
improvement in EBITDA margin at 87.8% during the quarter as against 85.9% in
Market Outlook
November 4, 2015
2QFY2015 and our estimate of 86.3%. Net profit was marginally above our
estimate led by higher other income at `1,448cr vs. our estimate of `1,440cr. We
still await the capitalisation and capex details from the company.
We like PGCIL for the high quality earnings and growth offered by the regulated
equity model, huge investments that are required in the transmission sector and
the execution track record of the company. We expect PGCIL to report a revenue
and EBITDA CAGR of ~17% over FY2015-17E led by the strong capex plans and
capitalisation rate. We expect the bottom-line to grow at a CAGR of 18% over the
same period. At the current market price, the stock trades at a P/BV of 1.6x and
1.4x its FY2016E and FY2017E BV and we reiterate our Buy recommendation on
the stock.
Y/E
Sales
OPM PAT EPS ROE P/E P/BV EV/EBITDA EV/Sales
March
(` cr)
(%)
(` cr)
(`)
(%)
(x)
(x)
(x)
(x)
FY2016E
20,602
87.1
6,244
9.6
11.9
15.4
11.0
1.6
8.3
FY2017E
23,453
6,977
8.9
86.4
13.3
15.3
9.9
1.4
7.7
Result Preview
Ashok Leyland (CMP: `90/ TP: `111 /Upside:23% )
Ashok Leyland is slated to announce 2QFY2016 results today. We expect revenues
to grow a robust 64% yoy to `5,281 cr. Volume growth during the quarter has
been a strong 51% given the upsurge in the MHCV volumes. Realisation/vehicle is
estimated to grow 9% yoy to `15.05 lakh on back of improved mix and price
hikes. On the operating front, we expect the margins to improve sharply 530 bp
yoy to 12.6% driven by operating leverage and an improved MHCV mix. EBIDTA is
estimated to grow 185% yoy to `668 cr. Given the robust operating performance,
we expect the Net Profit to come in at `355 cr as against `12 cr reported in
corresponding quarter last year. We currently have Buy rating on the stock.
Y/E
Sales OPM
PAT
EPS ROE P/E P/BV EV/EBITDA EV/Sales
March
(` cr)
(%)
(` cr)
(`)
(%)
(x)
(x)
(x)
(x)
FY2016E
18,763
11.1
1,025
3.6
18.7
25.1
4.7
14.4
1.4
FY2017E
22,357
11.2
1,366
4.8
22.6
18.8
4.3
11.4
1.1
Economic and Political News
Pharma companies expand focus in OTC segment
Price of pulses to ease on harvest, action against hoarders: FM
UP to incur ` 14,400 cr on public healthcare
Corporate News
Hero MotoCorp records highest monthly sales in October
Prism Cement's divest stake in insurance JV
USL sells French winery Bouvet Ladubay Mallya bought in 2006
Market Outlook
November 4, 2015
Top Picks ★★★★★
Large Cap
Market Cap
CMP
Target
Upside
Company
Rationale
(` Cr)
(`)
(`)
(%)
To outpace battery industry growth due to better technological
Amara Raja Batteries
14,956
876
1,040
18.8
products leading to market share gains in both the automotive
OEM and replacement segments.
Earnings to grow strongly given the MHCV cyclical upturn.
Ashok Leyland
25,712
90
111
22.9
Focus on exports and LCV's provides additional growth
avenue.
Healthy pace of branch expansion, backed by distribution
Axis Bank
1,13,031
475
630
32.5
network, will be the driving force for the bank’s retail business
and overall earnings.
The stock is trading at attractive valuations and is factoring all
HCL Tech
1,23,114
876
1,132
29.3
the bad news.
Strong visibility for a robust 20% earnings trajectory, coupled
HDFC Bank
2,73,022
1,084
1,262
16.4
with high quality of earnings on account of high quality retail
business and strategic focus on highly rated corporates.
Due to its robust franchise and capital adequacy position, the
bank is well positioned to grow by at least a few percentage
ICICI Bank
1,62,121
279
348
24.6
points higher than the average industry growth rate from a
structural point of view.
Back on the growth trend, expect a long term growth of 14% to
Infosys
2,62,541
1,143
1,306
14.3
be a US$20bn in FY2020.
Well positioned to benefit from such expected gradual recovery
in the overall domestic capex cycle, given its presence across
Larsen & Toubro
1,27,705
1,372
1,646
20.0
various infrastructure segments, its execution capabilities, and
its strong balance sheet.
LICHF continues to grow its retail loan book at a healthy pace
with improvement in asset quality. We expect the company to
LIC Housing Finance
24,294
481
571
18.6
post a healthy loan book which is likely to reflect in a strong
earnings growth.
Source: Company, Angel Research
Mid Cap
Market Cap
CMP
Target
Upside
Company
Rationale
(` Cr)
(`)
(`)
(%)
Government thrust on Renewable sector and strong order
Inox Wind
8,593
387
505
30.4
book would drive future growth.
Change in business focus towards high-margin chronic and
Ipca labs
9,530
755
900
19.2
lifestyle segments and increasing penetration in Europe and
US
Economic recovery to have favourable impact on advertising &
circulation revenue growth. Further, the acquisition of a radio
Jagran Prakashan
4,652
142
164
15.2
business (Radio City) would also boost the company's revenue
growth.
Strong brand & quality teaching with innovative technologies
MT Educare
556
140
169
21.1
& higher government educational spending to boost growth
Earnings boost on back of stable material prices and
Radico Khaitan
1,448
109
119
9.3
favourable pricing environment. Valuation discount to peers
provides additional comfort
Strong brands and distribution network would boost growth
Siyaram Silk Mills
858
916
1,145
25.1
going ahead. Stock currently trades at an inexpensive
valuation.
Structural shift in the Lighting industry towards LED lighting will
Surya Roshni
583
133
183
37.6
drive growth.
Source: Company, Angel Research
Market Outlook
November 4, 2015
Quarterly Bloomberg Brokers Consensus Estimate
Ashok Leyland Ltd - November 4, 2015
Particulars (` cr)
2QFY16E
2QFY15
y-o-y (%)
1QFY16
q-o-q (%)
Net sales
5,197
3,150
65.0
3,775
37.7
EBITDA
627
234
167.9
389
61.2
EBITDA margin (%)
12.1
7.4
10.3
Net profit
334
121
176.0
159
110.1
Canara Bank - November 4, 2015
Particulars (` cr)
2QFY16E
2QFY15
y-o-y (%)
1QFY16
q-o-q (%)
PAT
607
626
(3.0)
478
(100.6)
IDBI Bank - November 4, 2015
Particulars (` cr)
2QFY16E
2QFY15
y-o-y (%)
1QFY16
q-o-q (%)
PAT
163
118
38.1
135
(71.8)
Reliance Infrastructure Ltd - November 4, 2015
Particulars (` cr)
2QFY16E
2QFY15
y-o-y (%)
1QFY16
q-o-q (%)
Net sales
2,493
2,450
1.8
2,579
(99.9)
EBITDA
499
481
3.7
476
(99.2)
EBITDA margin (%)
20.0
19.6
18.5
Net profit
331
356
(7.0)
330
(102.1)
Market Outlook
November 4, 2015
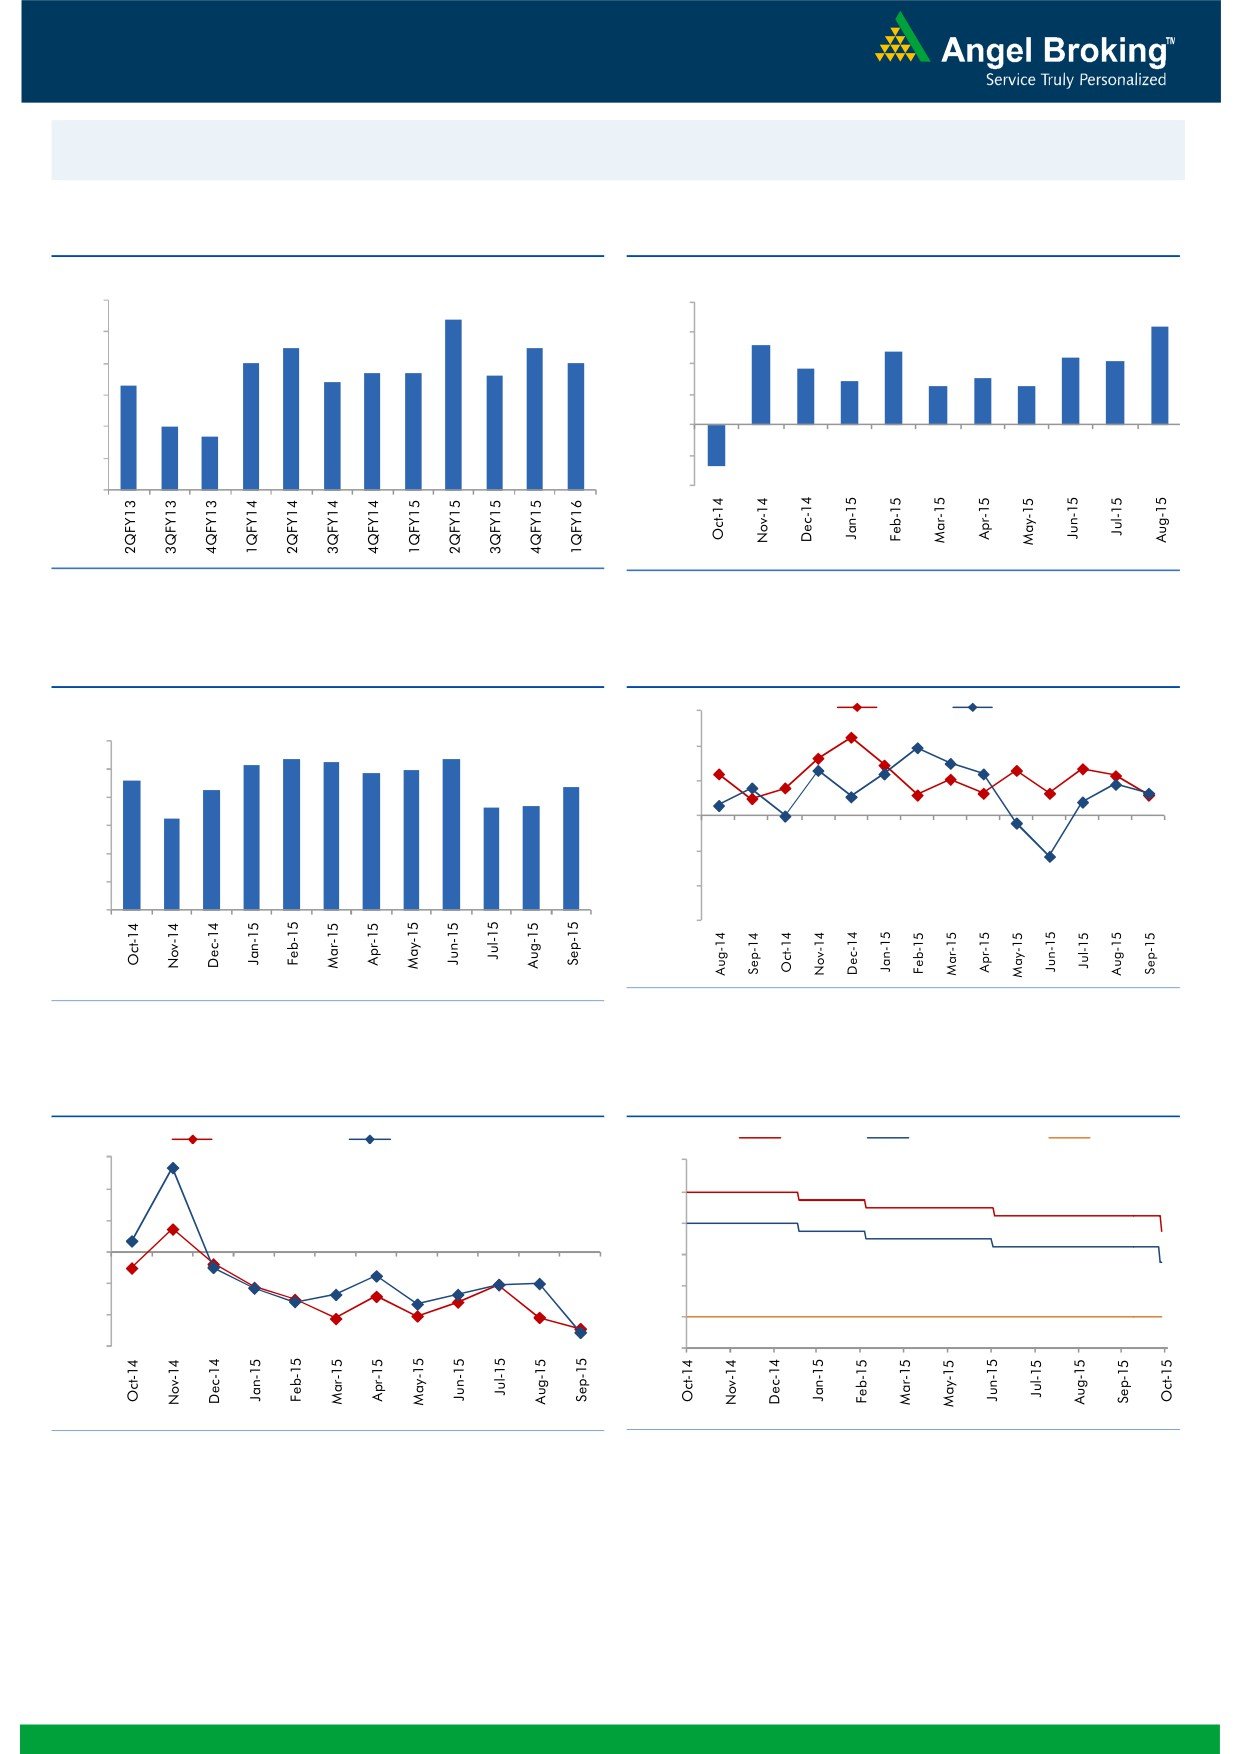
Macro watch
Exhibit 1: Quarterly GDP trends
Exhibit 2: IIP trends
(%)
(%)
9.0
8.4
8.0
6.4
7.5
7.5
5.2
8.0
6.0
4.8
7.0
7.0
4.4
4.1
6.7
6.7
6.6
3.6
7.0
6.4
4.0
2.8
3.0
6.3
2.5
2.5
6.0
2.0
5.0
4.7
5.0
-
4.0
(2.0)
3.0
(4.0)
(2.7)
Source: CSO, Angel Research
Source: MOSPI, Angel Research
Exhibit 3: Monthly CPI inflation trends
Exhibit 4: Manufacturing and services PMI
(%)
56.0
Mfg. PMI
Services PMI
6.0
5.4
5.3
5.4
54.0
5.2
5.0
4.9
4.6
5.0
4.3
4.4
52.0
3.7
3.7
4.0
3.3
50.0
3.0
2.0
48.0
1.0
46.0
-
44.0
Source: Market, Angel Research; Note: Level above 50 indicates expansion
Source: MOSPI, Angel Research
Exhibit 5: Exports and imports growth trends
Exhibit 6: Key policy rates
(%)
Exports yoy growth
Imports yoy growth
(%)
Repo rate
Reverse Repo rate
CRR
30.0
9.00
20.0
8.00
10.0
7.00
0.0
6.00
(10.0)
5.00
(20.0)
4.00
(30.0)
3.00
Source: Bloomberg, Angel Research
Source: RBI, Angel Research
Market Outlook
November 4, 2015
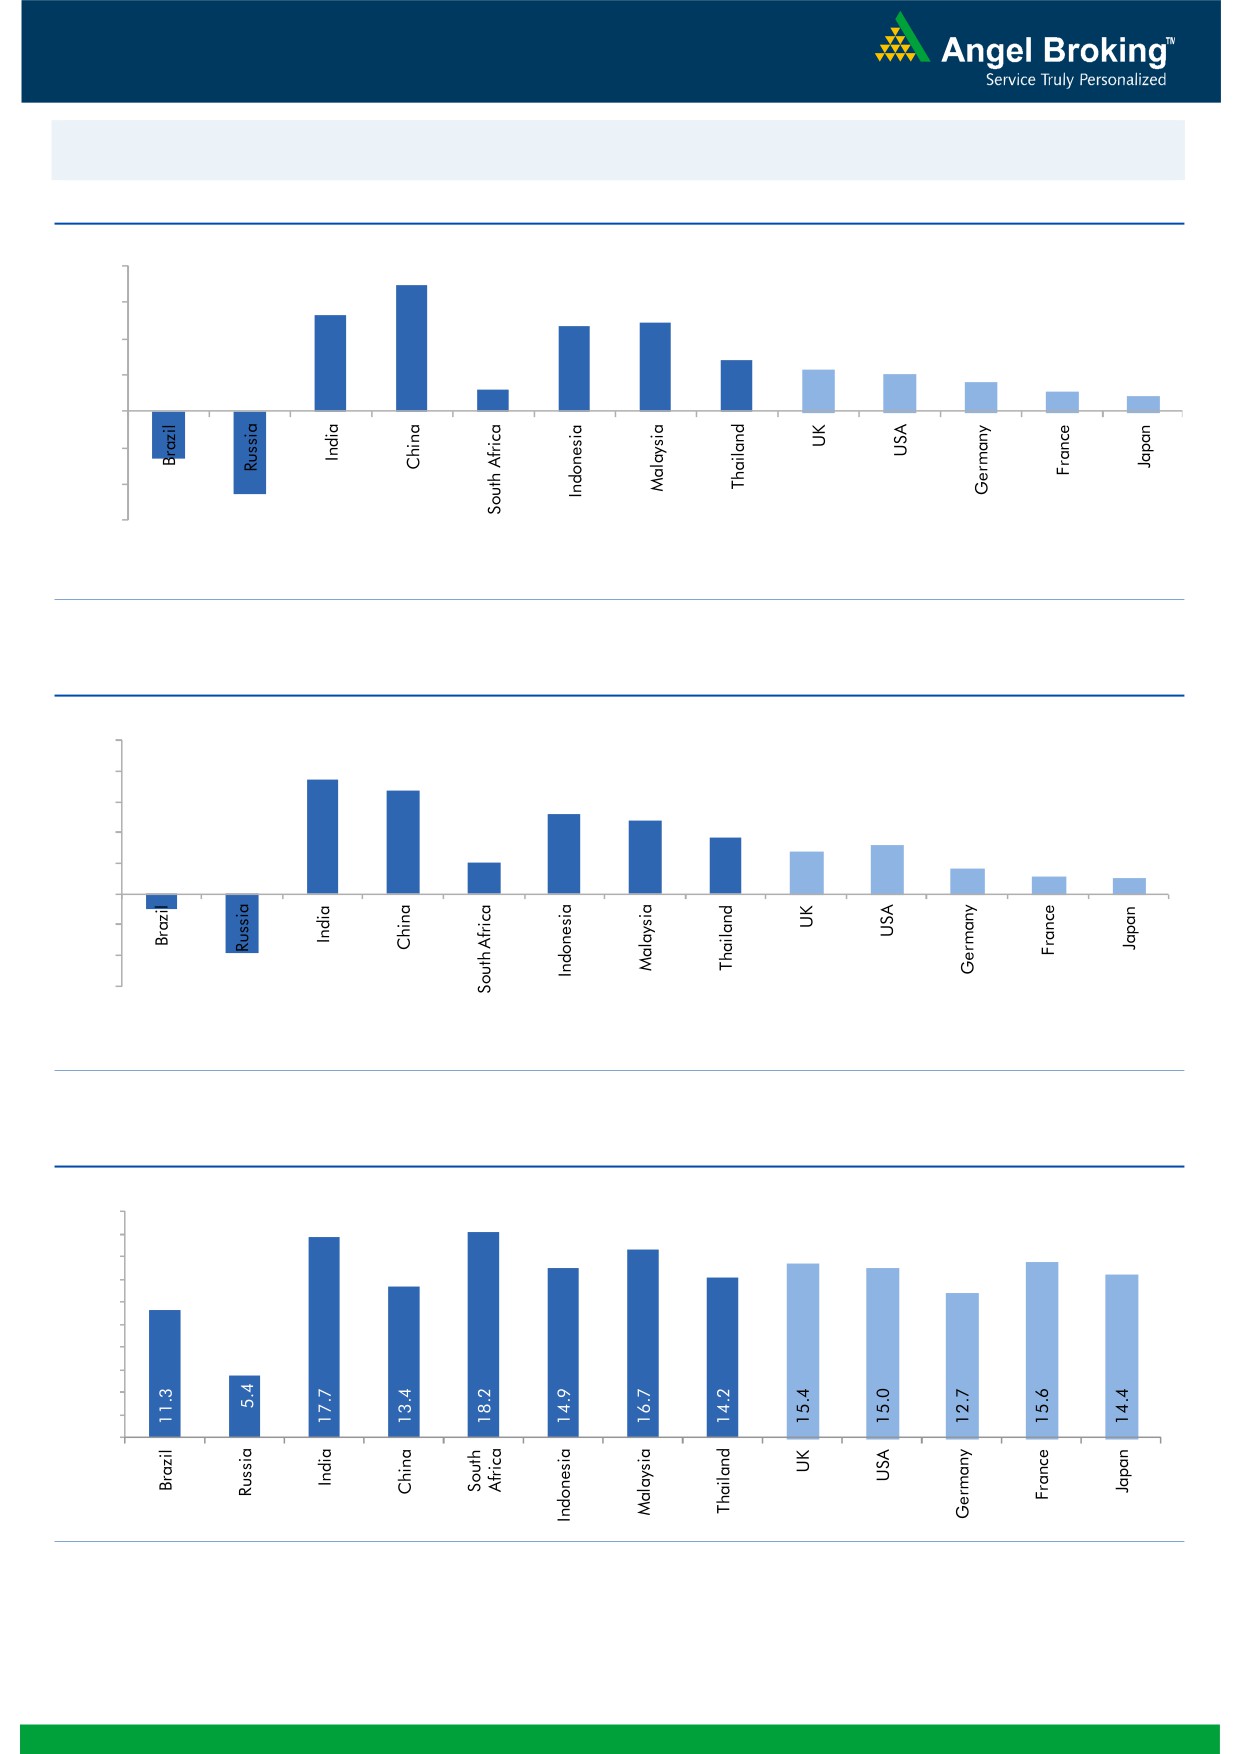
Global watch
Exhibit 1: Latest quarterly GDP Growth (%, yoy) across select developing and developed countries
(%)
8.0
6.9
6.0
5.3
4.9
4.7
4.0
2.8
2.3
2.0
1.6
2.0
1.2
1.1
0.8
(2.6)
-
(2.0)
(4.0)
(4.6)
(6.0)
Source: Bloomberg, Angel Research
Exhibit 2: 2015 GDP Growth projection by IMF (%, yoy) across select developing and developed countries
(%)
10.0
7.5
8.0
6.8
5.2
6.0
4.8
3.7
3.1
4.0
2.7
2.0
1.6
1.2
1.0
2.0
-
(2.0)
(4.0)
(1.0)
(3.8)
(6.0)
Source: IMF, Angel Research
Exhibit 3: One year forward P-E ratio across select developing and developed countries
(x)
20.0
18.0
16.0
14.0
12.0
10.0
8.0
6.0
4.0
2.0
-
Source: IMF, Angel Research
Market Outlook
November 4, 2015
Exhibit 4: Relative performance of indices across globe
Returns (%)
Country
Name of index
Closing price
1M
3M
1YR
Brazil
Bovespa
48,054
2.2
(4.0)
(12.0)
Russia
Micex
1,764
9.4
4.3
18.3
India
Nifty
8,061
1.3
(5.7)
(3.3)
China
Shanghai Composite
3,317
8.7
(9.2)
36.5
South Africa
Top 40
48,548
6.3
4.8
9.2
Mexico
Mexbol
45,355
6.2
(0.5)
1.1
Indonesia
LQ45
789
12.5
(6.2)
(8.8)
Malaysia
KLCI
1,683
3.3
(3.4)
(8.9)
Thailand
SET 50
914
5.2
(3.7)
(13.5)
USA
Dow Jones
17,918
8.8
2.1
3.2
UK
FTSE
6,384
4.1
(4.5)
(1.1)
Japan
Nikkei
18,683
5.4
(9.2)
13.8
Germany
DAX
10,952
13.4
(4.4)
22.3
France
CAC
4,936
10.7
(3.4)
19.5
Source: Bloomberg, Angel Research
Stock Watch
November 04, 2015
Company Name
Reco
CMP
Target
Mkt Cap
Sales ( Čcr )
OPM(%)
EPS (Č)
PER(x)
P/BV(x)
RoE(%)
EV/Sales(x)
(Č)
Price ( Č)
( Č cr )
FY16E FY17E
FY16E
FY17E
FY16E
FY17E
FY16E
FY17E
FY16E
FY17E
FY16E
FY17E
FY16E
FY17E
Agri / Agri Chemical
Rallis
Neutral
206
-
4,011
2,075
2,394
14.4
14.4
9.5
11.0
21.7
18.8
4.3
3.7
21.1
21.3
2.0
1.7
United Phosphorus
Accumulate
451
510
19,347
13,698
15,752
17.6
17.6
32.1
38.5
14.1
11.7
2.8
2.3
21.4
21.3
1.5
1.2
Auto & Auto Ancillary
Ashok Leyland
Buy
90
111
25,713
18,763
22,357
11.1
11.2
3.6
4.8
25.1
18.8
4.6
4.3
18.7
22.6
1.3
1.1
Bajaj Auto
Accumulate
2,421
2,672
70,066
24,115
27,600
21.3
21.0
136.8
157.2
17.7
15.4
5.7
4.9
32.2
31.5
2.5
2.1
Eicher Motors
Buy
18,003
22,859
48,865
11,681
15,550
15.3
16.9
358.5
564.3
50.2
31.9
15.1
11.2
29.8
34.9
4.1
3.0
Hero Motocorp
Neutral
2,584
-
51,594
28,561
31,559
14.7
14.7
151.1
163.2
17.1
15.8
6.6
5.6
38.7
35.6
1.6
1.5
L G Balakrishnan & Bros Neutral
465
-
729
1,254
1,394
11.6
11.8
35.9
41.7
13.0
11.2
1.8
1.5
13.5
13.8
0.7
0.6
Mahindra and Mahindra Accumulate
1,233
1,357
76,568
37,986
42,660
12.8
13.2
51.6
61.9
23.9
19.9
3.5
3.1
14.6
15.6
1.7
1.4
Maruti
Accumulate
4,481
4,960
135,347
57,865
68,104
16.4
16.7
176.3
225.5
25.4
19.9
4.9
4.2
19.4
21.2
2.1
1.7
Minda Industries
Accumulate
581
652
921
2,567
2,965
7.3
8.0
38.8
54.3
15.0
10.7
2.2
1.8
14.4
16.8
0.5
0.4
Rane Brake Lining
Accumulate
330
366
261
454
511
11.1
11.4
23.8
28.1
13.9
11.7
2.0
1.8
14.2
15.3
0.7
0.6
Setco Automotive
Neutral
219
-
584
594
741
12.7
13.7
8.4
15.8
26.0
13.8
2.7
2.3
10.4
16.9
1.4
1.2
Tata Motors
Accumulate
382
424
110,306
264,038
297,882
13.8
13.9
34.5
38.9
11.1
9.8
1.9
1.6
17.6
16.8
0.6
0.6
TVS Motor
Neutral
288
-
13,659
11,845
14,040
7.2
9.0
10.4
17.4
27.6
16.5
6.9
5.3
25.1
32.0
1.1
0.9
Amara Raja Batteries
Buy
876
1,040
14,956
4,892
5,871
17.4
17.6
28.8
37.1
30.4
23.6
7.1
5.7
23.4
24.1
3.0
2.5
Exide Industries
Accumulate
149
162
12,669
6,950
7,784
14.4
14.8
6.6
7.3
22.6
20.4
2.9
2.6
12.6
12.8
1.5
1.4
Apollo Tyres
Accumulate
165
179
8,386
12,576
12,978
16.8
16.1
22.3
19.9
7.4
8.3
1.3
1.1
17.2
13.4
0.7
0.8
Ceat
Neutral
1,105
-
4,470
6,041
6,597
14.1
13.7
99.5
111.9
11.1
9.9
2.2
1.8
19.6
18.5
0.9
0.8
JK Tyres
Neutral
99
-
2,243
7,446
7,669
15.2
14.0
19.6
18.4
5.1
5.4
1.3
1.1
25.2
19.5
0.7
0.6
Swaraj Engines
Neutral
943
-
1,171
552
630
14.2
14.7
44.6
54.1
21.1
17.4
4.9
4.5
23.2
25.6
2.0
1.7
Subros
Neutral
83
-
499
1,268
1,488
11.6
11.9
3.7
6.6
22.5
12.6
1.5
1.4
6.8
11.4
0.7
0.6
Indag Rubber
Neutral
199
-
522
283
329
17.0
17.2
13.0
15.4
15.4
12.9
3.4
2.8
21.8
21.6
1.6
1.3
Capital Goods
ACE
Neutral
45
-
450
660
839
4.7
8.2
1.0
3.9
45.5
11.7
1.4
1.3
3.2
11.3
0.8
0.7
BEML
Neutral
1,107
-
4,610
3,277
4,006
6.0
8.9
29.2
64.3
37.9
17.2
2.1
1.9
5.7
11.7
1.5
1.2
BGR Energy
Neutral
110
-
796
3,615
3,181
9.5
9.4
16.7
12.4
6.6
8.9
0.6
0.6
10.0
7.0
0.6
0.8
BHEL
Neutral
201
-
49,111
33,722
35,272
10.8
11.7
10.5
14.2
19.1
14.1
1.4
1.3
7.0
9.0
1.5
1.5
Blue Star
Neutral
372
-
3,350
3,649
4,209
5.0
5.9
9.2
14.7
40.7
25.3
7.4
6.9
9.1
17.5
1.0
0.9
Crompton Greaves
Buy
171
204
10,746
13,484
14,687
4.9
6.2
4.5
7.1
38.1
24.2
2.7
2.5
7.2
10.8
0.9
0.8
Inox Wind
Buy
387
505
8,593
4,980
5,943
17.0
17.5
26.6
31.6
14.6
12.3
4.4
3.2
35.0
30.0
1.9
1.5
Stock Watch
November 04, 2015
Company Name
Reco
CMP
Target
Mkt Cap
Sales ( Čcr )
OPM(%)
EPS (Č)
PER(x)
P/BV(x)
RoE(%)
EV/Sales(x)
(Č)
Price ( Č)
( Č cr )
FY16E
FY17E
FY16E
FY17E
FY16E
FY17E
FY16E
FY17E
FY16E
FY17E
FY16E
FY17E
FY16E
FY17E
Capital Goods
KEC International
Neutral
136
-
3,503
8,791
9,716
6.1
6.8
5.4
8.2
25.2
16.6
2.5
2.3
10.0
14.0
0.6
0.6
Thermax
Neutral
855
-
10,184
6,413
7,525
7.4
8.5
30.5
39.3
28.0
21.8
4.3
3.8
15.0
17.0
1.6
1.3
Cement
ACC
Accumulate
1,425
1,630
26,758
13,151
14,757
16.4
18.3
63.9
83.4
22.3
17.1
2.9
2.6
13.3
16.1
1.9
1.6
Ambuja Cements
Accumulate
210
233
32,512
11,564
12,556
19.4
20.7
8.9
10.1
23.5
20.7
3.0
2.8
12.8
13.8
2.5
2.2
India Cements
Buy
82
112
2,530
4,716
5,133
15.9
16.9
3.7
7.5
22.3
11.0
0.8
0.8
3.8
7.3
0.8
0.7
JK Cement
Buy
651
767
4,554
4,056
4,748
14.5
17.0
22.6
41.1
28.8
15.9
2.6
2.3
9.3
15.3
1.6
1.3
J K Lakshmi Cement
Accumulate
376
430
4,425
2,947
3,616
16.7
19.9
11.5
27.2
32.7
13.8
3.1
2.7
9.8
20.8
1.9
1.5
Mangalam Cements
Neutral
217
-
580
1,053
1,347
10.5
13.3
8.4
26.0
25.9
8.4
1.1
1.0
4.3
12.5
0.9
0.7
Orient Cement
Buy
158
183
3,245
1,854
2,524
21.2
22.2
7.7
11.1
20.6
14.3
3.0
2.6
13.3
15.7
2.5
1.7
Ramco Cements
Neutral
370
-
8,803
4,036
4,545
20.8
21.3
15.1
18.8
24.5
19.7
3.0
2.7
12.9
14.3
2.7
2.3
Shree Cement^
Neutral
12,721
-
44,315
7,150
8,742
26.7
28.6
228.0
345.5
55.8
36.8
8.2
6.9
15.7
20.3
6.0
4.8
UltraTech Cement
Accumulate
2,924
3,282
80,232
25,021
30,023
19.1
21.6
89.0
132.0
32.9
22.2
3.8
3.3
12.2
15.9
3.3
2.7
Construction
ITNL
Neutral
90
-
2,967
7,360
8,825
34.0
35.9
1.0
5.0
90.2
18.0
0.4
0.4
0.3
1.4
3.8
3.7
KNR Constructions
Neutral
592
-
1,664
915
1,479
14.3
13.9
20.3
37.2
29.1
15.9
2.7
2.3
9.6
15.6
1.9
1.2
Larsen & Toubro
Buy
1,372
1,646
127,705
64,148
73,241
11.5
11.7
62.0
66.0
22.1
20.8
2.3
2.1
13.4
14.0
2.2
1.9
Gujarat Pipavav Port
Neutral
162
-
7,841
629
684
51.0
52.2
6.4
5.9
25.3
27.5
3.3
3.1
15.9
12.7
12.1
10.9
MBL Infrastructures
Buy
212
285
878
2,313
2,797
12.2
14.6
19.0
20.0
11.2
10.6
1.2
1.1
11.3
10.6
1.1
1.0
Nagarjuna Const.
Neutral
78
-
4,322
7,892
8,842
8.3
9.1
2.4
5.3
32.4
14.7
1.3
1.2
4.2
8.6
0.8
0.7
PNC Infratech
Neutral
527
-
2,704
1,798
2,132
13.2
13.5
22.0
30.0
24.0
17.6
2.2
1.9
11.5
11.4
1.6
1.4
Simplex Infra
Neutral
323
-
1,600
6,241
7,008
10.4
10.7
20.0
36.0
16.2
9.0
1.3
1.2
6.8
11.1
0.8
0.7
Financials
Allahabad Bank
Neutral
76
-
4,543
8,332
9,259
2.8
2.8
21.0
25.6
3.6
3.0
0.4
0.3
9.8
10.9
-
-
Axis Bank
Buy
475
630
113,031
26,473
31,527
3.5
3.6
35.7
43.5
13.3
10.9
2.6
2.2
17.9
18.9
-
-
Bank of Baroda
Neutral
162
-
37,293
19,105
21,474
2.0
2.0
19.1
24.8
8.5
6.5
0.9
0.8
10.2
12.1
-
-
Bank of India
Neutral
133
-
10,544
15,972
17,271
1.9
2.0
15.3
33.4
8.7
4.0
0.4
0.3
3.6
7.6
-
-
Canara Bank
Neutral
279
-
15,174
15,251
16,725
2.0
2.0
59.3
68.6
4.7
4.1
0.5
0.5
10.1
10.7
-
-
Dena Bank
Neutral
41
-
2,323
3,440
3,840
2.1
2.3
7.3
10.0
5.7
4.1
0.4
0.4
6.1
7.9
-
-
Federal Bank
Neutral
55
-
9,466
3,477
3,999
3.0
3.0
5.0
6.2
11.0
8.8
1.1
1.0
10.6
11.9
-
-
HDFC
Neutral
1,221
-
192,603
10,358
11,852
3.3
3.3
41.1
47.0
29.7
26.0
5.7
5.1
24.7
24.9
-
-
HDFC Bank
Buy
1,084
1,262
273,022
38,309
47,302
4.3
4.3
49.3
61.1
22.0
17.8
3.8
3.3
18.5
19.7
-
-
Stock Watch
November 04, 2015
Company Name
Reco
CMP
Target
Mkt Cap
Sales ( Čcr )
OPM(%)
EPS (Č)
PER(x)
P/BV(x)
RoE(%)
EV/Sales(x)
(Č)
Price ( Č)
( Č cr )
FY16E
FY17E
FY16E
FY17E
FY16E
FY17E
FY16E
FY17E
FY16E
FY17E
FY16E
FY17E
FY16E
FY17E
Financials
ICICI Bank
Buy
279
348
162,121
35,168
40,517
3.4
3.4
21.4
25.2
13.1
11.1
2.2
1.9
14.7
15.2
-
-
IDBI Bank
Neutral
85
-
13,569
9,625
10,455
1.8
1.8
8.5
14.2
9.9
6.0
0.6
0.6
5.9
9.3
-
-
Indian Bank
Neutral
129
-
6,189
6,160
6,858
2.5
2.5
24.5
29.8
5.3
4.3
0.4
0.4
7.7
8.6
-
-
LIC Housing Finance
Buy
481
571
24,294
3,101
3,745
2.5
2.5
33.0
40.2
14.6
12.0
2.7
2.3
19.7
20.5
-
-
Oriental Bank
Neutral
143
-
4,291
7,643
8,373
2.4
2.4
37.2
45.4
3.8
3.2
0.3
0.3
8.2
9.4
-
-
Punjab Natl.Bank
Neutral
130
-
25,576
23,638
26,557
2.8
2.8
17.9
27.2
7.3
4.8
0.7
0.6
8.5
12.0
-
-
South Ind.Bank
Neutral
20
-
2,754
1,965
2,185
2.5
2.5
2.5
3.3
8.2
6.2
0.8
0.7
9.5
11.7
-
-
St Bk of India
Buy
236
295
183,357
82,520
93,299
2.7
2.8
20.0
24.5
11.8
9.7
1.3
1.1
11.5
12.8
-
-
Union Bank
Neutral
159
-
10,896
12,646
14,129
2.3
2.4
31.0
39.1
5.1
4.1
0.6
0.5
9.8
11.4
-
-
Vijaya Bank
Neutral
36
-
3,050
3,536
3,827
1.9
1.9
5.5
6.7
6.4
5.3
0.5
0.5
7.8
8.8
-
-
Yes Bank
Buy
779
914
32,626
7,228
9,043
3.2
3.3
57.7
69.4
13.5
11.2
2.4
2.1
19.1
19.6
-
-
FMCG
Asian Paints
Neutral
816
-
78,223
16,553
19,160
16.0
16.2
17.7
21.5
46.1
37.9
12.2
11.0
29.4
31.2
4.6
3.9
Britannia
Neutral
3,177
-
38,112
8,065
9,395
9.6
10.2
47.2
65.5
67.3
48.5
22.4
21.1
38.3
41.2
4.6
3.9
Colgate
Neutral
949
-
25,817
4,836
5,490
19.5
19.7
48.5
53.2
19.6
17.8
14.3
12.5
99.8
97.5
5.2
4.6
Dabur India
Neutral
270
-
47,443
9,370
10,265
17.1
17.2
7.3
8.1
36.8
33.3
11.1
9.0
33.7
30.6
5.0
4.5
GlaxoSmith Con*
Neutral
5,967
-
25,092
4,919
5,742
17.2
17.4
168.3
191.2
35.5
31.2
10.1
8.6
28.8
28.9
4.7
4.0
Godrej Consumer
Neutral
1,283
-
43,685
10,168
12,886
16.1
16.1
32.1
38.4
40.0
33.4
8.1
7.5
19.7
21.0
4.4
3.5
HUL
Neutral
804
-
173,943
34,940
38,957
17.5
17.7
20.8
24.7
38.6
32.5
43.0
34.4
110.5
114.2
4.8
4.3
ITC
Buy
335
409
268,607
41,068
45,068
37.8
37.4
13.9
15.9
24.0
21.1
8.1
7.1
34.1
33.8
6.2
5.6
Marico
Neutral
391
-
25,210
6,551
7,766
15.7
16.0
10.4
12.5
37.7
31.3
10.9
9.1
33.2
32.4
3.8
3.2
Nestle*
Accumulate
6,234
6,646
60,109
11,291
12,847
22.2
22.3
158.9
184.6
39.2
33.8
20.5
18.4
55.0
57.3
5.2
4.5
Tata Global
Accumulate
132
144
8,299
8,635
9,072
9.8
9.9
6.5
7.6
20.3
17.3
2.0
1.9
6.8
7.4
0.9
0.9
IT
HCL Tech^
Buy
876
1,132
123,114
42,038
47,503
23.2
23.5
55.8
62.9
15.7
13.9
3.6
2.8
23.0
19.8
2.5
2.0
Infosys
Accumulate
1,143
1,306
262,541
60,250
66,999
28.0
28.0
58.3
63.7
19.6
17.9
4.1
3.5
20.9
19.7
3.7
3.1
TCS
Buy
2,543
3,165
501,001
111,274
126,852
28.4
28.7
125.4
143.9
20.3
17.7
8.0
7.4
39.9
42.2
4.1
3.6
Tech Mahindra
Buy
557
646
53,600
25,566
28,890
16.0
17.0
26.3
31.9
21.2
17.5
3.8
3.2
17.9
18.6
1.9
1.6
Wipro
Buy
574
719
141,834
52,414
58,704
23.7
23.8
38.4
42.3
15.0
13.6
2.9
2.6
19.5
18.0
2.3
1.9
Media
D B Corp
Accumulate
319
356
5,859
2,241
2,495
27.8
27.9
21.8
25.6
14.7
12.5
3.8
3.4
26.7
28.5
2.6
2.3
HT Media
Neutral
81
-
1,896
2,495
2,603
11.2
11.2
7.3
8.6
11.2
9.5
0.9
0.8
7.4
8.1
0.3
0.2
Stock Watch
November 04, 2015
Company Name
Reco
CMP
Target
Mkt Cap
Sales ( Čcr )
OPM(%)
EPS (Č)
PER(x)
P/BV(x)
RoE(%)
EV/Sales(x)
(Č)
Price ( Č)
( Č cr )
FY16E FY17E
FY16E
FY17E
FY16E
FY17E
FY16E
FY17E
FY16E
FY17E
FY16E
FY17E
FY16E
FY17E
Media
Jagran Prakashan
Buy
142
164
4,652
2,170
2,355
27.0
27.6
12.8
10.3
11.1
13.8
3.1
2.9
21.8
19.4
1.9
1.6
Sun TV Network
Neutral
383
-
15,076
2,779
3,196
70.2
70.5
22.8
27.3
16.8
14.0
4.1
3.7
26.7
28.3
5.2
4.5
Hindustan Media
Neutral
275
-
2,017
920
1,031
20.0
20.0
19.2
20.9
14.3
13.2
2.4
2.0
16.4
15.3
1.7
1.5
Ventures
Metals & Mining
Coal India
Buy
326
400
205,724
77,508
85,330
21.4
23.7
24.8
27.6
13.1
11.8
5.0
4.8
38.6
41.6
2.0
1.8
Hind. Zinc
Accumulate
158
175
66,654
14,641
14,026
50.4
50.4
17.7
16.0
8.9
9.9
1.4
1.3
16.2
13.2
2.2
2.0
Hindalco
Neutral
82
-
16,985
104,356
111,186
8.7
9.5
6.7
11.1
12.2
7.4
0.4
0.4
3.5
5.9
0.7
0.6
JSW Steel
Neutral
895
-
21,645
42,308
45,147
16.4
20.7
(10.3)
49.5
18.1
1.0
1.0
(1.0)
5.6
1.6
1.5
NMDC
Neutral
95
-
37,625
8,237
10,893
46.6
44.5
10.0
11.7
9.5
8.1
1.1
0.9
12.5
13.0
4.4
3.3
SAIL
Neutral
51
-
21,084
45,915
53,954
7.2
10.5
1.5
4.4
33.9
11.7
0.5
0.5
2.3
4.1
1.1
1.0
Vedanta
Neutral
98
-
29,143
71,445
81,910
26.2
26.3
12.9
19.2
7.6
5.1
0.5
0.5
7.2
8.9
0.9
0.7
Tata Steel
Neutral
236
-
22,926
126,760
137,307
8.9
11.3
6.4
23.1
37.1
10.2
0.7
0.7
2.0
7.1
0.8
0.7
Oil & Gas
Cairn India
Neutral
155
-
29,098
11,323
12,490
49.4
51.0
20.7
20.7
7.5
7.5
0.5
0.5
6.4
6.1
1.6
1.0
GAIL
Neutral
307
-
38,999
64,856
70,933
9.1
9.6
24.0
28.9
12.8
10.7
1.1
1.0
8.8
9.6
0.8
0.7
ONGC
Neutral
251
-
214,957
154,564
167,321
36.8
37.4
28.6
32.5
8.8
7.7
1.1
1.0
12.7
13.5
1.6
1.5
Petronet LNG
Neutral
201
-
15,098
29,691
31,188
5.8
6.2
12.8
13.4
15.8
15.0
2.4
2.1
15.8
14.8
0.6
0.5
Indian Oil Corp
Accumulate
401
455
97,470
359,607
402,760
5.9
6.1
42.5
48.7
9.5
8.2
1.3
1.1
14.1
14.4
0.4
0.3
Reliance Industries
Accumulate
966
1,050
312,962
304,775
344,392
12.6
13.4
91.3
102.6
10.6
9.4
1.2
1.1
11.8
12.0
1.0
0.8
Pharmaceuticals
Alembic Pharma
Neutral
675
-
12,716
2,601
3,115
21.2
20.2
20.8
23.9
32.4
28.2
10.4
7.9
37.2
31.8
4.9
4.0
Aurobindo Pharma
Neutral
841
-
49,100
14,923
17,162
23.0
23.0
38.2
43.6
22.0
19.3
6.8
5.1
36.0
30.2
3.6
3.1
Aventis*
Neutral
4,348
-
10,013
2,082
2,371
17.4
20.8
118.2
151.5
36.8
28.7
5.4
4.3
19.9
25.5
4.5
3.7
Cadila Healthcare
Neutral
423
-
43,258
10,224
11,840
21.0
22.0
14.6
17.6
28.9
24.0
7.9
6.2
30.8
29.0
4.3
3.6
Cipla
Neutral
675
-
54,234
14,359
16,884
21.3
19.7
28.4
30.5
23.8
22.1
4.2
3.6
19.3
17.5
3.8
3.1
Dr Reddy's
Neutral
4,325
-
73,756
18,213
21,214
22.6
22.7
163.0
192.5
26.5
22.5
5.5
4.5
22.5
20.0
4.0
3.4
Dishman Pharma
Neutral
410
-
3,312
1,716
1,888
20.2
20.2
16.3
21.6
25.2
19.0
2.4
2.1
9.7
11.7
2.1
1.8
GSK Pharma*
Neutral
3,231
-
27,366
2,870
3,158
20.0
22.1
59.5
68.3
54.3
47.3
16.0
16.5
28.5
34.3
9.0
8.3
Indoco Remedies
Neutral
324
-
2,985
1,088
1,262
18.2
18.2
13.1
15.5
24.7
20.9
4.8
4.0
21.2
21.1
2.8
2.4
Ipca labs
Buy
755
900
9,530
3,363
3,909
12.9
18.6
13.4
28.0
56.4
27.0
7.4
5.9
7.4
14.0
3.1
2.7
Lupin
Neutral
1,874
-
84,346
14,864
17,244
26.9
26.9
62.1
71.1
30.2
26.4
7.3
5.8
27.4
24.6
5.4
4.5
Sun Pharma
Accumulate
868
950
208,951
28,163
32,610
25.8
30.7
17.4
26.9
49.9
32.3
4.7
4.1
13.0
16.6
6.9
5.7
Stock Watch
November 04, 2015
Company Name
Reco
CMP
Target
Mkt Cap
Sales ( Čcr )
OPM(%)
EPS (Č)
PER(x)
P/BV(x)
RoE(%)
EV/Sales(x)
(Č)
Price ( Č)
( Č cr )
FY16E FY17E
FY16E
FY17E
FY16E
FY17E
FY16E
FY17E
FY16E
FY17E
FY16E
FY17E
FY16E
FY17E
Power
Tata Power
Neutral
69
-
18,635
35,923
37,402
22.6
22.8
4.1
5.2
17.0
13.4
1.3
1.2
7.5
9.3
1.5
1.4
NTPC
Buy
136
157
111,850
87,064
98,846
23.5
23.5
11.7
13.2
11.6
10.3
1.3
1.2
11.4
12.1
2.3
2.1
Power Grid
Buy
131
170
68,769
20,702
23,361
86.7
86.4
12.1
13.2
10.9
10.0
1.6
1.4
15.6
15.1
8.2
7.7
Telecom
Bharti Airtel
Neutral
347
-
138,650
101,748
109,191
32.1
31.7
12.0
12.5
28.9
27.8
2.0
1.9
6.9
6.7
2.0
1.8
Idea Cellular
Neutral
139
-
50,125
34,282
36,941
32.0
31.5
5.9
6.2
23.6
22.5
2.2
2.0
9.9
9.3
2.0
1.9
zOthers
Abbott India
Neutral
5,429
-
11,536
2,715
3,153
14.5
14.1
134.3
152.2
40.4
35.7
10.1
8.3
27.4
25.6
4.0
3.4
Bajaj Electricals
Buy
250
341
2,525
4,719
5,287
5.2
5.8
8.6
12.7
29.2
19.8
3.3
2.9
11.4
14.8
0.5
0.5
Finolex Cables
Neutral
249
-
3,814
2,728
3,036
10.8
11.0
14.4
16.8
17.3
14.9
2.6
2.3
15.2
15.3
1.1
1.0
Goodyear India*
Accumulate
580
655
1,338
1,953
1,766
12.4
12.0
67.4
59.6
8.6
9.7
2.1
1.8
27.7
20.2
0.5
0.4
Hitachi
Neutral
1,339
-
3,641
1,779
2,081
7.8
8.8
21.8
33.4
61.4
40.1
9.9
8.0
17.4
22.1
2.1
1.8
Jyothy Laboratories
Neutral
304
-
5,507
1,620
1,847
11.5
11.5
7.3
8.5
41.7
35.9
5.4
5.0
13.3
14.4
3.3
2.8
MRF
Accumulate
39,710
45,575
16,842
20,316
14,488
21.4
21.1
5,488.0
3,798.0
7.2
10.5
2.5
2.0
41.1
21.2
0.8
1.0
Page Industries
Neutral
13,822
-
15,417
1,929
2,450
19.8
20.1
229.9
299.0
60.1
46.2
26.5
18.4
52.1
47.1
8.0
6.3
Relaxo Footwears
Neutral
524
-
6,285
1,767
2,152
12.3
12.5
19.3
25.1
27.2
20.9
6.7
5.1
27.7
27.8
3.6
2.9
Siyaram Silk Mills
Buy
916
1,145
858
1,636
1,815
11.5
11.5
89.9
104.1
10.2
8.8
1.7
1.5
17.9
17.8
0.7
0.6
Styrolution ABS India*
Neutral
800
-
1,407
1,271
1,440
8.6
9.2
32.0
41.1
25.0
19.5
2.6
2.3
10.7
12.4
1.1
0.9
Tree House
Buy
278
347
1,175
259
324
56.8
56.8
17.0
21.7
16.3
12.8
1.6
1.5
10.1
11.5
4.5
3.7
TVS Srichakra
Accumulate
2,833
3,210
2,169
2,127
2,388
15.2
14.9
237.7
267.5
11.9
10.6
5.1
3.6
51.7
39.8
1.1
0.9
HSIL
Accumulate
278
302
2,011
2,182
2,404
16.3
16.5
15.8
18.9
17.6
14.7
1.4
1.3
8.4
9.4
1.3
1.1
Kirloskar Engines India
Neutral
263
-
3,798
2,634
3,252
10.1
12.0
10.9
17.4
24.1
15.1
2.7
2.4
11.4
16.8
1.1
0.8
Ltd
M M Forgings
Buy
524
670
632
541
634
21.7
21.4
47.8
55.9
11.0
9.4
2.2
1.8
21.8
20.9
1.3
1.1
Banco Products (India)
Neutral
130
-
929
1,208
1,353
11.0
12.3
10.8
14.5
12.1
9.0
1.4
1.2
11.9
14.5
0.7
0.6
Competent Automobiles Neutral
143
-
88
1,007
1,114
3.1
3.1
23.7
28.2
6.0
5.1
0.8
0.7
13.9
14.6
0.1
0.1
Nilkamal
Neutral
1,172
-
1,749
1,948
2,147
10.6
10.3
60.0
67.0
19.5
17.5
3.1
2.6
16.8
16.1
1.0
0.8
Visaka Industries
Buy
132
166
210
1,158
1,272
8.6
9.5
23.7
32.7
5.6
4.0
0.6
0.5
10.1
12.5
0.4
0.3
Transport Corporation of
Neutral
279
-
2,119
2,830
3,350
8.8
9.0
14.4
18.3
19.4
15.2
3.0
2.6
15.4
17.1
0.9
0.8
India
Elecon Engineering
Neutral
83
-
904
1,452
1,596
14.0
14.7
4.4
6.2
18.8
13.3
1.6
1.4
8.6
11.2
0.9
0.8
Surya Roshni
Buy
133
183
583
2,992
3,223
8.3
8.5
14.7
18.3
9.1
7.3
0.8
0.8
9.7
11.0
0.5
0.4
MT Educare
Buy
140
169
556
286
366
18.3
17.7
7.7
9.4
18.1
14.9
3.8
3.3
20.2
21.1
1.8
1.4
Stock Watch
November 04, 2015
Company Name
Reco
CMP
Target Mkt Cap
Sales ( Čcr )
OPM(%)
EPS (Č)
PER(x)
P/BV(x)
RoE(%)
EV/Sales(x)
(Č)
Price ( Č)
( Č cr )
FY16E FY17E FY16E FY17E FY16E FY17E FY16E FY17E FY16E FY17E FY16E FY17E FY16E FY17E
zOthers
Radico Khaitan
Accumulate
109
119
1,448
1,565
1,687
11.9
12.4
5.4
6.6
20.1
16.5
1.6
1.5
8.0
9.0
1.4
1.4
Garware Wall Ropes
Accumulate
358
390
784
875
983
10.4
10.6
23.1
27.8
15.5
12.9
2.2
1.9
14.1
14.8
0.9
0.8
Wonderla Holidays
Neutral
329
-
1,861
206
308
44.0
43.6
9.0
12.9
36.6
25.5
5.0
4.5
13.7
17.8
8.9
5.9
Linc Pen & Plastics
Accumulate
162
185
239
340
371
8.3
8.9
10.8
13.2
15.0
12.2
2.4
2.1
16.0
17.1
0.7
0.7
The Byke Hospitality
Buy
156
181
626
222
287
20.5
20.5
5.6
7.6
27.7
20.7
5.2
4.3
18.9
20.8
2.9
2.2
Source: Company, Angel Research; Note: *December year end; #September year end; &October year end; Price as on November 03, 2015
Market Outlook
November 04, 2015
Research Team Tel: 022 - 39357800
DISCLAIMER
Angel Broking Private Limited (hereinafter referred to as “Angel”) is a registered Member of National Stock Exchange of India Limited,
Bombay Stock Exchange Limited and Metropolitian Stock Exchange of India Limited. It is also registered as a Depository Participant with
CDSL and Portfolio Manager with SEBI. It also has registration with AMFI as a Mutual Fund Distributor. Angel Broking Private Limited is a
registered entity with SEBI for Research Analyst in terms of SEBI (Research Analyst) Regulations, 2014 vide registration number
INH000000164. Angel or its associates has not been debarred/ suspended by SEBI or any other regulatory authority for accessing
/dealing in securities Market. Angel or its associates including its relatives/analyst do not hold any financial interest/beneficial ownership
of more than 1% in the company covered by Analyst. Angel or its associates/analyst has not received any compensation / managed or co
-managed public offering of securities of the company covered by Analyst during the past twelve months. Angel/analyst has not served as
an officer, director or employee of company covered by Analyst and has not been engaged in market making activity of the company
covered by Analyst.
This document is solely for the personal information of the recipient, and must not be singularly used as the basis of any investment
decision. Nothing in this document should be construed as investment or financial advice. Each recipient of this document should make
such investigations as they deem necessary to arrive at an independent evaluation of an investment in the securities of the companies
referred to in this document (including the merits and risks involved), and should consult their own advisors to determine the merits and
risks of such an investment.
Reports based on technical and derivative analysis center on studying charts of a stock's price movement, outstanding positions and
trading volume, as opposed to focusing on a company's fundamentals and, as such, may not match with a report on a company's
fundamentals.
The information in this document has been printed on the basis of publicly available information, internal data and other reliable sources
believed to be true, but we do not represent that it is accurate or complete and it should not be relied on as such, as this document is for
general guidance only. Angel Broking Pvt. Limited or any of its affiliates/ group companies shall not be in any way responsible for any
loss or damage that may arise to any person from any inadvertent error in the information contained in this report. Angel Broking Pvt.
Limited has not independently verified all the information contained within this document. Accordingly, we cannot testify, nor make any
representation or warranty, express or implied, to the accuracy, contents or data contained within this document. While Angel Broking
Pvt. Limited endeavors to update on a reasonable basis the information discussed in this material, there may be regulatory, compliance,
or other reasons that prevent us from doing so.
This document is being supplied to you solely for your information, and its contents, information or data may not be reproduced,
redistributed or passed on, directly or indirectly.
Neither Angel Broking Pvt. Limited, nor its directors, employees or affiliates shall be liable for any loss or damage that may arise from or
in connection with the use of this information.
Note: Please refer to the important ‘Stock Holding Disclosure' report on the Angel website (Research Section). Also, please refer to the
latest update on respective stocks for the disclosure status in respect of those stocks. Angel Broking Pvt. Limited and its affiliates may have
investment positions in the stocks recommended in this report.