Market Outlook
September 4, 2015
Dealer’s Diary
Domestic Indices
Chg (%)
(Pts)
(Close)
BSE Sensex
1.2
311
25,765
Indian markets are expected to open flat tracking the SGX Nifty and global cues.
Nifty
1.4
106
7,823
US markets closed lackluster as traders looked ahead to the release of the Labor
MID CAP
1.2
123
10,560
Department's closely watched monthly jobs report on Friday for signs whether the
SMALL CAP
1.2
124
10,874
Federal Reserve will raise interest rates at its meeting later this month.
BSE HC
0.1
15
17,561
European markets ended firmly in the positive after ECB President Mario Draghi’s
BSE PSU
1.2
76
6,647
dovish comments hinting the central bank may consider further stimulus measures.
BANKEX
1.9
359
18,940
Indian markets closed the day in the green led by positive global cues and value
AUTO
1.3
229
17,383
buying at lower levels.
METAL
2.4
173
7,281
OIL & GAS
0.9
81
8,662
News & Result Analysis
BSE IT
0.4
49
11,233
Lupin launches Duloxetine 40mg Delayed-Release Capsules
Global Indices
Chg (%)
(Pts)
(Close)
Refer detailed news analysis on the following page
Dow Jones
0.1
23
16,375
Markets Today
NASDAQ
(0.4)
(16.5)
4,734
The trend deciding level for the day is 25,719 / 7,808 levels. If NIFTY trades above
FTSE
1.8
111
6,194
this level during the first half-an-hour of trade then we may witness a further rally up
Nikkei
0.5
87
18,182
to 25,882 - 25,998 / 7,861 - 7,899 levels. However, if NIFTY trades below
Hang Sang
(1.2)
(250)
20,935
25,719 / 7,808 levels for the first half-an-hour of trade then it may correct towards
Straits Times
1.0
28
2,906
25,602 - 25,439 / 7,770 - 7,716 levels.
Shanghai Com
(0.2)
(6)
3,160
Indices
S2
S1
PIVOT
R1
R2
SENSEX
25,439
25,602
25,719
25,882
25,998
Indian ADR
Chg (%)
(Pts)
(Close)
NIFTY
7,716
7,770
7,808
7,861
7,899
INFY
0.6
0.1
$17.6
WIT
2.4
0.3
$12.0
Net Inflows (September 02, 2015)
IBN
(0.7)
(0.1)
$8.5
` cr
Purch
Sales
Net
MTD
YTD
HDB
0.4
0.2
$57.4
FII
4,565
6,090
(1,525)
(2,206)
1,21,555
MFs
1,279
980
299
299
70,947
Advances / Declines
BSE
NSE
Advances
1,744
1,087
FII Derivatives (September 03, 2015)
Declines
979
400
` cr
Purch
Sales
Net
Open Interest
Unchanged
111
61
Index Futures
1,735
1,277
459
20,646
Stock Futures
2,323
2,003
321
44,520
Volumes (` cr)
BSE
2,363
Gainers / Losers
Gainer
Loser
NSE
15,060
Company
Price (`)
chg (%)
Company
Price (`)
chg (%)
DLF
121
10.1
AMTEKAUTO
32
(34.8)
UBL
74
7.0
KSCL
447
(6.0)
IBREALEST
65
6.7
SUNASIAN
191
(5.0)
OBEROIRLTY
224
6.7
CONCOR
1,397
(4.5)
BALRAMCHIN
45
6.4
OFSS
3,917
(3.8)
Market Outlook
September 4, 2015
Lupin launches Duloxetine
40mg Delayed-Release Capsules
(Generic Cymbalta®)
Lupin announced that its subsidiary Lupin Pharmaceuticals, Inc. (Lupin) has
launched its Duloxetine 40 mg Delayed-Release (DR) Capsule, which is the first
and only generic Duloxetine formulation to become available in 40 mg dosage
strength. Lupin is the only generic manufacturer to offer all Duloxetine dosage
strengths - the 20 mg, 30 mg, 60 mg, and now the newest 40 mg.
Lupin’s generic Duloxetine 40 mg DR capsules are therefore the first and only
capsule available for patients in this dosage strength. Cymbalta® Delayed-Release
Capsules 20 mg, 30 mg and 60 mg strengths had annual U.S sales of
approximately US$1.05bn (Brand + Generics - IMS MAT June 2015). Given the
high competition (almost 12-13 players) for the product, we believe that the
product will not significantly contribute to the overall sales & profitability of the
company. We remain neutral on the stock.
Economic and Political News
Corporate bond private placement hits 4 month high at `46,000cr
Decline in exports "pulled down" GDP growth by 3%: FIEO
India loses `2 trillion annually to corrosion of infrastructure: Government
Corporate News
Cipla set to buy American business of Hetero Drugs for $550 million
IL&FS Trust acquires 9.97% in Max India through pledging
JCHAC to acquire 72 per cent of Hitachi Home and Life Solution (India)
National Buildings Construction Corporation bags `387cr worth contracts in
August
Market Outlook
September 4, 2015
Top Picks
Large Cap
Market Cap
CMP
Target
Upside
Company
Sector
Rating
(` Cr)
(`)
(`)
(%)
Axis Bank
Financials
1,15,595
Buy
486
704
44.7
ICICI Bank
Financials
1,54,920
Buy
267
373
39.8
Infosys
IT
2,52,813
Buy
1,101
1,306
18.7
Inox Wind
Capital Goods
8,484
Buy
382
505
32.1
LIC HFL
Financials
21,360
Buy
423
570
34.7
Power Grid
Power
66,755
Buy
128
170
33.2
TCS
IT
5,10,298
Buy
2,605
3,168
21.6
Tech Mahindra IT
51,942
Buy
540
646
19.6
Yes Bank
Financials
28,088
Buy
671
951
41.7
Source: Angel Research, Bloomberg
Mid Cap
Market Cap
CMP
Target
Upside
Company
Sector
Rating
(` Cr)
(`)
(`)
(%)
Bajaj Electricals
Others
2,498
Buy
248
341
37.6
Garware Wall RopesOthers
643
Buy
294
390
32.7
HMVL
Media
1,614
Buy
220
292
32.8
JK Tyre
Auto Ancillary
2,400
Buy
106
129
21.9
MBL Infra
Construction
976
Buy
235
360
52.9
Minda Industries
Auto Ancillary
825
Buy
520
652
25.4
MT Educare
Others
523
Buy
131
169
28.7
Radico Khaitan
Others
1,155
Buy
87
112
29.0
Surya Roshni
Others
538
Buy
123
183
49.0
Source: Angel Research, Bloomberg
Market Outlook
September 04, 2015
Global economic events release calendar
Date
Time
Country Event Description
Unit
Period
Bloomberg Data
Last Reported Estimated
September 4, 2015
6:00PM
US
Change in Nonfarm payrolls
Thousands
Aug
215.00
218.00
6:00PM
US
Unnemployment rate
%
Aug
5.30
5.20
September 8, 2015
2:30PM
Euro Zone Euro-Zone GDP s.a. (QoQ)
% Change
2Q P
0.30
0.30
China
Exports YoY%
% Change
Aug
(8.30)
(6.10)
September 9, 2015
2:00PM
UK
Industrial Production (YoY)
% Change
Jul
1.50
1.50
September 10, 2015
India
Imports YoY%
% Change
Aug
(10.28)
--
India
Exports YoY%
% Change
Aug
(10.30)
--
7:00AM
China
Consumer Price Index (YoY)
% Change
Aug
1.60
1.90
4:30PM
UK
BOE Announces rates
% Ratio
Sep 10
0.50
0.50
September 11, 2015
5:30PM
India
Industrial Production YoY
% Change
Jul
3.80
--
September 13, 2015
11:00AM
China
Industrial Production (YoY)
% Change
Aug
6.00
6.30
September 14, 2015
12:00PM
India
Monthly Wholesale Prices YoY%
% Change
Aug
(4.05)
--
September 15, 2015
6:45PM
US
Industrial Production
%
Aug
0.56
--
2:00PM
UK
CPI (YoY)
% Change
Aug
0.10
--
September 16, 2015
2:00PM
UK
Jobless claims change
% Change
Aug
(4.90)
--
2:30PM
Euro Zone Euro-Zone CPI (YoY)
%
Aug F
0.20
--
6:00PM
US
Consumer price index (mom)
% Change
Aug
0.10
--
September 17, 2015
6:00PM
US
Building permits
Thousands
Aug
1,130.00
--
6:00PM
US
Housing Starts
Thousands
Aug
1,206.00
--
11:30PM
US
FOMC rate decision
%
Sep 17
0.25
0.50
September 21, 2015
7:30PM
US
Existing home sales
Million
Aug
5.59
--
September 22, 2015
7:30PM
Euro Zone Euro-Zone Consumer Confidence
Value
Sep A
(6.90)
--
September 23, 2015
1:00PM
Germany PMI Manufacturing
Value
Sep P
53.30
--
September 24, 2015
7:30PM
US
New home sales
Thousands
Aug
507.00
--
September 25, 2015
6:00PM
US
GDP Qoq (Annualised)
% Change
2Q T
3.70
--
September 29, 2015
7:30PM
US
Consumer Confidence
S.A./ 1985=100
Sep
101.54
--
11:00AM
India
RBI Reverse Repo rate
%
Sep 29
6.25
--
11:00AM
India
RBI Repo rate
%
Sep 29
7.25
--
11:00AM
India
RBI Cash Reserve ratio
%
Sep 29
4.00
--
September 30, 2015
1:25PM
Germany Unemployment change (000's)
Thousands
Sep
(7.00)
--
2:00PM
UK
GDP (YoY)
% Change
2Q F
2.60
--
Source: Bloomberg, Angel Research
Market Outlook
September 4, 2015
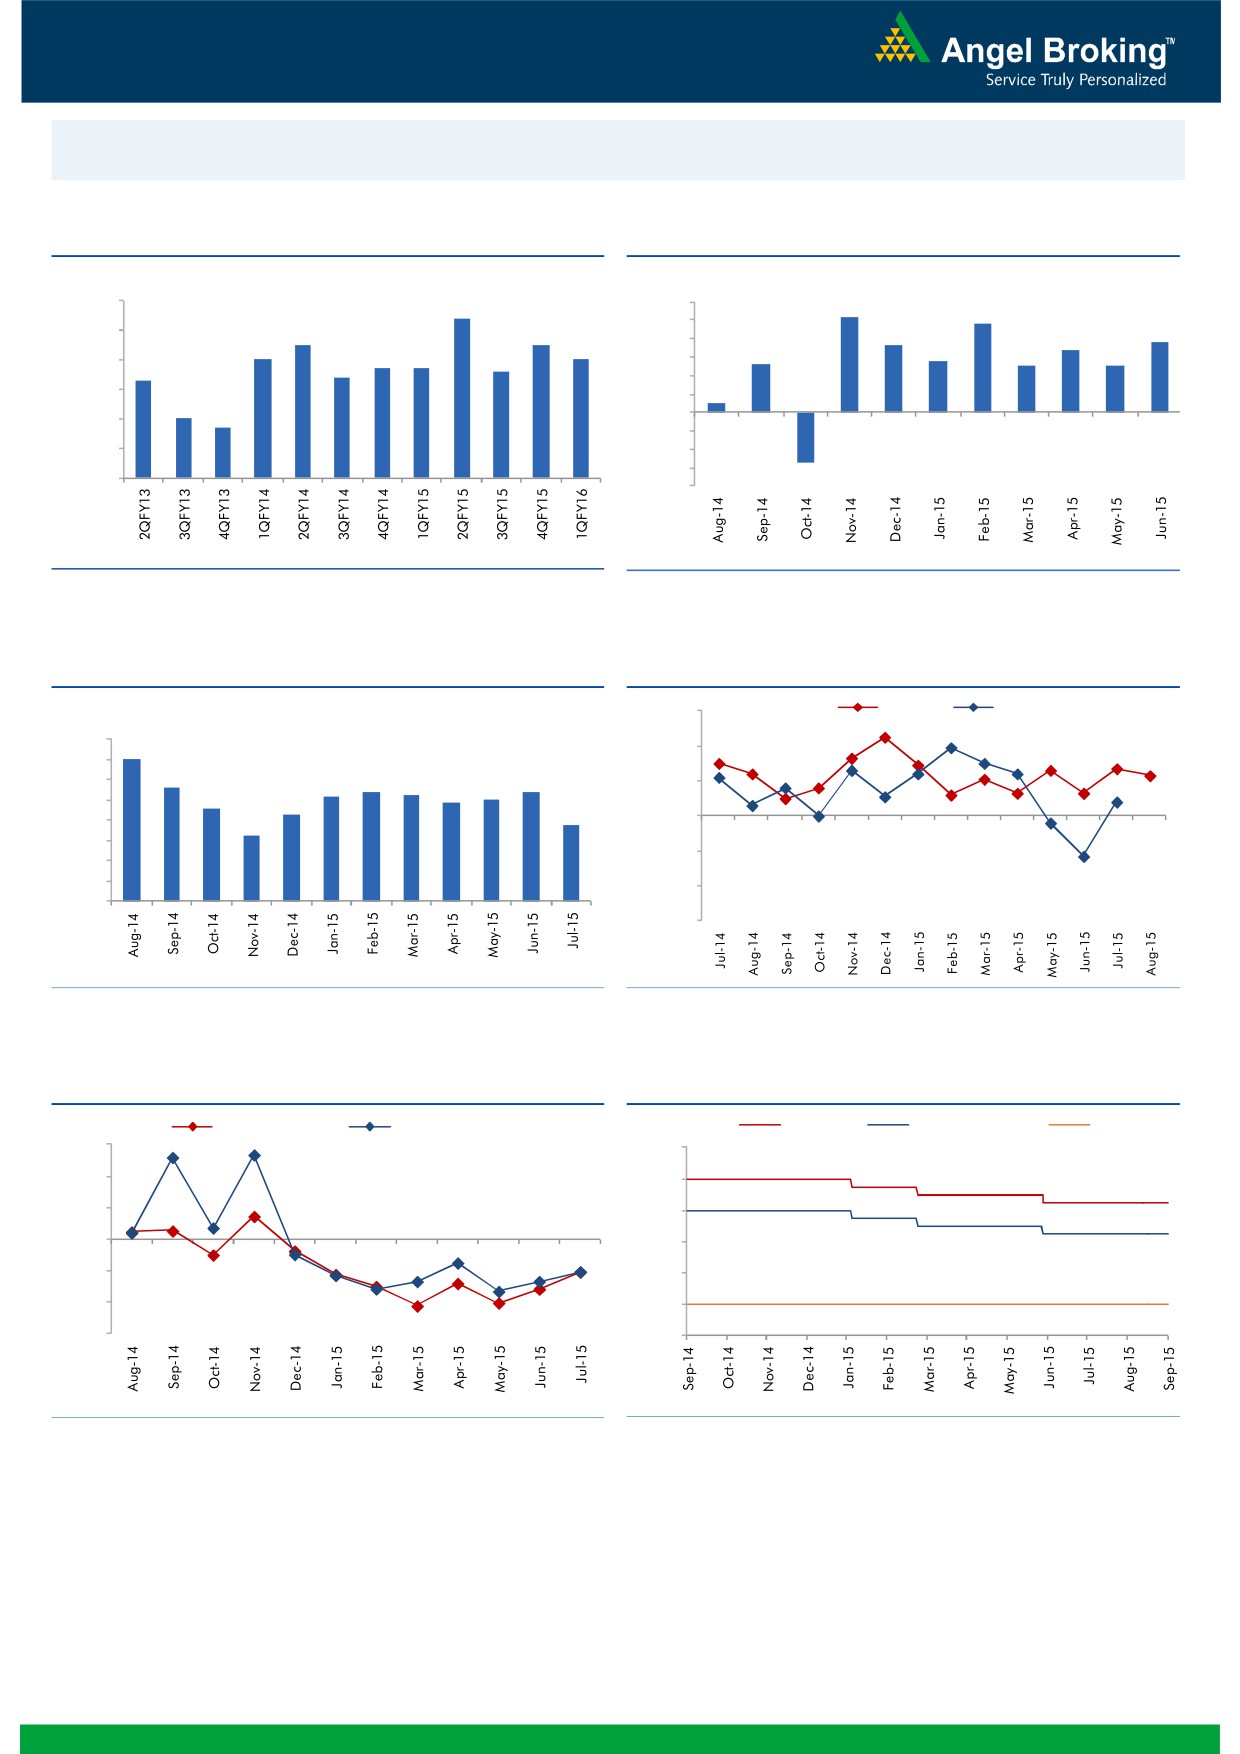
Macro watch
Exhibit 1: Quarterly GDP trends
Exhibit 2: IIP trends
(%)
(%)
9.0
8.4
6.0
5.2
4.8
7.5
7.5
5.0
3.8
8.0
3.6
3.4
7.0
7.0
4.0
2.8
6.7
6.7
2.6
2.5
2.5
7.0
6.3
6.4
6.6
3.0
2.0
6.0
0.5
1.0
5.0
4.7
-
5.0
(1.0)
4.0
(2.0)
(3.0)
3.0
(2.7)
(4.0)
Source: CSO, Angel Research
Source: MOSPI, Angel Research
Exhibit 3: Monthly CPI inflation trends
Exhibit 4: Manufacturing and services PMI
(%)
56.0
Mfg. PMI
Services PMI
8.0
7.0
54.0
7.0
5.6
5.4
6.0
5.2
5.4
5.3
5.0
52.0
4.6
4.9
5.0
4.3
3.8
4.0
3.3
50.0
3.0
48.0
2.0
1.0
46.0
-
44.0
Source: MOSPI, Angel Research
Source: Market, Angel Research; Note: Level above 50 indicates expansion
Exhibit 5: Exports and imports growth trends
Exhibit 6: Key policy rates
(%)
Exports yoy growth
Imports yoy growth
(%)
Repo rate
Reverse Repo rate
CRR
30.0
9.00
20.0
8.00
10.0
7.00
0.0
6.00
(10.0)
5.00
(20.0)
4.00
(30.0)
3.00
Source: Bloomberg, Angel Research
Source: RBI, Angel Research
Market Outlook
September 4, 2015
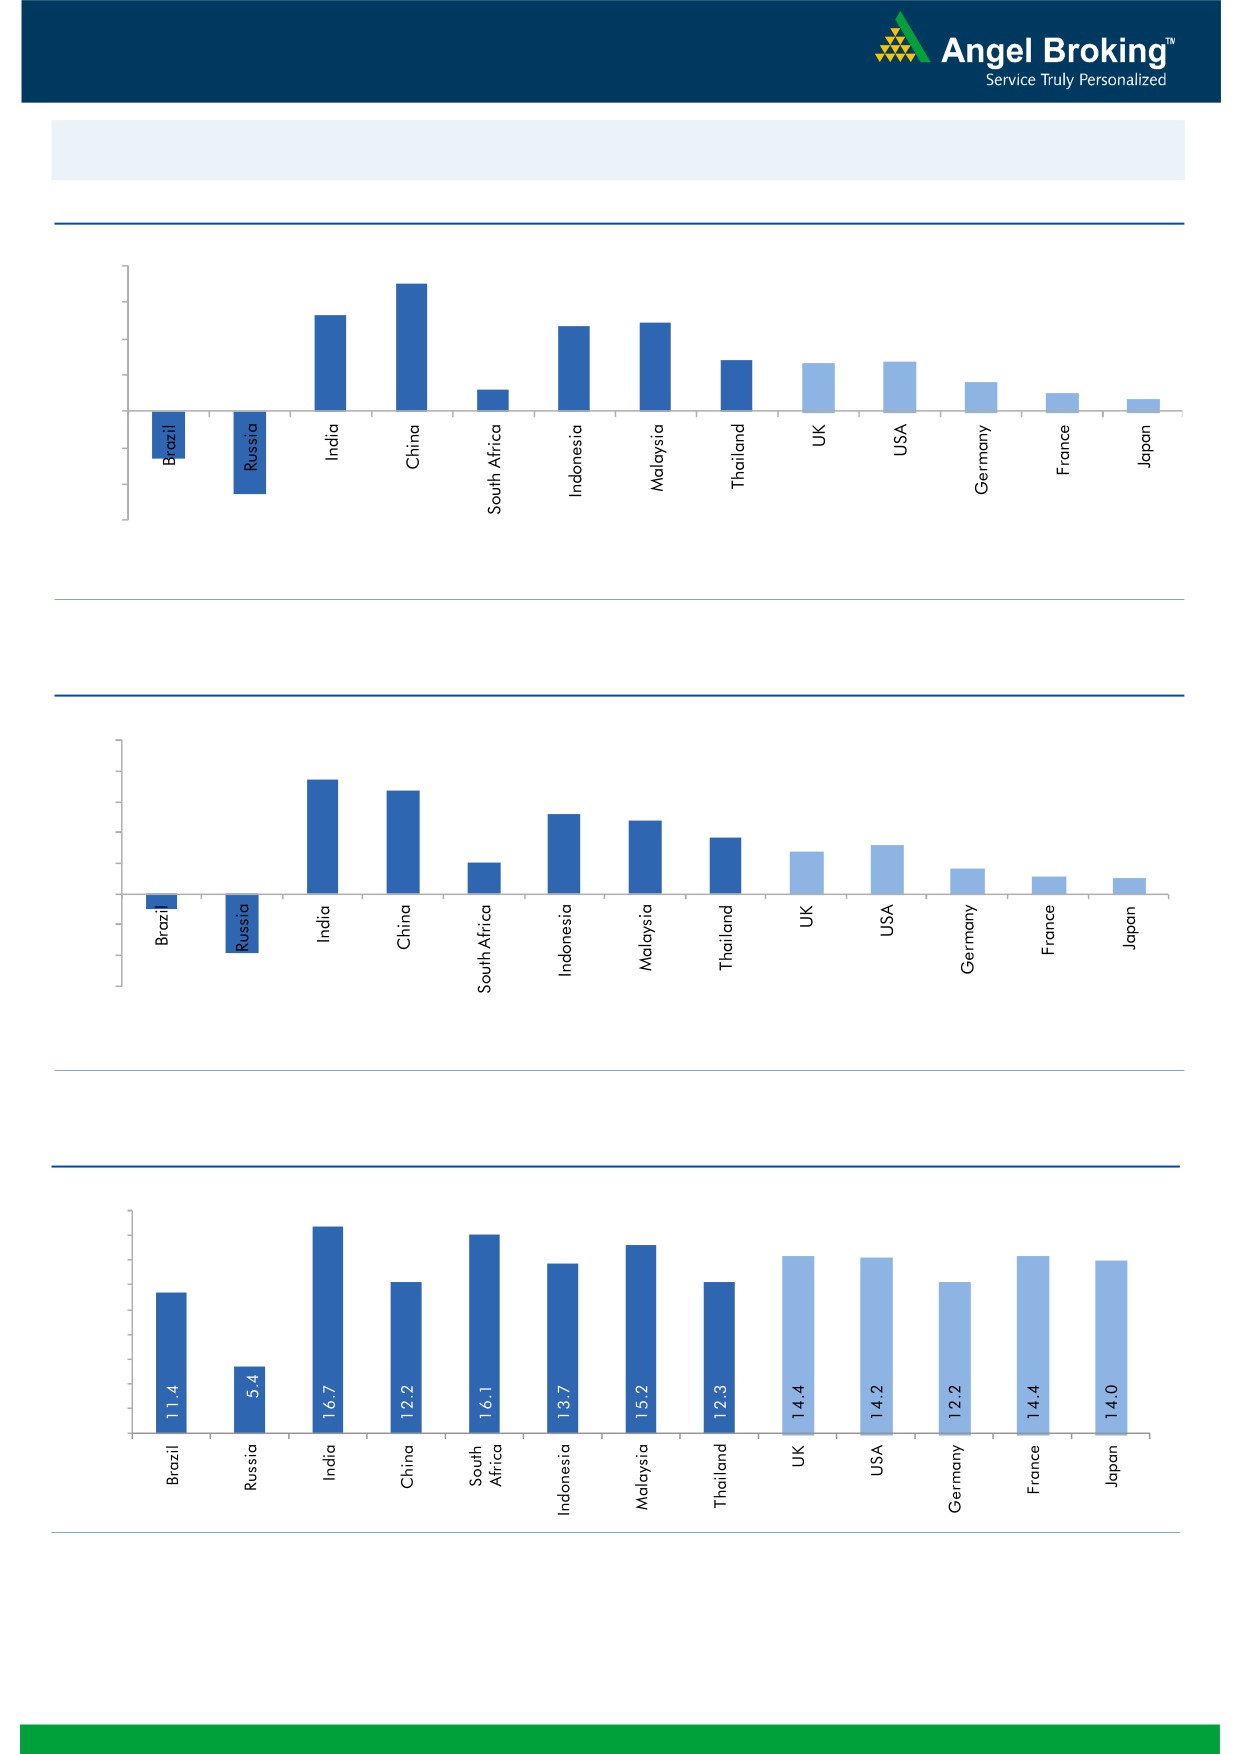
Global watch
Exhibit 1: Latest quarterly GDP Growth (%, yoy) across select developing and developed countries
(%)
8.0
7.0
6.0
5.3
4.9
4.7
4.0
2.8
2.6
2.7
1.6
2.0
1.2
1.0
0.7
(2.6)
(4.6)
-
(2.0)
(4.0)
(6.0)
Source: Bloomberg, Angel Research
Exhibit 2: 2015 GDP Growth projection by IMF (%, yoy) across select developing and developed countries
(%)
10.0
7.5
8.0
6.8
5.2
6.0
4.8
3.7
3.1
4.0
2.7
2.0
1.6
1.2
1.0
2.0
(3.8)
(1.0)
-
(2.0)
(4.0)
(6.0)
Source: IMF, Angel Research
Exhibit 3: One year forward P-E ratio across select developing and developed countries
(x)
18.0
16.0
14.0
12.0
10.0
8.0
6.0
4.0
2.0
-
Source: Bloomberg, Angel Research
Market Outlook
September 4, 2015
Exhibit 4: Relative performance of indices across globe
Returns (%)
Country
Name of index
Closing price
1M
3M
1YR
Brazil
Bovespa
47,366
(5.5)
(14.3)
(23.4)
Russia
Micex
1,711
2.8
3.8
18.0
India
Nifty
7,823
(8.6)
(5.1)
(5.1)
China
Shanghai Composite
3,160
(12.8)
(35.6)
38.1
South Africa
Top 40
44,839
(2.8)
(5.8)
(3.3)
Mexico
Mexbol
43,283
(4.3)
(3.6)
(8.0)
Indonesia
LQ45
753
(7.1)
(18.3)
(14.9)
Malaysia
KLCI
1,597
(7.4)
(8.7)
(14.6)
Thailand
SET 50
904
(4.0)
(8.9)
(14.5)
USA
Dow Jones
16,375
(7.0)
(9.5)
(4.1)
UK
FTSE
6,194
(7.4)
(12.5)
(9.9)
Japan
Nikkei
18,032
(12.1)
(11.6)
15.0
Germany
DAX
10,318
(9.8)
(11.4)
7.2
France
CAC
4,654
(9.1)
(8.7)
5.2
Source: Bloomberg, Angel Research
Market Outlook
September 04, 2015
Stock Watch
Company Name
Reco
CMP
Target
Mkt Cap
Sales ( Čcr )
OPM(%)
EPS (Č)
PER(x)
P/BV(x)
RoE(%)
EV/Sales(x)
(Č)
Price ( Č)
( Č cr )
FY16E FY17E
FY16E
FY17E
FY16E
FY17E
FY16E
FY17E
FY16E
FY17E
FY16E
FY17E
FY16E
FY17E
Agri / Agri Chemical
Rallis
Neutral
210
-
4,076
2,075
2,394
14.4
14.4
9.5
11.0
22.1
19.1
4.4
3.8
21.1
21.3
2.0
1.7
United Phosphorus
Neutral
548
-
23,500
13,698
15,752
17.6
17.6
32.1
38.5
17.1
14.2
3.4
2.8
21.4
21.3
1.8
1.5
Auto & Auto Ancillary
Ashok Leyland
Accumulate
87
97
24,887
18,186
21,529
10.8
11.2
3.3
4.5
26.5
19.4
4.5
4.2
17.3
21.6
1.3
1.1
Bajaj Auto
Accumulate
2,247
2,438
65,016
23,544
27,245
19.8
19.8
127.0
143.4
17.7
15.7
5.4
4.6
30.3
29.4
2.3
2.0
Eicher Motors
Buy
18,383
22,859
49,895
11,681
15,550
15.3
16.9
358.5
564.3
51.3
32.6
15.4
11.5
29.8
34.9
4.2
3.1
Hero Motocorp
Accumulate
2,330
2,672
46,526
28,500
32,764
14.1
14.3
146.9
167.0
15.9
14.0
6.0
5.1
37.8
36.5
1.5
1.2
L G Balakrishnan & Bros Neutral
472
-
740
1,254
1,394
11.6
11.8
35.9
41.7
13.2
11.3
1.8
1.6
13.5
13.8
0.7
0.6
Mahindra and Mahindra Buy
1,144
1,383
71,075
38,337
43,069
13.0
13.4
52.9
63.5
21.6
18.0
3.2
2.9
15.0
15.9
1.5
1.3
Maruti
Accumulate
4,146
4,735
125,256
58,102
68,587
16.7
16.9
182.0
225.5
22.8
18.4
4.5
3.9
19.9
21.0
1.9
1.6
Minda Industries
Buy
520
652
825
2,567
2,965
7.3
8.0
38.8
54.3
13.4
9.6
1.9
1.6
14.4
16.8
0.4
0.4
Rane Brake Lining
Buy
282
366
223
454
511
11.1
11.4
23.8
28.1
11.9
10.1
1.7
1.5
14.2
15.3
0.6
0.6
Setco Automotive
Neutral
224
-
599
594
741
12.7
13.7
8.4
15.8
26.7
14.2
2.8
2.4
10.4
16.9
1.5
1.2
Tata Motors
Buy
333
391
96,245
264,038
297,882
13.8
13.9
34.5
38.9
9.7
8.6
1.6
1.4
17.6
16.8
0.5
0.5
TVS Motor
Neutral
221
-
10,502
11,702
13,713
6.8
7.7
10.1
14.5
21.9
15.2
5.4
4.3
24.5
28.3
0.9
0.7
Amara Raja Batteries
Neutral
976
-
16,663
5,101
6,224
17.8
17.6
31.1
39.2
31.4
24.9
7.8
6.2
24.8
24.8
3.2
2.6
Exide Industries
Accumulate
149
159
12,682
7,363
8,247
13.7
14.5
6.6
7.7
22.6
19.4
2.9
2.6
12.6
13.3
1.5
1.3
Apollo Tyres
Neutral
172
-
8,750
12,576
12,978
16.8
16.1
22.3
19.9
7.7
8.6
1.3
1.2
17.2
13.4
0.8
0.8
Ceat
Neutral
1,117
-
4,519
6,041
6,597
14.3
14.2
101.5
116.6
11.0
9.6
2.2
1.8
20.0
19.1
0.9
0.8
JK Tyres
Buy
106
129
2,400
7,446
7,669
15.2
14.0
19.6
18.4
5.4
5.8
1.4
1.1
25.2
19.5
0.7
0.6
Swaraj Engines
Neutral
875
-
1,087
593
677
14.5
14.8
51.2
60.8
17.1
14.4
4.0
3.6
23.3
24.8
1.7
1.4
Subros
Neutral
85
-
511
1,268
1,488
11.6
11.9
3.7
6.6
23.0
12.9
1.5
1.4
6.8
11.4
0.7
0.6
Indag Rubber
Neutral
179
-
470
283
329
17.0
17.2
13.0
15.4
13.8
11.6
3.0
2.5
21.8
21.6
1.4
1.1
Capital Goods
ACE
Neutral
39
-
385
660
839
4.7
8.2
1.0
3.9
38.9
10.0
1.2
1.1
3.2
11.3
0.7
0.6
BEML
Neutral
1,238
-
5,155
3,277
4,006
6.0
8.9
29.2
64.3
42.4
19.3
2.4
2.2
5.7
11.7
1.7
1.3
BGR Energy
Neutral
106
-
764
3,615
3,181
9.5
9.4
16.7
12.4
6.3
8.5
0.6
0.6
10.0
7.0
0.6
0.8
BHEL
Neutral
212
-
51,779
33,722
35,272
10.8
11.7
10.5
14.2
20.2
14.9
1.5
1.4
7.0
9.0
1.6
1.5
Blue Star
Accumulate
346
387
3,110
3,649
4,209
5.0
5.9
9.2
14.7
37.8
23.5
6.8
6.4
9.1
17.5
0.9
0.8
Crompton Greaves
Buy
166
204
10,388
13,484
14,687
4.9
6.2
4.5
7.1
36.8
23.4
2.6
2.4
7.2
10.8
0.9
0.8
Inox Wind
Buy
382
505
8,484
4,980
5,943
17.0
17.5
26.6
31.6
14.4
12.1
4.3
3.2
35.0
30.0
1.9
1.5
Market Outlook
September 04, 2015
Stock Watch
Company Name
Reco
CMP
Target
Mkt Cap
Sales ( Čcr )
OPM(%)
EPS (Č)
PER(x)
P/BV(x)
RoE(%)
EV/Sales(x)
(Č)
Price ( Č)
( Č cr )
FY16E
FY17E
FY16E
FY17E
FY16E
FY17E
FY16E
FY17E
FY16E
FY17E
FY16E
FY17E
FY16E
FY17E
Capital Goods
KEC International
Neutral
133
-
3,417
8,791
9,716
6.1
6.8
5.4
8.2
24.6
16.2
2.5
2.3
10.0
14.0
0.6
0.6
Thermax
Neutral
981
-
11,684
6,413
7,525
7.4
8.5
30.5
39.3
32.2
25.0
5.0
4.3
15.0
17.0
1.8
1.5
Cement
ACC
Accumulate
1,395
1,548
26,198
11,856
14,092
14.5
17.8
47.6
76.1
29.3
18.3
3.0
2.8
10.6
15.7
2.1
1.7
Ambuja Cements
Accumulate
219
233
33,948
10,569
12,022
20.7
22.2
8.7
10.7
25.1
20.4
3.2
3.0
13.0
15.2
2.8
2.5
India Cements
Buy
74
112
2,272
4,716
5,133
15.9
16.9
3.7
7.5
20.0
9.9
0.7
0.7
3.8
7.3
0.8
0.7
JK Cement
Buy
613
767
4,285
4,056
4,748
14.5
17.0
22.6
41.1
27.1
14.9
2.4
2.2
9.3
15.3
1.5
1.2
J K Lakshmi Cement
Buy
356
430
4,191
2,947
3,616
16.7
19.9
11.5
27.2
31.0
13.1
2.9
2.5
9.8
20.8
1.8
1.5
Mangalam Cements
Neutral
222
-
593
1,053
1,347
10.5
13.3
8.4
26.0
26.4
8.5
1.1
1.0
4.3
12.5
0.9
0.7
Orient Cement
Accumulate
170
183
3,488
1,854
2,524
21.2
22.2
7.7
11.1
22.1
15.3
3.2
2.7
13.3
15.7
2.6
1.8
Ramco Cements
Accumulate
322
350
7,660
4,036
4,545
20.8
21.3
15.1
18.8
21.3
17.1
2.6
2.3
12.9
14.3
2.4
2.1
Shree Cement^
Neutral
10,880
-
37,903
7,150
8,742
26.7
28.6
228.0
345.5
47.7
31.5
7.0
5.9
15.7
20.3
5.1
4.1
UltraTech Cement
Accumulate
3,004
3,282
82,435
27,562
31,548
20.4
22.3
111.9
143.3
26.9
21.0
3.8
3.3
15.2
16.8
3.1
2.6
Construction
ITNL
Neutral
91
-
2,244
7,360
8,825
34.0
35.9
1.0
5.0
91.0
18.2
0.4
0.4
0.3
1.4
3.7
3.6
KNR Constructions
Neutral
555
-
1,561
915
1,479
14.3
13.9
20.3
37.2
27.3
14.9
2.5
2.2
9.6
15.6
1.8
1.2
Larsen & Toubro
Buy
1,566
2,013
145,756
68,920
82,446
10.9
11.5
57.0
73.0
27.5
21.5
2.5
2.3
13.6
15.5
2.3
1.9
Gujarat Pipavav Port
Neutral
180
-
8,707
721
784
53.1
53.6
8.2
9.1
21.9
19.8
3.5
2.9
20.0
18.3
11.6
10.3
MBL Infrastructures
Buy
235
360
976
2,313
2,797
12.2
14.6
19.0
20.0
12.4
11.8
1.3
1.2
11.3
10.6
1.1
1.0
Nagarjuna Const.
Neutral
66
-
3,683
7,892
8,842
8.3
9.1
2.4
5.3
27.6
12.5
1.1
1.0
4.2
8.6
0.7
0.6
PNC Infratech
Neutral
476
-
2,441
1,798
2,132
13.2
13.5
22.0
30.0
21.6
15.9
1.9
1.8
11.5
11.4
1.5
1.2
Simplex Infra
Neutral
299
-
1,479
6,241
7,008
10.4
10.7
20.0
36.0
15.0
8.3
1.2
1.1
6.8
11.1
0.7
0.6
Financials
Allahabad Bank
Neutral
80
-
4,571
8,859
9,817
3.0
3.0
23.7
30.1
3.4
2.7
0.4
0.3
10.6
12.3
-
-
Axis Bank
Buy
486
704
115,595
26,522
31,625
3.6
3.6
36.2
45.4
13.4
10.7
2.6
2.3
18.2
19.6
-
-
Bank of Baroda
Neutral
175
-
38,745
18,934
21,374
2.0
2.0
13.2
15.1
13.3
11.6
1.0
0.9
7.1
7.7
-
-
Bank of India
Neutral
134
-
8,880
17,402
20,003
2.0
2.1
40.3
50.7
3.3
2.6
0.3
0.3
9.0
10.4
-
-
Canara Bank
Neutral
266
-
13,702
15,805
17,745
2.0
2.2
64.3
73.5
4.1
3.6
0.5
0.4
10.8
11.3
-
-
Dena Bank
Neutral
40
-
2,259
3,580
4,040
2.1
2.2
8.4
10.9
4.8
3.7
0.4
0.3
6.8
8.4
-
-
Federal Bank
Neutral
59
-
10,172
3,522
4,045
3.2
3.2
12.2
14.1
4.9
4.2
0.6
0.5
12.9
13.4
-
-
HDFC
Neutral
1,172
-
184,752
11,198
13,321
3.5
3.5
45.1
53.7
26.0
21.8
5.4
4.8
27.2
28.2
-
-
HDFC Bank
Buy
1,010
1,255
254,014
38,629
47,500
4.5
4.7
52.6
66.4
19.2
15.2
3.5
3.0
19.6
21.2
-
-
Market Outlook
September 04, 2015
Stock Watch
Company Name
Reco
CMP
Target
Mkt Cap
Sales ( Čcr )
OPM(%)
EPS (Č)
PER(x)
P/BV(x)
RoE(%)
EV/Sales(x)
(Č)
Price ( Č)
( Č cr )
FY16E FY17E
FY16E
FY17E
FY16E
FY17E
FY16E
FY17E
FY16E
FY17E
FY16E
FY17E
FY16E
FY17E
Financials
ICICI Bank
Buy
267
373
154,920
36,037
41,647
3.5
3.6
22.9
26.7
11.6
10.0
2.0
1.7
15.7
15.9
-
-
IDBI Bank
Neutral
58
-
9,351
9,806
11,371
1.7
1.9
10.0
16.3
5.9
3.6
0.4
0.4
6.8
10.4
-
-
Indian Bank
Neutral
129
-
6,179
6,454
7,321
2.5
2.6
26.4
33.3
4.9
3.9
0.4
0.4
8.1
9.6
-
-
LIC Housing Finance
Buy
423
570
21,360
2,934
3,511
2.3
2.3
30.9
36.8
13.7
11.5
2.2
1.9
16.8
17.5
-
-
Oriental Bank
Neutral
130
-
3,892
7,930
8,852
2.5
2.5
51.8
57.1
2.5
2.3
0.3
0.3
9.3
9.5
-
-
Punjab Natl.Bank
Neutral
131
-
24,285
24,160
27,777
2.9
3.0
18.5
24.6
7.1
5.3
0.7
0.6
8.8
10.8
-
-
South Ind.Bank
Neutral
20
-
2,694
1,999
2,249
2.4
2.4
3.5
4.0
5.7
5.0
0.7
0.7
12.6
13.1
-
-
St Bk of India
Buy
233
309
175,990
86,900
100,550
3.1
3.1
22.1
27.7
10.6
8.4
1.3
1.1
12.7
14.3
-
-
Union Bank
Neutral
161
-
10,258
12,995
14,782
2.4
2.4
32.3
40.9
5.0
4.0
0.6
0.5
10.7
12.3
-
-
Vijaya Bank
Neutral
36
-
3,050
3,474
3,932
1.8
1.9
5.9
7.2
6.1
4.9
0.5
0.5
8.1
9.3
-
-
Yes Bank
Buy
671
951
28,088
7,006
8,825
3.1
3.3
61.4
77.1
10.9
8.7
2.0
1.7
20.1
21.3
-
-
FMCG
Asian Paints
Neutral
826
-
79,244
16,553
19,160
16.0
16.2
17.7
21.5
46.7
38.4
12.4
11.2
29.4
31.2
4.6
4.0
Britannia
Neutral
3,009
-
36,102
8,065
9,395
9.6
10.2
47.2
65.5
63.7
45.9
21.2
20.0
38.3
41.2
4.3
3.7
Colgate
Accumulate
1,915
2,022
26,037
4,836
5,490
19.5
19.7
48.5
53.2
39.5
36.0
28.9
25.2
99.8
97.5
5.3
4.6
Dabur India
Neutral
285
-
50,087
9,370
10,265
17.1
17.2
7.3
8.1
38.9
35.2
11.7
9.5
33.7
30.6
5.3
4.8
GlaxoSmith Con*
Neutral
6,128
-
25,773
4,919
5,742
17.2
17.4
168.3
191.2
36.4
32.1
10.3
8.8
28.8
28.9
4.8
4.1
Godrej Consumer
Neutral
1,305
-
44,438
10,168
12,886
16.1
16.1
32.1
38.4
40.7
34.0
8.3
7.6
19.7
21.0
4.5
3.5
HUL
Neutral
836
-
180,941
34,940
38,957
17.5
17.7
20.8
24.7
40.2
33.9
44.7
35.7
110.5
114.2
5.0
4.4
ITC
Buy
320
409
256,789
41,068
45,068
37.8
37.4
13.9
15.9
23.0
20.1
7.7
6.8
34.1
33.8
5.9
5.3
Marico
Neutral
406
-
26,197
6,551
7,766
15.7
16.0
10.4
12.5
39.1
32.5
11.4
9.4
33.2
32.4
3.9
3.3
Nestle*
Accumulate
6,027
6,646
58,111
11,291
12,847
22.2
22.3
158.9
184.6
37.9
32.7
19.8
17.8
55.0
57.3
5.0
4.3
Tata Global
Buy
124
152
7,829
8,635
9,072
9.8
9.9
6.5
7.6
19.1
16.3
1.9
1.8
6.8
7.4
0.8
0.8
IT
HCL Tech^
Buy
958
1,132
134,748
42,038
47,503
23.5
23.5
56.4
62.9
17.0
15.2
3.9
3.0
23.2
19.8
2.8
2.3
Infosys
Buy
1,101
1,306
252,813
60,250
66,999
28.0
28.0
58.3
63.7
18.9
17.3
4.0
3.4
20.9
19.7
3.5
3.0
TCS
Buy
2,605
3,168
510,298
108,420
123,559
28.8
28.7
127.2
143.9
20.5
18.1
8.2
7.6
39.9
41.8
4.3
3.7
Tech Mahindra
Buy
540
646
51,942
25,566
28,890
16.0
17.0
26.3
31.9
20.5
16.9
3.7
3.2
17.9
18.6
1.8
1.5
Wipro
Buy
567
719
139,955
52,414
58,704
23.7
23.8
38.4
42.3
14.8
13.4
2.9
2.6
19.5
18.0
2.2
1.8
Media
D B Corp
Buy
308
356
5,666
2,241
2,495
27.8
27.9
21.8
25.6
14.2
12.1
3.7
3.3
26.7
28.5
2.5
2.2
HT Media
Neutral
78
-
1,822
2,495
2,603
11.2
11.2
7.3
8.6
10.7
9.1
0.9
0.8
7.4
8.1
0.2
0.2
Market Outlook
September 04, 2015
Stock Watch
Company Name
Reco
CMP
Target
Mkt Cap
Sales ( Čcr )
OPM(%)
EPS (Č)
PER(x)
P/BV(x)
RoE(%)
EV/Sales(x)
(Č)
Price ( Č)
( Č cr )
FY16E FY17E
FY16E
FY17E
FY16E
FY17E
FY16E
FY17E
FY16E
FY17E
FY16E
FY17E
FY16E
FY17E
Media
Jagran Prakashan
Buy
135
156
4,410
1,939
2,122
26.0
26.0
8.3
9.2
16.3
14.7
2.8
2.5
17.5
17.1
2.2
2.0
Sun TV Network
Neutral
372
-
14,676
2,779
3,196
70.2
70.5
22.8
27.3
16.3
13.6
4.0
3.6
26.7
28.3
5.0
4.4
Hindustan Media
Buy
220
292
1,614
920
1,031
20.0
20.0
19.2
20.9
11.5
10.5
1.9
1.6
16.4
15.3
1.3
1.1
Ventures
Metals & Mining
Coal India
Buy
346
400
218,325
72,015
78,415
21.2
21.5
21.7
25.3
15.9
13.7
5.4
5.3
33.1
39.1
2.3
2.1
Hind. Zinc
Neutral
133
-
56,366
15,546
16,821
47.5
49.0
19.7
20.3
6.8
6.6
1.1
1.0
17.2
16.6
1.4
0.9
Hindalco
Neutral
77
-
15,942
112,328
119,817
7.7
7.9
16.3
20.1
4.8
3.9
0.4
0.3
8.0
8.5
0.6
0.5
JSW Steel
Neutral
931
-
22,502
48,125
53,595
18.8
21.0
46.9
97.5
19.9
9.6
1.0
0.9
4.4
9.5
1.3
1.1
NMDC
Neutral
103
-
40,698
12,544
13,330
59.5
59.7
16.3
16.5
6.3
6.2
1.1
1.0
5.1
9.9
2.0
1.9
SAIL
Neutral
49
-
20,134
56,365
63,383
6.9
8.0
7.1
8.2
6.8
6.0
0.4
0.4
7.0
7.1
0.9
0.8
Vedanta
Neutral
98
-
29,128
81,842
88,430
30.6
32.8
20.2
25.7
4.9
3.8
0.4
0.3
7.5
8.5
0.7
0.5
Tata Steel
Neutral
230
-
22,304
136,805
149,228
11.3
11.9
26.4
36.8
8.7
6.2
0.7
0.6
6.0
8.0
0.7
0.6
Oil & Gas
Cairn India
Neutral
149
-
27,992
12,617
14,513
33.7
40.0
25.5
27.7
5.9
5.4
0.4
0.4
7.4
7.7
0.9
0.7
GAIL
Neutral
295
-
37,401
75,595
85,554
8.6
8.0
31.8
36.1
9.3
8.2
1.0
0.9
10.7
11.4
0.6
0.5
ONGC
Neutral
229
-
196,306
174,773
192,517
22.7
24.8
34.6
38.2
6.6
6.0
0.9
0.9
14.2
14.9
1.2
1.1
Petronet LNG
Buy
177
210
13,238
39,007
40,785
3.8
4.2
9.2
11.0
19.3
16.1
2.2
2.0
11.6
12.7
0.4
0.4
Indian Oil Corp
Accumulate
400
455
97,057
359,607
402,760
5.9
6.1
42.5
48.7
9.4
8.2
1.3
1.1
14.1
14.4
0.4
0.3
Reliance Industries
Accumulate
854
930
276,457
339,083
384,014
7.8
9.5
75.7
94.5
11.3
9.0
1.1
1.1
10.7
12.2
1.1
1.0
Pharmaceuticals
Alembic Pharma
Neutral
697
-
13,148
2,601
3,115
21.2
20.2
20.8
23.9
33.5
29.2
10.8
8.1
37.2
31.8
5.1
4.2
Aurobindo Pharma
Buy
735
872
42,945
14,923
17,162
23.0
23.0
38.2
43.6
19.3
16.9
5.9
4.5
36.0
30.2
3.2
2.7
Aventis*
Neutral
3,996
-
9,203
2,156
2,455
15.1
16.8
109.7
133.9
36.4
29.8
5.0
4.1
18.4
22.5
4.0
3.3
Cadila Healthcare
Neutral
1,863
-
38,136
10,224
11,840
20.0
21.0
71.0
85.6
26.2
21.8
7.0
5.5
30.1
28.5
3.8
3.2
Cipla
Neutral
657
-
52,752
14,051
16,515
20.4
18.7
26.6
28.4
24.7
23.1
4.1
3.6
18.2
16.5
3.7
3.1
Dr Reddy's
Neutral
4,207
-
71,731
17,903
20,842
22.7
22.8
160.5
189.5
26.2
22.2
5.3
4.4
22.2
21.7
4.0
3.4
Dishman Pharma
Accumulate
255
290
2,056
1,716
1,888
20.2
20.2
16.3
21.6
15.6
11.8
1.5
1.3
9.7
11.7
1.4
1.1
GSK Pharma*
Neutral
3,373
-
28,574
2,870
3,158
20.0
22.1
59.5
68.3
56.7
49.4
16.7
17.2
28.5
34.3
9.5
8.6
Indoco Remedies
Neutral
333
-
3,068
1,088
1,262
18.2
18.2
13.1
15.5
25.4
21.5
5.0
4.2
21.2
21.1
2.9
2.5
Ipca labs
Neutral
796
-
10,038
3,507
4,078
17.6
18.6
25.8
32.0
30.8
24.9
4.0
3.5
13.8
14.9
3.1
2.7
Lupin
Neutral
1,863
-
83,855
14,864
17,244
26.9
26.9
62.1
71.1
30.0
26.2
7.3
5.8
27.4
24.6
5.4
4.5
Sun Pharma
Accumulate
885
950
213,054
28,163
32,610
25.8
30.7
17.4
26.9
50.9
32.9
4.8
4.2
13.0
16.6
7.0
5.9
Market Outlook
September 04, 2015
Stock Watch
Company Name
Reco
CMP
Target
Mkt Cap
Sales ( Čcr )
OPM(%)
EPS (Č)
PER(x)
P/BV(x)
RoE(%)
EV/Sales(x)
(Č)
Price ( Č)
( Č cr )
FY16E FY17E
FY16E
FY17E
FY16E
FY17E
FY16E
FY17E
FY16E
FY17E
FY16E
FY17E
FY16E
FY17E
Power
Tata Power
Neutral
60
-
16,201
38,302
38,404
14.1
13.1
5.1
6.0
11.7
10.0
1.1
1.1
9.2
10.3
1.3
1.3
NTPC
Buy
118
157
97,132
87,064
98,846
23.5
23.5
11.7
13.2
10.1
8.9
1.1
1.1
11.4
12.1
2.1
1.9
Power Grid
Buy
128
170
66,755
20,702
23,361
86.7
86.4
12.1
13.2
10.6
9.7
1.6
1.4
15.6
15.1
8.2
7.6
Telecom
Bharti Airtel
Neutral
347
-
138,810
101,748
109,191
32.1
31.7
12.0
12.5
28.9
27.8
2.0
1.9
6.9
6.7
2.0
1.8
Idea Cellular
Neutral
150
-
53,963
34,282
36,941
32.0
31.5
5.9
6.2
25.4
24.2
2.3
2.1
9.9
9.3
2.2
2.0
zOthers
Abbott India
Neutral
5,125
-
10,890
2,715
3,153
14.5
14.1
134.3
152.2
38.2
33.7
9.5
7.9
27.4
25.6
3.7
3.1
Bajaj Electricals
Buy
248
341
2,498
4,719
5,287
5.2
5.8
8.6
12.7
29.0
19.6
3.3
2.9
11.4
14.8
0.5
0.5
Finolex Cables
Neutral
237
-
3,627
2,728
3,036
10.8
11.0
14.4
16.8
16.5
14.2
2.5
2.2
15.2
15.3
1.1
0.9
Goodyear India*
Buy
549
655
1,266
1,953
1,766
12.4
12.0
67.4
59.6
8.1
9.2
2.0
1.7
27.7
20.2
0.4
0.4
Hitachi
Neutral
1,358
-
3,693
1,806
2,112
9.0
9.2
28.6
29.1
47.5
46.7
11.8
9.5
28.1
22.6
2.1
1.8
Jyothy Laboratories
Neutral
306
-
5,545
1,620
1,847
11.5
11.5
7.3
8.5
42.0
36.2
5.4
5.0
13.3
14.4
3.3
2.8
MRF
Accumulate
40,161
43,575
17,033
20,727
14,841
19.3
18.6
4,905.8
3,351.9
8.2
12.0
2.6
2.1
37.6
19.6
0.8
1.0
Page Industries
Neutral
14,160
-
15,794
1,929
2,450
19.8
20.1
229.9
299.0
61.6
47.4
27.2
18.9
52.1
47.1
8.2
6.4
Relaxo Footwears
Neutral
509
-
6,105
1,767
2,152
12.3
12.5
19.3
25.1
26.4
20.3
6.5
5.0
27.7
27.8
3.5
2.9
Siyaram Silk Mills
Accumulate
1,095
1,221
1,026
1,653
1,873
11.7
12.2
99.3
122.1
11.0
9.0
2.0
1.7
19.5
20.2
0.8
0.7
Styrolution ABS India*
Neutral
763
-
1,342
1,271
1,440
8.6
9.2
32.0
41.1
23.8
18.6
2.4
2.2
10.7
12.4
1.0
0.9
Tree House
Buy
390
449
1,651
259
324
56.8
56.8
17.0
21.7
22.9
18.0
2.3
2.1
10.1
11.5
6.3
5.2
TVS Srichakra
Buy
2,497
3,210
1,912
2,127
2,388
15.2
14.9
237.7
267.5
10.5
9.3
4.5
3.2
51.7
39.8
1.0
0.8
HSIL
Buy
257
434
1,861
2,085
2,436
18.5
18.6
21.7
28.9
11.9
8.9
1.2
1.1
10.0
12.1
1.0
0.8
Kirloskar Engines India
Accumulate
269
297
3,889
2,634
3,252
10.1
12.0
10.9
17.4
24.7
15.4
2.8
2.5
11.4
16.8
1.1
0.8
Ltd
M M Forgings
Buy
581
797
702
563
671
22.1
22.9
51.0
66.5
11.4
8.8
2.4
1.9
23.1
24.1
1.4
1.1
Banco Products (India)
Neutral
116
-
833
1,208
1,353
11.0
12.3
10.8
14.5
10.8
8.0
1.2
1.1
11.9
14.5
0.7
0.6
Competent Automobiles Neutral
149
-
92
1,007
1,114
3.1
3.1
23.7
28.2
6.3
5.3
0.9
0.8
13.9
14.6
0.1
0.1
Nilkamal
Neutral
1,014
-
1,513
1,948
2,147
10.6
10.3
60.0
67.0
16.9
15.1
2.6
2.3
16.8
16.1
0.8
0.7
Visaka Industries
Buy
144
166
229
1,158
1,272
8.6
9.5
23.7
32.7
6.1
4.4
0.6
0.6
10.1
12.5
0.4
0.3
Transport Corporation of
Buy
236
293
1,799
2,830
3,350
8.8
9.0
14.4
18.3
16.5
12.9
2.5
2.2
15.4
17.1
0.8
0.7
India
Elecon Engineering
Buy
71
87
773
1,452
1,596
14.0
14.7
4.4
6.2
16.1
11.4
1.3
1.2
8.6
11.2
0.8
0.7
Surya Roshni
Buy
123
183
538
2,992
3,223
8.3
8.5
14.7
18.3
8.4
6.7
0.8
0.7
9.8
11.0
0.5
0.4
MT Educare
Buy
131
169
523
286
366
18.3
17.7
7.7
9.4
17.0
14.0
3.6
3.1
20.2
21.1
1.7
1.3
Market Outlook
September 04, 2015
Stock Watch
Company Name
Reco
CMP
Target Mkt Cap
Sales ( Čcr )
OPM(%)
EPS (Č)
PER(x)
P/BV(x)
RoE(%)
EV/Sales(x)
(Č)
Price ( Č)
( Č cr )
FY16E FY17E FY16E FY17E FY16E FY17E FY16E FY17E FY16E FY17E FY16E FY17E FY16E FY17E
zOthers
Radico Khaitan
Buy
87
112
1,155
1,565
1,687
11.9
12.4
5.4
6.6
16.0
13.2
1.3
1.2
8.0
9.0
1.2
1.2
Garware Wall Ropes
Buy
294
390
643
875
983
10.4
10.6
23.1
27.8
12.7
10.6
1.8
1.6
14.1
14.8
0.7
0.6
Wonderla Holidays
Accumulate
281
322
1,585
206
308
44.0
43.6
9.0
12.9
31.2
21.8
4.3
3.9
13.7
17.8
7.6
5.0
Linc Pen & Plastics
Buy
156
185
230
340
371
8.3
8.9
10.8
13.2
14.4
11.8
2.3
2.0
16.0
17.1
0.7
0.7
Source: Company, Angel Research; Note: *December year end; #September year end; &October year end; Price as on September 03, 2015
Market Outlook
September 04, 2015
Research Team Tel: 022 - 39357800
DISCLAIMER
Angel Broking Private Limited (hereinafter referred to as “Angel”) is a registered Member of National Stock Exchange of India Limited,
Bombay Stock Exchange Limited and MCX Stock Exchange Limited. It is also registered as a Depository Participant with CDSL and
Portfolio Manager with SEBI. It also has registration with AMFI as a Mutual Fund Distributor. Angel Broking Private Limited is a registered
entity with SEBI for Research Analyst in terms of SEBI (Research Analyst) Regulations, 2014 vide registration number INH000000164.
Angel or its associates has not been debarred/ suspended by SEBI or any other regulatory authority for accessing /dealing in securities
Market. Angel or its associates including its relatives/analyst do not hold any financial interest/beneficial ownership of more than 1% in
the company covered by Analyst. Angel or its associates/analyst has not received any compensation / managed or co-managed public
offering of securities of the company covered by Analyst during the past twelve months. Angel/analyst has not served as an officer,
director or employee of company covered by Analyst and has not been engaged in market making activity of the company covered by
Analyst.
This document is solely for the personal information of the recipient, and must not be singularly used as the basis of any investment
decision. Nothing in this document should be construed as investment or financial advice. Each recipient of this document should make
such investigations as they deem necessary to arrive at an independent evaluation of an investment in the securities of the companies
referred to in this document (including the merits and risks involved), and should consult their own advisors to determine the merits and
risks of such an investment.
Reports based on technical and derivative analysis center on studying charts of a stock's price movement, outstanding positions and
trading volume, as opposed to focusing on a company's fundamentals and, as such, may not match with a report on a company's
fundamentals.
The information in this document has been printed on the basis of publicly available information, internal data and other reliable sources
believed to be true, but we do not represent that it is accurate or complete and it should not be relied on as such, as this document is for
general guidance only. Angel Broking Pvt. Limited or any of its affiliates/ group companies shall not be in any way responsible for any
loss or damage that may arise to any person from any inadvertent error in the information contained in this report. Angel Broking Pvt.
Limited has not independently verified all the information contained within this document. Accordingly, we cannot testify, nor make any
representation or warranty, express or implied, to the accuracy, contents or data contained within this document. While Angel Broking
Pvt. Limited endeavors to update on a reasonable basis the information discussed in this material, there may be regulatory, compliance,
or other reasons that prevent us from doing so.
This document is being supplied to you solely for your information, and its contents, information or data may not be reproduced,
redistributed or passed on, directly or indirectly.
Neither Angel Broking Pvt. Limited, nor its directors, employees or affiliates shall be liable for any loss or damage that may arise from or
in connection with the use of this information.
Note: Please refer to the important ‘Stock Holding Disclosure' report on the Angel website (Research Section). Also, please refer to the
latest update on respective stocks for the disclosure status in respect of those stocks. Angel Broking Pvt. Limited and its affiliates may have
investment positions in the stocks recommended in this report.