Market Outlook
August 04, 2016
Market Cues
Domestic Indices
Chg (%)
(Pts)
(Close)
Indian markets are expected to open positive as the Rajya Sabha has cleared the
BSE Sensex
(1.0)
(284)
27,698
GST Constitutional Amendment Bill. The long pending bill is likely to bring renewed
Nifty
(0.9)
(78)
8,545
interest in the Indian markets by various investors both domestic as well foreign.
Mid Cap
(1.5)
(189)
12,441
Dow industrials snapped its 7-session losing streak on Wednesday and broader
Small Cap
(1.1)
(139)
12,080
markets logged moderate advance on the back of rebound in crude-oil futures.
Bankex
(0.6)
(131)
21,245
However, major indexes traded within narrow range in what strategists described as
a typical August market. Dow Jones 0.23%, supported by gains in shares of
Goldman Sachs, +1.46% and J.P. Morgan, +1.59%.
Global Indices
Chg (%)
(Pts)
(Close)
Dow Jones
0.2
41
18,355
Weaker commodities and property shares dragged FTSE lower, offsetting a rally in
banking stocks led by HSBC. FTSE 100 index finished day 0.2% lower. HSBC shares
Nasdaq
0.4
22
5,160
ended 4.5% higher after the bank surprised investors with a $2.5bn share buyback
FTSE
(0.2)
(11)
6,634
announcement. That was despite its reporting 29% fall in pre-tax profits for the six
Nikkei
(1.9)
(308)
16,083
months to the end of June.
Hang Seng
(1.8)
(390)
21,739
Equity benchmarks extended losses for 4th consecutive session on Wednesday, on
Shanghai Com
0.2
7
2,978
profit booking ahead of voting for Goods & Services Tax (GST) Bill that was
introduced for discussion in Rajya Sabha. Weak global cues also led to the selling.
Advances / Declines
BSE
NSE
News Analysis & Result Review
Advances
885
407
Rajya Sabha Passes GST Bill
Declines
1,869
1,213
Results Review: HCL Tech, Cadila Healthcare, Dishman Pharma
Unchanged
131
55
Detailed analysis on Pg2
Investor’s Ready Reckoner
Volumes (` Cr)
BSE
3,261
Key Domestic & Global Indicators
NSE
21,220
Stock Watch: Latest investment recommendations on 150+ stocks
Refer Pg6 onwards
Net Inflows (` Cr)
Net
Mtd
Ytd
Top Picks
FII
247
903
31,785
CMP
Target
Upside
Company
Sector
Rating
(`)
(`)
(%)
MFs
59
59
9,129
Amara Raja
Auto/Auto Ancillary
Buy
914
1,076
17.7
HCL Tech
IT
Buy
826
1,000
21.1
Top Gainers
Price (`)
Chg (%)
LIC Housing
Financials
Buy
499
582
16.6
Deltacorp
108
8.9
Bharat Electronics
Capital Goods
Accumulate
1,237
1,414
14.4
Fortis
190
7.3
Navkar Corporation Others
Buy
212
265
24.9
J&Kbank
66
3.2
More Top Picks on Pg5
Hcltech
826
3.2
Key Upcoming Events
Abirlanuvo
1,507
3.1
Previous
Consensus
Date
Region
Event Description
Reading
Expectations
Aug 4
US
Initial Jobless claims
266.0
265.0
Top Losers
Price (`)
Chg (%)
Aug 4
US
Change in Nonfarm payrolls
287.0
175.0
Bajfinance
10,011
(8.6)
Aug 5
UK
BOE Announces rates
0.50
0.25
Justdial
477
(5.7)
Aug 5
US
Unemployment rate
4.9
4.8
Jublfood
1,206
(5.6)
Aug 8
UK Industrial Production (YoY)
1.4
--
6.(
Pageind
13,954
(5.3)
More Events on Pg6
Voltas
346
(5.2)
As on August 3, 2016
Market Outlook
August 04, 2016
Rajya Sabha Passes GST Constitutional Amendment Bill
The long impending Goods and Services Tax (GST) will now see the light of day
and be enforced from April 2017 as the Rajya Sabha has finally passed the GST
Constitutional Amendment Act. The GST’s enactment would potentially be the most
resilient tax reform in recent years as it would do away with the intricacies of a
multilayer and differential tax system for various good and services across different
states. The final rate of GST will be decided upon in Nov-Dec of 2016 and
coherence among various political parties on the bill suggests at its smooth
enforcement going ahead.
Result Review
HCL Tech (CMP: `826/ TP: `1,000/ Upside: 21.1%)
For 1QFY2017, the company posted numbers better than expected, on all fronts.
On sales, it posted sales of `11,336cr V/s `11,219cr expected and V/s `10,698cr
in 3QFY2016 (company changed its Financial year to March), a QoQ growth of
6.0%. In US$ terms, it came in at US$1,691mn V/s US$ 1,674mn expected and
V/s US$1,587mn, a QoQ growth of 6.5%. On CC terms, the QoQ growth for the
company was 6.0%.
The growth was driven by Europe which posted 16.9% Constant Currency (CC)
QoQ growth, USA posted 2.0% QoQ growth and a flat growth in ROW. In terms,
of Industries, the Manufacturing 12.0% QoQ CC growth, Public Services posted a
11.8% QoQ CC growth and Retail & CPG a 14.5% QoQ CC growth, while
Financial Services posted a dip of 0.1% QoQ CC growth and Life sciences &
Healthcare, posted a dip of 1.0% QoQ CC.
On the operating profit front, the EBIT margins, came in at 20.6% V/s 19.4%
expected and V/s 20.8% in 3QFY2016, QoQ dip of 19bps. The improvement in
margins came on back of the volume growth higher than expected. Capacity
utilization which was 85.8% V/s 85.6% in 3QFY2016. The attrition rate during the
quarter was 17.8% V/s 17.3% in 3QFY2016. Thus, the Adj. net profit is expected
to come in at `1,891cr V/s `1,925cr in 3QFY2016, a QoQ de-growth of 1.8%.
In terms, of client addition company added 10 clients in the US$20-30+mn
bracket. For FY2017, company gave guidance revenues to grow between 12.0-
14.0% in CC. Revenue Guidance is based on FY2016 (April to Mar-2016) average
exchange rates. Above constant currency guidance translates to 11.2% to 13.2% in
US$ terms based on June 30, 2016 rates. Operating Margin (EBIT) for FY2017E is
expected to be in the range is from 19.5% to 20.5%. We maintain our buy rating.
Y/E
Sales OPM
PAT
EPS ROE P/E P/BV EV/EBITDA EV/Sales
Mar
(` cr)
(%)
(` cr)
(`)
(%)
(x)
(x)
(x)
(x)
FY2017E
49,242
20.5
7,862
55.7
20.3
14.4
2.9
9.2
1.9
FY2018E
57,168
20.5
9,037
64.1
17.9
12.5
2.2
6.9
1.4
Market Outlook
August 04, 2016
Cadila Healthcare (CMP: `347/ TP: `400/ Upside: 15.3%)
For 1QFY2017, the company posted lower than expected results on sales front,
while net profit came in higher than expected on back of lower taxes during the
quarter. On sales front, the company posted sales of `2,216cr V/s `2,607cr
expected V/s `2,378cr in 1QFY2016, a yoy de-growth of 6.8%. the dip in sales
was on back of USA business (`8,48.3cr), which registered yoy dip of 13.9%.
Indian formulations (`786.2cr) posted a yoy growth of 6.2%. Consumer wellness
(`116.1cr) and Animal healthcare & others (`109.7cr) posted a yoy growth of
12.2% and 43.85% yoy, respectively. On the operating profit front, the EBITDA
margins came in at 20.4% V/s 20.9% expected and v/s 20.1% in 1QFY2016. The
dip in OPM was saved, as GPM improved from 65.1% V/s 64.3% in 1QFY2016.
The Adj. net profit came in at `355cr V/s `489cr expected and V/s `352cr in
1QFY2016, a yoy growth of 0.8%. We maintain our buy rating.
Y/E
Sales OPM
PAT
EPS ROE P/E P/BV EV/EBITDA EV/Sales
Mar
(` cr)
(%)
(` cr)
(`)
(%)
(x)
(x)
(x)
(x)
FY2017E
11,126
22.0
1,752
17.1
28.8
20.3
5.2
14.3
3.2
FY2018E
13,148
22.0
2,044
20.0
26.6
17.4
4.1
11.6
2.6
Dishman Pharma (CMP: `167/ TP: Under Review/ Upside: )
For 1QFY2017, the company posted better than expected results. The sales came
in at `366cr V/s `350cr expected V/s `400cr in 1QFY2016, a yoy de-growth of
8.5%. The CRAMS (`258cr), posted a yoy growth of 2.3%, other segment (`108cr)
posted de-growth of 26.9%. On the operating profit front, the EBITDA margins
came in at 25.3% V/s 20.9% expected v/s 25.4% in 1QFY2016. Thus, the Adj. net
profit came in at `45.5cr V/s `32cr expected and `41cr in 1QFY2016, a yoy
growth of 13.7%. Our rating is under review.
Y/E
Sales OPM
PAT
EPS ROE P/E P/BV EV/EBITDA EV/Sales
Mar
(` cr)
(%)
(` cr)
(`)
(%)
(x)
(x)
(x)
(x)
FY2017E
1,718
21.7
141
8.7
9.3
18.8
1.7
9.1
2.0
FY2018E
1,890
21.8
167
10.4
10.2
15.8
1.5
7.9
1.7
Economic and Political News
Rajya Sabha passes GST Constitutional Amendment Bill
Telcos penalised `2,313cr for wrong subscriber verification
FIPB clears 7 foreign investment proposals worth `300cr
Corporate News
Oberoi New Delhi renovation to cost EIH `500cr
Berger Paints to invest `100cr in Jejuri plant
Mphasis sets up centre for risk and compliance
Fortis Healthcare arm hikes stake in Lalitha Healthcare
Market Outlook
August 04, 2016
Quarterly Bloomberg Brokers Consensus Estimate
Tata Power Co Ltd Consol- Aug 4, 2016
Particulars (` cr)
1QFY17E
1QFY16
y-o-y (%)
4QFY16
q-o-q (%)
Net sales
9,250
9,235
0.2
9,375
(1.3)
EBITDA
2,000
2,181
(8.3)
1,913
4.5
EBITDA margin (%)
21.6
23.6
20.4
Net profit
337
241
39.6
360
(6.5)
Siemens Ltd - Aug 4, 2016
Particulars (` cr)
3QSY16E
3QSY15
y-o-y (%)
2QSY16
q-o-q (%)
Net sales
2,498
2,322
7.6
2,725
(8.3)
EBITDA
273
253
7.7
306
(11.0)
EBITDA margin (%)
10.9
10.9
11.2
Net profit
163
168
(3.2)
177
(8.2)
Cummins India Ltd - Aug 4, 2016
Particulars (` cr)
1QFY17E
1QFY16
y-o-y (%)
4QFY16
q-o-q (%)
Net sales
1,307
1,282
1.9
1,038
25.9
EBITDA
204
218
(6.6)
171
19.2
EBITDA margin (%)
15.6
17.0
16.5
Net profit
198
211
(5.9)
164
20.9
Bharat Forge Ltd - Aug 5, 2016
Particulars (` cr)
1QFY17E
1QFY16
y-o-y (%)
4QFY16
q-o-q (%)
Net sales
996
1,104
(9.8)
987
0.9
EBITDA
289
346
(16.4)
298
(3.0)
EBITDA margin (%)
29.1
31.4
30.2
Net profit
157
195
(19.5)
165
(4.4)
Marico Ltd - Aug 5, 2016
Particulars (` cr)
1QFY17E
1QFY16
y-o-y (%)
4QFY16
q-o-q (%)
Net sales
1,873
1,782
5.1
1303
43.7
EBITDA
387
357
8.4
244
58.4
EBITDA margin (%)
20.7
20
18.7
Net profit
274
238
15.3
138
98.1
Union Bank of India - Aug 6, 2016
Particulars (` cr)
1QFY17E
1QFY16
y-o-y (%)
4QFY16
q-o-q (%)
Net profit
203
519
(60.9)
96
111.1
Market Outlook
August 04, 2016
Top Picks ★★★★★
Large Cap
Market Cap
CMP
Target
Upside
Company
Rationale
(` Cr)
(`)
(`)
(%)
To outpace battery industry growth due to better technological
Amara Raja Batteries
15,778
914
1,076
17.7
products leading to market share gains in both the automotive
OEM and replacement segments.
Uptick in defense capex by government, coupled with BELs
Bharat Electronics
29,777
1,237
1,414
14.4
strong market positioning, indicate good times ahead for BEL.
HCL Tech
1,10,166
826
1,000
21.1
Stock is trading at attractive valuations & factors all bad news.
Back on the growth trend, expect a long term growth of 14% to
Infosys
2,49,219
1,085
1,374
26.6
be a US$20bn in FY2020.
Continues to grow its retail loan book at healthy pace with
LIC Housing Fin.
26,336
499
582
16.6
improvement in asset quality. Expect LICHF to post a healthy
loan book which is likely to reflect in a strong earnings growth.
Strong market positioning within the domestic AC markets to
Voltas
12,266
346
407
17.5
continue, EMP business set to revive
Source: Company, Angel Research
Mid Cap
Market Cap
CMP
Target
Upside
Company
Rationale
(` Cr)
(`)
(`)
(%)
With a focus on the low and medium income (LMI) consumer
Dewan Housing
6,509
224
270
20.4
segment, the company has increased its presence in tier-II & III
cities where the growth opportunity is immense.
Strong loan growth backed by diversified loan portfolio and
Equitas Holdings
6,541
177
235
33.1
adequate CAR. ROE & ROA likely to remain decent as risk of
dilution remains low. Attractive valuations considering growth.
Expectations of above average monsoon augurs well for
Goodyear India
1,208
520
631
21.3
Goodyear India as it derives ~50% of its turnover from farm
tyre segment.
Commencement of new projects, downtrend in the interest rate
IL&FS Transport
2,357
72
93
29.1
cycle, to lead to stock re-rating
Economic recovery to have favourable impact on advertising &
Jagran Prakashan
5,897
182
205
12.9
circulation revenue growth. Further, the acquisition of a radio business
(Radio City) would also boost the company`s revenue growth.
Speedier execution and speedier sales, strong revenue visibility
Mahindra Lifespace
1,809
440
554
25.8
in short-to-long run, attractive valuations
Massive capacity expansion along with rail advantage at ICD
Navkar Corporation
2,998
212
265
24.9
as well CFS augurs well for the company
Earnings boost on back of stable material prices and
Radico Khaitan
1,212
90
125
38.7
favourable pricing environment. Valuation discount to peers
provides additional comfort
Strong brands and distribution network would boost growth
Siyaram Silk Mills
942
1,029
1,347
30.9
going ahead. Stock currently trades at an inexpensive
valuation.
Source: Company, Angel Research
Market Outlook
August 04, 2016
Key Upcoming Events
Result Calendar
Date
Company
Aug 4, 2016
Siemens, Cummins India, Hindustan Media Ventures, Kirloskar Engines India Ltd, Tata Power Co.
Aug 5, 2016
Tata Chemicals, Bharat Forge, LMW, GlaxoSmith Con, Marico, Quick Heal
Aug 6, 2016
Amara Raja Batteries, Mangalam Cement, Union Bank, Andhra Bank
Aug 8, 2016
Hero Motocorp, Subros, Colgate, Britannia, Vesuvius India, Sterling Tools
Tata Global, Apollo Tyres, JK Tyre, Power Fin.Corpn., Jagran Prakashan, Finolex Cables, Lupin, Adani Power, Team
Aug 9, 2016
Lease Serv., S H Kelkar & Co.
Aug 10, 2016
M&M, Motherson Sumi, Thermax, ITD Cementation
J K Lakshmi Cements, Rural Elec.Corp., Page Industries, MRF, Jyothy Laboratories, MM Forging, Tide Water Oil India,
Aug 11, 2016
Coffee Day Enterprises Ltd
Bosch India, Automotive Axle, St Bk of India, Hindalco, Bajaj Electrical, Cravatex, Sun Pharma, Glenmark Pharma.,
Aug 12, 2016
NHPC
Source: Bloomberg, Angel Research
Global economic events release calendar
Date
Time
Country
Event Description
Unit
Period
Bloomberg Data
Last Reported Estimated
Aug 4, 2016
6:00PM US
Initial Jobless claims
Thousands
Jul 30
266.00
265.00
6:00PM US
Change in Nonfarm payrolls
Thousands
Jul
287.00
180.00
Aug 5, 2016
4:30PM UK
BOE Announces rates
% Ratio
Aug 4
0.50
0.25
6:00PM US
Unnemployment rate
%
Jul
4.90
4.80
Aug 8, 2016
2:00PM UK
Industrial Production (YoY)
% Change
Jun
1.40
--
Aug 9, 2016
China
Exports YoY%
% Change
Jul
(4.80)
(3.00)
7:00AM China
Consumer Price Index (YoY)
% Change
Jul
1.90
1.80
11:00AM India
RBI Reverse Repo rate
%
Aug 9
6.00
--
11:00AM India
RBI Repo rate
%
Aug 9
6.50
--
11:00AM India
RBI Cash Reserve ratio
%
Aug 9
4.00
--
Aug 10, 2016
India
Imports YoY%
% Change
Jul
(7.30)
--
India
Exports YoY%
% Change
Jul
1.30
--
Aug 12, 2016 2:30PM Euro Zone
Euro-Zone GDP s.a. (QoQ)
% Change
2Q P
0.30
--
US
Producer Price Index (mom)
% Change
Jul
0.80
--
7:30AM China
Industrial Production (YoY)
% Change
Jul
6.20
6.20
5:30PM India
Industrial Production YoY
% Change
Jun
1.20
--
12:00PM India
Monthly Wholesale Prices YoY%
% Change
Jul
1.62
--
Aug 16, 2016 11:30AM Germany
GDP nsa (YoY)
% Change
2Q P
1.30
--
6:00PM US
Housing Starts
Thousands
Jul
1,189.00
1,183.00
6:00PM US
Building permits
Thousands
Jul
1,153.00
1,160.00
2:00PM UK
CPI (YoY)
% Change
Jul
0.50
--
6:00PM US
Consumer price index (mom)
% Change
Jul
0.20
0.10
6:45PM US
Industrial Production
%
Jul
0.60
0.20
Aug 17, 2016 2:00PM UK
Jobless claims change
% Change
Jul
0.40
--
Aug 18, 2016 2:30PM Euro Zone
Euro-Zone CPI (YoY)
%
Jul F
0.20
--
Source: Bloomberg, Angel Research
Market Outlook
August 4, 2016
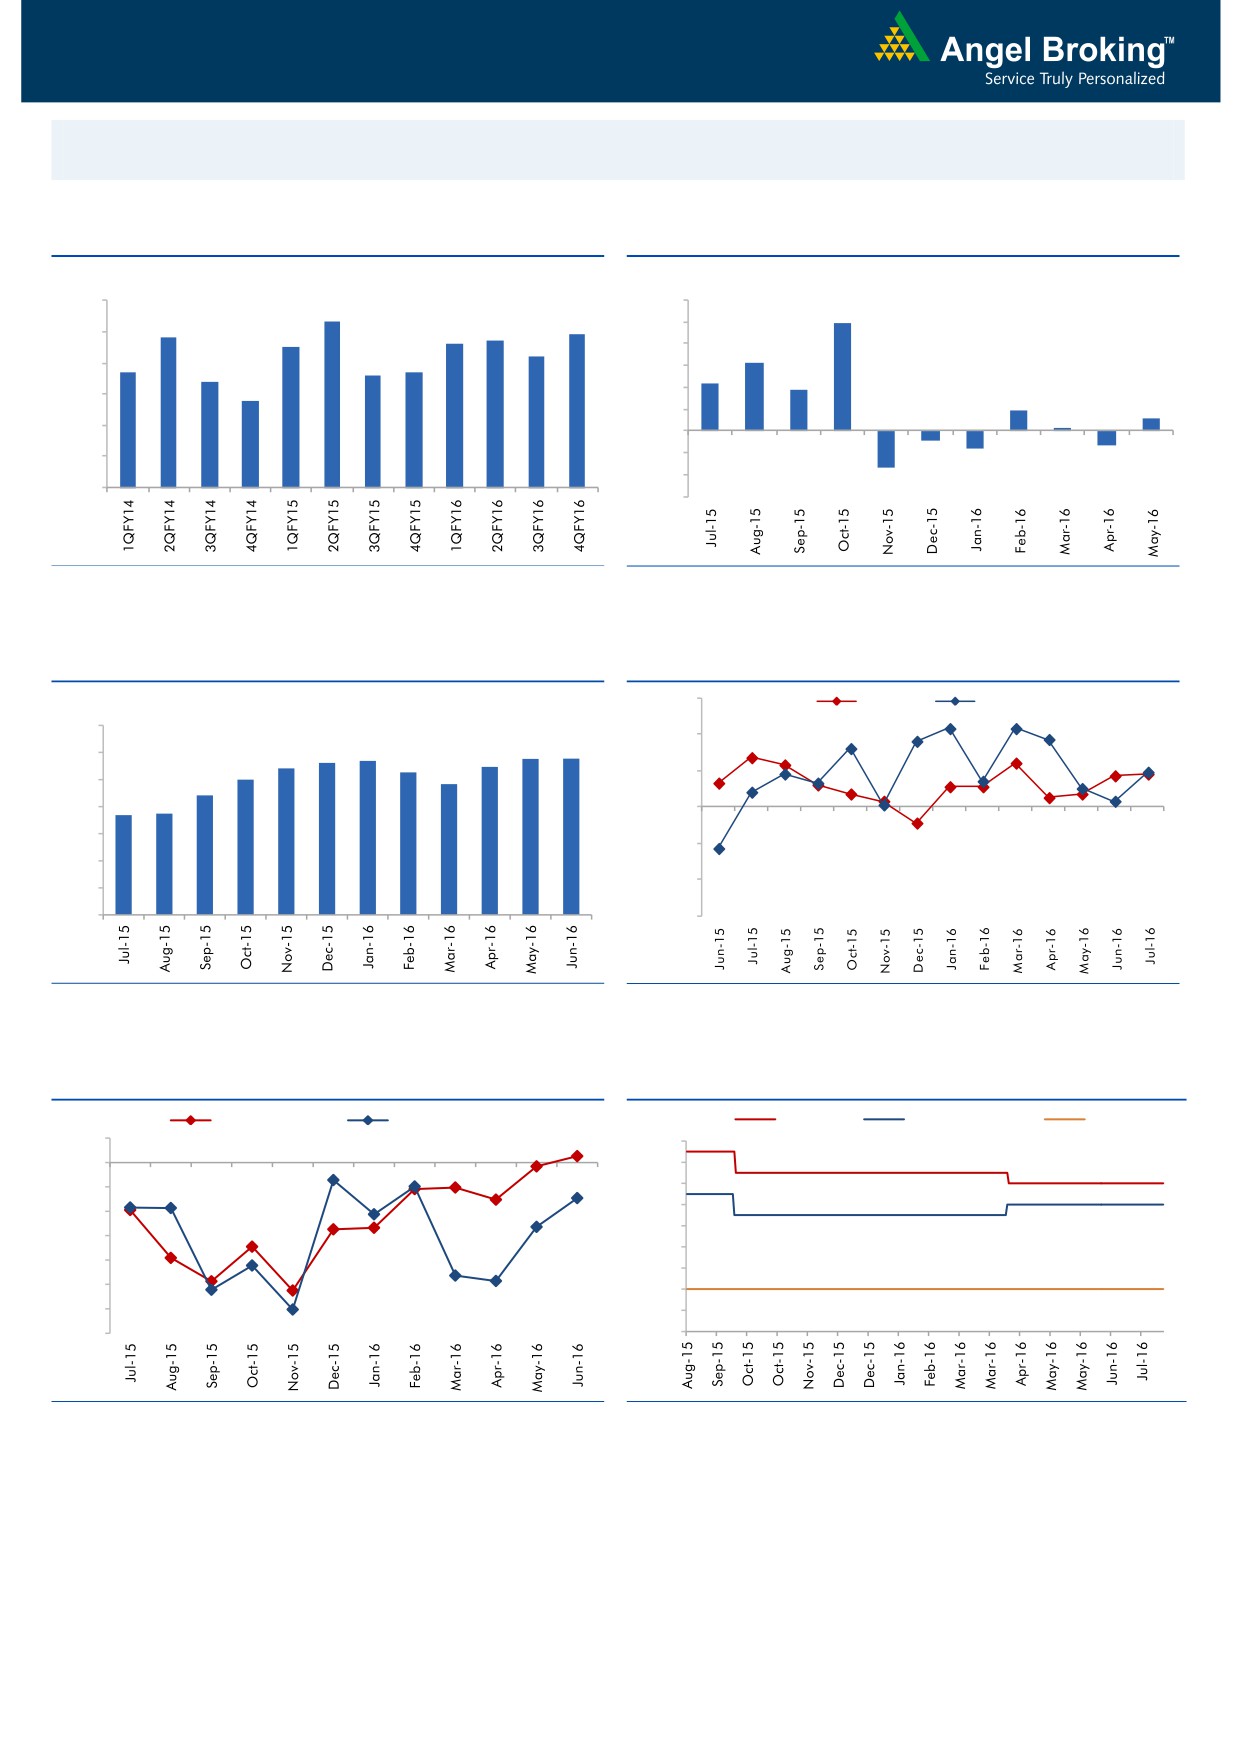
Macro watch
Exhibit 1: Quarterly GDP trends
Exhibit 2: IIP trends
(%)
(%)
9.0
8.3
12.0
9.9
7.8
7.7
7.9
10.0
8.0
7.5
7.6
7.2
8.0
6.3
6.7
6.6
6.7
7.0
6.4
6.0
4.3
3.7
5.8
4.0
6.0
1.9
1.2
2.0
0.3
5.0
-
4.0
(2.0)
(0.9)
(1.3)
(1.6)
(4.0)
3.0
(3.4)
(6.0)
Source: CSO, Angel Research
Source: MOSPI, Angel Research
Exhibit 3: Monthly CPI inflation trends
Exhibit 4: Manufacturing and services PMI
56.0
Mfg. PMI
Services PMI
(%)
7.0
54.0
5.7
5.8
5.8
5.4
5.6
5.5
6.0
5.3
5.0
4.8
52.0
5.0
4.4
3.7
3.7
4.0
50.0
3.0
48.0
2.0
46.0
1.0
-
44.0
Source: MOSPI, Angel Research
Source: Market, Angel Research; Note: Level above 50 indicates expansion
Exhibit 5: Exports and imports growth trends
Exhibit 6: Key policy rates
(%)
Exports yoy growth
Imports yoy growth
(%)
Repo rate
Reverse Repo rate
CRR
5.0
7.50
0.0
7.00
(5.0)
6.50
6.00
(10.0)
5.50
(15.0)
5.00
(20.0)
4.50
(25.0)
4.00
(30.0)
3.50
(35.0)
3.00
Source: Bloomberg, Angel Research
Source: RBI, Angel Research
Market Outlook
August 4, 2016
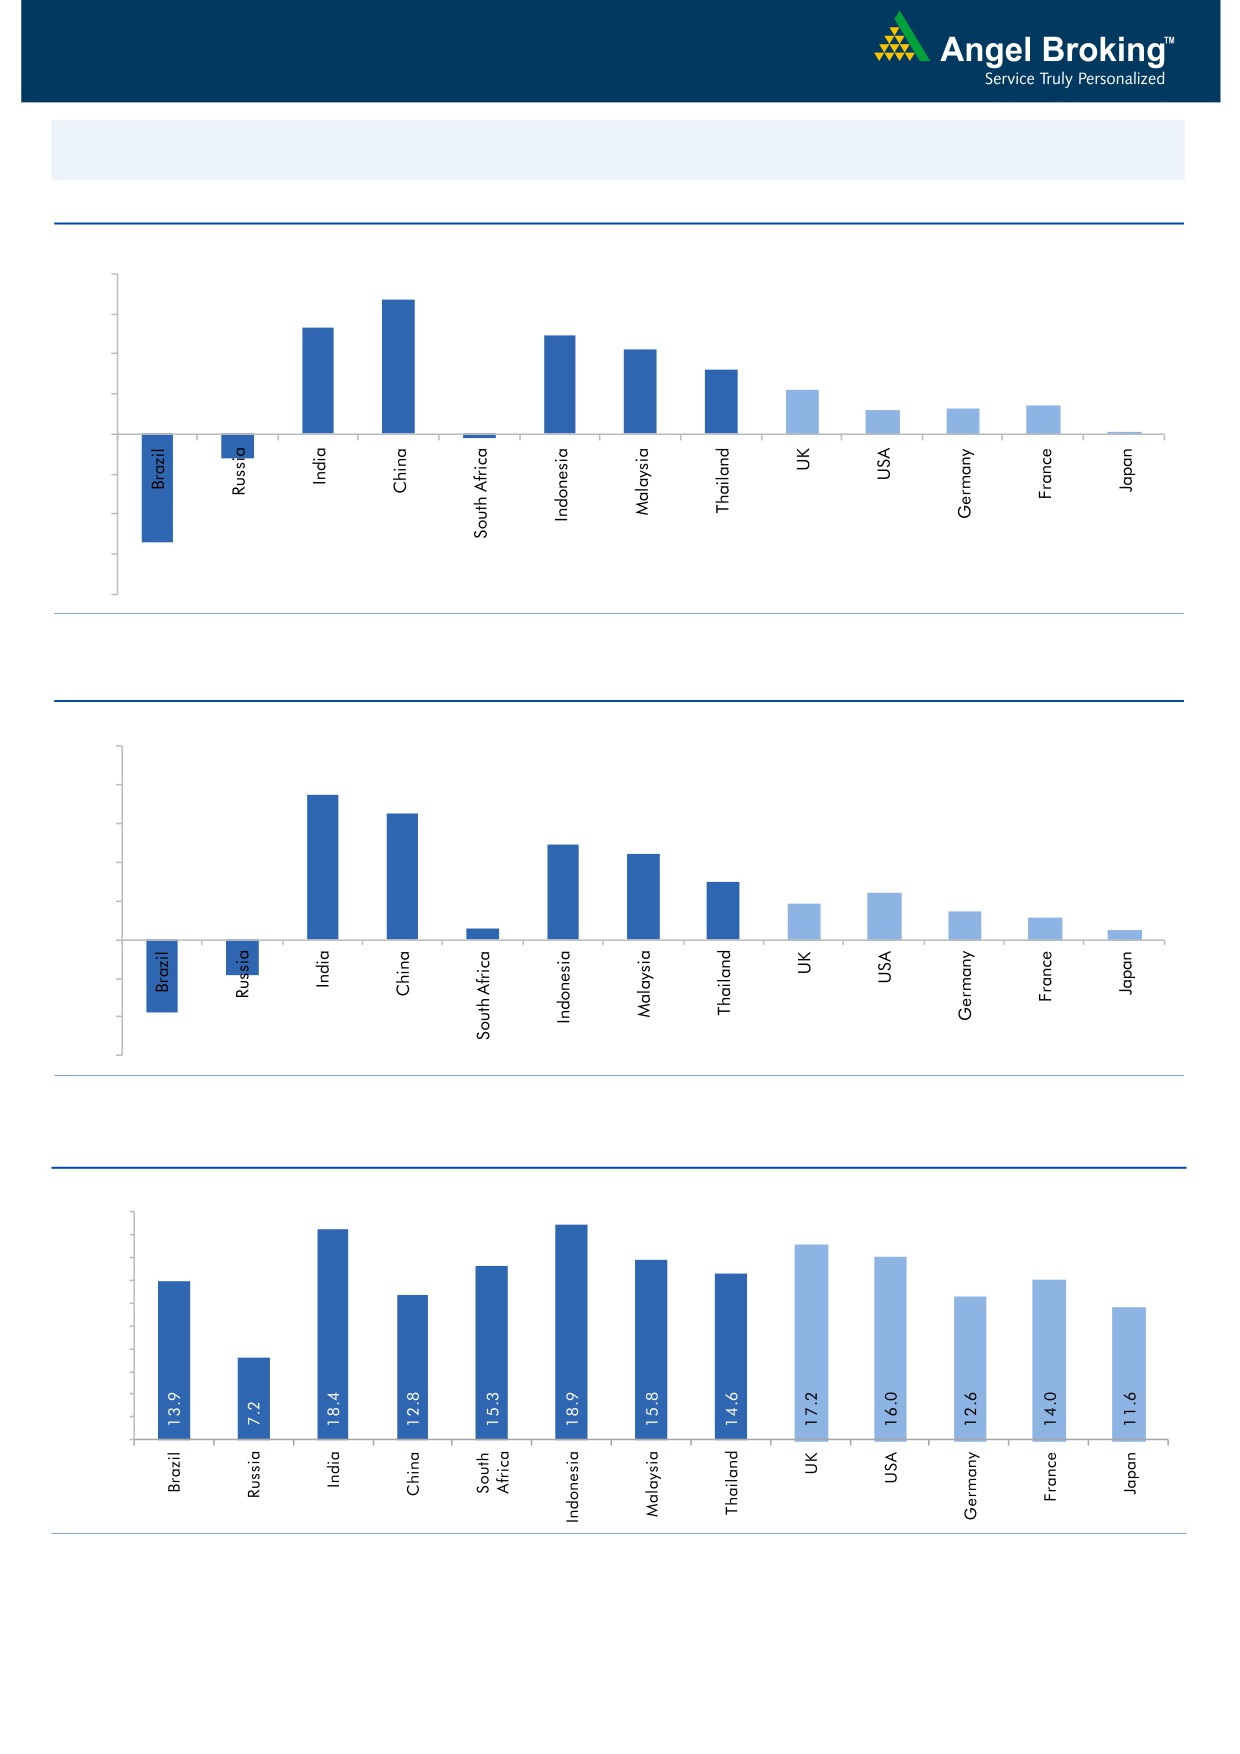
Global watch
Exhibit 1: Latest quarterly GDP Growth (%, yoy) across select developing and developed countries
(%)
8.0
6.7
6.0
5.3
4.9
4.2
4.0
3.2
2.2
1.3
1.4
2.0
1.2
0.1
-
(2.0)
(4.0)
(1.2)
(6.0)
(5.4)
(0.2)
(8.0)
Source: Bloomberg, Angel Research
Exhibit 2: 2016 GDP Growth projection by IMF (%, yoy) across select developing and developed countries
(%)
10.0
7.5
8.0
6.5
6.0
4.9
4.4
4.0
3.0
2.4
1.9
1.5
2.0
1.1
0.6
0.5
(3.8)
(1.8)
-
(2.0)
(4.0)
(6.0)
Source: IMF, Angel Research
Exhibit 3: One year forward P-E ratio across select developing and developed countries
(x)
20.0
18.0
16.0
14.0
12.0
10.0
8.0
6.0
4.0
2.0
-
Source: IMF, Angel Research
Market Outlook
August 4, 2016
Exhibit 4: Relative performance of indices across globe
Returns (%)
Country
Name of index
Closing price
1M
3M
1YR
Brazil
Bovespa
57,077
10.1
6.0
16.5
Russia
Micex
1,919
0.6
(1.7)
15.4
India
Nifty
8,545
2.6
10.9
2.5
China
Shanghai Composite
2,978
(1.5)
(1.0)
(20.5)
South Africa
Top 40
45,560
(1.0)
0.0
(2.1)
Mexico
Mexbol
46,845
1.4
3.8
4.2
Indonesia
LQ45
921
10.9
10.7
11.6
Malaysia
KLCI
1,649
(0.3)
(1.4)
(3.6)
Thailand
SET 50
953
4.9
5.5
(0.0)
USA
Dow Jones
18,355
2.3
3.4
4.6
UK
FTSE
6,634
1.7
8.5
(1.7)
Japan
Nikkei
16,083
2.6
(3.5)
(21.7)
Germany
DAX
10,170
4.7
3.5
(11.5)
France
CAC
4,321
2.0
0.0
(12.3)
Source: Bloomberg, Angel Research
Stock Watch
August 04, 2016
Company Name
Reco
CMP
Target
Mkt Cap
Sales ( Čcr )
OPM(%)
EPS (Č)
PER(x)
P/BV(x)
RoE(%)
EV/Sales(x)
(Č)
Price ( Č)
( Č cr )
FY17E FY18E
FY17E
FY18E
FY17E
FY18E
FY17E
FY18E
FY17E
FY18E
FY17E
FY18E
FY17E
FY18E
Agri / Agri Chemical
Rallis
Neutral
218
-
4,237
1,937
2,164
13.3
14.3
9.0
11.0
24.2
19.8
4.2
3.7
18.4
19.8
2.3
2.0
United Phosphorus
Buy
584
684
25,026
15,176
17,604
18.5
18.5
37.4
44.6
15.6
13.1
3.1
2.5
21.4
21.2
1.8
1.5
Auto & Auto Ancillary
Ashok Leyland
Buy
86
111
24,403
22,407
26,022
10.6
10.6
5.2
6.4
16.4
13.4
3.7
3.1
23.6
24.7
1.2
1.0
Bajaj Auto
Neutral
2,716
-
78,601
25,093
27,891
19.5
19.2
143.9
162.5
18.9
16.7
5.3
4.6
30.3
29.4
2.9
2.5
Bharat Forge
Buy
725
875
16,876
7,726
8,713
20.5
21.2
35.3
42.7
20.5
17.0
3.8
3.4
18.9
20.1
2.3
2.0
Eicher Motors
Neutral
21,368
-
58,039
16,583
20,447
17.5
18.0
598.0
745.2
35.7
28.7
12.2
9.3
41.2
38.3
3.4
2.7
Gabriel India
Neutral
104
-
1,497
1,544
1,715
9.0
9.3
5.4
6.3
19.3
16.5
3.6
3.2
18.9
19.5
0.9
0.8
Hero Motocorp
Neutral
3,237
-
64,641
31,253
35,198
15.3
15.0
172.3
192.1
18.8
16.9
6.9
5.9
38.9
37.0
2.0
1.7
Jamna Auto Industries Neutral
189
-
1,507
1,486
1,620
9.8
9.9
15.0
17.2
12.6
11.0
2.8
2.3
21.8
21.3
1.1
1.0
L G Balakrishnan & Bros Neutral
455
-
714
1,302
1,432
11.6
11.9
43.7
53.0
10.4
8.6
1.5
1.3
13.8
14.2
0.7
0.6
Mahindra and Mahindra Neutral
1,447
-
89,897
46,534
53,077
11.6
11.7
67.3
78.1
21.5
18.5
3.5
3.1
15.4
15.8
1.9
1.7
Maruti
Neutral
4,875
-
147,276
69,186
82,217
14.7
14.4
198.5
241.4
24.6
20.2
4.8
3.9
20.2
20.0
1.9
1.5
Minda Industries
Neutral
1,165
-
1,848
2,728
3,042
9.0
9.1
68.2
86.2
17.1
13.5
3.9
3.1
23.8
24.3
0.7
0.6
Motherson Sumi
Neutral
329
-
43,551
45,896
53,687
7.8
8.3
13.0
16.1
25.3
20.5
8.1
6.5
34.7
35.4
1.1
0.9
Rane Brake Lining
Neutral
570
-
451
511
562
11.3
11.5
28.1
30.9
20.3
18.4
3.1
2.8
15.3
15.0
1.0
1.0
Setco Automotive
Neutral
50
-
669
741
837
13.0
13.0
15.2
17.0
3.3
2.9
0.5
0.5
15.8
16.3
1.3
1.2
Tata Motors
Neutral
479
-
138,340
300,209
338,549
8.9
8.4
42.7
54.3
11.2
8.8
1.8
1.5
15.6
17.2
0.6
0.5
TVS Motor
Accumulate
297
330
14,131
13,390
15,948
6.9
7.1
12.8
16.5
23.3
18.0
5.8
4.6
26.3
27.2
1.1
0.9
Amara Raja Batteries
Buy
914
1,076
15,611
5,717
6,733
18.7
18.9
38.4
48.9
23.8
18.7
5.9
4.8
25.3
24.8
2.6
2.1
Exide Industries
Neutral
174
-
14,777
7,439
8,307
15.0
15.0
8.1
9.3
21.5
18.7
3.0
2.7
14.3
16.7
1.6
1.5
Apollo Tyres
Accumulate
156
183
7,943
12,877
14,504
14.3
13.9
21.4
23.0
7.3
6.8
1.1
1.0
16.4
15.2
0.8
0.8
Ceat
Buy
850
1,119
3,439
7,524
8,624
13.0
12.7
131.1
144.3
6.5
5.9
1.2
1.0
19.8
18.6
0.5
0.5
JK Tyres
Neutral
87
-
1,981
7,455
8,056
15.0
15.0
21.8
24.5
4.0
3.6
0.8
0.7
22.8
21.3
0.4
0.3
Swaraj Engines
Neutral
1,126
-
1,399
660
810
15.2
16.4
54.5
72.8
20.7
15.5
6.4
5.8
31.5
39.2
2.0
1.6
Subros
Neutral
95
-
570
1,488
1,681
11.7
11.9
6.4
7.2
14.8
13.3
1.6
1.4
10.8
11.4
0.6
0.5
Indag Rubber
Neutral
179
-
470
286
326
19.8
16.8
11.7
13.3
15.3
13.4
2.6
2.4
17.8
17.1
1.3
1.2
Capital Goods
ACE
Neutral
46
-
452
709
814
4.1
4.6
1.4
2.1
32.6
21.8
1.3
1.3
4.4
6.0
0.8
0.7
BEML
Buy
974
1,157
4,056
3,451
4,055
6.3
9.2
31.4
57.9
31.0
16.8
1.9
1.7
6.3
10.9
1.3
1.1
Bharat Electronics
Accumulate
1,237
1,414
29,677
8,137
9,169
16.8
17.2
58.7
62.5
21.1
19.8
3.3
2.9
44.6
46.3
2.6
2.4
Stock Watch
August 04, 2016
Company Name
Reco
CMP
Target
Mkt Cap
Sales ( Čcr )
OPM(%)
EPS (Č)
PER(x)
P/BV(x)
RoE(%)
EV/Sales(x)
(Č)
Price ( Č)
( Č cr )
FY17E
FY18E
FY17E
FY18E
FY17E
FY18E
FY17E
FY18E
FY17E
FY18E
FY17E
FY18E
FY17E
FY18E
Capital Goods
Voltas
Accumulate
346
407
11,457
6,511
7,514
7.9
8.7
12.9
16.3
26.8
21.2
4.8
4.2
16.7
18.5
1.6
1.4
BGR Energy
Neutral
120
-
868
16,567
33,848
6.0
5.6
7.8
5.9
15.4
20.4
0.9
0.9
4.7
4.2
0.2
0.1
BHEL
Neutral
133
-
32,602
28,797
34,742
-
2.8
2.3
6.9
57.9
19.3
1.0
1.0
1.3
4.8
0.8
0.6
Blue Star
Neutral
467
-
4,453
4,351
5,024
6.4
7.1
17.2
20.6
27.2
22.6
17.7
14.7
23.1
24.1
1.1
0.9
Crompton Greaves
Neutral
75
-
4,713
5,777
6,120
5.9
7.0
3.3
4.5
22.8
16.7
1.0
1.0
4.4
5.9
0.8
0.7
Greaves Cotton
Neutral
141
-
3,451
1,755
1,881
16.8
16.9
7.8
8.5
18.1
16.6
3.6
3.4
20.6
20.9
1.6
1.5
Inox Wind
Buy
217
286
4,808
5,605
6,267
15.7
16.4
24.8
30.0
8.7
7.2
2.4
1.8
25.9
24.4
0.9
0.8
KEC International
Neutral
144
-
3,711
9,294
10,186
7.9
8.1
9.9
11.9
14.6
12.1
2.1
1.9
15.6
16.3
0.6
0.6
Thermax
Accumulate
852
906
10,149
5,421
5,940
7.3
7.3
25.7
30.2
33.1
28.2
4.0
3.7
12.2
13.1
1.8
1.6
VATech Wabag
Buy
576
681
3,140
3,136
3,845
8.9
9.1
26.0
35.9
22.2
16.1
2.8
2.4
13.4
15.9
0.9
0.7
Cement
ACC
Neutral
1,664
-
31,253
11,225
13,172
13.2
16.9
44.5
75.5
37.4
22.0
3.5
3.3
11.2
14.2
2.8
2.4
Ambuja Cements
Neutral
263
-
40,776
9,350
10,979
18.2
22.5
5.8
9.5
45.3
27.7
3.8
3.4
10.2
12.5
4.4
3.7
India Cements
Neutral
116
-
3,562
4,364
4,997
18.5
19.2
7.9
11.3
14.7
10.3
1.1
1.0
8.0
8.5
1.6
1.4
JK Cement
Neutral
729
-
5,099
4,398
5,173
15.5
17.5
31.2
55.5
23.4
13.1
2.8
2.4
12.0
15.5
1.7
1.4
J K Lakshmi Cement
Neutral
426
-
5,016
2,913
3,412
14.5
19.5
7.5
22.5
56.8
19.0
3.5
2.9
12.5
18.0
2.3
1.9
Mangalam Cements
Neutral
287
-
766
1,054
1,292
9.0
11.0
-
-
-
-
0.7
0.6
Orient Cement
Neutral
166
-
3,401
2,114
2,558
18.5
20.5
8.1
11.3
20.5
14.7
9.0
14.0
2.2
1.7
UltraTech Cement
Neutral
3,674
-
100,820
25,768
30,385
21.0
23.5
111.0
160.0
33.1
23.0
4.2
3.7
13.5
15.8
4.0
3.3
Construction
ITNL
Buy
72
93
2,370
8,946
10,017
31.0
31.6
8.1
9.1
8.9
7.9
0.3
0.3
4.2
5.0
3.6
3.3
KNR Constructions
Neutral
582
-
1,636
1,210
1,595
15.4
16.0
33.9
52.1
17.2
11.2
2.6
2.3
13.6
18.0
1.4
1.1
Larsen & Toubro
Accumulate
1,478
1,700
137,737
67,665
77,249
10.7
11.5
57.3
71.2
25.8
20.8
2.4
2.2
12.6
14.3
2.3
2.0
Gujarat Pipavav Port
Accumulate
169
192
8,187
705
788
52.2
51.7
5.0
5.6
33.9
30.2
3.3
3.0
11.2
11.2
11.4
9.8
MBL Infrastructures
Buy
123
285
510
2,797
3,405
14.7
15.4
21.0
34.8
5.9
3.5
0.6
0.5
11.0
16.2
0.8
0.8
Nagarjuna Const.
Neutral
76
-
4,233
8,842
9,775
9.1
8.8
5.3
6.4
14.4
11.9
1.1
1.0
8.2
9.1
0.7
0.6
PNC Infratech
Accumulate
560
647
2,874
2,350
2,904
13.4
13.7
48.0
42.0
11.7
13.3
2.3
2.0
16.8
13.2
1.4
1.1
Simplex Infra
Neutral
300
-
1,484
6,829
7,954
10.5
10.5
31.4
37.4
9.6
8.0
1.0
0.9
9.9
13.4
0.6
0.5
Power Mech Projects
Neutral
543
-
799
1,801
2,219
12.7
14.6
72.1
113.9
7.5
4.8
1.4
1.2
16.8
11.9
0.5
0.3
Sadbhav Engineering
Accumulate
277
298
4,750
3,598
4,140
10.3
10.6
9.0
11.9
30.8
23.3
3.2
2.8
9.9
11.9
1.6
1.4
NBCC
Neutral
239
-
14,322
7,428
9,549
7.9
8.6
8.2
11.0
29.1
21.7
1.5
1.1
28.2
28.7
1.7
1.3
Stock Watch
August 04, 2016
Company Name
Reco
CMP
Target
Mkt Cap
Sales ( Čcr )
OPM(%)
EPS (Č)
PER(x)
P/BV(x)
RoE(%)
EV/Sales(x)
(Č)
Price ( Č)
( Č cr )
FY17E
FY18E
FY17E
FY18E
FY17E
FY18E
FY17E
FY18E
FY17E
FY18E
FY17E
FY18E
FY17E
FY18E
Construction
MEP Infra
Neutral
43
-
691
1,877
1,943
30.6
29.8
3.0
4.2
14.2
10.1
6.9
4.6
0.6
0.6
1.8
1.6
SIPL
Neutral
100
-
3,522
1,036
1,252
65.5
66.2
(8.4)
(5.6)
3.8
4.3
(22.8)
(15.9)
11.6
9.7
Engineers India
Neutral
216
-
7,286
1,725
1,935
16.0
19.1
11.4
13.9
19.0
15.6
2.6
2.5
13.4
15.3
3.3
3.0
Financials
Axis Bank
Neutral
549
-
131,009
58,081
66,459
3.5
3.5
32.4
44.6
17.0
12.3
2.2
1.9
13.6
16.5
-
-
Bank of Baroda
Neutral
149
-
34,286
19,980
23,178
1.8
1.8
11.5
17.3
12.9
8.6
1.5
1.2
8.3
10.1
-
-
Canara Bank
Neutral
251
-
13,635
15,225
16,836
1.8
1.8
14.5
28.0
17.3
9.0
1.2
1.0
5.8
8.5
-
-
Dewan Housing Finance Buy
224
270
6,542
2,225
2,688
2.9
2.9
29.7
34.6
7.6
6.5
1.2
1.0
16.1
16.8
-
-
Equitas Holdings
Buy
177
235
5,921
939
1,281
11.7
11.5
5.8
8.2
30.4
21.5
2.6
2.3
10.9
11.5
-
-
Federal Bank
Neutral
62
-
10,661
9,353
10,623
2.9
2.9
4.4
5.8
14.1
10.7
1.4
1.2
9.5
11.0
-
-
HDFC
Neutral
1,325
-
209,517
11,475
13,450
3.4
3.4
45.3
52.5
29.3
25.2
5.6
5.0
20.2
20.5
-
-
HDFC Bank
Neutral
1,240
-
313,999
46,097
55,433
4.5
4.5
58.4
68.0
21.2
18.2
3.7
3.1
18.8
18.6
-
-
ICICI Bank
Neutral
242
-
140,770
39,029
45,903
3.3
3.3
16.7
16.3
14.5
14.9
1.8
1.6
10.1
12.4
-
-
LIC Housing Finance
Accumulate
499
582
25,198
3,712
4,293
2.6
2.5
39.0
46.0
12.8
10.9
2.4
2.1
19.9
20.1
-
-
Punjab Natl.Bank
Neutral
122
-
23,868
23,532
23,595
2.3
2.4
6.8
12.6
17.9
9.7
2.8
2.0
3.3
6.5
-
-
South Ind.Bank
Neutral
21
-
2,849
6,435
7,578
2.5
2.5
2.7
3.1
7.8
6.8
1.0
0.8
10.1
11.2
-
-
St Bk of India
Neutral
227
-
175,866
88,650
98,335
2.6
2.6
13.5
18.8
16.8
12.1
1.6
1.4
7.0
8.5
-
-
Union Bank
Neutral
127
-
8,761
13,450
14,925
2.3
2.3
25.5
34.5
5.0
3.7
0.7
0.6
7.5
10.2
-
-
Yes Bank
Neutral
1,235
-
51,991
8,978
11,281
3.3
3.4
74.0
90.0
16.7
13.7
3.2
2.7
17.0
17.2
-
-
FMCG
Asian Paints
Neutral
1,143
-
109,675
17,128
18,978
16.8
16.4
19.1
20.7
59.9
55.2
20.8
19.7
34.8
35.5
6.2
5.6
Britannia
Neutral
2,828
-
33,927
9,795
10,940
14.1
14.1
80.3
93.0
35.2
30.4
14.5
11.2
41.2
-
3.4
3.0
Colgate
Neutral
938
-
25,520
4,605
5,249
22.8
22.8
25.2
28.5
37.2
32.9
25.2
22.5
64.8
66.8
5.7
4.9
Dabur India
Neutral
297
-
52,167
9,405
10,581
18.1
18.3
8.1
9.2
36.6
32.2
10.2
8.5
31.6
31.0
5.3
4.7
GlaxoSmith Con*
Neutral
6,208
-
26,107
4,959
5,623
17.4
18.0
190.5
219.3
32.6
28.3
8.9
7.7
29.6
29.5
4.8
4.1
Godrej Consumer
Neutral
1,566
-
53,340
10,335
11,518
18.4
18.6
41.5
46.0
37.7
34.1
8.5
7.1
24.9
24.8
5.3
4.7
HUL
Neutral
915
-
198,018
35,252
38,495
17.6
17.4
20.4
21.9
44.8
41.8
36.8
32.3
82.2
77.3
5.5
5.0
ITC
Accumulate
253
283
305,090
40,059
44,439
39.0
39.2
9.1
10.1
27.8
25.0
7.6
6.6
27.2
26.5
7.3
6.6
Marico
Neutral
297
-
38,337
6,730
7,649
17.3
17.5
6.4
7.6
46.4
39.1
14.0
11.8
33.2
32.5
5.6
4.8
Nestle*
Neutral
6,808
-
65,644
9,393
10,507
22.2
22.3
106.8
121.8
63.8
55.9
22.4
20.1
34.8
36.7
6.8
6.1
Tata Global
Neutral
136
-
8,568
9,072
9,687
9.4
9.8
7.2
7.8
18.9
17.4
2.1
2.0
7.6
7.9
0.9
0.9
Stock Watch
August 04, 2016
Company Name
Reco
CMP
Target
Mkt Cap
Sales ( Čcr )
OPM(%)
EPS (Č)
PER(x)
P/BV(x)
RoE(%)
EV/Sales(x)
(Č)
Price ( Č)
( Č cr )
FY17E FY18E
FY17E
FY18E
FY17E
FY18E
FY17E
FY18E
FY17E
FY18E
FY17E
FY18E
FY17E
FY18E
FMCG
Procter & Gamble
Accumulate
6,401
7,369
20,777
2,939
3,342
23.2
23.0
146.2
163.7
43.8
39.1
98.0
94.0
25.3
23.5
6.7
5.8
Hygiene
IT
HCL Tech^
Buy
826
1,000
116,514
49,242
57,168
20.5
20.5
55.7
64.1
14.8
12.9
3.0
2.3
20.3
17.9
2.2
1.7
Infosys
Buy
1,085
1,374
249,219
69,934
79,025
27.5
27.5
64.8
72.0
16.7
15.1
3.7
3.4
22.0
22.3
3.0
2.6
TCS
Accumulate
2,656
3,004
523,395
121,684
136,286
27.3
27.3
135.0
150.1
19.7
17.7
6.5
6.0
33.2
33.9
4.1
3.6
Tech Mahindra
Buy
497
700
48,278
30,347
33,685
17.0
17.0
37.5
41.3
13.3
12.0
2.9
2.5
21.8
20.7
1.3
1.1
Wipro
Buy
548
680
135,395
51,631
55,822
21.7
17.9
35.9
36.9
15.3
14.9
3.2
2.9
19.0
18.1
2.3
2.1
Media
D B Corp
Neutral
412
-
7,579
2,187
2,329
27.4
28.2
18.9
21.0
21.8
19.6
4.6
4.0
23.7
23.1
3.3
3.0
HT Media
Neutral
81
-
1,889
2,673
2,891
13.2
13.8
7.2
8.5
11.3
9.6
0.9
0.8
7.8
8.3
0.3
0.2
Jagran Prakashan
Accumulate
182
205
5,935
2,355
2,635
28.0
28.0
9.9
10.8
18.3
16.8
3.6
3.2
21.7
21.7
2.6
2.2
Sun TV Network
Neutral
450
-
17,740
2,850
3,265
70.1
71.0
26.2
30.4
17.2
14.8
4.4
3.9
24.3
25.6
5.9
5.0
Hindustan Media
Neutral
274
-
2,011
1,016
1,138
21.5
21.5
23.3
25.8
11.8
10.6
1.9
1.7
16.2
15.8
1.3
1.1
Ventures
Metals & Mining
Coal India
Neutral
326
-
206,040
84,638
94,297
21.4
22.3
24.5
27.1
13.3
12.0
5.5
5.3
42.6
46.0
1.9
1.7
Hind. Zinc
Neutral
207
-
87,316
14,252
18,465
55.9
48.3
15.8
21.5
13.1
9.6
2.1
1.9
17.0
20.7
6.1
4.7
Hindalco
Neutral
135
-
27,919
107,899
112,095
7.4
8.2
9.2
13.0
14.7
10.4
0.7
0.7
4.8
6.6
0.8
0.7
JSW Steel
Neutral
1,685
-
40,725
53,201
58,779
16.1
16.2
130.6
153.7
12.9
11.0
1.7
1.5
14.0
14.4
1.5
1.3
NMDC
Neutral
100
-
39,726
6,643
7,284
44.4
47.7
7.1
7.7
14.1
13.0
1.2
1.2
8.8
9.2
3.8
3.4
SAIL
Accumulate
46
50
18,978
47,528
53,738
(0.7)
2.1
(1.9)
2.6
17.7
0.5
0.5
(1.6)
3.9
1.3
1.1
Vedanta
Neutral
157
-
46,605
71,744
81,944
19.2
21.7
13.4
20.1
11.7
7.8
1.0
0.9
8.4
11.3
1.0
0.8
Tata Steel
Neutral
358
-
34,731
121,374
121,856
7.2
8.4
18.6
34.3
19.2
10.4
1.2
1.1
6.1
10.1
0.9
0.9
Oil & Gas
Cairn India
Neutral
184
-
34,404
9,127
10,632
4.3
20.6
8.8
11.7
20.9
15.7
0.7
0.7
3.3
4.2
5.2
4.3
GAIL
Neutral
372
-
47,187
56,220
65,198
9.3
10.1
27.1
33.3
13.7
11.2
1.3
1.2
9.3
10.7
1.0
0.9
ONGC
Accumulate
219
235
187,194
137,222
152,563
15.0
21.8
19.5
24.1
11.2
9.1
1.0
0.9
8.5
10.1
1.7
1.5
Petronet LNG
Neutral
306
-
22,916
-
0
-
-
-
-
-
-
Indian Oil Corp
Neutral
552
-
134,059
373,359
428,656
5.9
5.5
54.0
59.3
10.2
9.3
1.6
1.4
16.0
15.6
0.5
0.4
Reliance Industries
Neutral
994
-
322,315
301,963
358,039
12.1
12.6
87.7
101.7
11.3
9.8
1.2
1.1
10.7
11.3
1.6
1.3
Pharmaceuticals
Alembic Pharma
Neutral
622
-
11,722
3,483
4,083
16.2
17.4
18.7
23.7
33.3
26.2
6.2
5.1
20.1
21.3
3.3
2.8
Aurobindo Pharma
Neutral
749
-
43,800
15,720
18,078
23.7
23.7
41.4
47.3
18.1
15.8
4.7
3.7
29.6
26.1
3.1
2.7
Aventis*
Neutral
4,545
-
10,466
2,357
2,692
17.3
17.3
153.5
169.2
29.6
26.9
5.0
4.1
25.8
28.4
4.1
3.4
Cadila Healthcare
Buy
347
400
35,524
11,126
13,148
22.0
22.0
17.1
20.0
20.3
17.4
5.2
4.1
28.8
26.6
3.2
2.6
Stock Watch
August 04, 2016
Company Name
Reco
CMP
Target
Mkt Cap
Sales ( Čcr )
OPM(%)
EPS (Č)
PER(x)
P/BV(x)
RoE(%)
EV/Sales(x)
(Č)
Price ( Č)
( Č cr )
FY17E FY18E
FY17E
FY18E
FY17E
FY18E
FY17E
FY18E
FY17E
FY18E
FY17E
FY18E
FY17E
FY18E
Pharmaceuticals
Cipla
Neutral
529
-
42,541
15,378
18,089
17.4
18.4
21.6
27.2
24.5
19.5
3.2
2.8
13.7
15.2
2.9
2.4
Dr Reddy's
Neutral
2,942
-
50,172
16,043
18,119
23.1
24.7
126.0
157.8
23.4
18.6
3.4
3.0
15.7
17.1
3.1
2.7
Dishman Pharma
Neutral
164
-
2,649
1,718
1,890
21.7
21.8
8.7
10.4
18.9
15.8
1.7
1.5
9.3
10.2
2.0
1.8
GSK Pharma*
Accumulate
3,139
3,505
26,591
3,528
3,811
18.9
19.1
60.1
65.3
52.2
48.1
15.6
15.0
29.9
31.8
7.3
6.8
Indoco Remedies
Neutral
313
-
2,888
1,112
1,289
18.2
18.2
13.2
15.6
23.7
20.1
4.2
3.6
19.2
19.2
2.7
2.3
Ipca labs
Buy
508
613
6,411
3,303
3,799
15.3
15.3
17.3
19.7
29.4
25.8
2.6
2.3
9.1
9.4
2.1
1.8
Lupin
Accumulate
1,680
1,809
75,730
15,912
18,644
26.4
26.7
58.1
69.3
28.9
24.2
5.6
4.6
21.4
20.9
4.9
4.1
Sun Pharma
Accumulate
838
944
201,777
31,129
35,258
30.0
30.9
28.0
32.8
29.9
25.6
4.6
3.8
18.7
18.9
6.0
5.1
Power
Tata Power
Neutral
71
-
19,270
36,916
39,557
17.4
27.1
5.1
6.3
14.0
11.3
1.2
1.1
9.0
10.3
1.5
1.4
NTPC
Neutral
157
-
129,577
86,605
95,545
17.5
20.8
11.8
13.4
13.3
11.7
1.4
1.3
10.5
11.1
2.9
2.9
Power Grid
Neutral
176
-
92,024
25,763
29,762
74.3
73.1
14.8
17.3
11.9
10.2
1.9
1.6
16.9
17.5
7.9
7.5
Real Estate
MLIFE
Buy
440
554
1,807
925
1,139
18.4
22.3
18.3
33.8
24.1
13.0
1.1
1.1
4.9
8.5
2.7
2.1
Telecom
Bharti Airtel
Neutral
357
-
142,887
105,086
114,808
34.5
34.7
12.2
16.4
29.3
21.8
2.0
1.9
6.8
8.4
2.3
2.0
Idea Cellular
Neutral
105
-
37,664
40,133
43,731
37.2
37.1
6.4
6.5
16.3
16.1
1.4
1.3
8.2
7.6
2.0
1.7
zOthers
Abbott India
Neutral
4,660
-
9,902
3,153
3,583
14.1
14.4
152.2
182.7
30.6
25.5
150.3
128.4
25.6
26.1
2.9
2.5
Bajaj Electricals
Neutral
272
-
2,748
5,351
6,098
5.7
5.9
12.4
15.7
22.0
17.3
3.2
2.8
14.4
16.1
0.5
0.4
Finolex Cables
Neutral
385
-
5,887
2,883
3,115
12.0
12.1
14.2
18.6
27.1
20.7
14.4
12.6
15.8
14.6
1.8
1.6
Goodyear India*
Buy
520
631
1,200
1,598
1,704
10.4
10.2
49.4
52.6
10.5
9.9
48.6
42.7
18.2
17.0
0.4
56.8
Hitachi
Neutral
1,355
-
3,685
2,081
2,433
8.8
8.9
33.4
39.9
40.6
34.0
32.7
27.3
22.1
21.4
1.8
1.5
Jyothy Laboratories
Neutral
287
-
5,189
1,440
2,052
11.5
13.0
8.5
10.0
33.7
28.7
8.2
7.6
18.6
19.3
3.9
2.7
MRF
Buy
34,671
45,575
14,704
-
0
-
-
-
-
-
-
Page Industries
Neutral
13,954
-
15,565
2,450
3,124
20.1
17.6
299.0
310.0
46.7
45.0
310.8
237.2
47.1
87.5
6.8
5.3
Relaxo Footwears
Neutral
480
-
5,764
2,085
2,469
9.2
8.2
7.6
8.0
63.5
60.4
24.6
21.0
17.9
18.8
2.9
2.4
Siyaram Silk Mills
Buy
1,029
1,347
965
1,799
2,040
11.6
11.7
104.9
122.4
9.8
8.4
1.6
1.4
16.4
16.4
0.8
0.7
Styrolution ABS India*
Accumulate
599
643
1,053
1,440
1,537
9.2
9.0
40.6
42.6
14.8
14.1
37.7
34.2
12.3
11.6
0.7
0.6
TVS Srichakra
Buy
2,327
2,932
1,782
2,304
2,614
13.7
13.8
231.1
266.6
10.1
8.7
261.5
205.9
33.9
29.3
0.8
0.7
HSIL
Neutral
300
-
2,168
2,384
2,515
15.8
16.3
15.3
19.4
19.6
15.5
19.5
16.8
7.8
9.3
1.1
1.0
Kirloskar Engines India
Neutral
270
-
3,905
2,554
2,800
9.9
10.0
10.5
12.1
25.7
22.3
10.8
10.2
10.7
11.7
1.2
1.1
Ltd
M M Forgings
Buy
440
546
531
546
608
20.4
20.7
41.3
48.7
10.7
9.0
60.3
53.4
16.6
17.0
0.8
0.7
Stock Watch
August 04, 2016
Company Name
Reco
CMP
Target
Mkt Cap
Sales ( Čcr )
OPM(%)
EPS (Č)
PER(x)
P/BV(x)
RoE(%)
EV/Sales(x)
(Č)
Price ( Č)
( Č cr )
FY17E
FY18E
FY17E
FY18E
FY17E
FY18E
FY17E
FY18E
FY17E
FY18E
FY17E
FY18E
FY17E
FY18E
zOthers
Banco Products (India) Neutral
199
-
1,425
1,353
1,471
12.3
12.4
14.5
16.3
13.7
12.2
19.0
17.1
14.5
14.6
1.0
106.6
Competent Automobiles Neutral
160
-
98
1,137
1,256
3.1
2.7
28.0
23.6
5.7
6.8
30.8
27.8
14.3
11.5
0.1
0.1
Nilkamal
Neutral
1,159
-
1,729
1,995
2,165
10.7
10.4
69.8
80.6
16.6
14.4
66.2
57.5
16.6
16.5
0.9
0.8
Visaka Industries
Neutral
155
-
246
1,051
1,138
10.3
10.4
21.0
23.1
7.4
6.7
19.9
18.6
9.0
9.2
0.5
0.5
Transport Corporation of
Neutral
354
-
2,708
2,671
2,911
8.5
8.8
13.9
15.7
25.5
22.6
3.5
3.1
13.7
13.8
1.2
1.1
India
Elecon Engineering
Accumulate
56
63
615
1,482
1,660
13.7
14.5
3.9
5.8
14.5
9.7
3.4
3.1
7.8
10.9
0.7
0.7
Surya Roshni
Buy
167
201
732
3,342
3,625
7.8
7.5
17.3
19.8
9.7
8.5
18.3
14.7
10.5
10.8
0.5
0.4
MT Educare
Accumulate
146
159
582
366
417
17.7
18.2
9.4
10.8
15.6
13.5
3.5
3.0
22.2
22.3
1.5
1.3
Radico Khaitan
Buy
90
125
1,199
1,659
1,802
13.0
13.2
6.3
7.4
14.2
12.2
1.2
1.1
8.6
9.3
1.2
1.1
Garware Wall Ropes
Neutral
458
-
1,002
898
997
11.9
11.7
29.0
32.9
15.8
13.9
2.4
2.0
14.9
14.6
1.0
0.9
Wonderla Holidays
Neutral
398
-
2,250
287
355
38.0
40.0
11.3
14.2
35.2
28.0
5.1
4.4
21.4
23.9
7.5
6.1
Linc Pen & Plastics
Neutral
260
-
384
382
416
9.1
9.1
13.1
14.7
19.9
17.7
3.3
2.9
16.7
16.3
1.1
1.0
The Byke Hospitality
Neutral
161
-
644
287
384
20.5
20.5
7.6
10.7
21.1
15.0
4.4
3.6
20.7
23.5
2.3
1.7
Interglobe Aviation
Buy
863
999
31,093
21,122
26,005
14.5
27.6
110.7
132.1
7.8
6.5
46.6
33.3
168.5
201.1
1.5
1.1
Coffee Day Enterprises
Neutral
237
-
4,887
2,964
3,260
20.5
21.2
4.7
8.0
-
29.7
2.7
2.5
5.5
8.5
2.1
1.9
Ltd
Navneet Education
Neutral
95
-
2,271
1,062
1,147
24.0
24.0
6.1
6.6
15.7
14.4
3.2
2.9
20.6
19.8
2.2
2.1
Navkar Corporation
Buy
212
265
3,026
408
612
42.9
42.3
6.8
11.5
31.3
18.5
2.2
1.9
6.9
10.5
8.3
5.5
UFO Moviez
Neutral
530
-
1,462
619
685
33.2
33.4
30.0
34.9
17.7
15.2
2.5
2.1
13.8
13.9
2.3
1.9
VRL Logistics
Neutral
327
-
2,988
1,902
2,119
16.7
16.6
14.6
16.8
22.5
19.5
4.9
4.3
21.9
22.2
1.7
1.5
Team Lease Serv.
Neutral
1,061
-
1,814
3,229
4,001
1.5
1.8
22.8
32.8
46.6
32.3
5.0
4.3
10.7
13.4
0.5
0.4
S H Kelkar & Co.
Neutral
250
-
3,611
1,036
1,160
15.1
15.0
6.1
7.2
40.9
34.8
4.4
4.0
10.7
11.5
3.4
3.0
Quick Heal
Neutral
259
-
1,814
408
495
27.3
27.0
7.7
8.8
33.5
29.5
3.1
3.1
9.3
10.6
3.7
3.1
Narayana Hrudaya
Neutral
324
-
6,617
1,873
2,166
11.5
11.7
2.6
4.0
122.4
81.7
7.5
6.8
6.1
8.3
3.7
3.2
Manpasand Bever.
Neutral
678
-
3,395
836
1,087
19.6
19.4
16.9
23.8
40.1
28.5
4.8
4.2
12.0
14.8
3.8
2.8
Parag Milk Foods
Neutral
317
-
2,663
1,919
2,231
9.3
9.6
9.5
12.9
33.5
24.5
5.2
4.3
15.5
17.5
1.5
1.3
Source: Company, Angel Research; Note: *December year end; #September year end; &October year end; Price as on August 03, 2016
Market Outlook
August 04, 2016
Research Team Tel: 022 - 39357800
DISCLAIMER
Angel Broking Private Limited (hereinafter referred to as “Angel”) is a registered Member of National Stock Exchange of India
Limited,Bombay Stock Exchange Limited and Metropolitan Stock Exchange Limited. It is also registered as a Depository Participant with
CDSL and Portfolio Manager with SEBI. It also has registration with AMFI as a Mutual Fund Distributor. Angel Broking Private Limited is a
registered entity with SEBI for Research Analyst in terms of SEBI (Research Analyst) Regulations, 2014 vide registration number
INH000000164. Angel or its associates has not been debarred/ suspended by SEBI or any other regulatory authority for accessing
/dealing in securities Market. Angel or its associates/analyst has not received any compensation / managed or
co-managed public offering of securities of the company covered by Analyst during the past twelve months.
This document is solely for the personal information of the recipient, and must not be singularly used as the basis of any investment
decision. Nothing in this document should be construed as investment or financial advice. Each recipient of this document should make
such investigations as they deem necessary to arrive at an independent evaluation of an investment in the securities of the companies
referred to in this document (including the merits and risks involved), and should consult their own advisors to determine the merits and
risks of such an investment.
Reports based on technical and derivative analysis center on studying charts of a stock's price movement, outstanding positions and
trading volume, as opposed to focusing on a company's fundamentals and, as such, may not match with a report on a company's
fundamentals. Investors are advised to refer the Fundamental and Technical Research Reports available on our website to evaluate the
contrary view, if any.
The information in this document has been printed on the basis of publicly available information, internal data and other reliable
sources believed to be true, but we do not represent that it is accurate or complete and it should not be relied on as such, as this
document is for general guidance only. Angel Broking Pvt. Limited or any of its affiliates/ group companies shall not be in any way
responsible for any loss or damage that may arise to any person from any inadvertent error in the information contained in this report.
Angel Broking Pvt. Limited has not independently verified all the information contained within this document. Accordingly, we cannot
testify, nor make any representation or warranty, express or implied, to the accuracy, contents or data contained within this document.
While Angel Broking Pvt. Limited endeavors to update on a reasonable basis the information discussed in this material, there may be
regulatory, compliance, or other reasons that prevent us from doing so.
This document is being supplied to you solely for your information, and its contents, information or data may not be reproduced,
redistributed or passed on, directly or indirectly.
Neither Angel Broking Pvt. Limited, nor its directors, employees or affiliates shall be liable for any loss or damage that may arise from
or in connection with the use of this information.