Market Outlook
August 03, 2016
Market Cues
Domestic Indices
Chg (%)
(Pts)
(Close)
Indian markets are expected to open in red tracking SGX Nifty.
BSE Sensex
(0.1)
(21)
27,982
U.S. stocks bounced off session lows but still closed lower Tuesday, marking 7th
Nifty
(0.2)
(14)
8,623
straight daily loss for Dow and ending 5-day win streak for Nasdaq, as investors
Mid Cap
(0.6)
(79)
12,630
sifted through quarterly results as well as data on personal income and inflation. For
Small Cap
(0.8)
(102)
12,220
Dow Pfizer Inc. led the decline. The 7th day of losses for blue-chip gauge marks its
Bankex
(0.2)
(46)
21,376
longest losing streak in about a year, according to FactSet. S&P 500 closed in red,
with 9 of the 10 main sectors trading lower, led by the Consumer-discretionary and
Industrials. Energy stocks gained 0.1% following Monday’s ugly selloff.
Global Indices
Chg (%)
(Pts)
(Close)
Dow Jones
(0.5)
(91)
18,314
London markets fell as Banking sector stocks remained under pressure. Notably,
Barclays and RBS fell 3.57% and 1.75%, respectively. Sentiment in Banking sector
Nasdaq
(0.9)
(46)
5,138
was hit by news from Germany's Commerzbank, which saw its shares fall 8% after
FTSE
(0.7)
(49)
6,645
warning of lower profits this year.
Nikkei
(1.5)
(244)
16,391
After trading high from opening, equity benchmarks lost shine in afternoon trade to
Hang Seng
1.1
238
22,129
close marginally lower on Tuesday, especially due to selling in the European stocks.
Shanghai Com
0.6
18
2,971
Markets remained in consolidation mode as investors still eagerly waited for the GST
bill that is likely to be tabled in Rajya Sabha on Wednesday. Experts feel market may
Advances / Declines
BSE
NSE
continue to consolidate till the verdict of GST bill.
Advances
970
484
News Analysis & Result Review
Declines
1,798
1,137
Results Preview: HCL Tech, Cadila Healthcare
Unchanged
128
70
Results Review: Voltas
Govt. to accelerate rural road building pace to 133 km/day
Volumes (` Cr)
Detailed analysis on Pg2
BSE
3,724
Investor’s Ready Reckoner
NSE
23,091
Key Domestic & Global Indicators
Stock Watch: Latest investment recommendations on 150+ stocks
Net Inflows (` Cr)
Net
Mtd
Ytd
Refer Pg6 onwards
FII
656
656
31,538
MFs
59
59
9,129
Top Picks
CMP
Target
Upside
Company
Sector
Rating
(`)
(`)
(%)
Top Gainers
Price (`)
Chg (%)
Amara Raja
Auto/Auto Ancillary
Buy
921
1,076
16.8
Indianb
186
20.0
HCL Tech
IT
Buy
801
1,000
24.9
Idfc
58
7.6
LIC Housing
Financials
Accumulate
512
582
13.6
Kansainer
369
6.5
Bharat Electronics
Capital Goods
Accumulate
1,240
1,414
14.1
Tatacomm
460
6.3
Navkar Corporation Others
Buy
212
265
25.3
More Top Picks on Pg5
Gmdcltd
86
5.2
Key Upcoming Events
Top Losers
Price (`)
Chg (%)
Previous
Consensus
Date
Region
Event Description
Reading
Expectations
Bharatfin
822
(9.7)
Aug 3 Germany
PMI Services
54.6
54.6
Jpinfratec
9
(6.9)
Aug 4
US
Initial Jobless claims
266.0
265.0
Jindalstel
84
(6.4)
Aug 4
US
Change in Nonfarm payrolls
287.0
175.0
Vedl
156
(5.9)
Aug 5
UK
BOE Announces rates
0.50
0.25
Jetairways
577
(5.2)
Aug 5
US
Unemployment rate
4.9
4.8
6.(
As on August 2, 2016
More Events on Pg6
Market Outlook
August 03, 2016
Result Preview
HCL Tech (CMP: `801 / TP: `1,000 /Upside: 24.8%)
For 1QFY2017, the company is expected to post sales of `11,219cr expected V/s
`10,698cr in 3QFY2016 (the company had changed its Financial year to March),
a QoQ growth of 4.9%. In US$ terms, it came in at US$1,674mn expected and
V/s US$1,587mn, a QoQ growth of 5.5%. On the operating profit front, the EBIT
margins are expected to come in at 19.4% V/s 20.8% in 3QFY2016, QoQ dip of
136bps. Thus, the Adj. net profit is expected to come in at `1,891cr V/s `1,925cr
in 3QFY2016, a QoQ de-growth of 1.8%. We maintain our buy rating.
Y/E
Sales OPM
PAT
EPS ROE P/E P/BV EV/EBITDA EV/Sales
Mar
(` cr)
(%)
(` cr)
(`)
(%)
(x)
(x)
(x)
(x)
FY2017E
49,242
20.5
7,862
55.7
20.3
14.4
2.9
8.8
1.8
FY2018E
57,168
20.5
9,037
64.1
17.9
12.5
2.2
6.6
1.4
Cadila Healthcare (CMP: `348 / TP: `400 /Upside: 14.9%)
For 1QFY2017, the company is expected to post sales of `2,607cr expected V/s
`2,378cr in 1QFY2016, a yoy growth of 9.6%. On the operating profit front, the
EBITDA margins are expected to come in at 20.9% v/s 20.1% in 1QFY2016. Thus,
the Adj. net profit is expected to come in at `489cr V/s `352cr in 1QFY2016, a
yoy growth of 39.1%. We maintain our buy rating.
Y/E
Sales OPM
PAT
EPS ROE P/E P/BV EV/EBITDA EV/Sales
Mar
(` cr)
(%)
(` cr)
(`)
(%)
(x)
(x)
(x)
(x)
FY2017E
11,126
22.0
1,752
17.1
28.8
20.3
5.2
14.3
3.2
FY2018E
13,148
22.0
2,044
20.0
26.6
17.4
4.2
11.6
2.6
Result Review
Voltas (CMP: `365 / TP: `407 /Upside: 11.4%)
Voltas reported impressive set of 1Q numbers. Voltas reported better than
expected top-line numbers mainly driven by strong execution seen across their EMP
& and sales across their UCP segment. Voltas reported top-line growth of 18.2%
yoy to `1,845cr. UCP segment impressed us with 28.9% yoy increase in top-line to
`1,195cr (65% of 1QFY2017 revenues). Also, EMP and EPS segments reported
better than expected top-line numbers at `580cr and `69cr, respectively. Higher
than expected contribution from UCP segment led to surprise on the EBITDA
margin front at 10.3% for 1QFY2017. Also, EMP segment maintained its last
year’s turn-around momentum, with 1.9% EBIT margin, against 1.5% margins in
1QFY2016. Better than expected sales at UCP segment, coupled with higher other
income helped the company report Core business PAT of `158cr, which is up
53.7% on yoy basis. On considering the impact of comprehensive other income
(includes `21cr of gain on revaluation of longer term equity investments) and
exceptional item (~`1cr), PAT grew 87.3% yoy to Rs184cr. Another, positive
emerging from results is `731cr of order wins from the Middle East markets. Order
book for EMP segment at 1QFY2017-end, stood at `4,417cr (OB to LTM ratio of
1.2x). Gfk Nielsen report also indicates that Voltas continues to retain its top slot in
the domestic AC sales market. Strong sales of Voltas AC, gradual improvement in
their EMP segment business, comforts us that Voltas stock is poised to get re-rated
Market Outlook
August 03, 2016
from here-on. We continue to maintain Accumulate on Voltas with price target
of `407.
Govt. to accelerate rural road building pace to 133 km/day
Government plans to increase the pace of construction of Rural Roads to 133
km/day as it aims to build 50,000kms of new roads with an investment of
`33,000cr. Pradhan Mantri Gram Sadak Yojana (PMGSY), is Central Government
flagship program, to construct Rural roads. Pace of rural roads construction was
100km/day during 2014-2016, vs average of 73km/day during 2007-14. The
Rural Development Ministry has highlighted that they would use technology to
identify roads which can be developed under the PMGSY. Also, states not using
these funds would be asked to repay back the unutilized funds to the Centre.
We see this to be a positive announcement from the government side, however, it
needs to be seen which all state governments make the maximum utilization of this
opportunity. If we look at the positives, then this initiative could add to temporary
rural job creation, which further could increase their disposable incomes.
On a whole, this is a positive development for the rural economy and would also
benefit smaller regional private road EPC players.
Economic and Political News
Pulses output down 4% in 2015-16, food grains slightly up
4 million tax arrears cases may get waiver
Govt to slap anti-dumping duty of $557/tn on steel import from 6 nations
Corporate News
Infosys to bet closer home, $15mn for Indian Venture Capital fund
TCS inks two big-ticket office lease deals
ONGC goes for market price for gas from two fields
RIL financials to be adversely affected by report: CAG
Market Outlook
August 03, 2016
Quarterly Bloomberg Brokers Consensus Estimate
HCL Technologies Ltd- Aug 3, 2016
Particulars (` cr)
1QFY17E
1QFY16
y-o-y (%)
4QFY16
q-o-q (%)
Net sales
10,780
9,777
10.3
10,698
0.8
EBITDA
2,388
2,100
13.7
2,379
0.4
EBITDA margin (%)
22.1
21.5
22.2
Net profit
1,920
1,783
7.7
1,926
(0.3)
Cadila Healthcare Ltd- Aug 3, 2016
Particulars (` cr)
1QFY17E
1QFY16
y-o-y (%)
4QFY16
q-o-q (%)
Net sales
2509.5
2421.7
3.6
2375.5
5.6
EBITDA
561.7
620.33
(9.5)
606.3
(7.4)
EBITDA margin (%)
22.4
25.6
22.2
Net profit
385.7
353.4
9.1
388.7
(0.8)
Tata Power Co Ltd (Consol.) - Aug 4, 2016
Particulars (` cr)
1QFY17E
1QFY16
y-o-y (%)
4QFY16
q-o-q (%)
Net sales
9,250
9,235
0.2
9,375
(1.3)
EBITDA
2,000
2,181
(8.3)
1,913
4.5
EBITDA margin (%)
21.6
23.6
20.4
Net profit
337
241
39.6
360
(6.5)
Siemens Ltd- Aug 4, 2016
Particulars (` cr)
3QSY16E
3QSY15
y-o-y (%)
2QSY16
q-o-q (%)
Net sales
2,502
2,322
7.7
2,725
(8.2)
EBITDA
273
253
7.7
306
(11.0)
EBITDA margin (%)
10.9
10.9
11.2
Net profit
164
168
(2.5)
177
(7.5)
Cummins India Ltd- Aug 4, 2016
Particulars (` cr)
1QFY17E
1QFY16
y-o-y (%)
4QFY16
q-o-q (%)
Net sales
1,307
1,282
1.9
1,038
25.9
EBITDA
204
218
(6.6)
171
19.2
EBITDA margin (%)
15.6
17.0
16.5
Net profit
198
211
(5.9)
164
20.9
Market Outlook
August 03, 2016
Top Picks
Large Cap
M
arket Cap
CM
P
T
arget
Upsid
e
Company
Rationale
(` Cr)
(`)
(`)
(%)
To outpace battery industry growth due to better technological
Amara Raja Batteries
15,778
921
1,076
16.8
products leading to market share gains in both the automotive
OEM and replacement segments.
Uptick in defense capex by government, coupled with BELs
Bharat Electronics
29,777
1,240
1,414
14.1
strong market positioning, indicate good times ahead for BEL.
HCL Tech
1,10,166
801
1,000
24.9
Stock is trading at attractive valuations & factors all bad news.
Back on the growth trend, expect a long term growth of 14% to
Infosys
2,49,219
1,084
1,374
26.7
be a US$20bn in FY2020.
Continues to grow its retail loan book at healthy pace with
LIC Housing Fin.
26,336
512
582
13.6
improvement in asset quality. Expect LICHF to post a healthy
loan book which is likely to reflect in a strong earnings growth.
Strong market positioning within the domestic AC markets to
Voltas
12,266
365
407
11.4
continue, EMP business set to revive
Source: Company, Angel Research
Mid Cap
M
arket Cap
CM
P
T
arget
Upsid
e
Company
Rationale
(` Cr)
(`)
(`)
(%)
With a focus on the low and medium income (LMI) consumer
Dewan Housing
6,509
224
270
20.4
segment, the company has increased its presence in tier-II & III
cities where the growth opportunity is immense.
Strong loan growth backed by diversified loan portfolio and
Equitas Holdings
6,541
185
235
27.0
adequate CAR. ROE & ROA likely to remain decent as risk of
dilution remains low. Attractive valuations considering growth.
Expectations of above average monsoon augurs well for
Goodyear India
1,208
522
631
20.9
Goodyear India as it derives ~50% of its turnover from farm
tyre segment.
Commencement of new projects, downtrend in the interest rate
IL&FS Transport
2,357
73
93
27.0
cycle, to lead to stock re-rating
Economic recovery to have favourable impact on advertising &
Jagran Prakashan
5,897
183
205
12.2
circulation revenue growth. Further, the acquisition of a radio business
(Radio City) would also boost the company`s revenue growth.
Speedier execution and speedier sales, strong revenue visibility
Mahindra Lifespace
1,809
442
554
25.2
in short-to-long run, attractive valuations
Massive capacity expansion along with rail advantage at ICD
Navkar Corporation
2,998
212
265
25.3
as well CFS augurs well for the company
Earnings boost on back of stable material prices and
Radico Khaitan
1,212
90
125
38.6
favourable pricing environment. Valuation discount to peers
provides additional comfort
Strong brands and distribution network would boost growth
Siyaram Silk Mills
942
1,028
1,347
31.0
going ahead. Stock currently trades at an inexpensive
valuation.
Source: Company, Angel Research
Market Outlook
August 03, 2016
Key Upcoming Events
Result Calendar
Date
Company
Aug 3, 2016
Ramco Cements, HCL Tech, Cadila Healthcare, Dishman Pharma, The Byke Hospitality
Aug 4, 2016
Siemens, Cummins India, Hindustan Media Ventures, Kirloskar Engines India Ltd, Tata Power Co.
Aug 5, 2016
Bharat Forge, LMW, GlaxoSmith Con, Quick Heal
Aug 6, 2016
Amara Raja Batteries, Mangalam Cement, Union Bank, Andhra Bank
Aug 8, 2016
Hero Motocorp, Subros, Colgate, Britannia, Vesuvius India, Sterling Tools
Aug 9, 2016
Apollo Tyres, Finolex Cables, Lupin, Team Lease Serv., S H Kelkar & Co.
Aug 10, 2016
M&M, Motherson Sumi, Thermax, ITD Cementation
Rural Elec.Corp., Page Industries, MRF, Jyothy Laboratories, MM Forging, Tide Water Oil India, Coffee Day Enterprises
Aug 11, 2016
Ltd
Aug 12, 2016
Automotive Axle, Hindalco, Bajaj Electrical, Cravatex, Sun Pharma, NHPC
Source: Bloomberg, Angel Research
Global economic events release calendar
Date
Time
Country
Event Description
Unit
Period
Bloomberg Data
Last Reported Estimated
Aug 3, 2016
1:25PM Germany
PMI Services
Value
Jul F
54.60
54.60
Aug 4, 2016
6:00PM US
Initial Jobless claims
Thousands
Jul 30
266.00
265.00
6:00PM US
Change in Nonfarm payrolls
Thousands
Jul
287.00
180.00
Aug 5, 2016
4:30PM UK
BOE Announces rates
% Ratio
Aug 4
0.50
0.25
6:00PM US
Unnemployment rate
%
Jul
4.90
4.80
Aug 8, 2016
2:00PM UK
Industrial Production (YoY)
% Change
Jun
1.40
--
Aug 9, 2016
China
Exports YoY%
% Change
Jul
(4.80)
(3.00)
7:00AM China
Consumer Price Index (YoY)
% Change
Jul
1.90
1.80
11:00AM India
RBI Reverse Repo rate
%
Aug 9
6.00
--
11:00AM India
RBI Repo rate
%
Aug 9
6.50
--
11:00AM India
RBI Cash Reserve ratio
%
Aug 9
4.00
--
Aug 10, 2016
India
Imports YoY%
% Change
Jul
(7.30)
--
India
Exports YoY%
% Change
Jul
1.30
--
Aug 12, 2016 2:30PM Euro Zone
Euro-Zone GDP s.a. (QoQ)
% Change
2Q P
0.30
--
US
Producer Price Index (mom)
% Change
Jul
0.80
--
7:30AM China
Industrial Production (YoY)
% Change
Jul
6.20
6.20
5:30PM India
Industrial Production YoY
% Change
Jun
1.20
--
12:00PM India
Monthly Wholesale Prices YoY%
% Change
Jul
1.62
--
Aug 15, 2016 11:30AM Germany
GDP nsa (YoY)
% Change
2Q P
1.30
--
Aug 16, 2016 6:00PM US
Housing Starts
Thousands
Jul
1,189.00
1,183.00
6:00PM US
Building permits
Thousands
Jul
1,153.00
1,160.00
2:00PM UK
CPI (YoY)
% Change
Jul
0.50
--
6:00PM US
Consumer price index (mom)
% Change
Jul
0.20
0.10
6:45PM US
Industrial Production
%
Jul
0.60
0.20
Aug 17, 2016 2:00PM UK
Jobless claims change
% Change
Jul
0.40
--
Aug 18, 2016 2:30PM Euro Zone
Euro-Zone CPI (YoY)
%
Jul F
0.20
--
Source: Bloomberg, Angel Research
Market Outlook
August 3, 2016
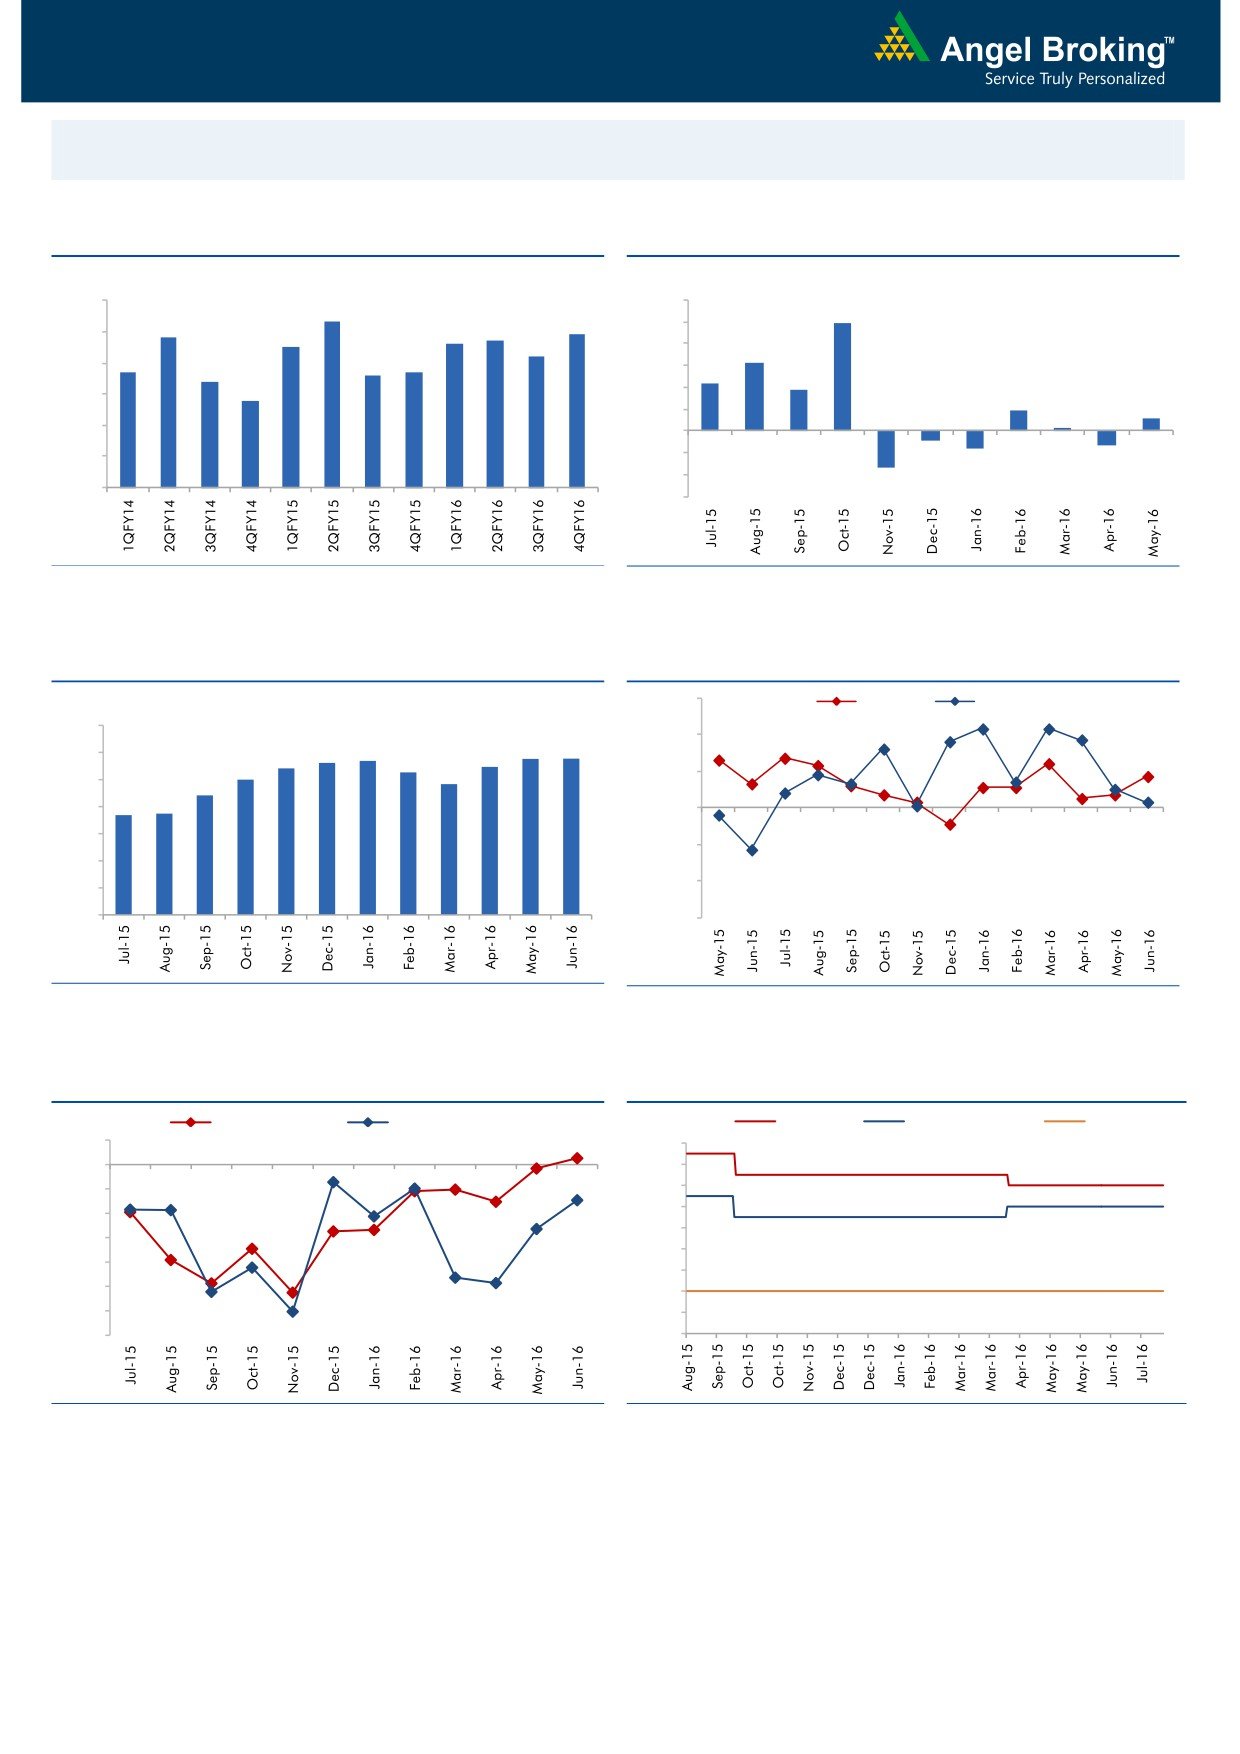
Macro watch
Exhibit 1: Quarterly GDP trends
Exhibit 2: IIP trends
(%)
(%)
9.0
8.3
12.0
9.9
7.8
7.7
7.9
10.0
8.0
7.5
7.6
7.2
8.0
6.3
6.7
6.6
6.7
7.0
6.4
6.0
4.3
3.7
5.8
4.0
6.0
1.9
1.2
2.0
0.3
5.0
-
4.0
(2.0)
(0.9)
(1.3)
(1.6)
(4.0)
3.0
(3.4)
(6.0)
Source: CSO, Angel Research
Source: MOSPI, Angel Research
Exhibit 3: Monthly CPI inflation trends
Exhibit 4: Manufacturing and services PMI
56.0
Mfg. PMI
Services PMI
(%)
7.0
54.0
5.7
5.8
5.8
5.4
5.6
5.5
6.0
5.3
5.0
4.8
52.0
5.0
4.4
3.7
3.7
4.0
50.0
3.0
48.0
2.0
46.0
1.0
-
44.0
Source: MOSPI, Angel Research
Source: Market, Angel Research; Note: Level above 50 indicates expansion
Exhibit 5: Exports and imports growth trends
Exhibit 6: Key policy rates
(%)
Exports yoy growth
Imports yoy growth
(%)
Repo rate
Reverse Repo rate
CRR
5.0
7.50
0.0
7.00
(5.0)
6.50
6.00
(10.0)
5.50
(15.0)
5.00
(20.0)
4.50
(25.0)
4.00
(30.0)
3.50
(35.0)
3.00
Source: Bloomberg, Angel Research
Source: RBI, Angel Research
Market Outlook
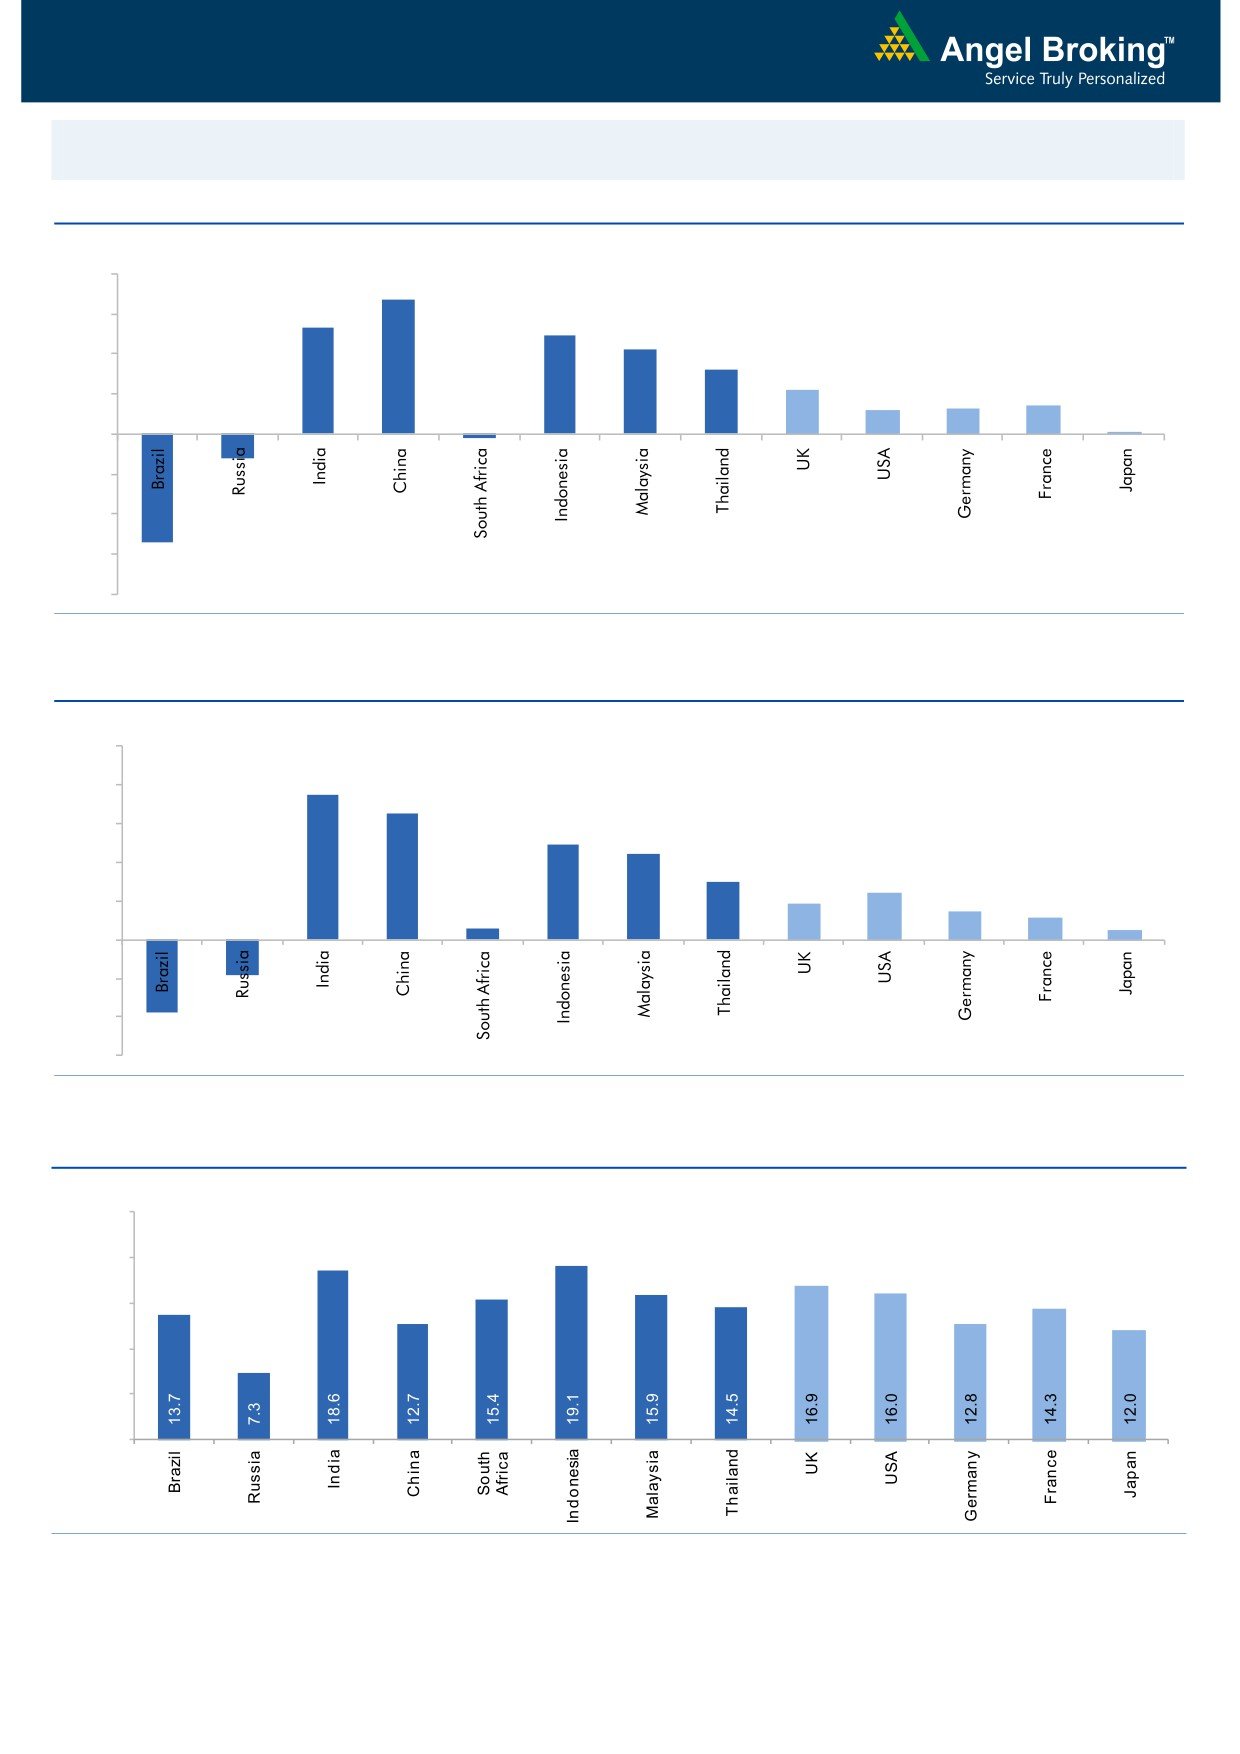
August 3, 2016
Global watch
Exhibit 1: Latest quarterly GDP Growth (%, yoy) across select developing and developed countries
(%)
8.0
6.7
6.0
5.3
4.9
4.2
4.0
3.2
2.2
1.3
1.4
2.0
1.2
0.1
-
(2.0)
(4.0)
(1.2)
(6.0)
(5.4)
(0.2)
(8.0)
Source: Bloomberg, Angel Research
Exhibit 2: 2016 GDP Growth projection by IMF (%, yoy) across select developing and developed countries
(%)
10.0
7.5
8.0
6.5
6.0
4.9
4.4
4.0
3.0
2.4
1.9
1.5
2.0
1.1
0.6
0.5
(3.8)
(1.8)
-
(2.0)
(4.0)
(6.0)
Source: IMF, Angel Research
Exhibit 3: One year forward P-E ratio across select developing and developed countries
(x)
25.0
20.0
15.0
10.0
5.0
-
Source: IMF, Angel Research
Market Outlook
August 3, 2016
Exhibit 4: Relative performance of indices across globe
Returns (%)
Country
Name of index
Closing price
1M
3M
1YR
Brazil
Bovespa
56,162
7.5
7.5
13.2
Russia
Micex
1,913
0.8
(2.9)
14.6
India
Nifty
8,623
4.0
11.3
3.1
China
Shanghai Composite
2,971
(0.5)
(0.6)
(27.0)
South Africa
Top 40
45,560
(1.0)
0.0
(2.1)
Mexico
Mexbol
46,558
0.7
2.7
3.1
Indonesia
LQ45
927
12.4
11.3
10.2
Malaysia
KLCI
1,660
1.1
(0.9)
(3.5)
Thailand
SET 50
946
4.5
5.6
(0.7)
USA
Dow Jones
18,314
2.1
2.4
4.3
UK
FTSE
6,645
1.0
7.4
(1.6)
Japan
Nikkei
16,391
5.2
(5.2)
(20.8)
Germany
DAX
10,144
3.8
2.2
(12.4)
France
CAC
4,328
1.3
0.1
(15.1)
Source: Bloomberg, Angel Research
Stock Watch
August 03, 2016
Company Name
Reco
CMP
Target
Mkt Cap
Sales ( Čcr )
OPM(%)
EPS (Č)
PER(x)
P/BV(x)
RoE(%)
EV/Sales(x)
(Č)
Price ( Č)
( Č cr )
FY17E FY18E
FY17E
FY18E
FY17E
FY18E
FY17E
FY18E
FY17E
FY18E
FY17E
FY18E
FY17E
FY18E
Agri / Agri Chemical
Rallis
Neutral
220
-
4,272
1,937
2,164
13.3
14.3
9.0
11.0
24.4
20.0
4.3
3.7
18.4
19.8
2.3
2.0
United Phosphorus
Accumulate
588
684
25,181
15,176
17,604
18.5
18.5
37.4
44.6
15.7
13.2
3.1
2.6
21.4
21.2
1.8
1.5
Auto & Auto Ancillary
Ashok Leyland
Buy
88
111
25,086
22,407
26,022
10.6
10.6
5.2
6.4
16.9
13.7
3.8
3.2
23.6
24.7
1.2
1.0
Bajaj Auto
Neutral
2,748
-
79,531
25,093
27,891
19.5
19.2
143.9
162.5
19.1
16.9
5.4
4.6
30.3
29.4
2.9
2.5
Bharat Forge
Buy
728
875
16,952
7,726
8,713
20.5
21.2
35.3
42.7
20.6
17.1
3.8
3.4
18.9
20.1
2.3
2.0
Eicher Motors
Neutral
21,846
-
59,338
16,583
20,447
17.5
18.0
598.0
745.2
36.5
29.3
12.5
9.5
41.2
38.3
3.5
2.8
Gabriel India
Neutral
104
-
1,495
1,544
1,715
9.0
9.3
5.4
6.3
19.3
16.5
3.6
3.2
18.9
19.5
0.9
0.8
Hero Motocorp
Neutral
3,260
-
65,098
31,253
35,198
15.3
15.0
172.3
192.1
18.9
17.0
6.9
5.9
38.9
37.0
1.9
1.7
Jamna Auto Industries Neutral
195
-
1,556
1,486
1,620
9.8
9.9
15.0
17.2
13.0
11.3
2.8
2.4
21.8
21.3
1.1
1.0
L G Balakrishnan & Bros Neutral
464
-
729
1,302
1,432
11.6
11.9
43.7
53.0
10.6
8.8
1.5
1.4
13.8
14.2
0.7
0.6
Mahindra and Mahindra Neutral
1,460
-
90,661
46,534
53,077
11.6
11.7
67.3
78.1
21.7
18.7
3.5
3.1
15.4
15.8
1.9
1.7
Maruti
Neutral
4,991
-
150,768
69,186
82,217
14.7
14.4
198.5
241.4
25.1
20.7
4.9
4.0
20.2
20.0
1.8
1.5
Minda Industries
Neutral
1,165
-
1,848
2,728
3,042
9.0
9.1
68.2
86.2
17.1
13.5
3.9
3.1
23.8
24.3
0.7
0.6
Motherson Sumi
Neutral
345
-
45,688
45,896
53,687
7.8
8.3
13.0
16.1
26.5
21.5
8.5
6.8
34.7
35.4
1.1
0.9
Rane Brake Lining
Neutral
584
-
462
511
562
11.3
11.5
28.1
30.9
20.8
18.9
3.2
2.9
15.3
15.0
1.0
1.0
Setco Automotive
Neutral
50
-
669
741
837
13.0
13.0
15.2
17.0
3.3
2.9
0.5
0.5
15.8
16.3
1.3
1.2
Tata Motors
Neutral
494
-
142,585
300,209
338,549
8.9
8.4
42.7
54.3
11.6
9.1
1.9
1.6
15.6
17.2
0.6
0.5
TVS Motor
Accumulate
300
330
14,231
13,390
15,948
6.9
7.1
12.8
16.5
23.5
18.1
5.8
4.6
26.3
27.2
1.1
0.9
Amara Raja Batteries
Buy
921
1,076
15,730
5,717
6,733
18.7
18.9
38.4
48.9
24.0
18.8
6.0
4.9
25.3
24.8
2.6
2.2
Exide Industries
Neutral
176
-
14,947
7,439
8,307
15.0
15.0
8.1
9.3
21.7
18.9
3.0
2.7
14.3
16.7
1.6
1.5
Apollo Tyres
Accumulate
161
183
8,190
12,877
14,504
14.3
13.9
21.4
23.0
7.5
7.0
1.2
1.0
16.4
15.2
0.8
0.8
Ceat
Buy
861
1,119
3,483
7,524
8,624
13.0
12.7
131.1
144.3
6.6
6.0
1.2
1.0
19.8
18.6
0.5
0.5
JK Tyres
Neutral
89
-
2,015
7,455
8,056
15.0
15.0
21.8
24.5
4.1
3.6
0.9
0.7
22.8
21.3
0.4
0.3
Swaraj Engines
Neutral
1,158
-
1,438
660
810
15.2
16.4
54.5
72.8
21.3
15.9
6.6
6.0
31.5
39.2
2.0
1.6
Subros
Neutral
96
-
574
1,488
1,681
11.7
11.9
6.4
7.2
15.0
13.4
1.6
1.4
10.8
11.4
0.6
0.5
Indag Rubber
Neutral
182
-
477
286
326
19.8
16.8
11.7
13.3
15.5
13.6
2.6
2.5
17.8
17.1
1.4
1.2
Capital Goods
ACE
Neutral
47
-
465
709
814
4.1
4.6
1.4
2.1
33.5
22.4
1.4
1.3
4.4
6.0
0.8
0.7
BEML
Accumulate
999
1,157
4,160
3,451
4,055
6.3
9.2
31.4
57.9
31.8
17.3
1.9
1.7
6.3
10.9
1.3
1.1
Bharat Electronics
Accumulate
1,240
1,414
29,749
8,137
9,169
16.8
17.2
58.7
62.5
21.1
19.8
3.3
2.9
44.6
46.3
2.6
2.4
Stock Watch
August 03, 2016
Company Name
Reco
CMP
Target
Mkt Cap
Sales ( Čcr )
OPM(%)
EPS (Č)
PER(x)
P/BV(x)
RoE(%)
EV/Sales(x)
(Č)
Price ( Č)
( Č cr )
FY17E
FY18E
FY17E
FY18E
FY17E
FY18E
FY17E
FY18E
FY17E
FY18E
FY17E
FY18E
FY17E
FY18E
Capital Goods
Voltas
Accumulate
365
407
12,086
6,511
7,514
7.9
8.7
12.9
16.3
28.3
22.4
5.1
4.5
16.7
18.5
1.6
1.4
BGR Energy
Neutral
122
-
883
16,567
33,848
6.0
5.6
7.8
5.9
15.7
20.7
0.9
0.9
4.7
4.2
0.2
0.1
BHEL
Neutral
139
-
33,960
28,797
34,742
-
2.8
2.3
6.9
60.3
20.1
1.0
1.0
1.3
4.8
0.9
0.6
Blue Star
Neutral
472
-
4,505
4,351
5,024
6.4
7.1
17.2
20.6
27.5
22.9
17.9
14.9
23.1
24.1
1.1
1.0
Crompton Greaves
Neutral
77
-
4,826
5,777
6,120
5.9
7.0
3.3
4.5
23.3
17.1
1.0
1.0
4.4
5.9
0.8
0.7
Greaves Cotton
Neutral
139
-
3,396
1,755
1,881
16.8
16.9
7.8
8.5
17.8
16.4
3.6
3.3
20.6
20.9
1.7
1.6
Inox Wind
Buy
219
286
4,861
5,605
6,267
15.7
16.4
24.8
30.0
8.8
7.3
2.5
1.8
25.9
24.4
0.9
0.8
KEC International
Neutral
145
-
3,728
9,294
10,186
7.9
8.1
9.9
11.9
14.7
12.2
2.1
1.9
15.6
16.3
0.6
0.6
Thermax
Neutral
855
-
10,186
5,421
5,940
7.3
7.3
25.7
30.2
33.3
28.3
4.0
3.7
12.2
13.1
1.8
1.7
VATech Wabag
Buy
581
681
3,165
3,136
3,845
8.9
9.1
26.0
35.9
22.3
16.2
2.8
2.4
13.4
15.9
0.9
0.7
Cement
ACC
Neutral
1,666
-
31,283
11,225
13,172
13.2
16.9
44.5
75.5
37.4
22.1
3.5
3.3
11.2
14.2
2.8
2.4
Ambuja Cements
Neutral
264
-
40,962
9,350
10,979
18.2
22.5
5.8
9.5
45.5
27.8
3.8
3.4
10.2
12.5
4.5
3.8
India Cements
Neutral
118
-
3,612
4,364
4,997
18.5
19.2
7.9
11.3
14.9
10.4
1.1
1.0
8.0
8.5
1.6
1.4
JK Cement
Neutral
730
-
5,104
4,398
5,173
15.5
17.5
31.2
55.5
23.4
13.2
2.8
2.4
12.0
15.5
1.7
1.4
J K Lakshmi Cement
Neutral
430
-
5,062
2,913
3,412
14.5
19.5
7.5
22.5
57.4
19.1
3.5
3.0
12.5
18.0
2.3
1.9
Mangalam Cements
Neutral
293
-
782
1,054
1,292
9.0
11.0
-
-
-
-
0.8
0.6
Orient Cement
Accumulate
165
179
3,382
2,114
2,558
18.5
20.5
8.1
11.3
20.4
14.6
9.0
14.0
2.2
1.8
UltraTech Cement
Neutral
3,681
-
101,015
25,768
30,385
21.0
23.5
111.0
160.0
33.2
23.0
4.2
3.7
13.5
15.8
4.1
3.4
Construction
ITNL
Buy
73
93
2,410
8,946
10,017
31.0
31.6
8.1
9.1
9.0
8.1
0.3
0.3
4.2
5.0
3.6
3.3
KNR Constructions
Neutral
600
-
1,687
1,210
1,595
15.4
16.0
33.9
52.1
17.7
11.5
2.7
2.3
13.6
18.0
1.4
1.0
Larsen & Toubro
Accumulate
1,504
1,700
140,183
67,665
77,249
10.7
11.5
57.3
71.2
26.3
21.1
2.4
2.3
12.6
14.3
2.2
1.9
Gujarat Pipavav Port
Accumulate
172
192
8,315
705
788
52.2
51.7
5.0
5.6
34.4
30.7
3.4
3.0
11.2
11.2
11.4
9.7
MBL Infrastructures
Buy
128
285
530
2,797
3,405
14.7
15.4
21.0
34.8
6.1
3.7
0.6
0.6
11.0
16.2
0.8
0.8
Nagarjuna Const.
Neutral
78
-
4,350
8,842
9,775
9.1
8.8
5.3
6.4
14.8
12.2
1.2
1.1
8.2
9.1
0.7
0.6
PNC Infratech
Accumulate
571
647
2,927
2,350
2,904
13.4
13.7
48.0
42.0
11.9
13.6
2.3
2.1
16.8
13.2
1.4
1.1
Simplex Infra
Neutral
308
-
1,521
6,829
7,954
10.5
10.5
31.4
37.4
9.8
8.2
1.0
0.9
9.9
13.4
0.7
0.6
Power Mech Projects
Neutral
552
-
813
1,801
2,219
12.7
14.6
72.1
113.9
7.7
4.9
1.4
1.2
16.8
11.9
0.5
0.3
Sadbhav Engineering
Neutral
281
-
4,817
3,598
4,140
10.3
10.6
9.0
11.9
31.2
23.6
3.3
2.9
9.9
11.9
1.7
1.4
NBCC
Neutral
245
-
14,700
7,428
9,549
7.9
8.6
8.2
11.0
29.9
22.3
1.5
1.2
28.2
28.7
1.7
1.3
Stock Watch
August 03, 2016
Company Name
Reco
CMP
Target
Mkt Cap
Sales ( Čcr )
OPM(%)
EPS (Č)
PER(x)
P/BV(x)
RoE(%)
EV/Sales(x)
(Č)
Price ( Č)
( Č cr )
FY17E
FY18E
FY17E
FY18E
FY17E
FY18E
FY17E
FY18E
FY17E
FY18E
FY17E
FY18E
FY17E
FY18E
Construction
MEP Infra
Neutral
44
-
709
1,877
1,943
30.6
29.8
3.0
4.2
14.5
10.4
7.0
4.7
0.6
0.6
1.8
1.6
SIPL
Neutral
101
-
3,543
1,036
1,252
65.5
66.2
(8.4)
(5.6)
3.8
4.3
(22.8)
(15.9)
11.7
9.7
Engineers India
Neutral
224
-
7,542
1,725
1,935
16.0
19.1
11.4
13.9
19.6
16.1
2.7
2.6
13.4
15.3
3.3
3.0
Financials
Axis Bank
Neutral
550
-
131,188
58,081
66,459
3.5
3.5
32.4
44.6
17.0
12.3
2.2
1.9
13.6
16.5
-
-
Bank of Baroda
Neutral
151
-
34,816
19,980
23,178
1.8
1.8
11.5
17.3
13.1
8.7
1.5
1.2
8.3
10.1
-
-
Canara Bank
Neutral
253
-
13,732
15,225
16,836
1.8
1.8
14.5
28.0
17.4
9.0
1.2
1.0
5.8
8.5
-
-
Dewan Housing Finance Buy
224
270
6,542
2,225
2,688
2.9
2.9
29.7
34.6
7.6
6.5
1.2
1.0
16.1
16.8
-
-
Equitas Holdings
Buy
185
235
6,208
939
1,281
11.7
11.5
5.8
8.2
31.9
22.6
2.8
2.5
10.9
11.5
-
-
Federal Bank
Neutral
63
-
10,885
9,353
10,623
2.9
2.9
4.4
5.8
14.4
10.9
1.4
1.2
9.5
11.0
-
-
HDFC
Neutral
1,342
-
212,158
11,475
13,450
3.4
3.4
45.3
52.5
29.6
25.6
5.7
5.0
20.2
20.5
-
-
HDFC Bank
Neutral
1,244
-
314,999
46,097
55,433
4.5
4.5
58.4
68.0
21.3
18.3
3.7
3.1
18.8
18.6
-
-
ICICI Bank
Neutral
245
-
142,718
39,029
45,903
3.3
3.3
16.7
16.3
14.7
15.1
1.8
1.7
10.1
12.4
-
-
LIC Housing Finance
Accumulate
512
582
25,859
3,712
4,293
2.6
2.5
39.0
46.0
13.1
11.1
2.5
2.1
19.9
20.1
-
-
Punjab Natl.Bank
Neutral
123
-
24,133
23,532
23,595
2.3
2.4
6.8
12.6
18.1
9.8
2.8
2.0
3.3
6.5
-
-
South Ind.Bank
Neutral
21
-
2,890
6,435
7,578
2.5
2.5
2.7
3.1
7.9
6.9
1.0
0.9
10.1
11.2
-
-
St Bk of India
Neutral
228
-
176,875
88,650
98,335
2.6
2.6
13.5
18.8
16.9
12.1
1.6
1.4
7.0
8.5
-
-
Union Bank
Neutral
126
-
8,638
13,450
14,925
2.3
2.3
25.5
34.5
4.9
3.6
0.7
0.6
7.5
10.2
-
-
Yes Bank
Neutral
1,229
-
51,720
8,978
11,281
3.3
3.4
74.0
90.0
16.6
13.7
3.2
2.7
17.0
17.2
-
-
FMCG
Asian Paints
Neutral
1,123
-
107,728
17,128
18,978
16.8
16.4
19.1
20.7
58.8
54.3
20.5
19.3
34.8
35.5
6.2
5.6
Britannia
Neutral
2,880
-
34,547
9,795
10,940
14.1
14.1
80.3
93.0
35.9
31.0
14.7
11.4
41.2
-
3.4
3.0
Colgate
Neutral
969
-
26,362
4,605
5,249
22.8
22.8
25.2
28.5
38.5
34.0
26.1
23.2
64.8
66.8
5.5
4.8
Dabur India
Neutral
302
-
53,064
9,405
10,581
18.1
18.3
8.1
9.2
37.2
32.8
10.4
8.6
31.6
31.0
5.3
4.7
GlaxoSmith Con*
Neutral
6,256
-
26,310
4,959
5,623
17.4
18.0
190.5
219.3
32.9
28.5
9.0
7.8
29.6
29.5
4.9
4.2
Godrej Consumer
Neutral
1,596
-
54,359
10,335
11,518
18.4
18.6
41.5
46.0
38.5
34.7
8.6
7.3
24.9
24.8
5.3
4.7
HUL
Neutral
929
-
200,972
35,252
38,495
17.6
17.4
20.4
21.9
45.5
42.4
37.4
32.8
82.2
77.3
5.5
5.0
ITC
Accumulate
260
283
314,082
40,059
44,439
39.0
39.2
9.1
10.1
28.6
25.8
7.8
6.8
27.2
26.5
7.0
6.3
Marico
Neutral
299
-
38,621
6,730
7,649
17.3
17.5
6.4
7.6
46.8
39.4
14.1
11.9
33.2
32.5
5.3
4.6
Nestle*
Neutral
6,832
-
65,874
9,393
10,507
22.2
22.3
106.8
121.8
64.0
56.1
22.5
20.2
34.8
36.7
6.9
6.2
Tata Global
Neutral
138
-
8,735
9,072
9,687
9.4
9.8
7.2
7.8
19.2
17.7
2.1
2.0
7.6
7.9
1.0
0.9
Stock Watch
August 03, 2016
Company Name
Reco
CMP
Target
Mkt Cap
Sales ( Čcr )
OPM(%)
EPS (Č)
PER(x)
P/BV(x)
RoE(%)
EV/Sales(x)
(Č)
Price ( Č)
( Č cr )
FY17E FY18E
FY17E
FY18E
FY17E
FY18E
FY17E
FY18E
FY17E
FY18E
FY17E
FY18E
FY17E
FY18E
FMCG
Procter & Gamble
Accumulate
6,502
7,369
21,107
2,939
3,342
23.2
23.0
146.2
163.7
44.5
39.7
99.6
95.5
25.3
23.5
6.7
5.8
Hygiene
IT
HCL Tech^
Buy
801
1,000
112,945
49,242
57,168
20.5
20.5
55.7
64.1
14.4
12.5
2.9
2.2
20.3
17.9
2.1
1.7
Infosys
Buy
1,084
1,374
249,058
69,934
79,025
27.5
27.5
64.8
72.0
16.7
15.1
3.7
3.4
22.0
22.3
3.0
2.6
TCS
Accumulate
2,692
3,004
530,459
121,684
136,286
27.3
27.3
135.0
150.1
19.9
17.9
6.6
6.1
33.2
33.9
4.1
3.6
Tech Mahindra
Buy
498
700
48,390
30,347
33,685
17.0
17.0
37.5
41.3
13.3
12.1
2.9
2.5
21.8
20.7
1.3
1.1
Wipro
Buy
551
680
136,013
51,631
55,822
21.7
17.9
35.9
36.9
15.3
14.9
3.2
3.0
19.0
18.1
2.4
2.1
Media
D B Corp
Neutral
415
-
7,631
2,187
2,329
27.4
28.2
18.9
21.0
22.0
19.8
4.6
4.0
23.7
23.1
3.2
2.9
HT Media
Neutral
83
-
1,924
2,673
2,891
13.2
13.8
7.2
8.5
11.5
9.7
0.9
0.8
7.8
8.3
0.3
0.2
Jagran Prakashan
Accumulate
183
205
5,971
2,355
2,635
28.0
28.0
9.9
10.8
18.5
16.9
3.7
3.2
21.7
21.7
2.5
2.2
Sun TV Network
Neutral
458
-
18,065
2,850
3,265
70.1
71.0
26.2
30.4
17.5
15.1
4.5
4.0
24.3
25.6
6.1
5.2
Hindustan Media
Neutral
273
-
2,004
1,016
1,138
21.5
21.5
23.3
25.8
11.7
10.6
1.9
1.7
16.2
15.8
1.3
1.1
Ventures
Metals & Mining
Coal India
Neutral
323
-
204,240
84,638
94,297
21.4
22.3
24.5
27.1
13.2
11.9
5.5
5.2
42.6
46.0
1.9
1.7
Hind. Zinc
Neutral
207
-
87,401
14,252
18,465
55.9
48.3
15.8
21.5
13.1
9.6
2.1
1.9
17.0
20.7
6.3
4.8
Hindalco
Neutral
135
-
27,898
107,899
112,095
7.4
8.2
9.2
13.0
14.7
10.4
0.7
0.7
4.8
6.6
0.8
0.7
JSW Steel
Neutral
1,675
-
40,491
53,201
58,779
16.1
16.2
130.6
153.7
12.8
10.9
1.7
1.5
14.0
14.4
1.5
1.3
NMDC
Neutral
101
-
40,044
6,643
7,284
44.4
47.7
7.1
7.7
14.2
13.1
1.2
1.2
8.8
9.2
3.9
3.5
SAIL
Accumulate
46
50
19,040
47,528
53,738
(0.7)
2.1
(1.9)
2.6
17.7
0.5
0.5
(1.6)
3.9
1.3
1.1
Vedanta
Neutral
156
-
46,323
71,744
81,944
19.2
21.7
13.4
20.1
11.7
7.8
1.0
0.9
8.4
11.3
1.1
0.8
Tata Steel
Neutral
362
-
35,148
121,374
121,856
7.2
8.4
18.6
34.3
19.5
10.6
1.2
1.1
6.1
10.1
0.9
0.9
Oil & Gas
Cairn India
Neutral
182
-
34,094
9,127
10,632
4.3
20.6
8.8
11.7
20.7
15.5
0.7
0.7
3.3
4.2
5.4
4.4
GAIL
Neutral
376
-
47,695
56,220
65,198
9.3
10.1
27.1
33.3
13.9
11.3
1.3
1.2
9.3
10.7
1.0
0.9
ONGC
Accumulate
221
235
189,119
137,222
152,563
15.0
21.8
19.5
24.1
11.3
9.2
1.0
0.9
8.5
10.1
1.6
1.5
Petronet LNG
Neutral
310
-
23,258
-
0
-
-
-
-
-
-
Indian Oil Corp
Neutral
555
-
134,824
373,359
428,656
5.9
5.5
54.0
59.3
10.3
9.4
1.6
1.4
16.0
15.6
0.5
0.4
Reliance Industries
Neutral
1,011
-
327,827
301,963
358,039
12.1
12.6
87.7
101.7
11.5
9.9
1.2
1.1
10.7
11.3
1.6
1.3
Pharmaceuticals
Alembic Pharma
Neutral
623
-
11,747
3,483
4,083
16.2
17.4
18.7
23.7
33.3
26.3
6.2
5.1
20.1
21.3
3.3
2.8
Aurobindo Pharma
Neutral
765
-
44,777
15,720
18,078
23.7
23.7
41.4
47.3
18.5
16.2
4.8
3.8
29.6
26.1
3.2
2.7
Aventis*
Neutral
4,553
-
10,486
2,357
2,692
17.3
17.3
153.5
169.2
29.7
26.9
5.0
4.1
25.8
28.4
4.2
3.4
Cadila Healthcare
Accumulate
348
400
35,601
11,126
13,148
22.0
22.0
17.1
20.0
20.3
17.4
5.2
4.2
28.8
26.6
3.2
2.7
Stock Watch
August 03, 2016
Company Name
Reco
CMP
Target
Mkt Cap
Sales ( Čcr )
OPM(%)
EPS (Č)
PER(x)
P/BV(x)
RoE(%)
EV/Sales(x)
(Č)
Price ( Č)
( Č cr )
FY17E FY18E
FY17E
FY18E
FY17E
FY18E
FY17E
FY18E
FY17E
FY18E
FY17E
FY18E
FY17E
FY18E
Pharmaceuticals
Cipla
Neutral
519
-
41,673
15,378
18,089
17.4
18.4
21.6
27.2
24.0
19.1
3.1
2.7
13.7
15.2
2.9
2.5
Dr Reddy's
Neutral
2,977
-
50,777
16,043
18,119
23.1
24.7
126.0
157.8
23.6
18.9
3.5
3.0
15.7
17.1
3.1
2.7
Dishman Pharma
Neutral
167
-
2,702
1,718
1,890
21.7
21.8
8.7
10.4
19.2
16.1
1.7
1.6
9.3
10.2
2.0
1.8
GSK Pharma*
Accumulate
3,190
3,505
27,016
3,528
3,811
18.9
19.1
60.1
65.3
53.1
48.8
15.8
15.3
29.9
31.8
7.4
6.9
Indoco Remedies
Neutral
310
-
2,857
1,112
1,289
18.2
18.2
13.2
15.6
23.5
19.9
4.2
3.5
19.2
19.2
2.7
2.3
Ipca labs
Buy
512
613
6,461
3,303
3,799
15.3
15.3
17.3
19.7
29.6
26.0
2.6
2.4
9.1
9.4
2.1
1.8
Lupin
Neutral
1,704
-
76,839
15,912
18,644
26.4
26.7
58.1
69.3
29.3
24.6
5.7
4.7
21.4
20.9
5.0
4.1
Sun Pharma
Accumulate
829
944
199,455
31,129
35,258
30.0
30.9
28.0
32.8
29.6
25.3
4.5
3.8
18.7
18.9
6.0
5.1
Power
Tata Power
Neutral
72
-
19,392
36,916
39,557
17.4
27.1
5.1
6.3
14.1
11.4
1.2
1.1
9.0
10.3
1.5
1.4
NTPC
Neutral
159
-
131,144
86,605
95,545
17.5
20.8
11.8
13.4
13.5
11.9
1.4
1.3
10.5
11.1
2.9
2.9
Power Grid
Neutral
179
-
93,462
25,763
29,762
74.3
73.1
14.8
17.3
12.1
10.3
1.9
1.7
16.9
17.5
7.9
7.5
Real Estate
MLIFE
Buy
442
554
1,815
925
1,139
18.4
22.3
18.3
33.8
24.2
13.1
1.2
1.1
4.9
8.5
2.7
2.1
Telecom
Bharti Airtel
Neutral
358
-
143,107
105,086
114,808
34.5
34.7
12.2
16.4
29.3
21.8
2.0
1.9
6.8
8.4
2.3
2.0
Idea Cellular
Neutral
104
-
37,466
40,133
43,731
37.2
37.1
6.4
6.5
16.3
16.0
1.4
1.3
8.2
7.6
2.0
1.7
zOthers
Abbott India
Neutral
4,687
-
9,959
3,153
3,583
14.1
14.4
152.2
182.7
30.8
25.7
151.2
129.1
25.6
26.1
2.9
2.5
Bajaj Electricals
Neutral
266
-
2,685
5,351
6,098
5.7
5.9
12.4
15.7
21.5
16.9
3.1
2.7
14.4
16.1
0.5
0.5
Finolex Cables
Neutral
391
-
5,987
2,883
3,115
12.0
12.1
14.2
18.6
27.6
21.1
14.7
12.8
15.8
14.6
1.8
1.6
Goodyear India*
Buy
522
631
1,204
1,598
1,704
10.4
10.2
49.4
52.6
10.6
9.9
48.8
42.8
18.2
17.0
0.4
57.1
Hitachi
Neutral
1,377
-
3,743
2,081
2,433
8.8
8.9
33.4
39.9
41.2
34.5
33.3
27.7
22.1
21.4
1.8
1.5
Jyothy Laboratories
Neutral
285
-
5,158
1,440
2,052
11.5
13.0
8.5
10.0
33.5
28.5
8.1
7.5
18.6
19.3
3.9
2.7
MRF
Buy
33,910
45,575
14,382
-
0
-
-
-
-
-
-
Page Industries
Neutral
14,729
-
16,429
2,450
3,124
20.1
17.6
299.0
310.0
49.3
47.5
328.0
250.4
47.1
87.5
6.9
5.4
Relaxo Footwears
Neutral
483
-
5,796
2,085
2,469
9.2
8.2
7.6
8.0
63.9
60.8
24.8
21.1
17.9
18.8
2.9
2.4
Siyaram Silk Mills
Buy
1,028
1,347
964
1,799
2,040
11.6
11.7
104.9
122.4
9.8
8.4
1.6
1.4
16.4
16.4
0.7
0.7
Styrolution ABS India*
Accumulate
604
643
1,062
1,440
1,537
9.2
9.0
40.6
42.6
14.9
14.2
38.0
34.5
12.3
11.6
0.7
0.6
TVS Srichakra
Buy
2,360
2,932
1,807
2,304
2,614
13.7
13.8
231.1
266.6
10.2
8.9
265.2
208.8
33.9
29.3
0.8
0.7
HSIL
Neutral
312
-
2,255
2,384
2,515
15.8
16.3
15.3
19.4
20.4
16.1
20.3
17.4
7.8
9.3
1.1
1.0
Kirloskar Engines India
Neutral
275
-
3,977
2,554
2,800
9.9
10.0
10.5
12.1
26.2
22.7
11.0
10.3
10.7
11.7
1.2
1.1
Ltd
M M Forgings
Buy
435
546
525
546
608
20.4
20.7
41.3
48.7
10.5
8.9
59.6
52.7
16.6
17.0
0.8
0.7
Stock Watch
August 03, 2016
Company Name
Reco
CMP
Target
Mkt Cap
Sales ( Čcr )
OPM(%)
EPS (Č)
PER(x)
P/BV(x)
RoE(%)
EV/Sales(x)
(Č)
Price ( Č)
( Č cr )
FY17E
FY18E
FY17E
FY18E
FY17E
FY18E
FY17E
FY18E
FY17E
FY18E
FY17E
FY18E
FY17E
FY18E
zOthers
Banco Products (India) Neutral
200
-
1,427
1,353
1,471
12.3
12.4
14.5
16.3
13.8
12.2
19.0
17.1
14.5
14.6
0.9
92.4
Competent Automobiles Neutral
161
-
99
1,137
1,256
3.1
2.7
28.0
23.6
5.8
6.8
31.0
28.0
14.3
11.5
0.1
0.1
Nilkamal
Neutral
1,176
-
1,755
1,995
2,165
10.7
10.4
69.8
80.6
16.9
14.6
67.2
58.4
16.6
16.5
0.9
0.8
Visaka Industries
Neutral
157
-
249
1,051
1,138
10.3
10.4
21.0
23.1
7.5
6.8
20.1
18.8
9.0
9.2
0.5
0.5
Transport Corporation of
Neutral
372
-
2,852
2,671
2,911
8.5
8.8
13.9
15.7
26.9
23.8
3.7
3.3
13.7
13.8
1.2
1.1
India
Elecon Engineering
Accumulate
58
63
632
1,482
1,660
13.7
14.5
3.9
5.8
14.9
10.0
3.5
3.2
7.8
10.9
0.7
0.7
Surya Roshni
Buy
170
201
746
3,342
3,625
7.8
7.5
17.3
19.8
9.9
8.6
18.7
15.0
10.5
10.8
0.5
0.4
MT Educare
Neutral
147
-
585
366
417
17.7
18.2
9.4
10.8
15.7
13.6
3.5
3.0
22.2
22.3
1.6
1.4
Radico Khaitan
Buy
90
125
1,200
1,659
1,802
13.0
13.2
6.3
7.4
14.2
12.2
1.2
1.1
8.6
9.3
1.2
1.1
Garware Wall Ropes
Neutral
454
-
994
898
997
11.9
11.7
29.0
32.9
15.7
13.8
2.3
2.0
14.9
14.6
1.0
0.9
Wonderla Holidays
Neutral
398
-
2,249
287
355
38.0
40.0
11.3
14.2
35.2
28.0
5.0
4.4
21.4
23.9
7.7
6.3
Linc Pen & Plastics
Neutral
265
-
392
382
416
9.1
9.1
13.1
14.7
20.2
18.0
3.4
2.9
16.7
16.3
1.1
1.0
The Byke Hospitality
Neutral
161
-
645
287
384
20.5
20.5
7.6
10.7
21.2
15.0
4.4
3.6
20.7
23.5
2.3
1.7
Interglobe Aviation
Neutral
866
-
31,209
21,122
26,005
14.5
27.6
110.7
132.1
7.8
6.6
46.8
33.4
168.5
201.1
1.6
1.3
Coffee Day Enterprises
Neutral
241
-
4,971
2,964
3,260
20.5
21.2
4.7
8.0
-
30.2
2.8
2.6
5.5
8.5
2.1
1.9
Ltd
Navneet Education
Neutral
96
-
2,296
1,062
1,147
24.0
24.0
6.1
6.6
15.8
14.6
3.3
2.9
20.6
19.8
2.3
2.1
Navkar Corporation
Buy
212
265
3,017
408
612
42.9
42.3
6.8
11.5
31.2
18.4
2.2
1.9
6.9
10.5
8.3
5.5
UFO Moviez
Neutral
580
-
1,600
619
685
33.2
33.4
30.0
34.9
19.4
16.6
2.7
2.3
13.8
13.9
2.3
1.9
VRL Logistics
Neutral
339
-
3,090
1,902
2,119
16.7
16.6
14.6
16.8
23.2
20.1
5.1
4.5
21.9
22.2
1.8
1.6
Team Lease Serv.
Neutral
1,053
-
1,800
3,229
4,001
1.5
1.8
22.8
32.8
46.2
32.1
5.0
4.3
10.7
13.4
0.5
0.4
S H Kelkar & Co.
Neutral
254
-
3,673
1,036
1,160
15.1
15.0
6.1
7.2
41.6
35.4
4.4
4.1
10.7
11.5
3.5
3.1
Quick Heal
Neutral
267
-
1,869
408
495
27.3
27.0
7.7
8.8
34.5
30.4
3.2
3.2
9.3
10.6
3.7
3.1
Narayana Hrudaya
Neutral
334
-
6,828
1,873
2,166
11.5
11.7
2.6
4.0
126.3
84.3
7.8
7.0
6.1
8.3
3.6
3.1
Manpasand Bever.
Neutral
681
-
3,406
836
1,087
19.6
19.4
16.9
23.8
40.3
28.6
4.8
4.2
12.0
14.8
4.0
3.0
Parag Milk Foods
Neutral
305
-
2,568
1,919
2,231
9.3
9.6
9.5
12.9
32.3
23.6
5.0
4.1
15.5
17.5
1.5
1.3
Source: Company, Angel Research; Note: *December year end; #September year end; &October year end; Price as on August 02, 2016
Market Outlook
August 03, 2016
Research Team Tel: 022 - 39357800
DISCLAIMER
Angel Broking Private Limited (hereinafter referred to as “Angel”) is a registered Member of National Stock Exchange of India Limited,
Bombay Stock Exchange Limited and Metropolitan Stock Exchange Limited. It is also registered as a Depository Participant with CDSL
and Portfolio Manager with SEBI. It also has registration with AMFI as a Mutual Fund Distributor. Angel Broking Private Limited is a
registered entity with SEBI for Research Analyst in terms of SEBI (Research Analyst) Regulations, 2014 vide registration number
INH000000164. Angel or its associates has not been debarred/ suspended by SEBI or any other regulatory authority for accessing
/dealing in securities Market. Angel or its associates/analyst has not received any compensation / managed or co-managed public
offering of securities of the company covered by Analyst during the past twelve months.
This document is solely for the personal information of the recipient, and must not be singularly used as the basis of any investment
decision. Nothing in this document should be construed as investment or financial advice. Each recipient of this document should make
such investigations as they deem necessary to arrive at an independent evaluation of an investment in the securities of the companies
referred to in this document (including the merits and risks involved), and should consult their own advisors to determine the merits and
risks of such an investment.
Reports based on technical and derivative analysis center on studying charts of a stock's price movement, outstanding positions and
trading volume, as opposed to focusing on a company's fundamentals and, as such, may not match with a report on a company's
fundamentals. Investors are advised to refer the Fundamental and Technical Research Reports available on our website to evaluate the
contrary view, if any.
The information in this document has been printed on the basis of publicly available information, internal data and other reliable
sources believed to be true, but we do not represent that it is accurate or complete and it should not be relied on as such, as this
document is for general guidance only. Angel Broking Pvt. Limited or any of its affiliates/ group companies shall not be in any way
responsible for any loss or damage that may arise to any person from any inadvertent error in the information contained in this report.
Angel Broking Pvt. Limited has not independently verified all the information contained within this document. Accordingly, we cannot
testify, nor make any representation or warranty, express or implied, to the accuracy, contents or data contained within this document.
While Angel Broking Pvt. Limited endeavors to update on a reasonable basis the information discussed in this material, there may be
regulatory, compliance, or other reasons that prevent us from doing so.
This document is being supplied to you solely for your information, and its contents, information or data may not be reproduced,
redistributed or passed on, directly or indirectly.
Neither Angel Broking Pvt. Limited, nor its directors, employees or affiliates shall be liable for any loss or damage that may arise from
or in connection with the use of this information.