Market Outlook
March 3, 2016
Market Cues
Domestic Indices
Chg (%)
(Pts)
(Close)
Indian markets are expected to open on Positive note tracking SGX Nifty and most of
BSE Sensex
1.9
464
24,243
the Global markets.
Nifty
2.0
147
7,369
US markets inched higher to close on a positive note, on the back of encouraging
Mid Cap
1.9
186
10,052
ADP employment data, and uptick in oil prices. Also, commentary from the Beige
Small Cap
2.2
217
10,074
book released by Fed indicated that economic activity expanded across most districts
Bankex
4.9
805
17,179
since the previous Beige Book. All these positives indicate that US economy is
regaining momentum and as a result U.S. markets closed in green.
Global Indices
Chg (%)
(Pts)
(Close)
Majority of the European market indices ended in green. Financial and Resource
Dow Jones
0.2
34
16,899
stocks were amongst the best performers on Wednesday. Stocks pared some of its
Nasdaq
0.3
14
4,703
early gains in response to mixed regional data. While Eurozone producer prices fell
FTSE
(0.1)
(6)
6,147
at slowest pace in 5 months in Jan, matching estimates, British construction activity
unexpectedly hit 10-month low in Feb, defying economists' expectations of modest
Nikkei
4.1
661
16,747
improvement. FTSE was down 0.1%.
Hang Seng
3.1
596
20,003
Bulls continued to take charge of the benchmark indices on Wednesday. Key indices
Shanghai Com
4.3
117
2,850
posted their biggest second-day rally in last 7 years, with Sensex gaining 500 points
intraday, led by banking stocks. Changed in rules that determine banks' regulatory
Advances / Declines
BSE
NSE
capital by RBI on Tuesday evening and positive global cues contributed to the rally.
Advances
1,964
1,250
News & Result Analysis
Declines
712
318
Tata Steel receives green nod for its Jamshedpur expansion plan
Unchanged
118
50
Gayatri to execute `500cr work in freight corridor contract
Detailed analysis on Pg2
Volumes (` Cr)
Investor’s Ready Reckoner
BSE
3,356
Key Domestic & Global Indicators
NSE
20,723
Stock Watch: Latest investment recommendations on 150+ stocks
Refer Pg4 onwards
Net Inflows (` Cr)
Net
Mtd
Ytd
FII
3,017
3,017
(25,910)
Top Picks
CMP
Target
Upside
MFs
1,016
5,946
81,343
Company
Sector
Rating
(`)
(`)
(%)
Amara Raja Batteries Auto & Auto Ancillary
Buy
876
1,040
18.7
Top Gainers
Price (`)
Chg (%)
HCL Tech
IT
Buy
855
1,038
21.5
Corpbank
37
12.6
LIC Housing Finance Financials
Buy
452
592
31.0
Sbin
181
11.5
Bharat Electronics
Capital Goods
Buy
1,051
1,414
34.6
Hathway
37
11.3
Navkar Corporation Others
Buy
157
265
69.1
More Top Picks on Pg3
Star
1,034
10.8
Unitech
5
10.7
Key Upcoming Events
Previous
Consensus
Date
Region
Event Description
Reading
Expectations
Top Losers
Price (`)
Chg (%)
Mar 3 US
Initial Jobless Claims (000’s)
272
270
M&M
1,199
(5.3)
Germany
PMI Services
55.10
55.10
Unitdspr
2,508
(4.9)
Mar 4 US
Change in Nonfarm Payroll
151.00
195.00
Mrpl
57
(4.1)
US
Unemployment rate
4.90
4.90
6.(
Icra
3,680
(3.9)
Rtnpower
10
(2.9)
As on March 2, 2016
Market Outlook
March 3, 2016
Tata Steel gets nod for its Jamshedpur expansion plan
Tata steel has received final Environment clearance for its `1,877cr expansion
plan at Jamshedpur. As per the latest plans, Tata Steel will be expanding its crude
steel production capacity from 9.7mn tn p.a. (MTPA) to 11 MTPA at Jamshedpur.
Tata Steel intends to enhance its crude steel production capacity by enhancing
production capacities of its sinter plant, steel melting shop and its mills. It also
intends to revamp 2 of the existing blast furnaces and install a new lime plant. The
total capex outlay of `1,877cr the new project will be undertaken within the
existing plant of 717 hectares and hence the company will not be required to
acquire any new land.
We continue to maintain Neutral rating on the stock.
Gayatri to execute `500cr Freight corridor contract
Gayatri Projects informed that they have been awarded `4,744cr contract for
designing and building Iqbalgarh-Vadodara section of the Western Dedicated
Freight Corridor project to Sojitz-led consortium, in which it is a partner.
Dedicated Freight Corridor Corporation of India (DFCCI) awarded the contract to
a consortium comprising Sojitz Corporation, L&T and Gayatri Projects. Gayatri is
expected to have `450-500cr of EPC work share in this contract. The company will
handle the earth work and concreting job for the above said project.
This is a positive development for the company as it further adds to their order
book visibility.
Economic and Political News
Eurozone, IMF split over how much Greece Needs to reform
India plans to bring Iran back into banking clearing union
IMF projects 7.3% GDP growth rate for India this fiscal
Govt targets `40,000cr from coal cess by 2018
Corporate News
Future Group to tie-up with Trent Hypermarket
Fitch assigns stable outlook to RCom
HDFC to raise `2,000cr via debentures on pvt placement
Market Outlook
March 3, 2016
Top Picks ★★★★★
Large Cap
Market Cap
CMP
Target
Upside
Company
Rationale
(` Cr)
(`)
(`)
(%)
To outpace battery industry growth due to better technological
Amara Raja Batteries
14,964
876
1,040
18.7
products leading to market share gains in both the automotive
OEM and replacement segments.
Earnings to grow strongly given the MHCV cyclical upturn.
Ashok Leyland
26,609
94
111
18.7
Focus on exports and LCV's provides additional growth
avenue.
Uptick in defense capex by government when coupled with
Bharat Electronics
25,218
1,051
1,414
34.6
BELs strong market positioning, indicate that good times are
ahead for BEL.
The stock is trading at attractive valuations and is factoring all
HCL Tech
120,502
855
1,038
21.5
the bad news.
Strong visibility for a robust 20% earnings trajectory, coupled
HDFC Bank
254,643
1,008
1,262
25.2
with high quality of earnings on account of high quality retail
business and strategic focus on highly rated corporates.
Back on the growth trend, expect a long term growth of 14%
Infosys
265,584
1,156
1,347
16.5
to be a US$20bn in FY2020.
LICHF continues to grow its retail loan book at a healthy pace
with improvement in asset quality. We expect the company to
LIC Housing Finance
22,801
452
592
31.0
post a healthy loan book which is likely to reflect in a strong
earnings growth.
Huge bid pipeline of re-development works at Delhi and other
NBCC
10,929
911
1,089
19.6
State Governments and opportunity from Smart City, positions
NBCC to report strong growth, going forward.
New launches to enable outpace industry growth; margins
TVS Motors
13,664
288
330
14.7
expansion to boost earnings.
Source: Company, Angel Research
Mid Cap
Market Cap
CMP
Target
Upside
Company
Rationale
(` Cr)
(`)
(`)
(%)
Favourable outlook for the AC industry to augur well for
Cooling products business which is out pacing the market
Blue Star
2,965
330
439
33.2
growth. EMPPAC division's profitability to improve once
operating environment turns around.
Economic recovery to have favourable impact on advertising &
circulation revenue growth. Further, the acquisition of a radio
Jagran Prakashan
5,012
153
189
23.3
business (Radio City) would also boost the company's revenue
growth.
Massive capacity expansion along with rail advantage at ICD
Navkar Corporation
2,235
157
265
69.1
as well CFS augurs well for the company
Earnings boost on back of stable material prices and
Radico Khaitan
1,282
96
156
61.8
favourable pricing environment. Valuation discount to peers
provides additional comfort
Strong brands and distribution network would boost growth
Siyaram Silk Mills
877
936
1,354
44.7
going ahead. Stock currently trades at an inexpensive
valuation.
Source: Company, Angel Research
Market Outlook
March 3, 2016
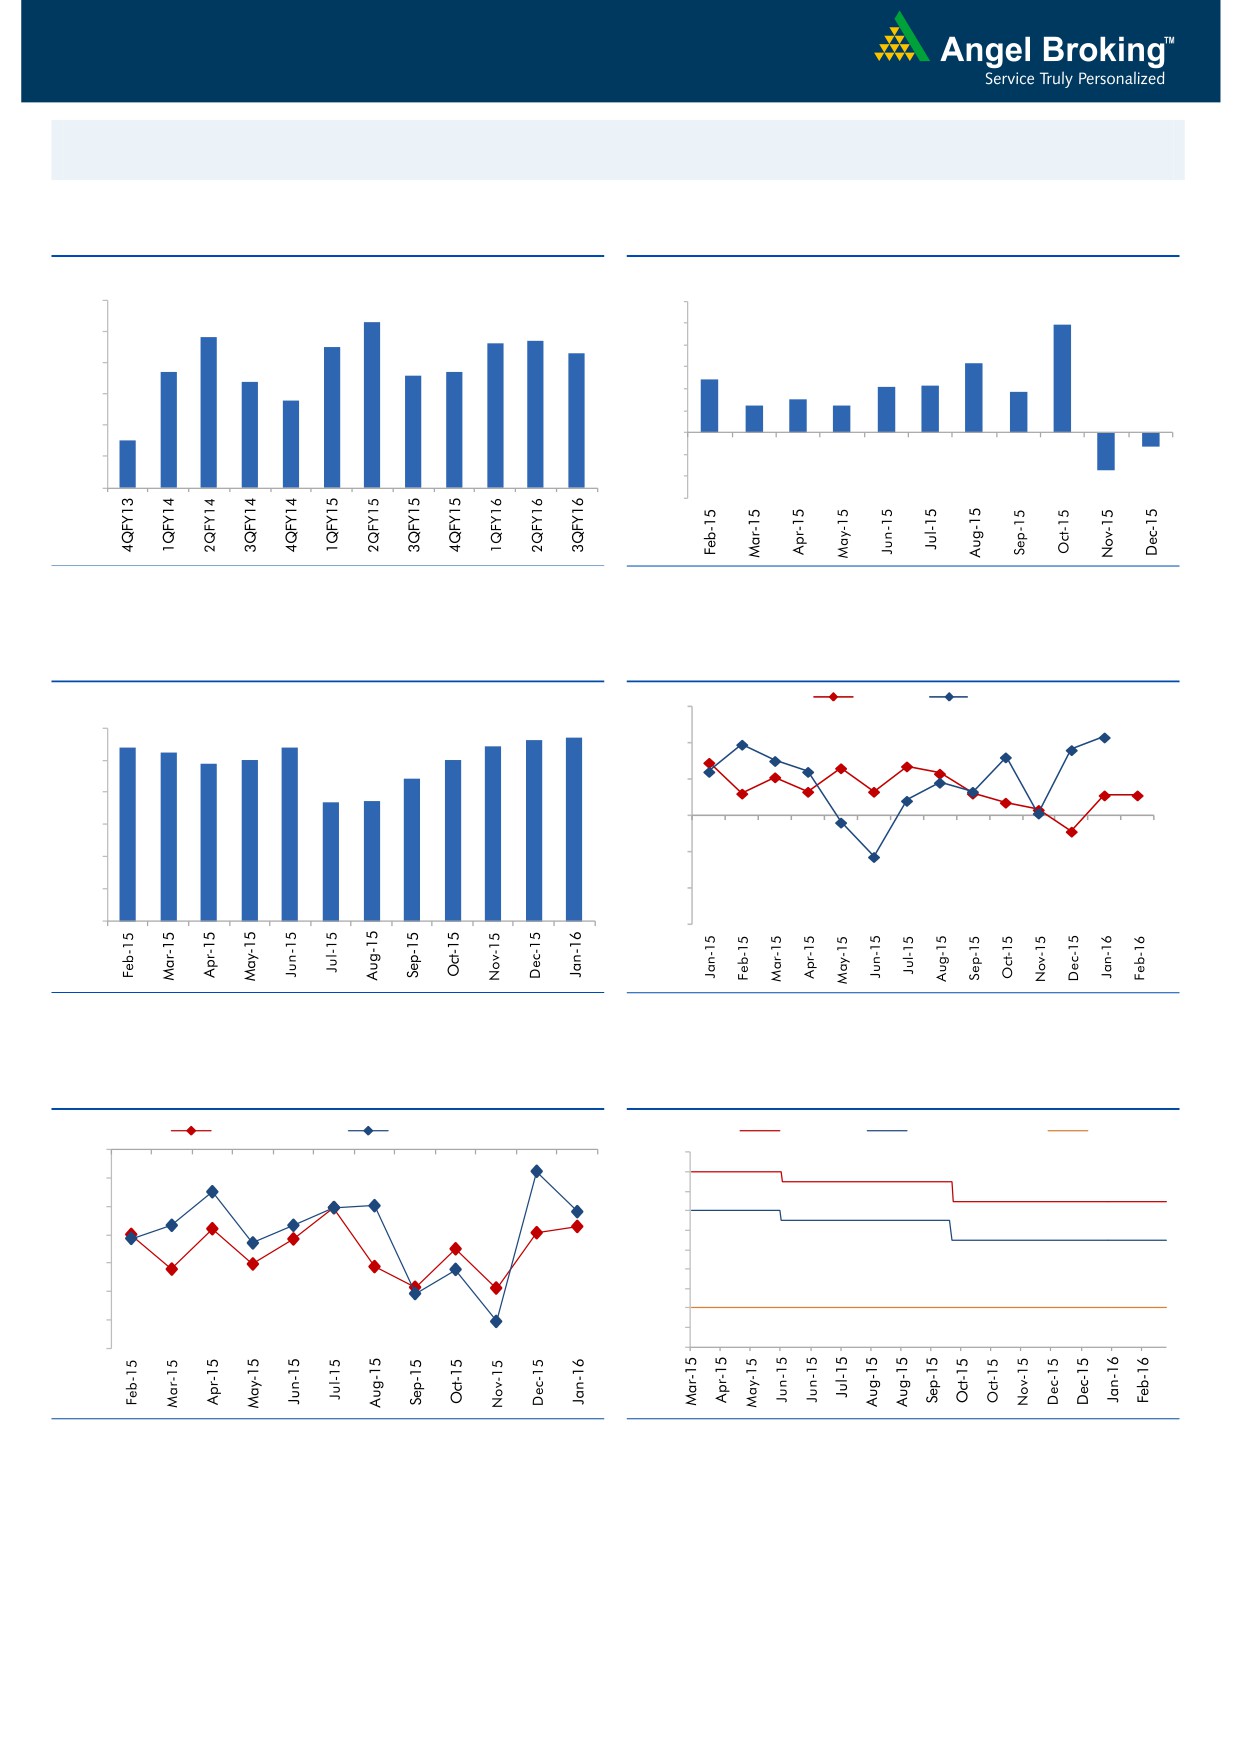
Macro watch
Exhibit 1: Quarterly GDP trends
Exhibit 2: IIP trends
(%)
(%)
9.0
12.0
8.3
9.9
7.8
7.6
7.7
10.0
8.0
7.5
7.3
8.0
6.3
6.7
6.6
6.7
7.0
6.4
4.8
6.0
4.2
4.3
3.7
5.8
3.0
4.0
2.5
2.5
6.0
2.0
5.0
4.5
-
4.0
(2.0)
(1.3)
(4.0)
3.0
(3.4)
(6.0)
Source: CSO, Angel Research
Source: MOSPI, Angel Research
Exhibit 3: Monthly CPI inflation trends
Exhibit 4: Manufacturing and services PMI
Mfg. PMI
Services PMI
(%)
56.0
5.6
5.7
6.0
5.4
5.4
5.4
5.3
4.9
5.0
5.0
54.0
5.0
4.4
3.7
3.7
52.0
4.0
50.0
3.0
2.0
48.0
1.0
46.0
-
44.0
Source: MOSPI, Angel Research
Source: Market, Angel Research; Note: Level above 50 indicates expansion
Exhibit 5: Exports and imports growth trends
Exhibit 6: Key policy rates
(%)
Exports yoy growth
Imports yoy growth
(%)
Repo rate
Reverse Repo rate
CRR
0.0
8.00
7.50
(5.0)
7.00
(10.0)
6.50
6.00
(15.0)
5.50
(20.0)
5.00
(25.0)
4.50
4.00
(30.0)
3.50
(35.0)
3.00
Source: Bloomberg, Angel Research
Source: RBI, Angel Research
Market Outlook
March 3, 2016
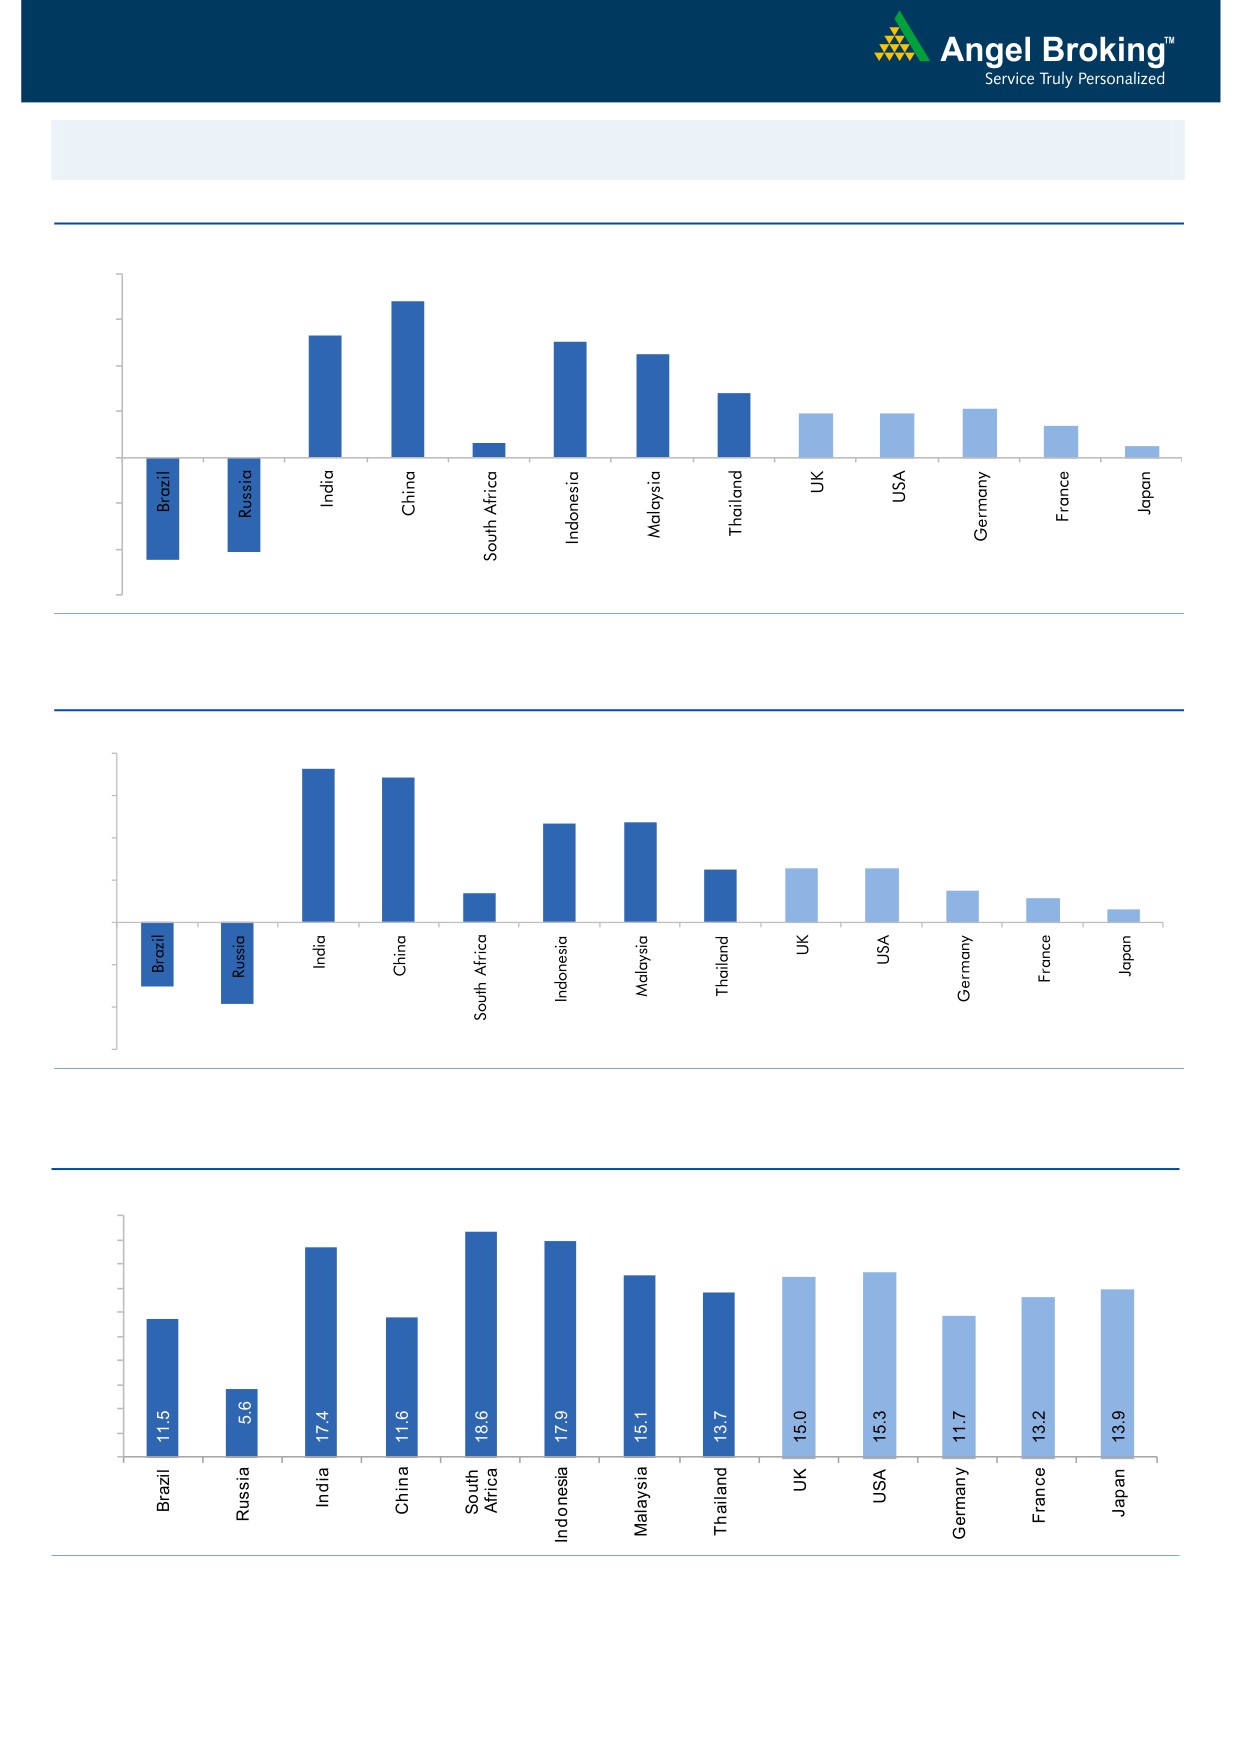
Global watch
Exhibit 1: Latest quarterly GDP Growth (%, yoy) across select developing and developed countries
(%)
8.0
6.8
6.0
5.3
5.0
4.5
4.0
2.8
1.9
1.9
2.1
1.4
2.0
0.6
0.5
-
(2.0)
(4.0)
(4.1)
(4.5)
(6.0)
Source: Bloomberg, Angel Research
Exhibit 2: 2015 GDP Growth projection by IMF (%, yoy) across select developing and developed countries
(%)
8.0
7.3
6.8
6.0
4.7
4.7
4.0
2.5
2.5
2.6
1.4
1.5
2.0
1.2
0.6
-
(2.0)
(3.0)
(4.0)
(3.8)
(6.0)
Source: IMF, Angel Research
Exhibit 3: One year forward P-E ratio across select developing and developed countries
(x)
20.0
18.0
16.0
14.0
12.0
10.0
8.0
6.0
4.0
2.0
-
Source: IMF, Angel Research
Market Outlook
March 3, 2016
Exhibit 4: Relative performance of indices across globe
Returns (%)
Country
Name of index
Closing price
1M
3M
1YR
Brazil
Bovespa
44,893
16.2
(7.0)
(12.5)
Russia
Micex
1,833
2.7
0.2
2.8
India
Nifty
7,369
(2.5)
(7.4)
(16.7)
China
Shanghai Composite
2,850
4.4
(21.1)
(11.6)
South Africa
Top 40
45,266
3.2
(2.3)
(3.6)
Mexico
Mexbol
44,616
2.3
2.8
2.3
Indonesia
LQ45
848
6.0
7.0
(9.7)
Malaysia
KLCI
1,691
3.6
0.8
(7.0)
Thailand
SET 50
880
6.5
0.6
(16.7)
USA
Dow Jones
16,899
2.6
(5.1)
(6.6)
UK
FTSE
6,147
1.4
(3.3)
(11.7)
Japan
Nikkei
16,747
(4.4)
(16.0)
(9.3)
Germany
DAX
9,777
0.2
(13.4)
(15.0)
France
CAC
4,425
0.7
(10.0)
(9.4)
Source: Bloomberg, Angel Research
Stock Watch
March 03, 2016
Company Name
Reco
CMP
Target
Mkt Cap
Sales ( Čcr )
OPM(%)
EPS (Č)
PER(x)
P/BV(x)
RoE(%)
EV/Sales(x)
(Č)
Price ( Č)
( Č cr )
FY16E FY17E
FY16E
FY17E
FY16E
FY17E
FY16E
FY17E
FY16E
FY17E
FY16E
FY17E
FY16E
FY17E
Agri / Agri Chemical
Rallis
Neutral
151
-
2,936
2,097
2,415
14.4
14.4
9.5
11.0
15.9
13.7
3.2
2.7
21.1
21.3
1.4
1.2
United Phosphorus
Buy
412
480
17,665
12,500
14,375
18.3
18.3
29.8
35.9
13.8
11.5
2.6
2.1
20.0
20.3
1.4
1.1
Auto & Auto Ancillary
Ashok Leyland
Buy
94
111
26,609
17,995
21,544
11.4
11.6
3.4
4.7
27.5
19.9
4.8
4.4
17.7
22.2
1.3
1.1
Bajaj Auto
Buy
2,234
2,585
64,633
22,709
25,860
20.9
20.1
129.0
143.6
17.3
15.6
5.3
4.6
30.7
29.4
2.3
2.0
Bharat Forge
Buy
790
875
18,394
7,351
8,318
19.9
19.7
31.2
36.5
25.3
21.7
4.5
3.8
19.3
19.2
2.5
2.2
Eicher Motors
Accumulate
19,322
20,044
52,481
15,556
16,747
15.5
17.3
464.8
597.5
41.6
32.3
15.2
11.2
36.2
34.3
3.2
2.9
Gabriel India
Buy
85
101
1,226
1,415
1,544
8.7
9.0
4.6
5.4
18.6
15.8
3.4
3.0
18.1
18.9
0.7
0.7
Hero Motocorp
Accumulate
2,808
2,864
56,067
28,244
30,532
15.5
15.9
156.7
168.5
17.9
16.7
7.2
6.1
39.9
36.4
1.6
1.5
Jamna Auto Industries Buy
134
160
1,067
1,281
1,473
11.2
11.5
7.6
9.2
17.6
14.5
4.4
3.6
25.4
25.2
0.8
0.7
L G Balakrishnan & Bros Neutral
449
-
704
1,254
1,394
11.6
11.8
35.9
41.7
12.5
10.8
1.7
1.5
13.5
13.8
0.6
0.6
Mahindra and Mahindra Accumulate
1,199
1,364
74,472
38,416
42,904
13.7
13.9
54.8
63.4
21.9
18.9
3.4
3.0
15.4
15.8
1.6
1.4
Maruti
Neutral
3,612
-
109,102
57,865
68,104
16.4
16.7
176.3
225.5
20.5
16.0
4.0
3.4
19.4
21.2
1.5
1.2
Minda Industries
Buy
824
1,047
1,308
2,523
2,890
8.7
9.0
55.0
65.4
15.0
12.6
2.9
2.4
19.3
18.7
0.6
0.5
Motherson Sumi
Buy
244
313
32,288
39,343
45,100
8.8
9.1
10.1
12.5
24.2
19.5
7.7
6.0
35.3
34.4
0.8
0.7
Rane Brake Lining
Buy
376
465
298
454
511
11.5
12.0
25.2
31.0
14.9
12.1
2.2
2.0
14.9
16.6
0.7
0.7
Setco Automotive
Neutral
31
-
412
594
741
12.7
13.7
1.7
3.2
18.2
9.6
1.9
1.7
10.4
16.9
1.2
1.0
Tata Motors
Buy
317
371
91,524
259,686
273,957
13.0
13.4
25.9
29.5
12.2
10.8
1.6
1.4
8.0
9.0
0.5
0.5
TVS Motor
Buy
288
330
13,664
11,263
13,122
6.9
8.5
9.2
15.0
31.3
19.2
7.1
5.7
22.7
29.6
1.1
0.9
Amara Raja Batteries
Buy
876
1,040
14,964
4,892
5,871
17.4
17.6
28.8
37.1
30.4
23.6
7.1
5.7
23.4
24.1
2.9
2.4
Exide Industries
Buy
132
162
11,233
6,950
7,784
14.4
14.8
6.6
7.3
20.0
18.1
2.5
2.3
12.6
12.8
1.3
1.2
Apollo Tyres
Buy
165
183
8,401
12,056
12,714
17.2
16.4
23.0
20.3
7.2
8.1
1.3
1.1
17.7
13.6
0.7
0.7
Ceat
Buy
1,047
1,119
4,236
6,041
6,597
14.1
13.7
99.5
111.9
10.5
9.4
2.1
1.7
19.6
18.5
0.8
0.7
JK Tyres
Neutral
80
-
1,813
7,446
7,669
15.2
14.0
19.6
18.4
4.1
4.4
1.0
0.9
25.2
19.5
0.6
0.5
Swaraj Engines
Accumulate
873
919
1,084
552
630
14.2
14.7
44.6
54.1
19.6
16.1
4.6
4.1
23.2
25.6
1.7
1.4
Subros
Neutral
83
-
500
1,293
1,527
11.8
11.9
4.2
6.7
19.8
12.4
1.5
1.4
7.7
11.5
0.7
0.6
Indag Rubber
Neutral
157
-
412
283
329
17.0
17.2
13.0
15.4
12.1
10.2
2.6
2.2
21.8
21.6
1.1
0.9
Capital Goods
ACE
Neutral
37
-
370
660
839
4.7
8.2
1.0
3.9
37.4
9.6
1.2
1.0
3.2
11.3
0.7
0.5
BEML
Buy
1,030
1,157
4,289
3,277
4,006
6.0
8.9
36.2
64.3
28.5
16.0
2.0
1.8
5.7
11.7
1.3
1.0
Bharat Electronics
Buy
1,051
1,414
25,218
7,737
8,634
16.8
17.2
54.0
61.5
19.5
17.1
2.8
2.5
39.3
45.6
2.3
1.9
Stock Watch
March 03, 2016
Company Name
Reco
CMP
Target
Mkt Cap
Sales ( Čcr )
OPM(%)
EPS (Č)
PER(x)
P/BV(x)
RoE(%)
EV/Sales(x)
(Č)
Price ( Č)
( Č cr )
FY16E
FY17E
FY16E
FY17E
FY16E
FY17E
FY16E
FY17E
FY16E
FY17E
FY16E
FY17E
FY16E
FY17E
Capital Goods
Voltas
Buy
244
353
8,070
5,363
5,963
8.0
9.1
11.0
13.8
22.2
17.7
3.4
3.0
16.2
17.9
1.3
1.2
BGR Energy
Neutral
99
-
713
3,615
3,181
9.5
9.4
16.7
12.4
5.9
8.0
0.6
0.6
10.0
7.0
0.6
0.8
BHEL
Neutral
97
-
23,803
33,722
35,272
10.8
11.7
10.5
14.2
9.3
6.9
0.7
0.6
7.0
9.0
0.7
0.7
Blue Star
Buy
330
439
2,965
3,548
3,977
6.3
6.9
13.7
17.2
24.1
19.2
6.1
3.9
26.1
25.4
0.9
0.8
Crompton Greaves
Neutral
137
-
8,583
13,484
14,687
4.9
6.2
4.5
7.1
30.4
19.3
2.2
2.0
7.2
10.8
0.7
0.7
Greaves Cotton
Neutral
125
-
3,054
1,655
1,755
16.6
16.8
7.4
7.8
16.9
16.0
3.4
3.2
21.1
20.6
1.7
1.6
Inox Wind
Buy
238
458
5,289
4,980
5,943
17.0
17.5
26.6
31.6
9.0
7.5
2.7
2.0
35.0
30.0
1.1
0.9
KEC International
Neutral
113
-
2,913
8,791
9,716
6.1
6.8
5.4
8.2
21.0
13.8
2.1
1.9
10.0
14.0
0.5
0.5
Thermax
Neutral
755
-
8,997
6,413
7,525
7.4
8.5
30.5
39.3
24.8
19.2
3.8
3.3
15.0
17.0
1.4
1.1
Cement
ACC
Neutral
1,243
-
23,332
13,151
14,757
16.4
18.3
63.9
83.4
19.5
14.9
2.5
2.3
13.3
16.1
1.5
1.3
Ambuja Cements
Neutral
196
-
30,386
11,564
12,556
19.4
20.7
8.9
10.1
22.0
19.4
2.8
2.6
12.8
13.8
2.2
2.0
HeidelbergCement
Neutral
66
-
1,493
1,772
1,926
13.3
15.4
1.0
3.0
65.9
22.0
1.7
1.5
2.6
7.9
1.4
1.2
India Cements
Neutral
73
-
2,241
4,216
4,840
18.0
19.5
4.0
9.9
18.2
7.4
0.7
0.7
4.0
9.5
0.8
0.6
JK Cement
Buy
506
605
3,539
3,661
4,742
10.1
15.8
7.5
28.5
67.5
17.8
2.0
1.8
7.5
22.9
1.4
1.0
J K Lakshmi Cement
Neutral
288
-
3,384
2,947
3,616
16.7
19.9
11.5
27.2
25.0
10.6
2.4
2.1
9.8
20.8
1.5
1.2
Mangalam Cements
Neutral
188
-
502
1,053
1,347
10.5
13.3
8.4
26.0
22.4
7.2
0.9
0.9
4.3
12.5
0.8
0.6
Orient Cement
Neutral
137
-
2,813
1,854
2,524
21.2
22.2
7.7
11.1
17.8
12.4
2.6
2.2
13.3
15.7
2.3
1.6
Ramco Cements
Neutral
372
-
8,856
4,036
4,545
20.8
21.3
15.1
18.8
24.6
19.8
3.0
2.7
12.9
14.3
2.6
2.3
Shree Cement^
Neutral
10,828
-
37,721
7,150
8,742
26.7
28.6
228.0
345.5
47.5
31.3
7.0
5.9
15.7
20.3
4.7
3.7
UltraTech Cement
Accumulate
2,974
3,107
81,605
24,669
29,265
18.2
20.6
82.0
120.0
36.3
24.8
3.9
3.4
11.3
14.7
3.1
2.7
Construction
ITNL
Neutral
71
-
2,350
7,360
8,825
34.0
35.9
7.0
9.0
10.2
7.9
0.4
0.3
3.2
3.7
3.7
3.6
KNR Constructions
Buy
502
603
1,412
937
1,470
14.3
14.0
44.2
38.6
11.4
13.0
2.3
2.0
15.4
15.4
1.5
1.0
Larsen & Toubro
Buy
1,138
1,310
105,984
58,870
65,708
8.3
10.3
42.0
53.0
27.1
21.5
1.9
1.7
8.8
11.2
1.9
1.7
Gujarat Pipavav Port
Neutral
155
-
7,503
629
684
51.0
52.2
6.4
5.9
24.3
26.3
3.2
2.9
15.9
12.7
11.0
9.9
MBL Infrastructures
Buy
135
285
558
2,313
2,797
12.2
14.6
19.0
20.0
7.1
6.7
0.7
0.7
11.3
10.6
0.9
0.8
Nagarjuna Const.
Neutral
69
-
3,841
7,892
8,842
8.8
9.1
3.0
5.3
23.0
13.0
1.2
1.1
5.0
8.5
0.7
0.6
PNC Infratech
Buy
480
558
2,464
1,873
2,288
13.2
13.5
24.0
32.0
20.0
15.0
1.9
1.7
12.1
12.3
1.4
1.2
Simplex Infra
Neutral
215
-
1,066
5,955
6,829
10.3
10.5
16.0
31.0
13.5
7.0
0.7
0.7
5.3
9.9
0.7
0.6
Power Mech Projects
Neutral
570
-
839
1,539
1,801
12.8
12.7
59.0
72.1
9.7
7.9
1.5
1.2
18.6
16.8
0.6
0.5
Stock Watch
March 03, 2016
Company Name
Reco
CMP
Target
Mkt Cap
Sales ( Čcr )
OPM(%)
EPS (Č)
PER(x)
P/BV(x)
RoE(%)
EV/Sales(x)
(Č)
Price ( Č)
( Č cr )
FY16E
FY17E
FY16E
FY17E
FY16E
FY17E
FY16E
FY17E
FY16E
FY17E
FY16E
FY17E
FY16E
FY17E
Construction
Sadbhav Engineering
Buy
247
289
4,230
3,481
4,219
10.7
10.8
8.2
11.7
30.1
21.1
2.9
2.5
10.3
13.5
1.3
1.1
NBCC
Buy
911
1,089
10,929
5,816
7,382
6.9
7.7
29.6
39.8
30.8
22.9
5.5
4.4
24.1
26.7
1.5
1.2
MEP Infra
Neutral
40
-
654
1,956
1,876
28.1
30.5
1.3
3.0
31.0
13.4
6.5
4.4
21.2
32.8
1.7
1.7
SIPL
Neutral
90
-
3,167
675
1,042
62.4
64.7
-
-
3.4
3.8
-
-
15.7
10.6
Financials
Allahabad Bank
Neutral
49
-
2,916
8,569
9,392
2.8
2.9
16.3
27.5
3.0
1.8
0.3
0.2
7.6
11.9
-
-
Axis Bank
Buy
407
494
96,923
26,473
31,527
3.5
3.6
35.7
43.5
11.4
9.4
1.9
1.7
17.9
18.9
-
-
Bank of Baroda
Neutral
145
-
33,445
18,485
21,025
1.9
2.0
13.5
21.1
10.8
6.9
0.9
0.8
7.3
10.6
-
-
Bank of India
Neutral
93
-
7,555
15,972
17,271
1.9
2.0
15.3
33.4
6.1
2.8
0.3
0.2
3.6
7.6
-
-
Canara Bank
Neutral
177
-
9,611
15,441
16,945
2.0
2.1
46.6
70.4
3.8
2.5
0.3
0.3
8.0
11.2
-
-
Dena Bank
Neutral
27
-
1,762
3,440
3,840
2.1
2.3
7.3
10.0
3.8
2.7
0.3
0.2
6.1
7.9
-
-
Federal Bank
Neutral
50
-
8,589
3,477
3,999
3.0
3.0
5.0
6.2
10.0
8.0
1.0
0.9
10.6
11.9
-
-
HDFC
Neutral
1,100
-
173,766
10,358
11,852
3.3
3.3
41.1
47.0
26.8
23.4
5.1
4.6
24.7
24.9
-
-
HDFC Bank
Buy
1,008
1,262
254,643
38,309
47,302
4.3
4.3
49.3
61.1
20.4
16.5
3.5
3.0
18.5
19.7
-
-
ICICI Bank
Buy
220
254
128,004
34,279
39,262
3.3
3.3
21.0
24.4
10.5
9.0
1.8
1.5
14.4
14.7
-
-
IDBI Bank
Neutral
64
-
12,160
9,625
10,455
1.8
1.8
8.5
14.2
7.5
4.5
0.5
0.4
5.9
9.3
-
-
Indian Bank
Neutral
84
-
4,046
6,160
6,858
2.5
2.5
24.5
29.8
3.4
2.8
0.3
0.2
7.7
8.6
-
-
LIC Housing Finance
Buy
452
592
22,801
3,101
3,745
2.5
2.5
33.0
40.2
13.7
11.3
2.6
2.2
19.7
20.5
-
-
Oriental Bank
Neutral
85
-
2,552
7,643
8,373
2.4
2.4
37.2
45.4
2.3
1.9
0.2
0.2
8.2
9.4
-
-
Punjab Natl.Bank
Neutral
79
-
15,424
23,638
26,557
2.8
2.8
17.9
27.2
4.4
2.9
0.4
0.4
8.5
12.0
-
-
South Ind.Bank
Neutral
17
-
2,349
1,965
2,185
2.5
2.5
2.5
3.3
7.0
5.3
0.7
0.6
9.5
11.7
-
-
St Bk of India
Accumulate
181
177
140,390
79,958
86,061
2.6
2.6
13.4
20.7
13.5
8.8
1.1
1.0
11.5
12.8
-
-
Union Bank
Neutral
121
-
8,335
12,646
14,129
2.3
2.4
31.0
39.1
3.9
3.1
0.4
0.4
9.8
11.4
-
-
Vijaya Bank
Neutral
33
-
2,792
3,536
3,827
1.9
1.9
5.5
6.7
5.9
4.9
0.5
0.4
7.8
8.8
-
-
Yes Bank
Accumulate
754
767
31,696
7,190
9,011
3.2
3.3
58.2
69.7
13.0
10.8
2.3
2.0
19.2
19.6
-
-
FMCG
Asian Paints
Neutral
872
-
83,623
16,553
19,160
16.0
16.2
17.7
21.5
49.3
40.6
13.1
11.8
29.4
31.2
4.8
4.1
Britannia
Neutral
2,870
-
34,431
8,481
9,795
14.0
14.1
65.5
78.3
43.8
36.7
20.7
17.0
38.3
41.2
3.8
3.3
Colgate
Neutral
835
-
22,719
4,836
5,490
19.5
19.7
48.5
53.2
17.2
15.7
12.6
11.0
99.8
97.5
4.5
4.0
Dabur India
Accumulate
244
267
42,835
9,370
10,265
17.1
17.2
7.3
8.1
33.2
30.1
10.0
8.1
33.7
30.6
4.4
4.0
GlaxoSmith Con*
Accumulate
5,635
6,118
23,700
4,919
5,742
17.2
17.4
168.3
191.2
33.5
29.5
9.5
8.1
28.8
28.9
4.3
3.7
Stock Watch
March 03, 2016
Company Name
Reco
CMP
Target
Mkt Cap
Sales ( Čcr )
OPM(%)
EPS (Č)
PER(x)
P/BV(x)
RoE(%)
EV/Sales(x)
(Č)
Price ( Č)
( Č cr )
FY16E FY17E
FY16E
FY17E
FY16E
FY17E
FY16E
FY17E
FY16E
FY17E
FY16E
FY17E
FY16E
FY17E
FMCG
Godrej Consumer
Neutral
1,256
-
42,764
10,168
12,886
16.1
16.1
32.1
38.4
39.1
32.7
8.0
7.3
19.7
21.0
4.1
3.2
HUL
Neutral
847
-
183,366
34,940
38,957
17.5
17.7
20.8
24.7
40.7
34.3
45.3
36.2
110.5
114.2
4.9
4.4
ITC
Buy
320
359
257,144
36,804
38,776
37.9
37.9
12.2
12.9
26.2
24.8
7.3
6.4
27.7
25.8
6.0
5.7
Marico
Neutral
237
-
30,577
6,551
7,766
15.7
16.0
10.4
12.5
22.8
19.0
6.6
5.5
33.2
32.4
4.6
3.9
Nestle*
Buy
5,082
6,646
49,002
11,291
12,847
22.2
22.3
158.9
184.6
32.0
27.5
16.7
15.0
55.0
57.3
4.1
3.6
Tata Global
Buy
110
144
6,936
8,635
9,072
9.8
9.9
6.5
7.6
16.9
14.5
1.7
1.6
6.8
7.4
0.7
0.7
IT
HCL Tech^
Buy
855
1,038
120,502
42,038
47,503
21.2
21.5
51.5
57.7
16.6
14.8
3.6
2.8
21.5
18.8
2.3
1.9
Infosys
Buy
1,156
1,347
265,584
61,850
69,981
27.5
27.5
59.4
65.7
19.5
17.6
4.1
3.5
21.2
20.1
3.3
2.8
TCS
Buy
2,320
2,854
457,051
108,487
122,590
28.3
28.5
122.8
138.4
18.9
16.8
7.2
6.5
38.0
38.9
3.6
3.1
Tech Mahindra
Buy
456
530
44,123
26,524
29,177
16.2
17.0
28.8
33.6
15.8
13.6
3.1
2.6
19.3
19.1
1.3
1.1
Wipro
Buy
540
680
133,375
50,808
56,189
23.7
23.8
37.3
40.7
14.5
13.3
2.8
2.5
19.2
17.7
2.0
1.6
Media
D B Corp
Buy
316
356
5,802
2,241
2,495
27.8
27.9
21.8
25.6
14.5
12.3
3.8
3.3
26.7
28.5
2.5
2.2
HT Media
Neutral
80
-
1,862
2,495
2,603
11.2
11.2
7.3
8.6
11.0
9.3
0.9
0.8
7.4
8.1
0.2
0.2
Jagran Prakashan
Buy
153
189
5,012
2,170
2,355
27.2
26.2
8.9
9.9
17.2
15.5
3.6
3.2
20.9
20.5
2.1
2.0
Sun TV Network
Neutral
354
-
13,960
2,779
3,196
70.2
70.5
22.8
27.3
15.5
13.0
3.8
3.5
26.7
28.3
4.3
3.7
Hindustan Media
Neutral
259
-
1,903
920
1,031
20.0
20.0
19.2
20.9
13.5
12.4
2.2
1.9
16.4
15.3
1.6
1.4
Ventures
Metals & Mining
Coal India
Buy
311
380
196,723
76,167
84,130
19.9
22.3
22.4
25.8
13.9
12.1
5.0
4.9
35.5
41.0
1.9
1.7
Hind. Zinc
Accumulate
162
175
68,577
14,641
14,026
50.4
50.4
17.7
16.0
9.2
10.1
1.4
1.3
16.2
13.2
2.2
2.1
Hindalco
Neutral
75
-
15,446
104,356
111,186
8.7
9.5
6.7
11.1
11.1
6.8
0.4
0.4
3.5
5.9
0.7
0.6
JSW Steel
Neutral
1,133
-
27,379
42,308
45,147
16.4
20.7
(10.3)
49.5
22.9
1.3
1.2
(1.0)
5.6
1.7
1.6
NMDC
Neutral
84
-
33,284
8,237
10,893
46.6
44.5
10.0
11.7
8.4
7.2
0.9
0.8
12.5
13.0
3.7
2.8
SAIL
Neutral
38
-
15,612
45,915
53,954
7.2
10.5
1.5
4.4
25.1
8.6
0.4
0.4
2.3
4.1
1.0
0.9
Vedanta
Neutral
78
-
23,169
71,445
81,910
26.2
26.3
12.9
19.2
6.1
4.1
0.4
0.4
7.2
8.9
0.7
0.6
Tata Steel
Neutral
267
-
25,946
126,760
137,307
8.9
11.3
6.4
23.1
42.0
11.6
0.8
0.8
2.0
7.1
0.8
0.7
Oil & Gas
Cairn India
Neutral
126
-
23,642
11,323
12,490
49.4
51.0
20.7
20.7
6.1
6.1
0.4
0.4
6.4
6.1
1.0
0.4
GAIL
Neutral
324
-
41,035
64,856
70,933
9.1
9.6
24.0
28.9
13.5
11.2
1.2
1.1
8.8
9.6
0.8
0.7
ONGC
Neutral
195
-
166,832
154,564
167,321
36.8
37.4
28.6
32.5
6.8
6.0
0.9
0.8
12.7
13.5
1.3
1.2
Petronet LNG
Neutral
247
-
18,540
29,691
31,188
5.8
6.2
12.8
13.4
19.3
18.4
2.9
2.6
15.8
14.8
0.7
0.6
Indian Oil Corp
Buy
389
455
94,472
359,607
402,760
5.9
6.1
42.5
48.7
9.2
8.0
1.2
1.1
14.1
14.4
0.4
0.3
Stock Watch
March 03, 2016
Company Name
Reco
CMP
Target
Mkt Cap
Sales ( Čcr )
OPM(%)
EPS (Č)
PER(x)
P/BV(x)
RoE(%)
EV/Sales(x)
(Č)
Price ( Č)
( Č cr )
FY16E FY17E
FY16E
FY17E
FY16E
FY17E
FY16E
FY17E
FY16E
FY17E
FY16E
FY17E
FY16E
FY17E
Oil & Gas
Reliance Industries
Buy
1,001
1,150
324,329
304,775
344,392
12.6
13.4
91.3
102.6
11.0
9.8
1.2
1.1
11.8
12.0
1.0
0.8
Pharmaceuticals
Alembic Pharma
Neutral
624
-
11,772
3,274
3,802
26.9
19.4
35.0
28.7
17.8
21.8
7.9
6.0
55.6
31.2
3.5
3.0
Aurobindo Pharma
Buy
675
856
39,502
14,923
17,162
22.0
23.0
35.7
42.8
18.9
15.8
5.6
4.2
34.0
30.2
2.9
2.5
Aventis*
Neutral
4,346
-
10,009
2,082
2,371
17.4
20.8
118.2
151.5
36.8
28.7
5.4
4.3
19.9
25.5
4.4
3.7
Cadila Healthcare
Accumulate
330
352
33,809
10,224
11,840
21.0
22.0
14.6
17.6
22.6
18.8
6.2
4.9
30.8
29.0
3.2
2.7
Cipla
Buy
525
605
42,189
13,979
16,447
20.2
18.6
25.7
27.5
20.4
19.1
3.3
2.9
17.6
16.1
3.0
2.5
Dr Reddy's
Buy
3,014
3,933
51,406
16,838
19,575
25.0
23.1
167.5
178.8
18.0
16.9
3.8
3.2
23.1
20.4
3.0
2.5
Dishman Pharma
Neutral
329
-
2,651
1,733
1,906
21.5
21.5
17.0
19.9
19.3
16.5
1.9
1.8
10.5
11.2
1.9
1.6
GSK Pharma*
Neutral
3,237
-
27,417
2,870
3,158
20.0
22.1
59.5
68.3
54.4
47.4
16.1
16.5
28.5
34.3
8.8
8.1
Indoco Remedies
Neutral
275
-
2,531
1,033
1,199
15.9
18.2
9.4
13.6
29.2
20.2
4.3
3.7
15.7
19.7
2.5
2.2
Ipca labs
Buy
588
900
7,413
3,363
3,909
12.9
18.6
13.4
28.0
43.9
21.0
3.1
2.7
7.4
14.0
2.4
2.1
Lupin
Neutral
1,782
-
80,290
13,092
16,561
25.0
27.0
50.4
68.3
35.4
26.1
7.3
5.8
22.8
24.7
5.7
4.4
Sun Pharma
Accumulate
852
950
205,120
28,163
32,610
25.8
30.7
17.4
26.9
49.0
31.7
4.6
4.0
13.0
16.6
6.8
5.6
Power
Tata Power
Neutral
59
-
15,930
35,923
37,402
22.6
22.8
4.1
5.2
14.5
11.4
1.1
1.0
7.5
9.3
1.4
1.3
NTPC
Buy
127
146
104,470
87,271
99,297
23.5
23.5
11.8
13.3
10.8
9.5
1.2
1.1
11.5
12.2
2.2
1.9
Power Grid
Buy
135
170
70,810
20,702
23,361
86.7
86.4
12.1
13.2
11.2
10.3
1.7
1.5
15.6
15.1
8.2
7.7
Telecom
Bharti Airtel
Neutral
327
-
130,575
101,748
109,191
32.1
31.7
12.0
12.5
27.2
26.1
1.9
1.8
6.9
6.7
1.9
1.7
Idea Cellular
Neutral
107
-
38,417
34,282
36,941
32.0
31.5
5.9
6.2
18.1
17.2
1.7
1.5
9.9
9.3
1.7
1.6
zOthers
Abbott India
Neutral
5,114
-
10,868
2,715
3,153
14.5
14.1
134.3
152.2
38.1
33.6
9.5
7.8
27.4
25.6
3.5
2.9
Bajaj Electricals
Buy
168
237
1,697
4,719
5,287
5.2
5.8
8.6
12.7
19.6
13.3
2.2
2.0
11.4
14.8
0.3
0.3
Finolex Cables
Neutral
236
-
3,612
2,520
2,883
12.2
12.0
12.7
14.2
18.6
16.6
2.5
2.3
13.6
13.5
1.2
1.0
Goodyear India*
Buy
476
582
1,097
1,800
1,600
11.7
11.5
58.7
52.9
8.1
9.0
1.8
1.6
24.6
18.7
0.3
0.3
Hitachi
Neutral
1,180
-
3,208
1,779
2,081
7.8
8.8
21.8
33.4
54.1
35.3
8.7
7.1
17.4
22.1
1.6
1.3
Jyothy Laboratories
Neutral
280
-
5,068
1,620
1,847
11.5
11.5
7.3
8.5
38.4
33.0
5.0
4.6
13.3
14.4
2.7
2.3
MRF
Buy
34,090
45,575
14,458
20,316
14,488
21.4
21.1
5,488.0
3,798.0
6.2
9.0
2.1
1.7
41.1
21.2
0.6
0.8
Page Industries
Neutral
10,315
-
11,505
1,929
2,450
19.8
20.1
229.9
299.0
44.9
34.5
19.8
13.8
52.1
47.1
5.7
4.5
Relaxo Footwears
Neutral
410
-
4,922
1,767
2,152
12.3
12.5
19.3
25.1
21.3
16.4
5.2
4.0
27.7
27.8
2.7
2.2
Siyaram Silk Mills
Buy
936
1,354
877
1,636
1,815
11.5
11.5
89.9
104.1
10.4
9.0
1.7
1.5
17.9
17.8
0.7
0.6
Styrolution ABS India*
Neutral
567
-
998
1,271
1,440
8.6
9.2
32.0
41.1
17.7
13.8
1.8
1.6
10.7
12.4
0.7
0.6
Stock Watch
March 03, 2016
Company Name
Reco
CMP
Target
Mkt Cap
Sales ( Čcr )
OPM(%)
EPS (Č)
PER(x)
P/BV(x)
RoE(%)
EV/Sales(x)
(Č)
Price ( Č)
( Č cr )
FY16E
FY17E
FY16E
FY17E
FY16E
FY17E
FY16E
FY17E
FY16E
FY17E
FY16E
FY17E
FY16E
FY17E
zOthers
TVS Srichakra
Buy
2,196
3,217
1,681
2,035
2,252
15.9
15.3
248.6
268.1
8.8
8.2
3.9
2.8
43.6
33.9
0.8
0.7
HSIL
Buy
259
302
1,873
2,123
2,384
16.1
16.5
15.0
18.9
17.2
13.7
1.3
1.2
8.0
9.4
1.2
1.0
Kirloskar Engines India
Neutral
210
-
3,040
2,403
2,554
8.6
9.9
9.2
10.5
22.9
20.0
2.2
2.1
9.7
10.7
0.9
0.8
Ltd
M M Forgings
Buy
422
614
509
511
615
21.7
21.6
43.1
55.8
9.8
7.6
1.8
1.5
19.9
21.2
1.1
0.8
Banco Products (India) Neutral
100
-
715
1,208
1,353
11.0
12.3
10.8
14.5
9.3
6.9
1.1
1.0
11.9
14.5
0.5
0.5
Competent Automobiles Neutral
134
-
82
1,040
1,137
3.2
3.1
25.7
28.0
5.2
4.8
0.8
0.7
15.0
14.3
0.1
0.1
Nilkamal
Neutral
1,045
-
1,559
1,871
2,031
10.7
10.5
63.2
69.8
16.5
15.0
2.7
2.3
17.6
16.6
0.8
0.7
Visaka Industries
Buy
101
144
161
1,086
1,197
9.9
10.3
21.5
28.8
4.7
3.5
0.5
0.4
9.6
11.6
0.4
0.3
Transport Corporation of
Neutral
246
-
1,868
2,830
3,350
8.8
9.0
14.4
18.3
17.1
13.4
2.6
2.3
15.4
17.1
0.7
0.6
India
Elecon Engineering
Neutral
52
-
562
1,359
1,482
10.3
13.7
0.8
3.9
64.3
13.3
1.1
1.0
1.6
7.8
0.7
0.6
Surya Roshni
Buy
131
201
574
2,992
3,223
8.1
8.4
14.7
18.3
8.9
7.2
0.8
0.8
9.7
11.0
0.5
0.4
MT Educare
Neutral
160
-
636
286
366
18.3
17.7
7.7
9.4
20.7
17.0
4.4
3.8
20.2
21.1
1.8
1.4
Radico Khaitan
Buy
96
156
1,282
1,517
1,635
12.7
13.4
5.8
7.1
16.6
13.6
1.4
1.3
8.6
9.6
1.3
1.2
Garware Wall Ropes
Buy
296
473
649
862
974
11.2
11.2
24.9
29.6
11.9
10.0
1.8
1.5
15.1
15.4
0.7
0.6
Wonderla Holidays
Neutral
370
-
2,090
206
308
44.0
43.6
9.0
12.9
41.1
28.7
5.6
5.1
13.7
17.8
9.6
6.4
Linc Pen & Plastics
Accumulate
181
185
268
340
371
8.3
8.9
10.8
13.2
16.8
13.7
2.7
2.3
16.0
17.1
0.8
0.7
The Byke Hospitality
Neutral
155
-
621
222
287
20.5
20.5
5.6
7.6
27.5
20.5
5.2
4.3
18.9
20.8
2.8
2.1
Interglobe Aviation
Neutral
870
-
31,342
17,022
21,122
20.7
14.5
63.9
53.7
13.6
16.2
20.4
16.7
149.9
103.2
1.8
1.4
Coffee Day Enterprises
Neutral
229
-
4,708
2,692
2,964
17.0
18.6
-
4.7
-
48.2
2.8
2.6
0.2
5.5
2.1
2.0
Ltd
Navneet Education
Neutral
84
-
2,000
998
1,062
24.1
24.0
5.8
6.1
14.6
13.8
3.2
2.8
22.0
20.6
2.1
2.0
Navkar Corporation
Buy
157
265
2,235
365
436
38.3
37.5
5.6
5.9
27.8
26.7
1.7
1.6
6.3
6.1
6.7
5.8
Source: Company, Angel Research; Note: *December year end; #September year end; &October year end; Price as on March 02, 2016
Market Outlook
March 03, 2016
Research Team Tel: 022 - 39357800
DISCLAIMER
Angel Broking Private Limited (hereinafter referred to as “Angel”) is a registered Member of National Stock Exchange of India Limited,
Bombay Stock Exchange Limited and Metropolitian Stock Exchange of India Limited. It is also registered as a Depository Participant with
CDSL and Portfolio Manager with SEBI. It also has registration with AMFI as a Mutual Fund Distributor. Angel Broking Private Limited is a
registered entity with SEBI for Research Analyst in terms of SEBI (Research Analyst) Regulations, 2014 vide registration number
INH000000164. Angel or its associates has not been debarred/ suspended by SEBI or any other regulatory authority for accessing
/dealing in securities Market. Angel or its associates including its relatives/analyst do not hold any financial interest/beneficial ownership
of more than 1% in the company covered by Analyst. Angel or its associates/analyst has not received any compensation / managed or co
-managed public offering of securities of the company covered by Analyst during the past twelve months. Angel/analyst has not served as
an officer, director or employee of company covered by Analyst and has not been engaged in market making activity of the company
covered by Analyst.
This document is solely for the personal information of the recipient, and must not be singularly used as the basis of any investment
decision. Nothing in this document should be construed as investment or financial advice. Each recipient of this document should make
such investigations as they deem necessary to arrive at an independent evaluation of an investment in the securities of the companies
referred to in this document (including the merits and risks involved), and should consult their own advisors to determine the merits and
risks of such an investment.
Reports based on technical and derivative analysis center on studying charts of a stock's price movement, outstanding positions and
trading volume, as opposed to focusing on a company's fundamentals and, as such, may not match with a report on a company's
fundamentals.
The information in this document has been printed on the basis of publicly available information, internal data and other reliable sources
believed to be true, but we do not represent that it is accurate or complete and it should not be relied on as such, as this document is for
general guidance only. Angel Broking Pvt. Limited or any of its affiliates/ group companies shall not be in any way responsible for any
loss or damage that may arise to any person from any inadvertent error in the information contained in this report. Angel Broking Pvt.
Limited has not independently verified all the information contained within this document. Accordingly, we cannot testify, nor make any
representation or warranty, express or implied, to the accuracy, contents or data contained within this document. While Angel Broking
Pvt. Limited endeavors to update on a reasonable basis the information discussed in this material, there may be regulatory, compliance,
or other reasons that prevent us from doing so.
This document is being supplied to you solely for your information, and its contents, information or data may not be reproduced,
redistributed or passed on, directly or indirectly.
Neither Angel Broking Pvt. Limited, nor its directors, employees or affiliates shall be liable for any loss or damage that may arise from or
in connection with the use of this information.
Note: Please refer to the important ‘Stock Holding Disclosure' report on the Angel website (Research Section). Also, please refer to the
latest update on respective stocks for the disclosure status in respect of those stocks. Angel Broking Pvt. Limited and its affiliates may have
investment positions in the stocks recommended in this report.