Market Outlook
February 3, 2016
Market Cues
Domestic Indices
Chg (%)
(Pts)
(Close)
Indian markets are expected to open in red tracking the SGX Nifty and its asian
BSE Sensex
(1.2)
(286)
24,539
peers.
Nifty
(1.3)
(100)
7,456
US markets ended in red as the sell-off on Wall Street came amid a notable
Mid Cap
(1.7)
(182)
10,295
decrease by the price of crude oil, with crude for March delivery down by $1.74 to
Small Cap
(1.3)
(137)
10,765
$29.88 a barrel. Traders may have been looking ahead to the release of some key
Bankex
(1.7)
(291)
17,066
economic data in the coming days, including the closely watched monthly jobs
report due out on Friday.
Global Indices
Chg (%)
(Pts)
(Close)
The European markets dropped sharply, adding to the weakness of the previous
Dow Jones
(1.8)
(296)
16,154
session. Concerns about oversupply is weighing on crude prices as rumored talks
between Russia and OPEC regarding production cuts have failed to materialize.
Nasdaq
(2.2)
(103)
4,517
Disappointing earnings reports from energy giant BP and Swiss bank UBS also
FTSE
(2.3)
(138)
5,922
contributed to the negative mood among investors.
Nikkei
(0.6)
(115)
17,751
Indian markets fell tracking weak global markets as oil extended Monday's steep
Hang Seng
(0.8)
(149)
19,447
losses. Meanwhile, as widely expected, the Reserve Bank of India (RBI) kept its key
Shanghai Com
2.3
61
2,750
policy rates unchanged, seeking to wait for the government's budget statement at the
end of February. Metal stocks like Vedanta and Tata Steel fell about 8 percent each
Advances / Declines
BSE
NSE
on concerns over the health of the Chinese economy.
Advances
868
385
News & Result Analysis
Declines
1,843
1,175
Lupin has launched its Metformin HCl ER Tablets
Unchanged
112
52
Result Review: Amara Raja Batteries, Minda Industries, HSIL
Detailed analysis on Pg2
Volumes (` Cr)
Investor’s Ready Reckoner
BSE
2,938
Key Domestic & Global Indicators
NSE
17,360
Stock Watch: Latest investment recommendations on 150+ stocks
Refer P6 onwards
Net Inflows (` Cr)
Net
Mtd
Ytd
FII
405
405
(9,668)
Top Picks
CMP
Target
Upside
MFs
586
6,703
75,995
Company
Sector
Rating
(`)
(`)
(%)
Amara Raja Batteries Auto & Auto Ancillary
Buy
861
1,040
20.7
Top Gainers
Price (`)
Chg (%)
HCL Tech
IT
Buy
874
1,038
18.8
Justdial
592
4.5
Larsen & Toubro
Construction
Buy
1,122
1,310
16.8
Ubl
808
3.8
LIC Housing Finance Financials
Buy
452
592
30.9
Navkar Corporation Others
Buy
197
265
34.2
Atul
1,496
3.3
More Top Picks on Pg5
Niittech
548
3.0
Southbank
19
3.0
Key Upcoming Events
Previous
Consensus
Date
Region
Event Description
Reading
Expectations
Top Losers
Price (`)
Chg (%)
Feb 04
UK
BOE Announces rates
0.50
0.50
Hcc
20
(9.0)
Feb 05
US
Change in Nonfarm payrolls (thousands)
292
190
Suzlon
17
(8.6)
Feb 10
India
Exports YoY% (% Change)
(14.70)
--
Sail
39
(7.9)
Feb 10
India
Imports YoY% (% Change)
(3.90)
--
6.(
Vedl
65
(7.8)
Tatasteel
232
(7.2)
As on February 02, 2016
Market Outlook
February 3, 2016
Lupin has launched its Metformin HCl ER Tablets
Lupin announced that its US subsidiary, Lupin Pharmaceuticals Inc. has launched
its Metformin HCl ER Tablets, 500 mg and 1000 mg to market a generic
equivalent of Santarus Inc.’s Glumetza® HCl ER Tablets, 500 mg and 1000 mg.
Lupin’s Metformin HCl ER Tablets, 500 mg and 1000 mg are the AB-rated generic
equivalent of Santarus Inc.’s Glumetza® HCl ER Tablets, 500 mg and 1000 mg
strengths. It is indicated as an adjunct to diet and exercise to improve glycemic
control in adults with type II diabetes mellitus. Lupin is eligible for 180 days of
generic drug exclusivity for its Metformin HCl ER Tablets, 500 mg and 1000 mg.
Glumetza® HCI ER Tablets had US sales of US$450.4mn (IMS MAT September
2015).
The company is likely to gross sales of US$ 25-30mn during the 180-day
exclusivity and given the low contribution on overall sales, the product is unlikely to
contribute significantly to the bottom line. Thus, we maintain our neutral stance on
the stock.
Result Review
Amara Raja Batteries (CMP: `861/ TP: `1,040 /Upside: 21%)
Amara Raja Batteries Ltd (ARBL) 3QFY2016 results were ahead of estimates driven
by strong operating performance. Revenues grew 16% yoy to `1,225 cr coming in
line with estimates. Both automotive (led by market share gains) and the industrial
segment (led by strong demand in telecom) posted healthy double digit growth.
Given the soft lead prices and a better product mix, ARBL margins improved 240
bp yoy to 18.7% coming in higher than our estimate of 17.4%. ARBL reported
highest ever margins in the last six years. Given the robust operating performance,
Net profit at `136 cr came in ahead of our estimates of `126 cr. We currently
have Buy rating on the stock.
Y/E
Sales OPM
PAT
EPS ROE P/E P/BV EV/EBITDA EV/Sales
Mar
(` cr)
(%)
(` cr)
(`)
(%)
(x)
(x)
(x)
(x)
FY2016E
4,892
17.4
492
28.8 23.4 29.9
6.9
16.9
3.0
FY2017E
5,871
17.6
634
37.1 24.1 23.2
5.6
14.3
2.5
Minda Industries (CMP: `812/ TP: 1,047 /Upside: 29%)
Minda Industries Ltd (MIL) posted yet another set of strong quarterly numbers
beating our estimates. For 3QFY2016, MIL revenues grew 13% yoy to `626 cr
which was in line with our estimates. MIL continues to outpace industry growth on
back of new product introduction which has enabled it to increase the
content/vehicle. MIL operating margins improved sharply 210 bp yoy to 9.4%
coming in ahead of our estimates of
8.5%. Given the strong operating
performance the Net profit at `31.4 cr almost doubled on yoy basis and was
ahead of our estimates of `25 cr. We continue to maintain our positive stance on
the stock and upgrade our target price to `1,047 based on (16x FY2017 EPS).
Market Outlook
February 3, 2016
Y/E
Sales OPM
PAT
EPS ROE P/E P/BV EV/EBITDA EV/Sales
March
(` cr)
(%)
(` cr)
(`)
(%)
(x)
(x)
(x)
(x)
FY2016E
2,523
8.7
87
55.0
19.3
14.8
2.8
7.0
0.6
FY2017E
2,890
9.0
104
65.4
18.7
12.4
2.3
5.6
0.5
HSIL (CMP: `273/ TP: `303/ Upside: 10.8%)
HSIL reported a good set of numbers of numbers for 3QFY2016. The top-line
grew by 9.5% yoy to `506cr which is marginally higher than our estimate of
`499cr. The Building Products business grew by 17.3% yoy to `268cr while
Packaging Products business posted a muted growth of 2.0% yoy decline to
`239cr.
The raw material cost increased by 323bp yoy to 35.8% of sales and employee
cost grew by 65bp yoy to 12.0%. However, the other expenses declined by 231bp
yoy to 33.4% of sales subsiding increase in expenses. The EBITDA margin declined
by 157bp yoy to 18.8% (against our estimate of 19.7%) and EBITDA came in at
`95cr which is in-line with our estimate of `98.
The EBIT margin for the Building Products declined by 229bp yoy to 16.2% but the
same has increased by 76bp on qoq basis. The packaging products business
margin increased by 140bp yoy and 455bp qoq to 14.8%.
The interest expense has come down by ~51%% yoy to `10cr as a result of
reduction in debt. Mainly on account of lower interest expense, the bottom line
grew by 22.0% yoy to `37 which is in-line with our estimate of `38cr.
At current market price, the stock is trading at 15.9x its FY2017 earnings. We
maintain our Accumulate rating on the stock with a target price of `303. We may
change our rating post 3QFY2016 result conference call
Y/E
Sales OPM
PAT
EPS ROE P/E P/BV EV/EBITDA EV/Sales
March
(` cr)
(%)
(` cr)
(`)
(%)
(x)
(x)
(x)
(x)
FY2016E
2,095
16.5
112
15.6
8.2
19.3
1.5
6.8
1.4
FY2017E
2,353
16.6
137
18.9
9.4
15.9
1.4
6.0
1.2
Economic and Political News
Govt may announce incentives for solar projects in Budget
GST Bill: Govt will leave no stone unturned, says Venkaiah Naidu
India could raise $12.65 billion in overseas loans to boost irrigation: Reports
Corporate News
Adani's coal mine project in Australia gets environmental approval
IndianOil plans to build strong upstream portfolio
SREI Infra to raise `17,500 crore in debt next fiscal
Market Outlook
February 3, 2016
Quarterly Bloomberg Brokers Consensus Estimate
Indian Oil Corporation Ltd - February 3, 2016
Particulars (` cr)
3QFY16E
3QFY15
y-o-y (%)
2QFY16
q-o-q (%)
Net sales
80,543
1,06,927
(24.7)
85,114
(5.4)
EBITDA
3,929
(2,477)
258.6
695
465.3
EBITDA margin (%)
4.9
-2.3
0.8
Net profit
2,068
(2,638)
178.4
97
2,032.0
Market Outlook
February 3, 2016
Top Picks ★★★★★
Large Cap
Market Cap
CMP
Target
Upside
Company
Rationale
(` Cr)
(`)
(`)
(%)
To outpace battery industry growth due to better technological
Amara Raja Batteries
14,715
861
1,040
20.7
products leading to market share gains in both the automotive
OEM and replacement segments.
Earnings to grow strongly given the MHCV cyclical upturn.
Ashok Leyland
25,826
91
111
22.3
Focus on exports and LCV's provides additional growth
avenue.
The stock is trading at attractive valuations and is factoring all
HCL Tech
1,23,146
874
1,038
18.8
the bad news.
Strong visibility for a robust 20% earnings trajectory, coupled
HDFC Bank
2,66,629
1,056
1,262
19.6
with high quality of earnings on account of high quality retail
business and strategic focus on highly rated corporates.
Back on the growth trend, expect a long term growth of 14%
Infosys
2,69,845
1,175
1,347
14.7
to be a US$20bn in FY2020.
Well positioned to benefit from such expected gradual
recovery in the overall domestic capex cycle, given its presence
Larsen & Toubro
1,04,445
1,122
1,310
16.8
across various infrastructure segments, its execution
capabilities, and its strong balance sheet.
LICHF continues to grow its retail loan book at a healthy pace
with improvement in asset quality. We expect the company to
LIC Housing Finance
22,816
452
592
30.9
post a healthy loan book which is likely to reflect in a strong
earnings growth.
Source: Company, Angel Research
Mid Cap
Market Cap
CMP
Target
Upside
Company
Rationale
(` Cr)
(`)
(`)
(%)
Favourable outlook for the AC industry to augur well for
Cooling products business which is out pacing the market
Blue Star
3,181
354
439
24.1
growth. EMPPAC division's profitability to improve once
operating environment turns around.
Change in business focus towards high-margin chronic &
Garware Wall Ropes
771
353
473
34.2
lifestyle segments and increasing penetration in Europe and
US
Economic recovery to have favourable impact on advertising &
circulation revenue growth. Further, the acquisition of a radio
Jagran Prakashan
5,131
157
189
20.4
business (Radio City) would also boost the company's revenue
growth.
Massive capacity expansion along with rail advantage at ICD
Navkar Corporation
2,816
197
265
34.2
as well CFS augurs well for the company
Earnings boost on back of stable material prices and
Radico Khaitan
1,526
115
156
36.0
favourable pricing environment. Valuation discount to peers
provides additional comfort
Strong brands and distribution network would boost growth
Siyaram Silk Mills
998
1,065
1,354
27.2
going ahead. Stock currently trades at an inexpensive
valuation.
Structural shift in the Lighting industry towards LED lighting will
Surya Roshni
635
145
201
38.8
drive growth.
Source: Company, Angel Research
Market Outlook
February 03, 2016
Key Upcoming Events
Result Calendar
Date
Company
Feb 3, 2016
KEC International, Mangalam Cement, Hexaware, IOC, The Byke Hospitality
Feb 4, 2016
Bajaj Auto, ABB, J K Lakshmi Cements, Mphasis, Tata Steel, GSPL, Styrolution, Visaka Industries, Aventis, MT Educare
Feb 5, 2016
Bosch India, Vijaya Bank, Goodyear, Lupin, Cadila Healthcare, Divi's Lab., Tata Power Co., PTC India, Radico Khaitan
Feb 6, 2016
Prakash Industries, TVS Srichakra
Feb 8, 2016
JK Tyre, GlaxoSmith Con, Hitachi, Sterling Tools, Ipca labs
Motherson Sumi, Apollo Tyres, Ramco Cements, Allahabad Bank, Britannia, SAIL, Hindalco, MOIL, GAIL, Petronet
Feb 9, 2016
LNG, Dr Reddy's, Aurobindo Pharma, CESC
Tata Chemicals, Tata Global, Automotive Axle, Ambuja Cements, ACC, India Cements, Rural Elec.Corp., Bank of
Feb 10, 2016
Maharashtra, Bajaj Electrical, Finolex Cables, GSK Pharma, NHPC
Tata Motors, Ashok Leyland, BHEL, BGR Energy , Indian Bank, ONGC, Indraprasth Gas, Page Industries, GIPCL,
Feb 11, 2016
Coffee Day Enterprises Ltd
Feb 12, 2016
M&M, FAG Bearings, Nestle, BPCL, HPCL, Sun Pharma
Feb 13, 2016
Adani Power
Source: Bloomberg, Angel Research
Global economic events release calendar
Date
Time
Country
Event Description
Unit
Period
Bloomberg Data
Last Reported Estimated
Feb 3, 2016
2:25PM
Germany
PMI Services
Value
Jan F
55.40
55.40
Feb 4, 2016
7:00PM
US
Initial Jobless claims
Thousands
Jan 30
278.00
276.50
5:30PM
UK
BOE Announces rates
% Ratio
Feb 4
0.50
0.50
Feb 5, 2016
7:00PM
US
Change in Nonfarm payrolls
Thousands
Jan
292.00
190.00
7:00PM
US
Unnemployment rate
%
Jan
5.00
5.00
Feb 10, 2016
India
Imports YoY%
% Change
Jan
(3.90)
--
India
Exports YoY%
% Change
Jan
(14.70)
--
3:00PM
UK
Industrial Production (YoY)
% Change
Dec
0.90
--
Feb 12, 2016
7:30AM
India
Industrial Production YoY
% Change
Dec
(3.20)
--
3:30PM
Euro Zone
Euro-Zone GDP s.a. (QoQ)
% Change
4Q A
0.30
--
12:30PM
Germany
GDP nsa (YoY)
% Change
4Q P
1.80
--
Feb 15, 2016
12:00PM
India
Monthly Wholesale Prices YoY%
% Change
Jan
(0.73)
--
China
Exports YoY%
% Change
Jan
(1.40)
(2.00)
Feb 16, 2016
3:00PM
UK
CPI (YoY)
% Change
Jan
0.20
--
Feb 17, 2016
7:00PM
US
Housing Starts
Thousands
Jan
1,149.00
--
7:00PM
US
Building permits
Thousands
Jan
1,204.00
--
3:00PM
UK
Jobless claims change
% Change
Jan
(4.30)
--
7:45PM
US
Industrial Production
%
Jan
(0.36)
--
US
Producer Price Index (mom)
% Change
Jan
(0.70)
--
Feb 18, 2016
7:00AM
China
Consumer Price Index (YoY)
% Change
Jan
1.60
--
Feb 19, 2016
7:00PM
US
Consumer price index (mom)
% Change
Jan
(0.10)
--
8:30PM
Euro Zone
Euro-Zone Consumer Confidence
Value
Feb A
(6.30)
--
Feb 22, 2016
2:00PM
Germany
PMI Manufacturing
Value
Feb P
52.30
--
Feb 23, 2016
8:30PM
US
Existing home sales
Million
Jan
5.46
--
8:30PM
US
Consumer Confidence
S.A./ 1985=100
Feb
98.10
--
Feb 24, 2016
8:30PM
US
New home sales
Thousands
Jan
544.00
--
Feb 25, 2016
3:00PM
UK
GDP (YoY)
% Change
4Q P
1.90
--
3:30PM
Euro Zone
Euro-Zone CPI (YoY)
%
Jan F
0.40
--
Feb 26, 2016
7:00PM
US
GDP Qoq (Annualised)
% Change
4Q S
0.70
--
Source: Bloomberg, Angel Research
Market Outlook
February 3, 2016
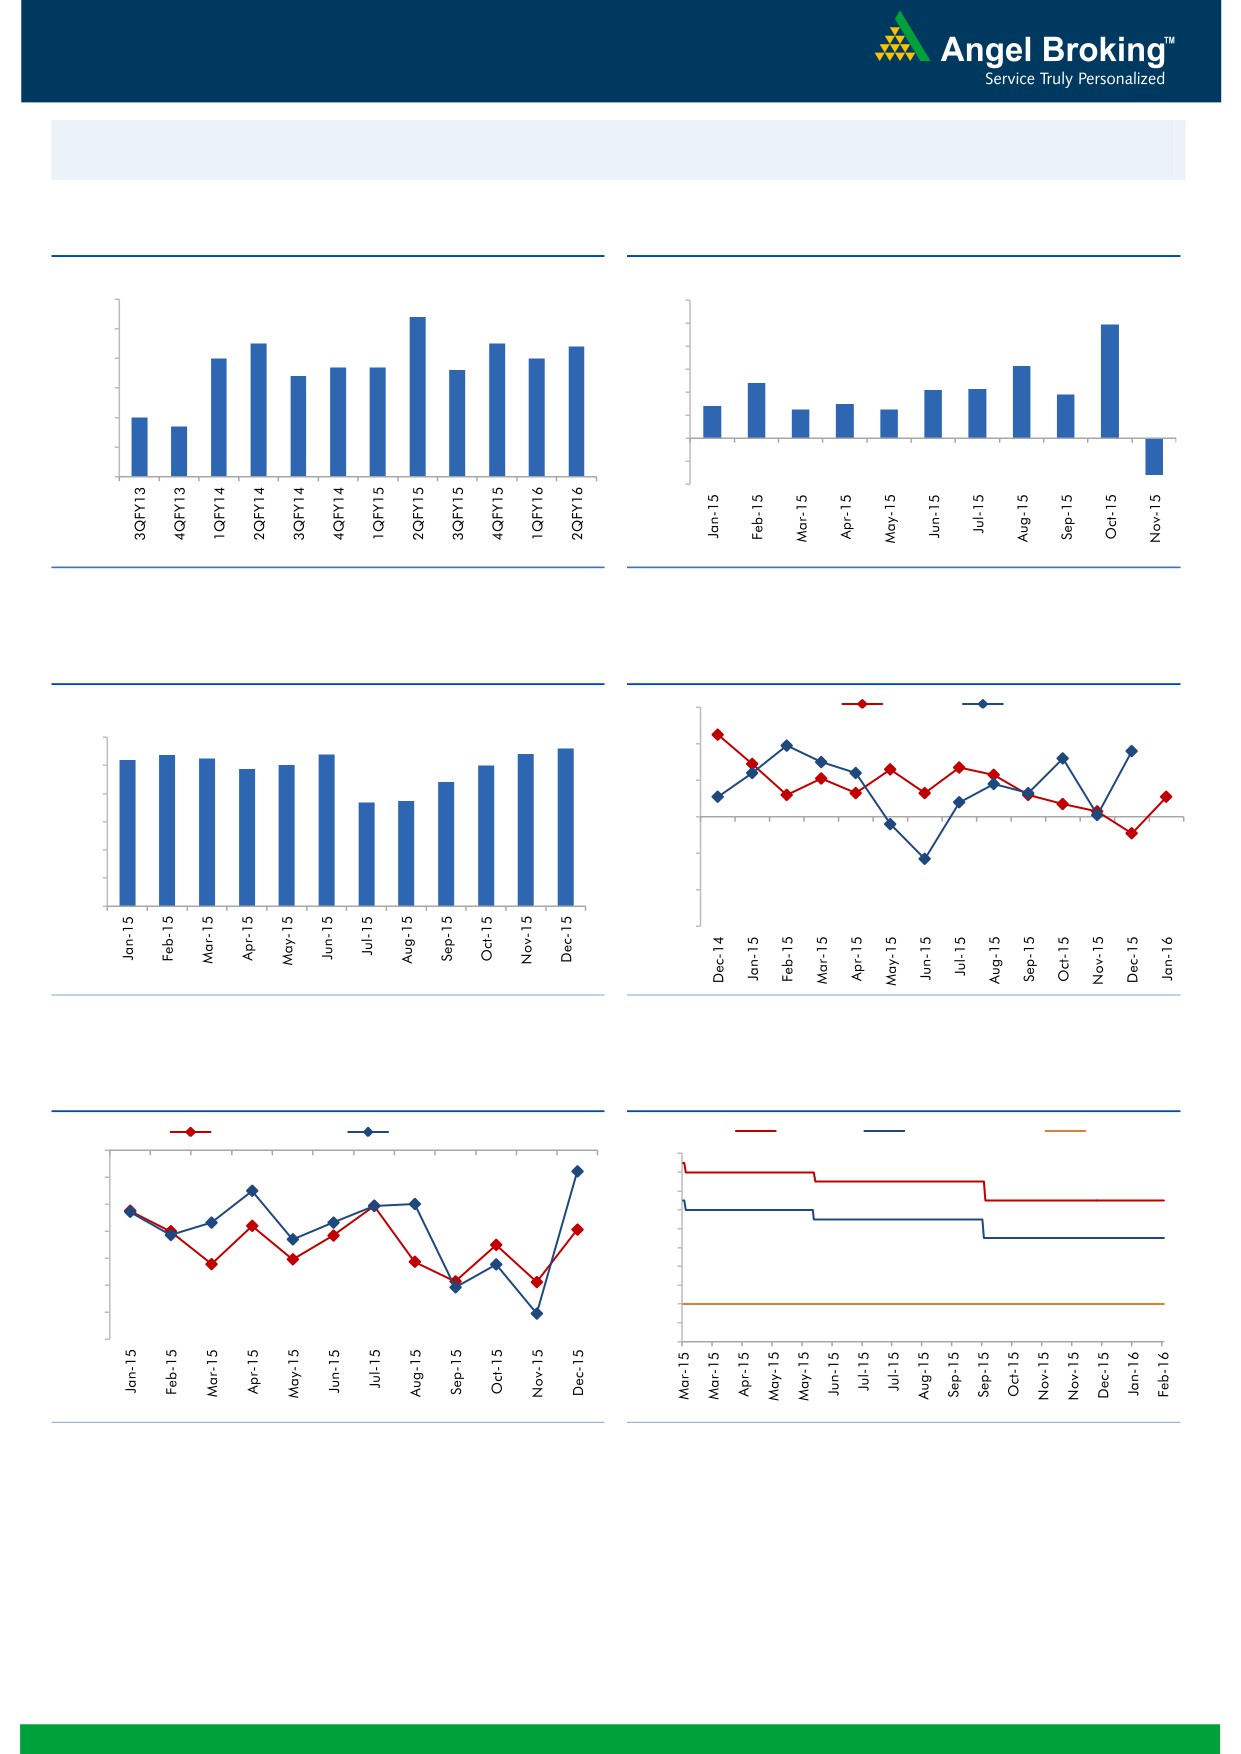
Macro watch
Exhibit 1: Quarterly GDP trends
Exhibit 2: IIP trends
(%)
(%)
9.0
8.4
12.0
9.9
7.5
7.5
10.0
8.0
7.4
7.0
7.0
6.7
6.7
6.6
8.0
6.3
7.0
6.4
6.0
4.8
4.3
4.2
3.8
6.0
2.8
3.0
4.0
2.5
2.5
5.0
4.7
5.0
2.0
(3.2)
-
4.0
(2.0)
3.0
(4.0)
Source: CSO, Angel Research
Source: MOSPI, Angel Research
Exhibit 3: Monthly CPI inflation trends
Exhibit 4: Manufacturing and services PMI
(%)
56.0
Mfg. PMI
Services PMI
5.4
5.4
5.6
6.0
5.2
5.4
5.3
54.0
4.9
5.0
5.0
5.0
4.4
3.7
3.7
52.0
4.0
3.0
50.0
2.0
48.0
1.0
46.0
-
44.0
Source: MOSPI, Angel Research
Source: Market, Angel Research; Note: Level above 50 indicates expansion
Exhibit 5: Exports and imports growth trends
Exhibit 6: Key policy rates
(%)
Exports yoy growth
Imports yoy growth
(%)
Repo rate
Reverse Repo rate
CRR
0.0
8.00
(5.0)
7.50
7.00
(10.0)
6.50
(15.0)
6.00
5.50
(20.0)
5.00
(25.0)
4.50
4.00
(30.0)
3.50
(35.0)
3.00
Source: Bloomberg, Angel Research
Source: RBI, Angel Research
Market Outlook
February 3, 2016
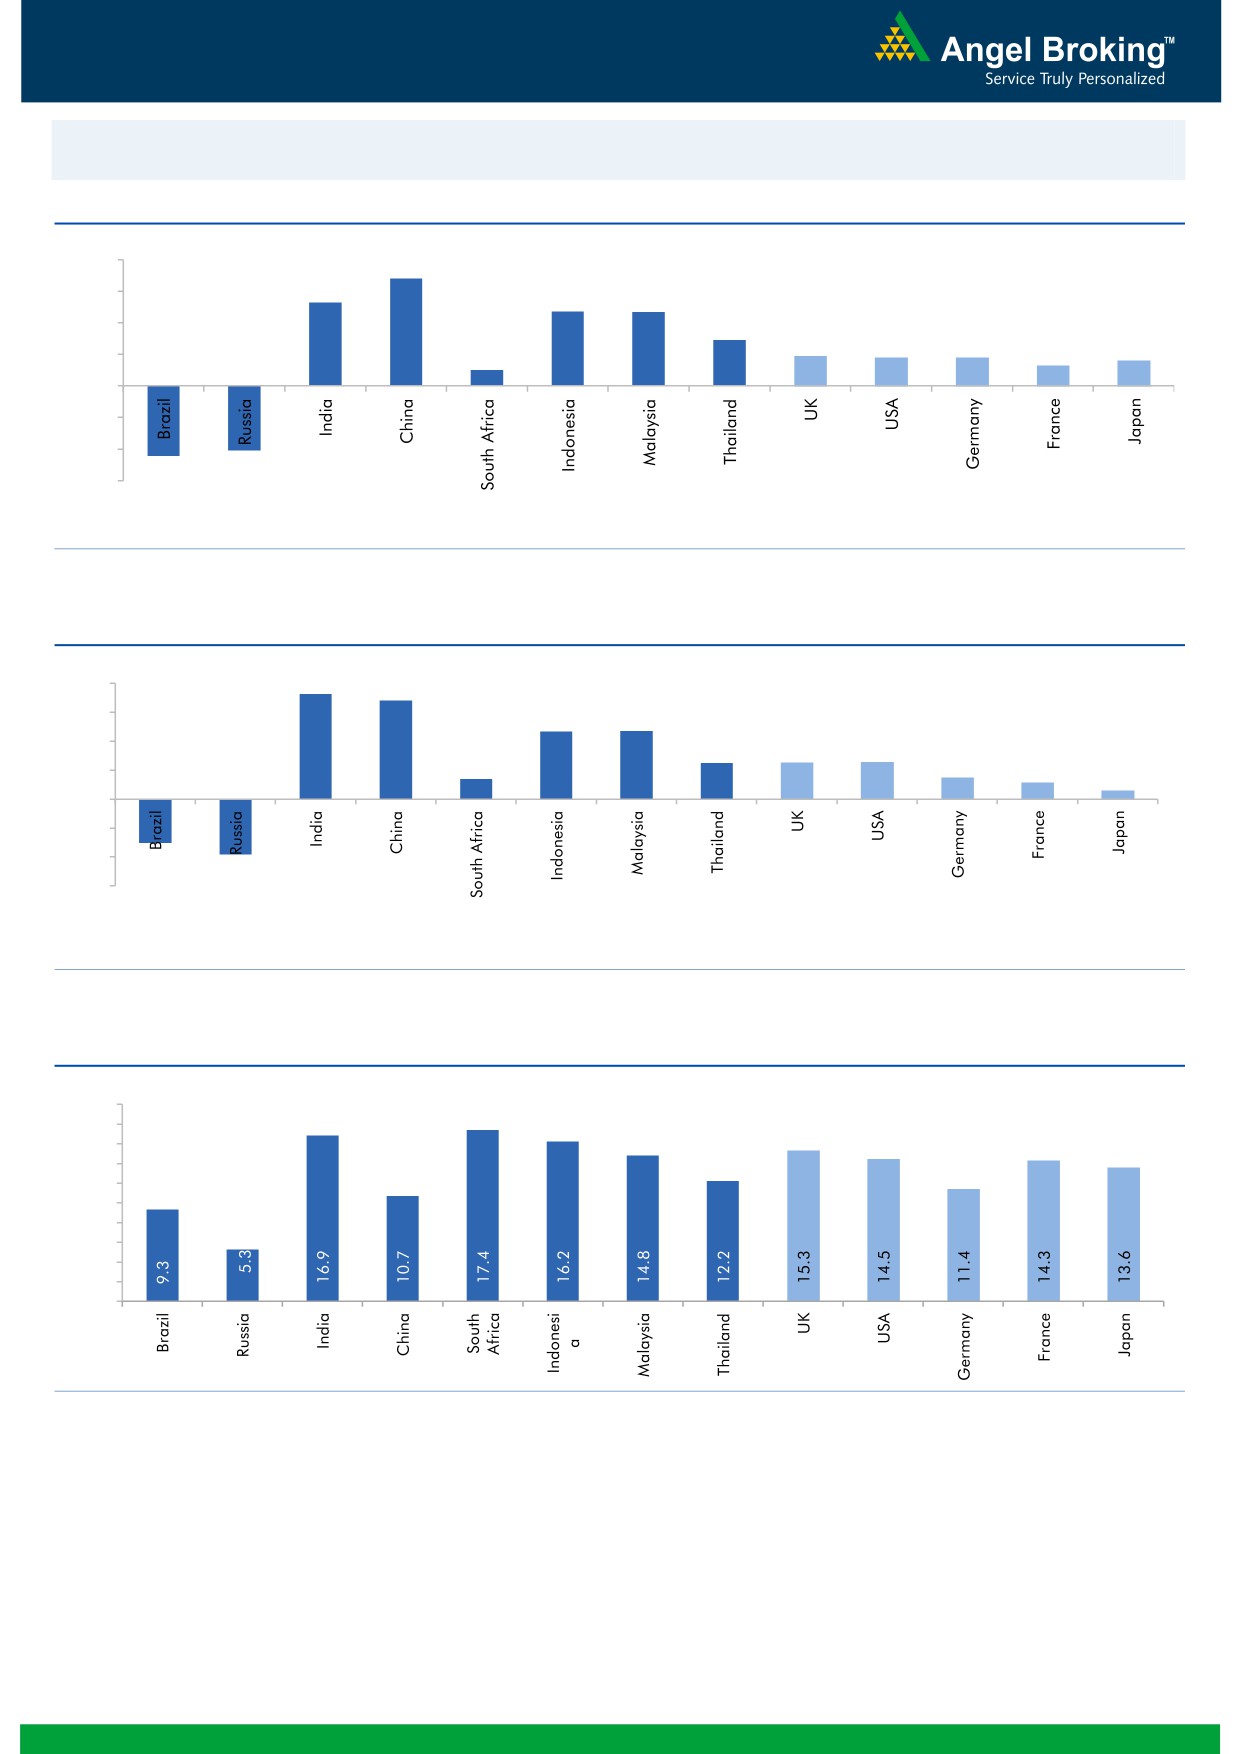
Global watch
Exhibit 1: Latest quarterly GDP Growth (%, yoy) across select developing and developed countries
(%)
8.0
6.8
5.3
6.0
4.7
4.7
4.0
2.9
1.9
1.8
1.8
1.3
1.6
2.0
1.0
-
(2.0)
(4.0)
(4.1)
(4.5)
(6.0)
Source: Bloomberg, Angel Research
Exhibit 2: 2015 GDP Growth projection by IMF (%, yoy) across select developing and developed countries
(%)
7.3
8.0
6.8
6.0
4.7
4.7
4.0
2.5
2.5
2.6
1.4
1.5
1.2
2.0
0.6
(3.8)
-
(2.0)
(4.0)
(3.0)
(6.0)
Source: IMF, Angel Research
Exhibit 3: One year forward P-E ratio across select developing and developed countries
(x)
20.0
18.0
16.0
14.0
12.0
10.0
8.0
6.0
4.0
2.0
-
Source: IMF, Angel Research
Market Outlook
February 3, 2016
Exhibit 4: Relative performance of indices across globe
Returns (%)
Country
Name of index
Closing price
1M
3M
1YR
Brazil
Bovespa
38,596
(16.1)
(19.4)
(21.6)
Russia
Micex
1,758
(6.4)
(5.9)
3.4
India
Nifty
7,456
(5.8)
(11.3)
(13.9)
China
Shanghai Composite
2,750
(19.4)
(12.9)
(9.3)
South Africa
Top 40
42,972
(7.4)
(12.8)
(3.4)
Mexico
Mexbol
43,092
(6.1)
(7.9)
(2.2)
Indonesia
LQ45
793
1.7
(0.1)
(14.4)
Malaysia
KLCI
1,653
(1.9)
(2.6)
(7.2)
Thailand
SET 50
811
(7.3)
(16.0)
(23.8)
USA
Dow Jones
16,154
(11.2)
(8.4)
(10.2)
UK
FTSE
5,922
(5.1)
(6.9)
(13.7)
Japan
Nikkei
17,751
(6.5)
(5.5)
1.4
Germany
DAX
9,581
(10.1)
(7.1)
(10.0)
France
CAC
4,284
(11.8)
(11.7)
(10.8)
Source: Bloomberg, Angel Research
Stock Watch
February 03, 2016
Company Name
Reco
CMP
Target
Mkt Cap
Sales ( Čcr )
OPM(%)
EPS (Č)
PER(x)
P/BV(x)
RoE(%)
EV/Sales(x)
(Č)
Price ( Č)
( Č cr )
FY16E FY17E
FY16E
FY17E
FY16E
FY17E
FY16E
FY17E
FY16E
FY17E
FY16E
FY17E
FY16E
FY17E
Agri / Agri Chemical
Rallis
Neutral
158
-
3,075
2,097
2,415
14.4
14.4
9.5
11.0
16.6
14.4
3.3
2.9
21.1
21.3
1.5
1.3
United Phosphorus
Buy
416
510
17,811
13,698
15,752
17.6
17.6
32.1
38.5
13.0
10.8
2.5
2.1
21.4
21.3
1.4
1.2
Auto & Auto Ancillary
Ashok Leyland
Buy
91
111
25,826
17,995
21,544
11.4
11.6
3.4
4.7
26.7
19.3
4.7
4.3
17.7
22.2
1.4
1.1
Bajaj Auto
Buy
2,363
2,728
68,364
23,695
27,298
21.3
20.4
134.6
151.5
17.6
15.6
5.6
4.8
31.8
30.6
2.4
2.1
Bharat Forge
Buy
815
943
18,970
7,867
8,881
20.0
20.3
34.4
41.0
23.7
19.9
4.6
3.8
21.1
20.9
2.5
2.2
Eicher Motors
Accumulate
17,197
19,036
46,697
15,379
16,498
15.6
16.6
473.2
574.8
36.3
29.9
13.4
10.0
36.7
33.2
3.0
2.7
Gabriel India
Buy
87
101
1,250
1,415
1,544
8.7
9.0
4.6
5.4
18.9
16.1
3.4
3.0
18.1
18.9
0.9
0.8
Hero Motocorp
Accumulate
2,522
2,774
50,357
28,561
31,559
14.7
14.7
151.1
163.2
16.7
15.5
6.5
5.5
38.7
35.6
1.6
1.4
Jamna Auto Industries Neutral
147
-
1,174
1,292
1,486
9.3
9.8
6.0
7.5
24.5
19.6
5.1
4.3
20.7
21.8
1.0
0.9
L G Balakrishnan & Bros Neutral
454
-
713
1,254
1,394
11.6
11.8
35.9
41.7
12.7
10.9
1.7
1.5
13.5
13.8
0.7
0.6
Mahindra and Mahindra Buy
1,209
1,449
75,093
39,031
44,440
13.8
13.9
57.9
67.6
20.9
17.9
3.4
3.0
16.1
16.6
1.6
1.3
Maruti
Neutral
3,876
-
117,089
57,865
68,104
16.4
16.7
176.3
225.5
22.0
17.2
4.3
3.6
19.4
21.2
1.8
1.5
Minda Industries
Neutral
832
-
1,320
2,567
2,965
8.0
8.3
46.1
57.8
18.1
14.4
3.0
2.5
16.7
17.3
0.6
0.5
Motherson Sumi
Buy
258
313
34,153
39,343
45,100
8.8
9.1
10.1
12.5
25.6
20.7
8.1
6.3
35.3
34.4
0.9
0.8
Rane Brake Lining
Buy
384
465
304
454
511
11.5
12.0
25.2
31.0
15.3
12.4
2.3
2.1
14.9
16.6
0.8
0.7
Setco Automotive
Neutral
34
-
454
594
741
12.7
13.7
1.7
3.2
20.0
10.6
2.1
1.8
10.4
16.9
1.2
1.0
Tata Motors
Buy
330
409
95,191
266,022
312,667
12.8
13.1
26.3
38.3
12.5
8.6
1.7
1.4
8.4
12.1
0.5
0.5
TVS Motor
Accumulate
293
322
13,925
11,263
13,106
6.9
8.3
9.2
14.6
31.9
20.1
7.3
5.8
22.7
29.1
1.2
1.0
Amara Raja Batteries
Buy
861
1,040
14,715
4,892
5,871
17.4
17.6
28.8
37.1
29.9
23.2
7.0
5.6
23.4
24.1
3.0
2.4
Exide Industries
Buy
122
162
10,366
6,950
7,784
14.4
14.8
6.6
7.3
18.5
16.7
2.3
2.1
12.6
12.8
1.2
1.1
Apollo Tyres
Buy
142
171
7,251
12,146
12,689
16.8
16.0
21.2
19.0
6.7
7.5
1.1
1.0
16.5
13.0
0.7
0.7
Ceat
Buy
921
1,119
3,726
6,041
6,597
14.1
13.7
99.5
111.9
9.3
8.2
1.8
1.5
19.6
18.5
0.8
0.7
JK Tyres
Neutral
90
-
2,045
7,446
7,669
15.2
14.0
19.6
18.4
4.6
4.9
1.2
1.0
25.2
19.5
0.7
0.6
Swaraj Engines
Neutral
880
-
1,093
552
630
14.2
14.7
44.6
54.1
19.7
16.3
4.6
4.2
23.2
25.6
1.8
1.6
Subros
Neutral
90
-
541
1,293
1,527
11.8
11.9
4.2
6.7
21.5
13.5
1.6
1.5
7.7
11.5
0.7
0.6
Indag Rubber
Neutral
176
-
461
283
329
17.0
17.2
13.0
15.4
13.6
11.4
3.0
2.5
21.8
21.6
1.3
1.1
Capital Goods
ACE
Neutral
39
-
389
660
839
4.7
8.2
1.0
3.9
39.3
10.1
1.2
1.1
3.2
11.3
0.7
0.6
BEML
Neutral
1,043
-
4,343
3,277
4,006
6.0
8.9
29.2
64.3
35.7
16.2
2.0
1.8
5.7
11.7
1.4
1.1
Bharat Electronics
Buy
1,223
1,414
29,358
7,737
8,634
16.8
17.2
54.0
61.0
22.7
20.1
3.2
2.9
39.3
45.6
2.9
2.5
Stock Watch
February 03, 2016
Company Name
Reco
CMP
Target
Mkt Cap
Sales ( Čcr )
OPM(%)
EPS (Č)
PER(x)
P/BV(x)
RoE(%)
EV/Sales(x)
(Č)
Price ( Č)
( Č cr )
FY16E
FY17E
FY16E
FY17E
FY16E
FY17E
FY16E
FY17E
FY16E
FY17E
FY16E
FY17E
FY16E
FY17E
Capital Goods
Voltas
Buy
283
353
9,361
5,363
5,963
8.0
9.1
11.0
13.8
25.7
20.5
4.0
3.5
16.2
17.9
1.7
1.5
BGR Energy
Neutral
114
-
820
3,615
3,181
9.5
9.4
16.7
12.4
6.8
9.2
0.6
0.6
10.0
7.0
0.6
0.8
BHEL
Neutral
135
-
33,006
33,722
35,272
10.8
11.7
10.5
14.2
12.8
9.5
1.0
0.9
7.0
9.0
1.1
1.0
Blue Star
Buy
354
439
3,181
3,548
3,977
6.3
6.9
13.7
17.2
25.8
20.6
6.5
4.2
26.1
25.4
1.0
0.8
Crompton Greaves
Buy
167
204
10,473
13,484
14,687
4.9
6.2
4.5
7.1
37.1
23.5
2.6
2.5
7.2
10.8
0.9
0.8
Greaves Cotton
Neutral
126
-
3,067
1,655
1,755
16.6
16.8
7.4
7.8
17.0
16.1
3.4
3.2
21.1
20.6
1.8
1.7
Inox Wind
Buy
303
458
6,713
4,980
5,943
17.0
17.5
26.6
31.6
11.4
9.6
3.4
2.5
35.0
30.0
1.5
1.2
KEC International
Neutral
121
-
3,109
8,791
9,716
6.1
6.8
5.4
8.2
22.4
14.8
2.2
2.1
10.0
14.0
0.6
0.5
Thermax
Neutral
801
-
9,547
6,413
7,525
7.4
8.5
30.5
39.3
26.3
20.4
4.1
3.5
15.0
17.0
1.5
1.2
Cement
ACC
Buy
1,263
1,630
23,716
13,151
14,757
16.4
18.3
63.9
83.4
19.8
15.2
2.5
2.3
13.3
16.1
1.6
1.4
Ambuja Cements
Buy
197
233
30,526
11,564
12,556
19.4
20.7
8.9
10.1
22.1
19.5
2.8
2.6
12.8
13.8
2.3
2.1
HeidelbergCement
Neutral
71
-
1,613
1,772
1,926
13.3
15.4
1.0
3.0
71.2
23.7
1.8
1.7
2.6
7.9
1.5
1.3
India Cements
Buy
88
112
2,688
4,216
4,840
18.0
19.5
4.0
9.9
21.9
8.8
0.9
0.8
4.0
9.5
1.0
0.8
JK Cement
Buy
471
744
3,290
3,661
4,742
10.1
15.8
18.0
61.0
26.1
7.7
1.9
1.7
7.5
22.9
1.4
1.0
J K Lakshmi Cement
Buy
287
430
3,372
2,947
3,616
16.7
19.9
11.5
27.2
24.9
10.5
2.4
2.0
9.8
20.8
1.6
1.2
Mangalam Cements
Neutral
175
-
467
1,053
1,347
10.5
13.3
8.4
26.0
20.8
6.7
0.9
0.8
4.3
12.5
0.8
0.6
Orient Cement
Buy
143
183
2,926
1,854
2,524
21.2
22.2
7.7
11.1
18.6
12.9
2.7
2.3
13.3
15.7
2.3
1.6
Ramco Cements
Neutral
383
-
9,118
4,036
4,545
20.8
21.3
15.1
18.8
25.4
20.4
3.1
2.8
12.9
14.3
2.8
2.4
Shree Cement^
Neutral
10,375
-
36,143
7,150
8,742
26.7
28.6
228.0
345.5
45.5
30.0
6.7
5.6
15.7
20.3
4.8
3.9
UltraTech Cement
Buy
2,809
3,282
77,094
25,021
30,023
19.1
21.6
89.0
132.0
31.6
21.3
3.7
3.2
12.2
15.9
3.1
2.6
Construction
ITNL
Neutral
79
-
2,607
7,360
8,825
34.0
35.9
7.0
9.0
11.3
8.8
0.4
0.4
3.2
3.7
3.7
3.6
KNR Constructions
Buy
500
673
1,407
937
1,470
14.3
14.0
33.5
38.6
14.9
13.0
2.3
2.0
15.4
15.4
1.6
1.0
Larsen & Toubro
Buy
1,122
1,310
104,445
58,870
65,708
8.3
10.3
42.0
53.0
26.7
21.2
1.9
1.7
8.8
11.2
2.0
1.8
Gujarat Pipavav Port
Neutral
156
-
7,539
629
684
51.0
52.2
6.4
5.9
24.4
26.4
3.2
3.0
15.9
12.7
11.6
10.5
MBL Infrastructures
Buy
164
285
681
2,313
2,797
12.2
14.6
19.0
20.0
8.6
8.2
0.9
0.8
11.3
10.6
1.0
0.9
Nagarjuna Const.
Neutral
63
-
3,505
7,892
8,842
8.8
9.1
3.0
5.3
21.0
11.9
1.1
1.0
5.0
8.5
0.7
0.6
PNC Infratech
Accumulate
507
558
2,601
1,873
2,288
13.2
13.5
24.0
32.0
21.1
15.8
2.1
1.8
12.1
12.3
1.5
1.2
Simplex Infra
Neutral
279
-
1,380
5,955
6,829
10.3
10.5
16.0
31.0
17.4
9.0
0.9
0.8
5.3
9.9
0.7
0.6
Power Mech Projects
Neutral
590
-
868
1,539
1,801
12.8
12.7
59.0
72.1
10.0
8.2
1.5
1.3
18.6
16.8
0.6
0.5
Stock Watch
February 03, 2016
Company Name
Reco
CMP
Target
Mkt Cap
Sales ( Čcr )
OPM(%)
EPS (Č)
PER(x)
P/BV(x)
RoE(%)
EV/Sales(x)
(Č)
Price ( Č)
( Č cr )
FY16E
FY17E
FY16E
FY17E
FY16E
FY17E
FY16E
FY17E
FY16E
FY17E
FY16E
FY17E
FY16E
FY17E
Construction
Sadbhav Engineering
Neutral
304
-
5,208
3,481
4,219
10.7
10.8
8.0
12.0
38.0
25.3
3.5
3.1
10.3
13.5
1.8
1.5
NBCC
Accumulate
951
1,089
11,415
7,382
9,506
7.7
8.6
39.8
54.4
23.9
17.5
5.8
4.6
26.7
29.1
1.3
1.0
MEP Infra
Neutral
44
-
709
1,956
1,876
28.1
30.5
1.3
3.0
33.5
14.5
7.0
4.7
21.2
32.8
1.8
1.8
SIPL
Neutral
88
-
3,098
675
1,042
62.4
64.7
-
-
3.3
3.8
-
-
16.3
11.0
Financials
Allahabad Bank
Neutral
51
-
3,078
8,569
9,392
2.8
2.9
16.3
27.5
3.1
1.9
0.3
0.2
7.6
11.9
-
-
Axis Bank
Buy
391
494
93,124
26,473
31,527
3.5
3.6
35.7
43.5
11.0
9.0
1.8
1.6
17.9
18.9
-
-
Bank of Baroda
Neutral
121
-
27,903
18,485
21,025
1.9
2.0
13.5
21.1
9.0
5.7
0.7
0.6
7.3
10.6
-
-
Bank of India
Neutral
97
-
7,843
15,972
17,271
1.9
2.0
15.3
33.4
6.3
2.9
0.3
0.3
3.6
7.6
-
-
Canara Bank
Neutral
186
-
10,105
15,441
16,945
2.0
2.1
46.6
70.4
4.0
2.6
0.4
0.3
8.0
11.2
-
-
Dena Bank
Neutral
35
-
2,268
3,440
3,840
2.1
2.3
7.3
10.0
4.9
3.5
0.4
0.3
6.1
7.9
-
-
Federal Bank
Neutral
47
-
7,995
3,477
3,999
3.0
3.0
5.0
6.2
9.3
7.5
0.9
0.9
10.6
11.9
-
-
HDFC
Neutral
1,177
-
185,871
10,358
11,852
3.3
3.3
41.1
47.0
28.7
25.0
5.5
5.0
24.7
24.9
-
-
HDFC Bank
Buy
1,056
1,262
266,629
38,309
47,302
4.3
4.3
49.3
61.1
21.4
17.3
3.7
3.2
18.5
19.7
-
-
ICICI Bank
Buy
211
254
122,410
34,279
39,262
3.3
3.3
21.0
24.4
10.0
8.6
1.7
1.4
14.4
14.7
-
-
IDBI Bank
Neutral
59
-
11,267
9,625
10,455
1.8
1.8
8.5
14.2
7.0
4.2
0.4
0.4
5.9
9.3
-
-
Indian Bank
Neutral
89
-
4,270
6,160
6,858
2.5
2.5
24.5
29.8
3.6
3.0
0.3
0.3
7.7
8.6
-
-
LIC Housing Finance
Buy
452
592
22,816
3,101
3,745
2.5
2.5
33.0
40.2
13.7
11.3
2.6
2.2
19.7
20.5
-
-
Oriental Bank
Neutral
106
-
3,183
7,643
8,373
2.4
2.4
37.2
45.4
2.9
2.3
0.3
0.2
8.2
9.4
-
-
Punjab Natl.Bank
Neutral
90
-
17,574
23,638
26,557
2.8
2.8
17.9
27.2
5.0
3.3
0.5
0.4
8.5
12.0
-
-
South Ind.Bank
Neutral
19
-
2,572
1,965
2,185
2.5
2.5
2.5
3.3
7.7
5.8
0.8
0.7
9.5
11.7
-
-
St Bk of India
Buy
169
202
131,540
82,520
93,299
2.7
2.8
20.0
24.5
8.5
6.9
0.9
0.8
11.5
12.8
-
-
Union Bank
Neutral
126
-
8,672
12,646
14,129
2.3
2.4
31.0
39.1
4.1
3.2
0.4
0.4
9.8
11.4
-
-
Vijaya Bank
Neutral
31
-
2,633
3,536
3,827
1.9
1.9
5.5
6.7
5.5
4.6
0.5
0.4
7.8
8.8
-
-
Yes Bank
Neutral
765
-
32,138
7,190
9,011
3.2
3.3
58.2
69.7
13.1
11.0
2.4
2.0
19.2
19.6
-
-
FMCG
Asian Paints
Neutral
881
-
84,477
16,553
19,160
16.0
16.2
17.7
21.5
49.8
41.0
13.2
11.9
29.4
31.2
4.9
4.3
Britannia
Neutral
2,798
-
33,567
8,065
9,395
9.6
10.2
47.2
65.5
59.3
42.7
19.7
18.6
38.3
41.2
4.0
3.4
Colgate
Neutral
855
-
23,257
4,836
5,490
19.5
19.7
48.5
53.2
17.6
16.1
12.9
11.3
99.8
97.5
4.7
4.1
Dabur India
Accumulate
241
267
42,466
9,370
10,265
17.1
17.2
7.3
8.1
32.9
29.8
9.9
8.1
33.7
30.6
4.4
4.0
GlaxoSmith Con*
Neutral
5,853
-
24,613
4,919
5,742
17.2
17.4
168.3
191.2
34.8
30.6
9.9
8.4
28.8
28.9
4.6
3.9
Stock Watch
February 03, 2016
Company Name
Reco
CMP
Target
Mkt Cap
Sales ( Čcr )
OPM(%)
EPS (Č)
PER(x)
P/BV(x)
RoE(%)
EV/Sales(x)
(Č)
Price ( Č)
( Č cr )
FY16E FY17E
FY16E
FY17E
FY16E
FY17E
FY16E
FY17E
FY16E
FY17E
FY16E
FY17E
FY16E
FY17E
FMCG
Godrej Consumer
Neutral
1,240
-
42,226
10,168
12,886
16.1
16.1
32.1
38.4
38.6
32.3
7.9
7.3
19.7
21.0
4.3
3.3
HUL
Neutral
800
-
173,153
34,940
38,957
17.5
17.7
20.8
24.7
38.5
32.4
42.8
34.2
110.5
114.2
4.8
4.2
ITC
Buy
324
382
260,801
41,068
45,068
37.8
37.4
13.9
15.9
23.3
20.4
7.8
6.9
34.1
33.8
6.0
5.4
Marico
Neutral
224
-
28,893
6,551
7,766
15.7
16.0
10.4
12.5
21.6
17.9
6.3
5.2
33.2
32.4
4.3
3.7
Nestle*
Buy
5,456
6,646
52,602
11,291
12,847
22.2
22.3
158.9
184.6
34.3
29.6
18.0
16.1
55.0
57.3
4.5
3.9
Tata Global
Buy
124
144
7,842
8,635
9,072
9.8
9.9
6.5
7.6
19.1
16.4
1.9
1.8
6.8
7.4
0.8
0.8
IT
HCL Tech^
Buy
874
1,038
123,146
42,038
47,503
21.2
21.5
51.5
57.7
17.0
15.1
3.7
2.8
21.5
18.8
2.5
2.1
Infosys
Accumulate
1,175
1,347
269,845
61,850
69,981
27.5
27.5
59.4
65.7
19.8
17.9
4.2
3.6
21.2
20.1
3.6
3.1
TCS
Buy
2,402
2,854
473,198
108,487
122,590
28.3
28.5
122.8
138.4
19.6
17.4
7.4
6.8
38.0
38.9
4.0
3.5
Tech Mahindra
Buy
475
646
45,972
25,566
28,890
16.0
17.0
26.3
31.9
18.1
14.9
3.3
2.8
17.9
18.6
1.6
1.3
Wipro
Buy
567
719
139,953
50,808
58,713
23.7
23.8
37.3
42.3
15.2
13.4
2.9
2.6
19.0
17.9
2.3
1.8
Media
D B Corp
Accumulate
321
356
5,898
2,241
2,495
27.8
27.9
21.8
25.6
14.8
12.5
3.9
3.4
26.7
28.5
2.6
2.3
HT Media
Neutral
77
-
1,785
2,495
2,603
11.2
11.2
7.3
8.6
10.5
8.9
0.8
0.8
7.4
8.1
0.2
0.2
Jagran Prakashan
Buy
157
189
5,131
2,170
2,355
27.2
26.2
8.9
9.9
17.6
15.9
3.7
3.2
20.9
20.5
2.3
2.1
Sun TV Network
Neutral
358
-
14,094
2,779
3,196
70.2
70.5
22.8
27.3
15.7
13.1
3.9
3.5
26.7
28.3
4.8
4.2
Hindustan Media
Neutral
278
-
2,041
920
1,031
20.0
20.0
19.2
20.9
14.5
13.3
2.4
2.0
16.4
15.3
1.8
1.5
Ventures
Metals & Mining
Coal India
Buy
319
380
201,492
76,167
84,130
19.9
22.3
22.4
25.8
14.2
12.4
5.1
5.0
35.5
41.0
2.0
1.8
Hind. Zinc
Accumulate
156
175
65,788
14,641
14,026
50.4
50.4
17.7
16.0
8.8
9.7
1.4
1.2
16.2
13.2
2.1
2.0
Hindalco
Neutral
69
-
14,166
104,356
111,186
8.7
9.5
6.7
11.1
10.2
6.2
0.4
0.4
3.5
5.9
0.7
0.6
JSW Steel
Neutral
1,004
-
24,274
42,308
45,147
16.4
20.7
(10.3)
49.5
20.3
1.1
1.1
(1.0)
5.6
1.6
1.5
NMDC
Neutral
79
-
31,361
8,237
10,893
46.6
44.5
10.0
11.7
8.0
6.8
0.9
0.8
12.5
13.0
3.6
2.7
SAIL
Neutral
39
-
16,252
45,915
53,954
7.2
10.5
1.5
4.4
26.1
9.0
0.4
0.4
2.3
4.1
1.0
0.9
Vedanta
Neutral
65
-
19,241
71,445
81,910
26.2
26.3
12.9
19.2
5.0
3.4
0.4
0.3
7.2
8.9
0.7
0.5
Tata Steel
Neutral
232
-
22,484
126,760
137,307
8.9
11.3
6.4
23.1
36.4
10.0
0.7
0.7
2.0
7.1
0.8
0.7
Oil & Gas
Cairn India
Neutral
118
-
22,161
11,323
12,490
49.4
51.0
20.7
20.7
5.7
5.7
0.4
0.4
6.4
6.1
1.0
0.4
GAIL
Neutral
362
-
45,881
64,856
70,933
9.1
9.6
24.0
28.9
15.1
12.5
1.3
1.2
8.8
9.6
0.9
0.8
ONGC
Neutral
217
-
185,440
154,564
167,321
36.8
37.4
28.6
32.5
7.6
6.7
1.0
0.9
12.7
13.5
1.4
1.3
Petronet LNG
Neutral
254
-
19,069
29,691
31,188
5.8
6.2
12.8
13.4
19.9
18.9
3.0
2.6
15.8
14.8
0.7
0.7
Indian Oil Corp
Accumulate
399
455
96,778
359,607
402,760
5.9
6.1
42.5
48.7
9.4
8.2
1.3
1.1
14.1
14.4
0.4
0.3
Stock Watch
February 03, 2016
Company Name
Reco
CMP
Target
Mkt Cap
Sales ( Čcr )
OPM(%)
EPS (Č)
PER(x)
P/BV(x)
RoE(%)
EV/Sales(x)
(Č)
Price ( Č)
( Č cr )
FY16E FY17E
FY16E
FY17E
FY16E
FY17E
FY16E
FY17E
FY16E
FY17E
FY16E
FY17E
FY16E
FY17E
Oil & Gas
Reliance Industries
Accumulate
1,002
1,150
324,588
304,775
344,392
12.6
13.4
91.3
102.6
11.0
9.8
1.2
1.1
11.8
12.0
1.0
0.8
Pharmaceuticals
Alembic Pharma
Neutral
642
-
12,109
3,274
3,802
26.9
19.4
35.0
28.7
18.4
22.4
8.1
6.1
55.6
31.2
3.7
3.1
Aurobindo Pharma
Accumulate
767
856
44,829
14,923
17,162
22.0
23.0
35.7
42.8
21.5
17.9
6.3
4.8
34.0
30.2
3.4
2.9
Aventis*
Neutral
4,337
-
9,987
2,082
2,371
17.4
20.8
118.2
151.5
36.7
28.6
5.4
4.3
19.9
25.5
4.5
3.7
Cadila Healthcare
Accumulate
317
352
32,478
10,224
11,840
21.0
22.0
14.6
17.6
21.7
18.0
6.0
4.7
30.8
29.0
3.2
2.7
Cipla
Accumulate
574
636
46,106
14,211
16,611
20.6
19.0
27.0
28.9
21.3
19.9
3.6
3.1
18.4
16.8
3.2
2.7
Dr Reddy's
Buy
3,045
3,933
51,935
16,838
19,575
25.0
23.1
167.5
178.8
18.2
17.0
3.8
3.2
23.1
20.4
3.0
2.5
Dishman Pharma
Neutral
340
-
2,742
1,733
1,906
21.5
21.5
17.0
19.9
20.0
17.1
2.0
1.8
10.5
11.2
2.1
1.8
GSK Pharma*
Neutral
3,267
-
27,669
2,870
3,158
20.0
22.1
59.5
68.3
54.9
47.8
16.2
16.6
28.5
34.3
9.1
8.4
Indoco Remedies
Neutral
320
-
2,945
1,033
1,199
15.9
18.2
9.4
13.6
34.0
23.5
5.0
4.3
15.7
19.7
2.9
2.5
Ipca labs
Buy
652
900
8,229
3,363
3,909
12.9
18.6
13.4
28.0
48.7
23.3
3.5
3.1
7.4
14.0
2.7
2.4
Lupin
Neutral
1,706
-
76,868
13,092
16,561
25.0
27.0
50.4
68.3
33.9
25.0
7.0
5.5
22.8
24.7
5.6
4.3
Sun Pharma
Accumulate
834
950
200,795
28,163
32,610
25.8
30.7
17.4
26.9
48.0
31.0
4.6
3.9
13.0
16.6
6.6
5.5
Power
Tata Power
Neutral
59
-
15,890
35,923
37,402
22.6
22.8
4.1
5.2
14.5
11.4
1.1
1.0
7.5
9.3
1.4
1.3
NTPC
Buy
134
157
110,695
87,064
98,846
23.5
23.5
11.7
13.2
11.5
10.2
1.3
1.2
11.4
12.1
2.3
2.1
Power Grid
Buy
146
170
76,407
20,702
23,361
86.7
86.4
12.1
13.2
12.1
11.1
1.8
1.6
15.6
15.1
8.6
8.0
Telecom
Bharti Airtel
Neutral
302
-
120,801
101,748
109,191
32.1
31.7
12.0
12.5
25.2
24.2
1.7
1.6
6.9
6.7
1.8
1.6
Idea Cellular
Neutral
104
-
37,444
34,282
36,941
32.0
31.5
5.9
6.2
17.6
16.8
1.6
1.5
9.9
9.3
1.7
1.6
zOthers
Abbott India
Neutral
5,100
-
10,837
2,715
3,153
14.5
14.1
134.3
152.2
38.0
33.5
9.5
7.8
27.4
25.6
3.7
3.1
Bajaj Electricals
Buy
178
290
1,801
4,719
5,287
5.2
5.8
8.6
12.7
20.9
14.1
2.4
2.1
11.4
14.8
0.4
0.3
Finolex Cables
Neutral
231
-
3,539
2,520
2,883
12.2
12.0
12.7
14.2
18.3
16.3
2.5
2.2
13.6
13.5
1.2
1.0
Goodyear India*
Buy
490
622
1,130
1,888
1,680
12.1
11.9
62.2
56.6
7.9
8.7
1.8
1.6
25.9
19.7
0.4
0.4
Hitachi
Neutral
1,211
-
3,292
1,779
2,081
7.8
8.8
21.8
33.4
55.5
36.2
9.0
7.3
17.4
22.1
1.9
1.6
Jyothy Laboratories
Neutral
280
-
5,078
1,620
1,847
11.5
11.5
7.3
8.5
38.5
33.1
5.0
4.6
13.3
14.4
3.0
2.6
MRF
Buy
34,626
45,575
14,686
20,316
14,488
21.4
21.1
5,488.0
3,798.0
6.3
9.1
2.2
1.8
41.1
21.2
0.7
0.9
Page Industries
Neutral
12,303
-
13,722
1,929
2,450
19.8
20.1
229.9
299.0
53.5
41.2
23.6
16.4
52.1
47.1
7.1
5.6
Relaxo Footwears
Neutral
467
-
5,605
1,767
2,152
12.3
12.5
19.3
25.1
24.3
18.6
6.0
4.6
27.7
27.8
3.2
2.6
Siyaram Silk Mills
Buy
1,065
1,354
998
1,636
1,815
11.5
11.5
89.9
104.1
11.8
10.2
2.0
1.7
17.9
17.8
0.8
0.7
Styrolution ABS India*
Neutral
686
-
1,207
1,271
1,440
8.6
9.2
32.0
41.1
21.4
16.7
2.2
2.0
10.7
12.4
0.9
0.8
Stock Watch
February 03, 2016
Company Name
Reco
CMP
Target
Mkt Cap
Sales ( Čcr )
OPM(%)
EPS (Č)
PER(x)
P/BV(x)
RoE(%)
EV/Sales(x)
(Č)
Price ( Č)
( Č cr )
FY16E
FY17E
FY16E
FY17E
FY16E
FY17E
FY16E
FY17E
FY16E
FY17E
FY16E
FY17E
FY16E
FY17E
zOthers
TVS Srichakra
Buy
2,482
3,240
1,901
2,101
2,338
15.7
15.0
248.6
270.0
10.0
9.2
4.4
3.1
43.6
34.0
0.9
0.8
HSIL
Accumulate
273
302
1,976
2,123
2,384
16.1
16.5
15.0
18.9
18.2
14.5
1.4
1.3
8.0
9.4
1.3
1.1
Kirloskar Engines India
Neutral
232
-
3,352
2,403
2,554
8.6
9.9
9.2
10.5
25.2
22.1
2.4
2.3
9.7
10.7
1.0
1.0
Ltd
M M Forgings
Buy
450
614
543
511
615
21.7
21.6
43.1
55.8
10.4
8.1
1.9
1.6
19.9
21.2
1.3
1.0
Banco Products (India) Neutral
124
-
884
1,208
1,353
11.0
12.3
10.8
14.5
11.5
8.5
1.3
1.2
11.9
14.5
0.7
0.6
Competent Automobiles Neutral
140
-
86
1,040
1,137
3.2
3.1
25.7
28.0
5.4
5.0
0.8
0.7
15.0
14.3
0.1
0.1
Nilkamal
Neutral
1,315
-
1,962
1,871
2,031
10.7
10.5
63.2
69.8
20.8
18.9
3.4
2.9
17.6
16.6
1.1
1.0
Visaka Industries
Buy
108
144
172
1,086
1,197
9.9
10.3
21.5
28.8
5.0
3.8
0.5
0.4
9.6
11.6
0.4
0.3
Transport Corporation of
Neutral
243
-
1,849
2,830
3,350
8.8
9.0
14.4
18.3
16.9
13.3
2.6
2.3
15.4
17.1
0.8
0.7
India
Elecon Engineering
Neutral
65
-
705
1,369
1,533
13.7
14.9
3.3
6.1
19.5
10.7
1.3
1.2
6.6
11.4
0.9
0.8
Surya Roshni
Buy
145
201
635
2,992
3,223
8.1
8.4
14.7
18.3
9.9
7.9
0.9
0.8
9.7
11.0
0.5
0.5
MT Educare
Neutral
156
-
619
286
366
18.3
17.7
7.7
9.4
20.1
16.6
4.2
3.7
20.2
21.1
2.1
1.6
Radico Khaitan
Buy
115
156
1,526
1,565
1,687
12.2
13.0
5.7
7.1
20.1
16.2
1.7
1.6
8.3
9.6
1.4
1.3
Garware Wall Ropes
Buy
353
473
771
862
974
11.2
11.2
24.9
29.6
14.2
11.9
2.1
1.8
15.1
15.4
0.9
0.8
Wonderla Holidays
Neutral
385
-
2,176
206
308
44.0
43.6
9.0
12.9
42.8
29.9
5.8
5.3
13.7
17.8
10.5
7.0
Linc Pen & Plastics
Neutral
207
-
306
340
371
8.3
8.9
10.8
13.2
19.1
15.7
3.1
2.7
16.0
17.1
0.9
0.9
The Byke Hospitality
Neutral
157
-
629
222
287
20.5
20.5
5.6
7.6
27.8
20.8
5.2
4.3
18.9
20.8
2.9
2.2
Interglobe Aviation
Neutral
845
-
30,450
17,022
21,122
20.7
14.5
63.9
53.7
13.2
15.7
19.8
16.2
149.9
103.2
1.8
1.5
Coffee Day Enterprises
Neutral
251
-
5,161
2,692
2,964
17.0
18.6
-
4.7
-
52.9
3.1
2.9
0.2
5.5
2.3
2.2
Ltd
Navneet Education
Neutral
89
-
2,113
998
1,062
24.1
24.0
5.8
6.1
15.4
14.6
3.4
3.0
22.0
20.6
2.2
2.1
Navkar Corporation
Buy
197
265
2,816
365
436
38.3
37.5
5.6
5.9
35.0
33.6
2.2
2.1
6.3
6.1
8.5
7.3
Source: Company, Angel Research; Note: *December year end; #September year end; &October year end; Price as on February 02, 2016
Market Outlook
February 03, 2016
Research Team Tel: 022 - 39357800
DISCLAIMER
Angel Broking Private Limited (hereinafter referred to as “Angel”) is a registered Member of National Stock Exchange of India Limited,
Bombay Stock Exchange Limited and Metropolitian Stock Exchange of India Limited. It is also registered as a Depository Participant with
CDSL and Portfolio Manager with SEBI. It also has registration with AMFI as a Mutual Fund Distributor. Angel Broking Private Limited is a
registered entity with SEBI for Research Analyst in terms of SEBI (Research Analyst) Regulations, 2014 vide registration number
INH000000164. Angel or its associates has not been debarred/ suspended by SEBI or any other regulatory authority for accessing
/dealing in securities Market. Angel or its associates including its relatives/analyst do not hold any financial interest/beneficial ownership
of more than 1% in the company covered by Analyst. Angel or its associates/analyst has not received any compensation / managed or co
-managed public offering of securities of the company covered by Analyst during the past twelve months. Angel/analyst has not served as
an officer, director or employee of company covered by Analyst and has not been engaged in market making activity of the company
covered by Analyst.
This document is solely for the personal information of the recipient, and must not be singularly used as the basis of any investment
decision. Nothing in this document should be construed as investment or financial advice. Each recipient of this document should make
such investigations as they deem necessary to arrive at an independent evaluation of an investment in the securities of the companies
referred to in this document (including the merits and risks involved), and should consult their own advisors to determine the merits and
risks of such an investment.
Reports based on technical and derivative analysis center on studying charts of a stock's price movement, outstanding positions and
trading volume, as opposed to focusing on a company's fundamentals and, as such, may not match with a report on a company's
fundamentals.
The information in this document has been printed on the basis of publicly available information, internal data and other reliable sources
believed to be true, but we do not represent that it is accurate or complete and it should not be relied on as such, as this document is for
general guidance only. Angel Broking Pvt. Limited or any of its affiliates/ group companies shall not be in any way responsible for any
loss or damage that may arise to any person from any inadvertent error in the information contained in this report. Angel Broking Pvt.
Limited has not independently verified all the information contained within this document. Accordingly, we cannot testify, nor make any
representation or warranty, express or implied, to the accuracy, contents or data contained within this document. While Angel Broking
Pvt. Limited endeavors to update on a reasonable basis the information discussed in this material, there may be regulatory, compliance,
or other reasons that prevent us from doing so.
This document is being supplied to you solely for your information, and its contents, information or data may not be reproduced,
redistributed or passed on, directly or indirectly.
Neither Angel Broking Pvt. Limited, nor its directors, employees or affiliates shall be liable for any loss or damage that may arise from or
in connection with the use of this information.
Note: Please refer to the important ‘Stock Holding Disclosure' report on the Angel website (Research Section). Also, please refer to the
latest update on respective stocks for the disclosure status in respect of those stocks. Angel Broking Pvt. Limited and its affiliates may have
investment positions in the stocks recommended in this report.