Market Outlook
December 2, 2015
Market Cues
Domestic Indices
Chg (%)
(Pts)
(Close)
Indian markets are expected to open on positive note tracking the SGX Nifty and
BSE Sensex
0.1
24
26,169
most Asian markets.
Nifty
0.3
20
7,955
U.S. markets moved notably higher during trading on Tuesday, more than offsetting
Mid Cap
0.8
86
11,076
the moderate weakness seen in the previous session. The strength on US market
Small Cap
0.5
53
11,689
reflected positive sentiment generated by an overnight rally by stocks in the Asia-
Bankex
(0.3)
(58)
19,858
Pacific region.
European markets came under pressure on Tuesday, closing mixed despite new
Global Indices
Chg (%)
(Pts)
(Close)
unemployment figures from the euro zone showing the region taking a step in the
right direction.
Dow Jones
1.0
168
17,888
Nasdaq
0.9
48
5,156
The Indian shares ended little changed on Tuesday after the Reserve Bank of India
kept its key repo lending rate unchanged at 6.75% but affirmed commitment to ease
FTSE
0.6
40
6,396
its policy as and when room is available.
Nikkei
1.3
265
20,012
Hang Seng
1.7
385
22,381
News & Result Analysis
Shanghai Com
0.4
12
3,458
Auto sales update for November 2015
IL&FS Engineering bags `675cr road contract in Bihar
Advances / Declines
BSE
NSE
Detailed analysis on Pg2
Advances
1,672
812
Investor’s Ready Reckoner
Declines
1,156
595
Key Domestic & Global Indicators
Unchanged
145
52
Stock Watch: Latest investment recommendations on 150+ stocks
Refer P4 onwards
Volumes (` Cr)
BSE
2,995
Top Picks
CMP
Target
Upside
NSE
16,256
Company
Sector
Rating
(`)
(`)
(%)
Axis Bank
Financials
Buy
462
630
36.4
Net Inflows (` Cr)
Net
Mtd
Ytd
HCL Tech
IT
Buy
876
1,132
29.3
FII
(458)
(5,711)
(20,531)
ICICI Bank
Financials
Buy
274
357
30.3
MFs
534
5,922
56,269
Ashok Leyland
Automobiles
Buy
93
111
18.9
Larsen & Toubro
Construction
Buy
1,365
1,646
20.6
More Top Picks on Pg3
Top Gainers
Price (`)
Chg (%)
Religare
303
8.7
Key Upcoming Events
Previous
Consensus
Jubilant
448
8.7
Date
Region
Event Description
Reading
Expectations
Denabank
45
7.8
Dec 2
Eurozone
CPI yoy (Nov)
0.1%
0.2%
Jktyre
106
6.0
Dec 3
UK
Services PMI (Nov)
54.9
55.0
Suzlon
23
4.9
Dec 3
Eurozone
ECB Interest Rate Decision
0.05%
0.05%
Dec 3
US
ISM Non-Manufacturing PMI (Nov)
59.1
58.0
Top Losers
Price (`)
Chg (%)
Pmcfin
1
(9.6)
Kailash
2
(4.6)
Renuka
13
(4.4)
Bhartiartl
323
(3.5)
Tubeinvest
390
(3.1)
As on December 01, 2015
Market Outlook
December 2, 2015
Auto sales update for the month of November 2015
Hero Motocorp: Hero Motocorp sales for the month were flat at 550,731 units
coming below our estimates of 5.8 lakh units. On YTD basis (April to November
2015) the sales have dipped by 3% to 4.41 million units.
TVS Motors: TVS Motors sales grew marginally 2% yoy to 225,401 units coming
below our estimates. The sales were impacted by heavy rains which impacted the
production to the tune of 15,000 units. Adjusted for the same, the company would
have reported 9% yoy growth which would be in line with estimates.
Tata Motors: Tata Motors sales dipped 7% yoy to 38,918 units coming below our
estimates of 41,200 units. MHCV sales remained robust with 22% yoy growth to
11,524 units while LCV sales declined 17% yoy to 13,304 units. Passenger vehicle
sales disappointed declining by 12% yoy to 10,517 units.
IL&FS Engineering bags `675cr road contract in Bihar
Hyderabad-based IL&FS Engineering and Construction Company Limited has
bagged a road contract worth of `675cr from Ministry of Road Transport and
Highways.
The company has received a letter of acceptance (LOA) from the Ministry for
rehabilitation and upgradation to 2 lanes with paved shoulders configuration and
strengthening of Birpur-Bihpur section of National Highway-106 in the state of
Bihar under Phase-1 of National Highways Development Project (NHDP).
The project involves engineering, procurement, and construction (EPC) with a
completion period of 36 months.
Economic and Political News
Odisha's additional Budget outgo pegged at `11,448cr
ATF price cut by 1.2%; non-subsidised LPG rate hiked by `61.5
Both rabi, kharif crops hit by monsoon vagaries: RBI
Corporate News
Ashok Leyland logs 16% sales growth in November
Hero MotoCorp sales rise marginally in November
Monsanto plans to make operations carbon-neutral by 2021
Market Outlook
December 2, 2015
Top Picks ★★★★★
Large Cap
Market Cap
CMP
Target
Upside
Company
Rationale
(` Cr)
(`)
(`)
(%)
To outpace battery industry growth due to better technological
Amara Raja Batteries
14,877
871
1,040
19.4
products leading to market share gains in both the automotive
OEM and replacement segments.
Earnings to grow strongly given the MHCV cyclical upturn.
Ashok Leyland
26,566
93
111
18.9
Focus on exports and LCV's provides additional growth
avenue.
Healthy pace of branch expansion, backed by distribution
Axis Bank
1,09,774
462
630
36.4
network, will be the driving force for the bank’s retail business
and overall earnings.
The stock is trading at attractive valuations and is factoring all
HCL Tech
1,23,121
876
1,132
29.3
the bad news.
Strong visibility for a robust 20% earnings trajectory, coupled
HDFC Bank
2,72,317
1,081
1,262
16.7
with high quality of earnings on account of high quality retail
business and strategic focus on highly rated corporates.
Due to its robust franchise and capital adequacy position, the
bank is well positioned to grow by at least a few percentage
ICICI Bank
1,58,898
274
357
30.3
points higher than the average industry growth rate from a
structural point of view.
Back on the growth trend, expect a long term growth of 14%
Infosys
2,47,301
1,077
1,306
21.3
to be a US$20bn in FY2020.
Well positioned to benefit from such expected gradual
recovery in the overall domestic capex cycle, given its presence
Larsen & Toubro
1,27,040
1,365
1,646
20.6
across various infrastructure segments, its execution
capabilities, and its strong balance sheet.
LICHF continues to grow its retail loan book at a healthy pace
with improvement in asset quality. We expect the company to
LIC Housing Finance
24,441
484
571
17.9
post a healthy loan book which is likely to reflect in a strong
earnings growth.
Source: Company, Angel Research
Mid Cap
Market Cap
CMP
Target
Upside
Company
Rationale
(` Cr)
(`)
(`)
(%)
Government thrust on Renewable sector and strong order
Inox Wind
8,042
362
505
39.3
book would drive future growth.
Change in business focus towards high-margin chronic and
Ipca labs
9,897
784
900
14.7
lifestyle segments and increasing penetration in Europe and
US
Economic recovery to have favourable impact on advertising &
circulation revenue growth. Further, the acquisition of a radio
Jagran Prakashan
5,010
153
169
10.3
business (Radio City) would also boost the company's revenue
growth.
Strong brand & quality teaching with innovative technologies
MT Educare
567
142
169
18.8
& higher government educational spending to boost growth
Earnings boost on back of stable material prices and
Radico Khaitan
1,464
110
156
41.8
favourable pricing environment. Valuation discount to peers
provides additional comfort
Strong brands and distribution network would boost growth
Siyaram Silk Mills
887
947
1,145
21.0
going ahead. Stock currently trades at an inexpensive
valuation.
Structural shift in the Lighting industry towards LED lighting will
Surya Roshni
612
140
183
31.0
drive growth.
Source: Company, Angel Research
Market Outlook
December 2, 2015
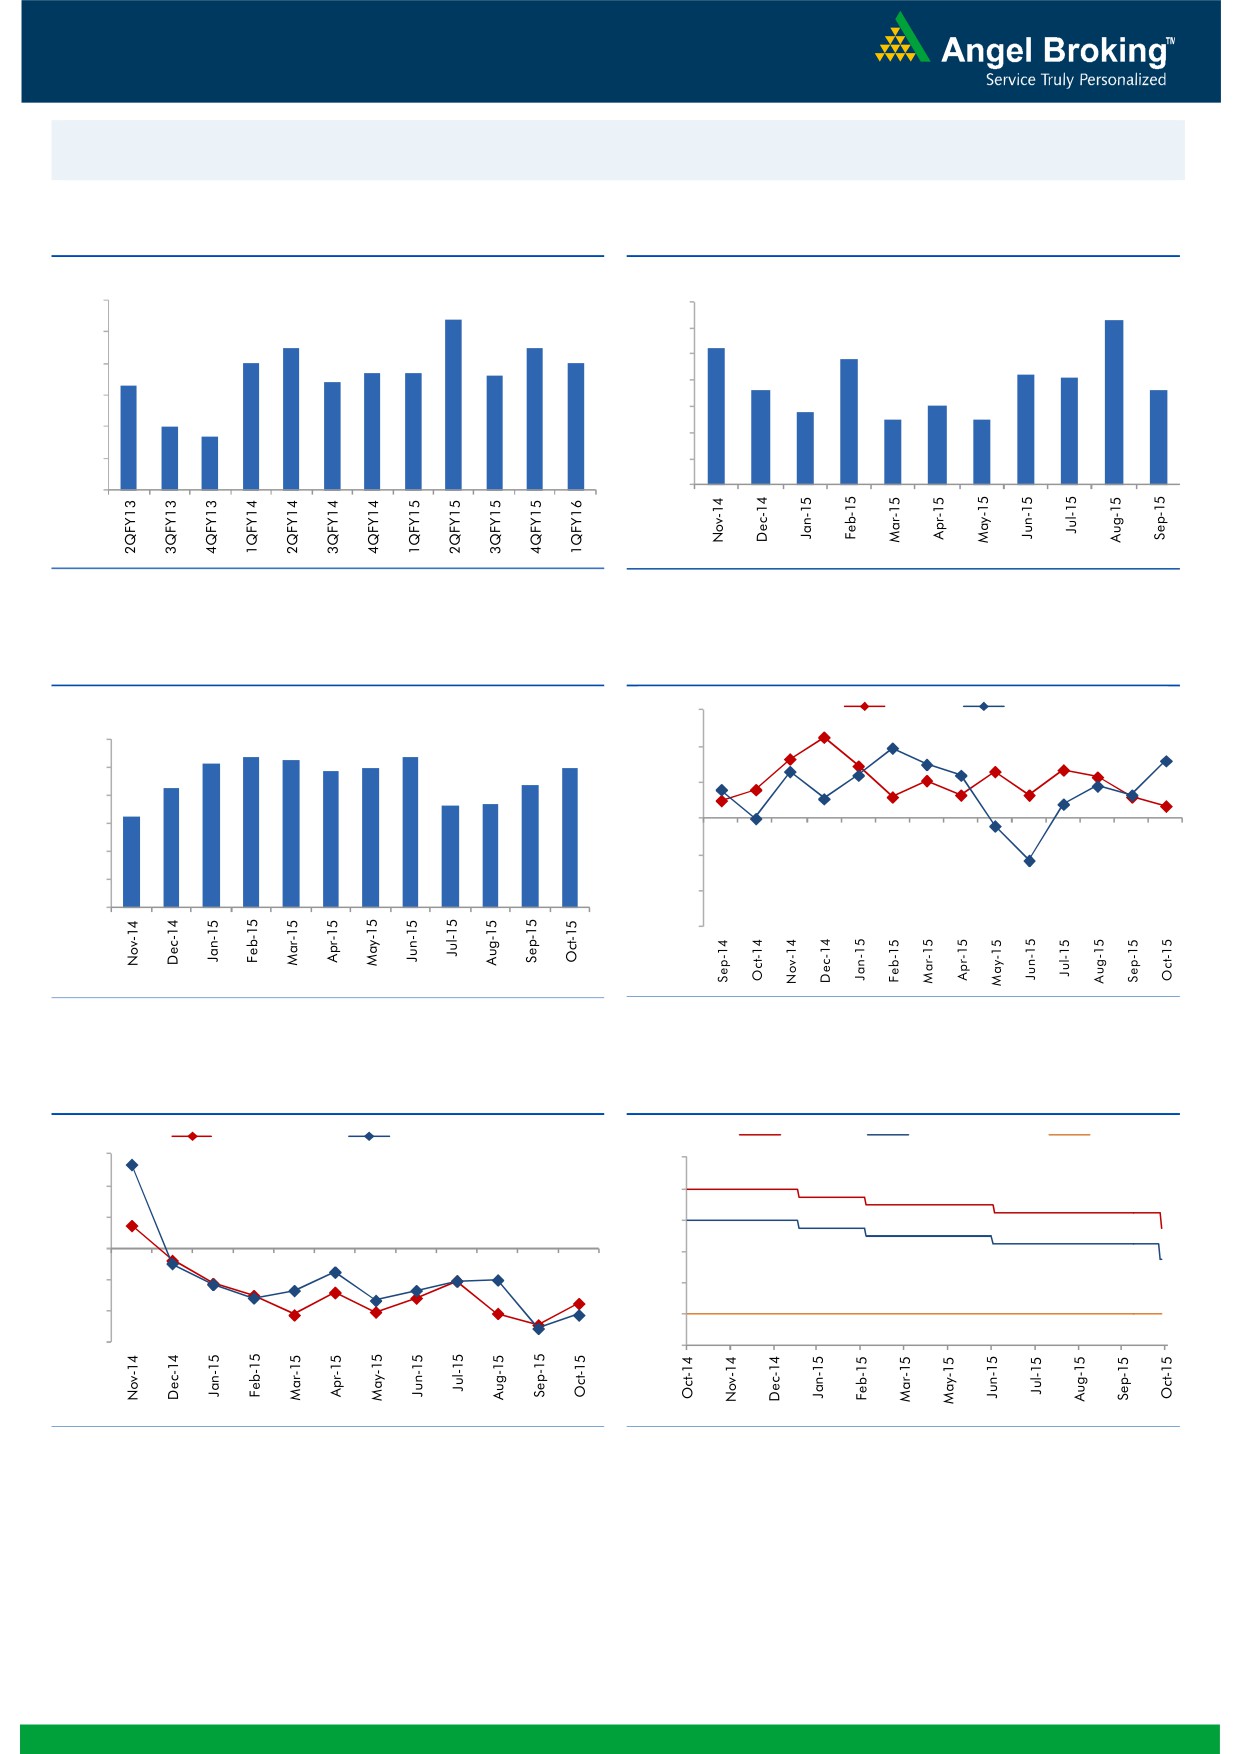
Macro watch
Exhibit 1: Quarterly GDP trends
Exhibit 2: IIP trends
(%)
(%)
9.0
8.4
7.0
6.3
8.0
7.5
7.5
6.0
5.2
7.0
7.0
4.8
6.7
6.7
5.0
7.0
6.4
6.6
4.2
4.1
6.3
3.6
3.6
4.0
6.0
2.8
3.0
2.5
2.5
5.0
3.0
4.7
5.0
2.0
4.0
1.0
3.0
-
Source: CSO, Angel Research
Source: MOSPI, Angel Research
Exhibit 3: Monthly CPI inflation trends
Exhibit 4: Manufacturing and services PMI
(%)
56.0
Mfg. PMI
Services PMI
6.0
5.4
5.3
5.4
5.2
5.0
5.0
54.0
4.9
5.0
4.3
4.4
3.7
3.7
52.0
4.0
3.3
50.0
3.0
2.0
48.0
1.0
46.0
-
44.0
Source: MOSPI, Angel Research
Source: Market, Angel Research; Note: Level above 50 indicates expansion
Exhibit 5: Exports and imports growth trends
Exhibit 6: Key policy rates
(%)
Exports yoy growth
Imports yoy growth
(%)
Repo rate
Reverse Repo rate
CRR
30.0
9.00
20.0
8.00
10.0
7.00
0.0
6.00
(10.0)
5.00
(20.0)
4.00
(30.0)
3.00
Source: Bloomberg, Angel Research
Source: RBI, Angel Research
Market Outlook
December 2, 2015
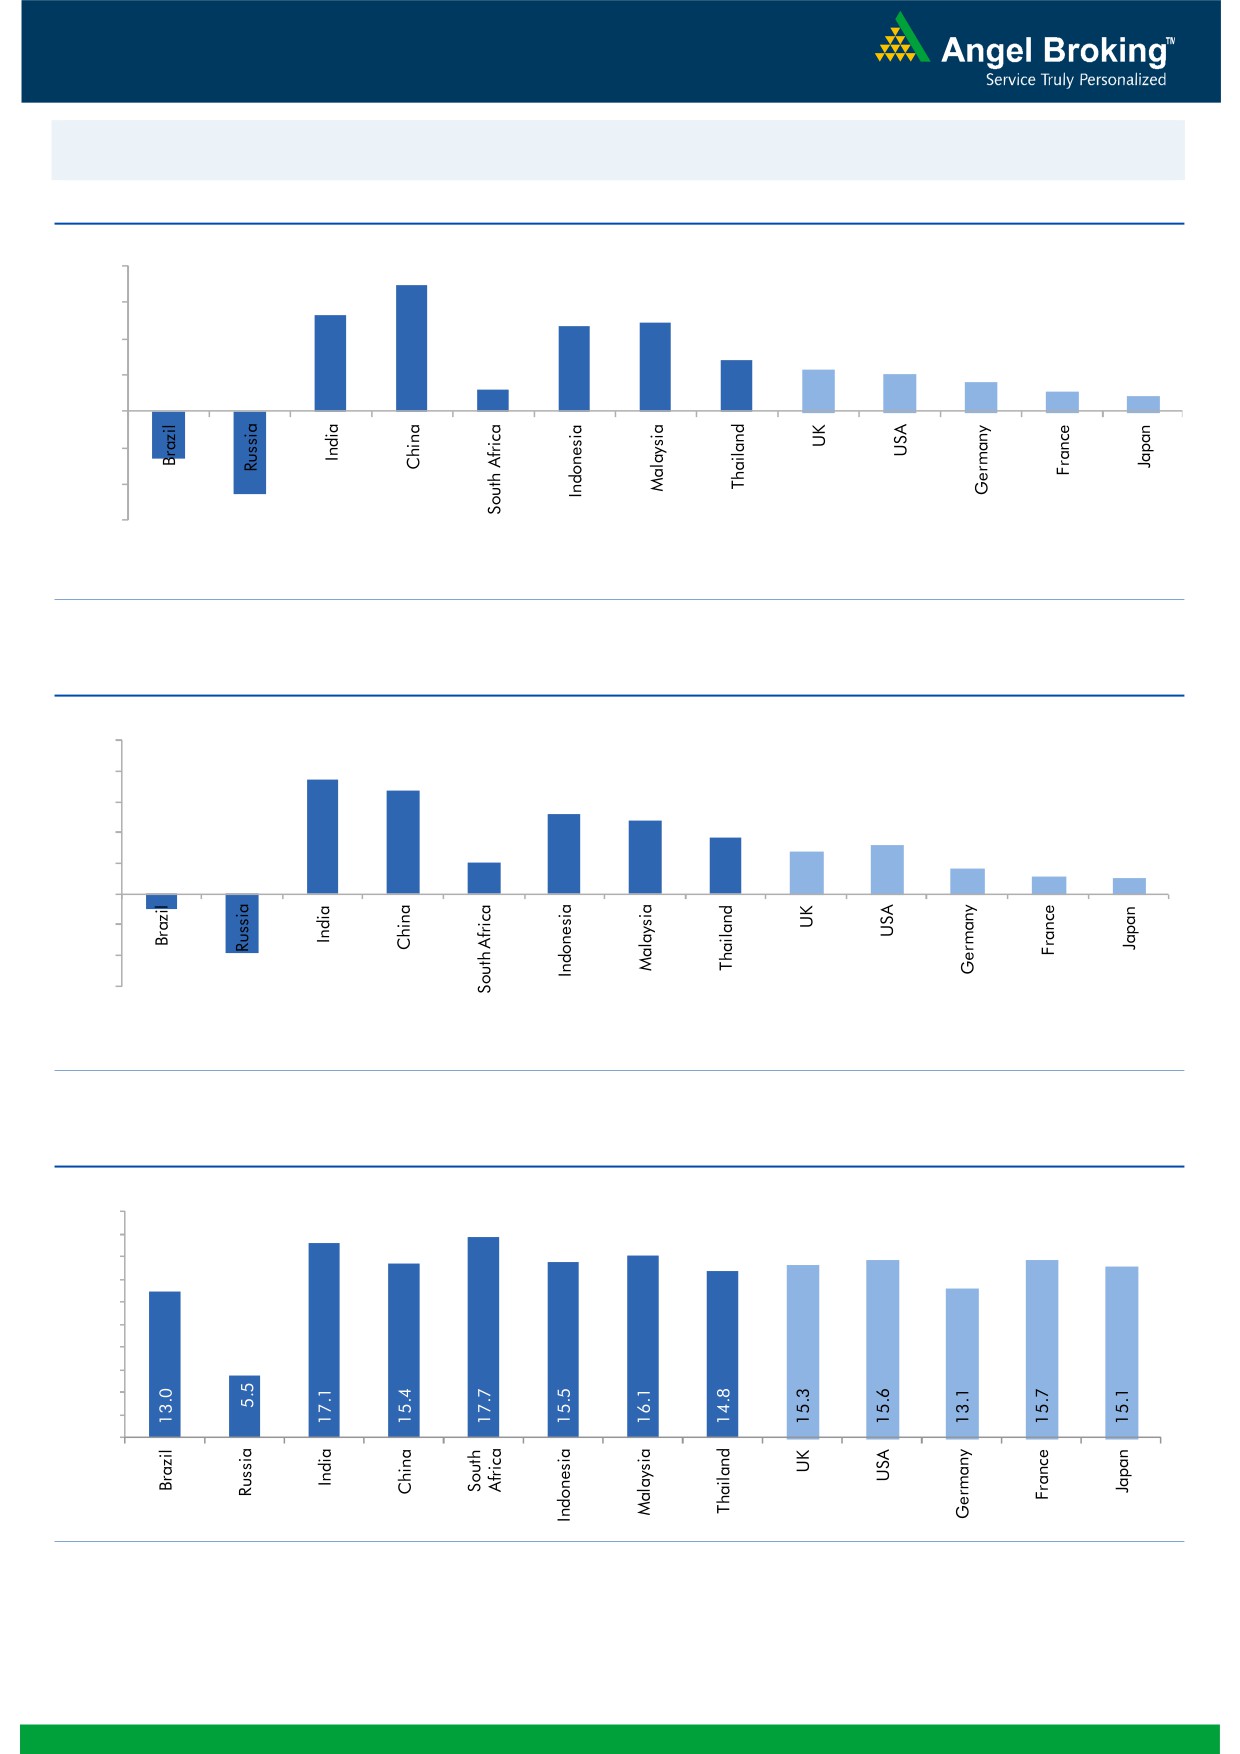
Global watch
Exhibit 1: Latest quarterly GDP Growth (%, yoy) across select developing and developed countries
(%)
8.0
6.9
6.0
5.3
4.9
4.7
4.0
2.8
2.3
2.0
1.6
2.0
1.2
1.1
0.8
(2.6)
-
(2.0)
(4.0)
(4.6)
(6.0)
Source: Bloomberg, Angel Research
Exhibit 2: 2015 GDP Growth projection by IMF (%, yoy) across select developing and developed countries
(%)
10.0
7.5
8.0
6.8
5.2
6.0
4.8
3.7
3.1
4.0
2.7
2.0
1.6
1.2
1.0
2.0
-
(2.0)
(4.0)
(1.0)
(3.8)
(6.0)
Source: IMF, Angel Research
Exhibit 3: One year forward P-E ratio across select developing and developed countries
(x)
20.0
18.0
16.0
14.0
12.0
10.0
8.0
6.0
4.0
2.0
-
Source: IMF, Angel Research
Market Outlook
December 2, 2015
Exhibit 4: Relative performance of indices across globe
Returns (%)
Country
Name of index
Closing price
1M
1YR
Brazil
Bovespa
45,047
(1.8)
(13.8)
Russia
Micex
1,773
3.6
12.3
India
Nifty
7,955
(1.2)
(6.7)
China
Shanghai Composite
3,429
3.1
24.1
South Africa
Top 40
46,330
(4.1)
5.6
Mexico
Mexbol
44,985
(1.3)
2.3
Indonesia
LQ45
786
3.1
(12.1)
Malaysia
KLCI
1,679
0.9
(6.0)
Thailand
SET 50
870
(4.0)
(14.5)
USA
Dow Jones
17,888
1.3
0.6
UK
FTSE
6,396
0.5
(3.9)
Japan
Nikkei
20,012
6.8
15.0
Germany
DAX
11,621
3.8
13.0
France
CAC
4,915
(0.0)
12.0
Source: Bloomberg, Angel Research
Stock Watch
December 02, 2015
Company Name
Reco
CMP
Target
Mkt Cap
Sales ( Čcr )
OPM(%)
EPS (Č)
PER(x)
P/BV(x)
RoE(%)
EV/Sales(x)
(Č)
Price ( Č)
( Č cr )
FY16E FY17E
FY16E
FY17E
FY16E
FY17E
FY16E
FY17E
FY16E
FY17E
FY16E
FY17E
FY16E
FY17E
Agri / Agri Chemical
Rallis
Neutral
186
-
3,623
2,075
2,394
14.4
14.4
9.5
11.0
19.6
16.9
3.9
3.4
21.1
21.3
1.8
1.5
United Phosphorus
Buy
425
510
18,214
13,698
15,752
17.6
17.6
32.1
38.5
13.2
11.0
2.6
2.2
21.4
21.3
1.4
1.2
Auto & Auto Ancillary
Ashok Leyland
Buy
93
111
26,566
18,763
22,357
11.1
11.2
3.6
4.8
25.9
19.5
4.8
4.4
18.7
22.6
1.4
1.1
Bajaj Auto
Accumulate
2,461
2,672
71,219
24,115
27,600
21.3
21.0
136.8
157.2
18.0
15.7
5.8
4.9
32.2
31.5
2.5
2.2
Bharat Forge
Buy
847
1,016
19,728
8,013
9,250
20.0
20.3
35.2
43.1
24.1
19.7
4.8
3.9
21.6
21.8
2.6
2.2
Eicher Motors
Buy
16,232
19,036
44,058
15,379
16,498
15.6
16.6
473.2
574.8
34.3
28.2
12.7
9.4
36.7
33.2
2.8
2.6
Hero Motocorp
Neutral
2,678
-
53,471
28,561
31,559
14.7
14.7
151.1
163.2
17.7
16.4
6.9
5.9
38.7
35.6
1.7
1.5
Jamna Auto Industries Accumulate
237
258
4,727
1,292
1,486
9.3
9.8
12.0
15.0
19.7
15.8
4.1
3.5
20.7
21.8
3.7
3.2
L G Balakrishnan & Bros Neutral
484
-
760
1,254
1,394
11.6
11.8
35.9
41.7
13.5
11.6
1.8
1.6
13.5
13.8
0.7
0.6
Mahindra and Mahindra Neutral
1,370
-
85,071
38,513
43,579
13.6
13.7
56.1
65.1
24.4
21.0
3.8
3.4
15.7
16.2
1.9
1.6
Maruti
Accumulate
4,553
4,960
137,533
57,865
68,104
16.4
16.7
176.3
225.5
25.8
20.2
5.0
4.3
19.4
21.2
2.2
1.8
Minda Industries
Neutral
886
-
1,406
2,567
2,965
8.0
8.3
46.1
57.8
19.2
15.3
3.2
2.7
16.7
17.3
0.7
0.5
Motherson Sumi
Accumulate
292
313
38,670
39,343
45,100
8.8
9.1
10.1
12.5
29.0
23.4
9.2
7.2
35.3
34.4
1.1
0.9
Rane Brake Lining
Accumulate
339
366
269
454
511
11.1
11.4
23.8
28.1
14.3
12.1
2.0
1.8
14.2
15.3
0.7
0.7
Setco Automotive
Neutral
222
-
593
594
741
12.7
13.7
8.4
15.8
26.4
14.0
2.7
2.4
10.4
16.9
1.4
1.2
Tata Motors
Neutral
417
-
120,512
255,254
301,772
12.9
13.4
23.7
37.3
17.6
11.2
2.1
1.8
7.4
12.1
0.7
0.6
TVS Motor
Neutral
304
-
14,443
11,845
14,040
7.2
9.0
10.4
17.4
29.2
17.5
7.3
5.6
25.1
32.0
1.2
1.0
Amara Raja Batteries
Buy
871
1,040
14,877
4,892
5,871
17.4
17.6
28.8
37.1
30.2
23.5
7.1
5.7
23.4
24.1
3.0
2.4
Exide Industries
Accumulate
146
162
12,414
6,950
7,784
14.4
14.8
6.6
7.3
22.1
20.0
2.8
2.5
12.6
12.8
1.5
1.3
Apollo Tyres
Neutral
163
-
8,297
12,146
12,689
16.8
16.0
21.2
19.0
7.7
8.6
1.3
1.1
16.5
13.0
0.8
0.8
Ceat
Accumulate
1,049
1,119
4,244
6,041
6,597
14.1
13.7
99.5
111.9
10.5
9.4
2.1
1.7
19.6
18.5
0.9
0.7
JK Tyres
Neutral
106
-
2,404
7,446
7,669
15.2
14.0
19.6
18.4
5.4
5.8
1.4
1.1
25.2
19.5
0.7
0.6
Swaraj Engines
Neutral
914
-
1,135
552
630
14.2
14.7
44.6
54.1
20.5
16.9
4.8
4.3
23.2
25.6
1.9
1.6
Subros
Neutral
101
-
607
1,268
1,488
11.6
11.9
3.7
6.6
27.4
15.3
1.8
1.7
6.8
11.4
0.8
0.6
Indag Rubber
Neutral
224
-
588
283
329
17.0
17.2
13.0
15.4
17.3
14.5
3.8
3.1
21.8
21.6
1.8
1.5
Capital Goods
ACE
Neutral
47
-
463
660
839
4.7
8.2
1.0
3.9
46.8
12.0
1.5
1.3
3.2
11.3
0.9
0.7
BEML
Neutral
1,128
-
4,696
3,277
4,006
6.0
8.9
29.2
64.3
38.6
17.5
2.2
2.0
5.7
11.7
1.5
1.2
BGR Energy
Neutral
123
-
890
3,615
3,181
9.5
9.4
16.7
12.4
7.4
9.9
0.7
0.7
10.0
7.0
0.7
0.8
BHEL
Neutral
176
-
42,980
33,722
35,272
10.8
11.7
10.5
14.2
16.7
12.4
1.2
1.2
7.0
9.0
1.4
1.3
Stock Watch
December 02, 2015
Company Name
Reco
CMP
Target
Mkt Cap
Sales ( Čcr )
OPM(%)
EPS (Č)
PER(x)
P/BV(x)
RoE(%)
EV/Sales(x)
(Č)
Price ( Č)
( Č cr )
FY16E
FY17E
FY16E
FY17E
FY16E
FY17E
FY16E
FY17E
FY16E
FY17E
FY16E
FY17E
FY16E
FY17E
Capital Goods
Blue Star
Accumulate
356
382
3,206
3,624
4,157
5.3
6.0
9.6
14.5
37.0
24.6
6.7
5.8
18.6
25.4
1.0
0.9
Crompton Greaves
Neutral
194
-
12,184
13,484
14,687
4.9
6.2
4.5
7.1
43.2
27.4
3.1
2.9
7.2
10.8
1.0
0.9
Inox Wind
Buy
362
505
8,042
4,980
5,943
17.0
17.5
26.6
31.6
13.6
11.5
4.1
3.0
35.0
30.0
1.8
1.4
KEC International
Neutral
156
-
4,008
8,791
9,716
6.1
6.8
5.4
8.2
28.9
19.0
2.9
2.6
10.0
14.0
0.7
0.6
Thermax
Neutral
863
-
10,280
6,413
7,525
7.4
8.5
30.5
39.3
28.3
22.0
4.4
3.8
15.0
17.0
1.6
1.3
Cement
ACC
Buy
1,357
1,630
25,468
13,151
14,757
16.4
18.3
63.9
83.4
21.2
16.3
2.7
2.5
13.3
16.1
1.8
1.5
Ambuja Cements
Buy
201
233
31,147
11,564
12,556
19.4
20.7
8.9
10.1
22.6
19.9
2.8
2.7
12.8
13.8
2.3
2.1
HeidelbergCement
Neutral
76
-
1,718
1,772
1,926
13.3
15.4
1.0
3.0
75.8
25.3
1.9
1.8
2.6
7.9
1.5
1.3
India Cements
Buy
91
112
2,785
4,216
4,840
18.0
19.5
4.0
9.9
22.7
9.2
0.9
0.8
4.0
9.5
1.0
0.8
JK Cement
Accumulate
688
744
4,808
3,661
4,742
10.1
15.8
18.0
61.0
38.2
11.3
2.8
2.4
7.5
22.9
1.8
1.3
J K Lakshmi Cement
Buy
357
430
4,201
2,947
3,616
16.7
19.9
11.5
27.2
31.1
13.1
3.0
2.5
9.8
20.8
1.8
1.5
Mangalam Cements
Neutral
204
-
546
1,053
1,347
10.5
13.3
8.4
26.0
24.3
7.9
1.0
1.0
4.3
12.5
0.9
0.7
Orient Cement
Accumulate
164
183
3,364
1,854
2,524
21.2
22.2
7.7
11.1
21.3
14.8
3.1
2.6
13.3
15.7
2.6
1.8
Ramco Cements
Neutral
377
-
8,979
4,036
4,545
20.8
21.3
15.1
18.8
25.0
20.1
3.1
2.7
12.9
14.3
2.7
2.4
Shree Cement^
Neutral
11,328
-
39,462
7,150
8,742
26.7
28.6
228.0
345.5
49.7
32.8
7.3
6.1
15.7
20.3
5.3
4.2
UltraTech Cement
Accumulate
2,863
3,282
78,556
25,021
30,023
19.1
21.6
89.0
132.0
32.2
21.7
3.7
3.2
12.2
15.9
3.2
2.7
Construction
ITNL
Neutral
88
-
2,901
7,360
8,825
34.0
35.9
7.0
9.0
12.6
9.8
0.4
0.4
3.2
3.7
3.8
3.6
KNR Constructions
Accumulate
608
673
1,709
937
1,470
14.3
14.0
33.5
38.6
18.1
15.7
2.8
2.4
15.4
15.4
1.9
1.2
Larsen & Toubro
Buy
1,365
1,646
127,040
65,065
77,009
11.5
11.7
61.5
65.6
22.2
20.8
2.3
2.0
13.4
14.0
2.2
1.8
Gujarat Pipavav Port
Neutral
162
-
7,822
629
684
51.0
52.2
6.4
5.9
25.3
27.4
3.3
3.1
15.9
12.7
12.1
10.9
MBL Infrastructures
Buy
219
285
907
2,313
2,797
12.2
14.6
19.0
20.0
11.5
10.9
1.2
1.1
11.3
10.6
1.1
1.0
Nagarjuna Const.
Neutral
77
-
4,297
7,892
8,842
8.8
9.1
3.0
5.3
25.8
14.6
1.3
1.2
5.0
8.5
0.8
0.7
PNC Infratech
Neutral
540
-
2,771
1,873
2,288
13.2
13.5
24.0
32.0
22.5
16.9
2.2
1.9
12.1
12.3
1.6
1.3
Simplex Infra
Neutral
336
-
1,664
5,955
6,829
10.3
10.5
16.0
31.0
21.0
10.9
1.1
1.0
5.3
9.9
0.8
0.7
Power Mech Projects
Neutral
614
-
904
1,539
1,801
12.8
12.7
59.0
72.1
10.4
8.5
1.6
1.3
18.6
16.8
0.6
0.5
Sadbhav Engineering
Neutral
354
-
6,071
3,481
4,219
10.7
10.8
8.0
12.0
44.2
29.5
4.1
3.6
10.3
13.5
2.0
1.7
NBCC
Accumulate
997
1,089
11,962
7,382
9,506
7.7
8.6
39.8
54.4
25.1
18.3
6.0
4.8
26.7
29.1
1.4
1.0
SIPL
Neutral
101
-
3,547
675
1,042
62.4
64.7
-
-
3.8
4.3
-
-
16.9
11.4
Financials
Allahabad Bank
Neutral
77
-
4,645
8,332
9,259
2.8
2.8
21.0
25.6
3.7
3.0
0.4
0.3
9.8
10.9
-
-
Stock Watch
December 02, 2015
Company Name
Reco
CMP
Target
Mkt Cap
Sales ( Čcr )
OPM(%)
EPS (Č)
PER(x)
P/BV(x)
RoE(%)
EV/Sales(x)
(Č)
Price ( Č)
( Č cr )
FY16E
FY17E
FY16E
FY17E
FY16E
FY17E
FY16E
FY17E
FY16E
FY17E
FY16E
FY17E
FY16E
FY17E
Financials
Axis Bank
Buy
462
630
109,774
26,473
31,527
3.5
3.6
35.7
43.5
12.9
10.6
2.5
2.2
17.9
18.9
-
-
Bank of Baroda
Neutral
177
-
40,876
19,105
21,474
2.0
2.0
19.1
24.8
9.3
7.2
1.0
0.9
10.2
12.1
-
-
Bank of India
Neutral
131
-
10,350
15,972
17,271
1.9
2.0
15.3
33.4
8.5
3.9
0.4
0.3
3.6
7.6
-
-
Canara Bank
Neutral
270
-
14,674
15,251
16,725
2.0
2.0
59.3
68.6
4.6
3.9
0.5
0.4
10.1
10.7
-
-
Dena Bank
Neutral
45
-
2,550
3,440
3,840
2.1
2.3
7.3
10.0
6.3
4.5
0.5
0.4
6.1
7.9
-
-
Federal Bank
Neutral
59
-
10,101
3,477
3,999
3.0
3.0
5.0
6.2
11.7
9.4
1.2
1.1
10.6
11.9
-
-
HDFC
Neutral
1,225
-
193,313
10,358
11,852
3.3
3.3
41.1
47.0
29.8
26.1
5.7
5.2
24.7
24.9
-
-
HDFC Bank
Buy
1,081
1,262
272,317
38,309
47,302
4.3
4.3
49.3
61.1
21.9
17.7
3.8
3.3
18.5
19.7
-
-
ICICI Bank
Buy
274
357
158,898
35,168
40,517
3.4
3.4
21.4
25.2
12.8
10.9
2.2
1.8
14.7
15.2
-
-
IDBI Bank
Neutral
93
-
14,949
9,625
10,455
1.8
1.8
8.5
14.2
10.9
6.6
0.7
0.6
5.9
9.3
-
-
Indian Bank
Neutral
130
-
6,265
6,160
6,858
2.5
2.5
24.5
29.8
5.3
4.4
0.4
0.4
7.7
8.6
-
-
LIC Housing Finance
Buy
484
571
24,441
3,101
3,745
2.5
2.5
33.0
40.2
14.7
12.1
2.7
2.3
19.7
20.5
-
-
Oriental Bank
Neutral
155
-
4,651
7,643
8,373
2.4
2.4
37.2
45.4
4.2
3.4
0.4
0.3
8.2
9.4
-
-
Punjab Natl.Bank
Neutral
144
-
28,276
23,638
26,557
2.8
2.8
17.9
27.2
8.1
5.3
0.8
0.7
8.5
12.0
-
-
South Ind.Bank
Neutral
21
-
2,829
1,965
2,185
2.5
2.5
2.5
3.3
8.4
6.3
0.8
0.8
9.5
11.7
-
-
St Bk of India
Accumulate
249
283
193,526
82,520
93,299
2.7
2.8
20.0
24.5
12.5
10.2
1.4
1.2
11.5
12.8
-
-
Union Bank
Neutral
172
-
11,848
12,646
14,129
2.3
2.4
31.0
39.1
5.6
4.4
0.6
0.5
9.8
11.4
-
-
Vijaya Bank
Neutral
36
-
3,071
3,536
3,827
1.9
1.9
5.5
6.7
6.5
5.4
0.5
0.5
7.8
8.8
-
-
Yes Bank
Buy
760
914
31,829
7,228
9,043
3.2
3.3
57.7
69.4
13.2
11.0
2.3
2.0
19.1
19.6
-
-
FMCG
Asian Paints
Neutral
844
-
80,942
16,553
19,160
16.0
16.2
17.7
21.5
47.7
39.3
12.7
11.4
29.4
31.2
4.7
4.1
Britannia
Neutral
2,969
-
35,623
8,065
9,395
9.6
10.2
47.2
65.5
62.9
45.3
20.9
19.8
38.3
41.2
4.3
3.7
Colgate
Neutral
973
-
26,467
4,836
5,490
19.5
19.7
48.5
53.2
20.1
18.3
14.7
12.8
99.8
97.5
5.4
4.7
Dabur India
Neutral
279
-
48,980
9,370
10,265
17.1
17.2
7.3
8.1
38.0
34.4
11.5
9.3
33.7
30.6
5.1
4.7
GlaxoSmith Con*
Neutral
5,977
-
25,136
4,919
5,742
17.2
17.4
168.3
191.2
35.5
31.3
10.1
8.6
28.8
28.9
4.7
4.0
Godrej Consumer
Neutral
1,251
-
42,616
10,168
12,886
16.1
16.1
32.1
38.4
39.0
32.6
7.9
7.3
19.7
21.0
4.3
3.4
HUL
Neutral
833
-
180,304
34,940
38,957
17.5
17.7
20.8
24.7
40.1
33.7
44.6
35.6
110.5
114.2
5.0
4.4
ITC
Buy
346
409
277,837
41,068
45,068
37.8
37.4
13.9
15.9
24.9
21.8
8.3
7.3
34.1
33.8
6.4
5.8
Marico
Neutral
424
-
27,332
6,551
7,766
15.7
16.0
10.4
12.5
40.8
33.9
11.9
9.9
33.2
32.4
4.1
3.5
Nestle*
Accumulate
5,876
6,646
56,654
11,291
12,847
22.2
22.3
158.9
184.6
37.0
31.8
19.3
17.4
55.0
57.3
4.9
4.2
Stock Watch
December 02, 2015
Company Name
Reco
CMP
Target
Mkt Cap
Sales ( Čcr )
OPM(%)
EPS (Č)
PER(x)
P/BV(x)
RoE(%)
EV/Sales(x)
(Č)
Price ( Č)
( Č cr )
FY16E FY17E
FY16E
FY17E
FY16E
FY17E
FY16E
FY17E
FY16E
FY17E
FY16E
FY17E
FY16E
FY17E
FMCG
Tata Global
Accumulate
136
144
8,583
8,635
9,072
9.8
9.9
6.5
7.6
20.9
17.9
2.1
2.0
6.8
7.4
0.9
0.9
IT
HCL Tech^
Buy
876
1,132
123,121
42,038
47,503
23.2
23.5
55.8
62.9
15.7
13.9
3.6
2.8
23.0
19.8
2.5
2.0
Infosys
Buy
1,077
1,306
247,301
60,250
66,999
28.0
28.0
58.3
63.7
18.5
16.9
3.9
3.3
20.9
19.7
3.4
2.9
TCS
Buy
2,362
3,165
465,445
111,274
126,852
28.4
28.7
125.4
143.9
18.8
16.4
7.5
6.9
39.9
42.2
3.8
3.3
Tech Mahindra
Buy
542
646
52,099
25,566
28,890
16.0
17.0
26.3
31.9
20.6
17.0
3.7
3.2
17.9
18.6
1.8
1.5
Wipro
Buy
581
719
143,612
52,414
58,704
23.7
23.8
38.4
42.3
15.1
13.8
3.0
2.6
19.5
18.0
2.3
1.9
Media
D B Corp
Accumulate
329
356
6,042
2,241
2,495
27.8
27.9
21.8
25.6
15.1
12.9
3.9
3.5
26.7
28.5
2.6
2.4
HT Media
Neutral
83
-
1,934
2,495
2,603
11.2
11.2
7.3
8.6
11.4
9.7
0.9
0.8
7.4
8.1
0.3
0.3
Jagran Prakashan
Accumulate
153
169
5,010
2,170
2,355
27.0
27.6
12.8
10.3
11.9
14.9
3.3
3.1
21.8
19.4
2.1
1.8
Sun TV Network
Neutral
400
-
15,752
2,779
3,196
70.2
70.5
22.8
27.3
17.5
14.6
4.3
3.9
26.7
28.3
5.4
4.7
Hindustan Media
Neutral
289
-
2,124
920
1,031
20.0
20.0
19.2
20.9
15.1
13.9
2.5
2.1
16.4
15.3
1.9
1.6
Ventures
Metals & Mining
Coal India
Accumulate
342
380
215,704
76,167
84,130
19.9
22.3
22.4
25.8
15.2
13.2
5.5
5.4
35.5
41.0
2.2
1.9
Hind. Zinc
Buy
147
175
62,133
14,641
14,026
50.4
50.4
17.7
16.0
8.3
9.2
1.3
1.2
16.2
13.2
1.9
1.7
Hindalco
Neutral
80
-
16,427
104,356
111,186
8.7
9.5
6.7
11.1
11.8
7.2
0.4
0.4
3.5
5.9
0.7
0.6
JSW Steel
Neutral
943
-
22,803
42,308
45,147
16.4
20.7
(10.3)
49.5
19.1
1.1
1.0
(1.0)
5.6
1.6
1.5
NMDC
Neutral
95
-
37,704
8,237
10,893
46.6
44.5
10.0
11.7
9.6
8.2
1.1
0.9
12.5
13.0
4.4
3.3
SAIL
Neutral
47
-
19,246
45,915
53,954
7.2
10.5
1.5
4.4
30.9
10.7
0.5
0.4
2.3
4.1
1.1
0.9
Vedanta
Neutral
94
-
27,942
71,445
81,910
26.2
26.3
12.9
19.2
7.3
4.9
0.5
0.5
7.2
8.9
0.8
0.6
Tata Steel
Neutral
238
-
23,081
126,760
137,307
8.9
11.3
6.4
23.1
37.4
10.3
0.8
0.7
2.0
7.1
0.8
0.7
Oil & Gas
Cairn India
Neutral
137
-
25,714
11,323
12,490
49.4
51.0
20.7
20.7
6.6
6.6
0.4
0.4
6.4
6.1
1.3
0.7
GAIL
Neutral
359
-
45,500
64,856
70,933
9.1
9.6
24.0
28.9
15.0
12.4
1.3
1.2
8.8
9.6
0.9
0.8
ONGC
Neutral
235
-
201,396
154,564
167,321
36.8
37.4
28.6
32.5
8.2
7.3
1.1
1.0
12.7
13.5
1.5
1.4
Petronet LNG
Neutral
238
-
17,869
29,691
31,188
5.8
6.2
12.8
13.4
18.6
17.8
2.8
2.5
15.8
14.8
0.7
0.6
Indian Oil Corp
Accumulate
433
455
105,143
359,607
402,760
5.9
6.1
42.5
48.7
10.2
8.9
1.4
1.2
14.1
14.4
0.4
0.4
Reliance Industries
Accumulate
966
1,050
312,686
304,775
344,392
12.6
13.4
91.3
102.6
10.6
9.4
1.2
1.1
11.8
12.0
1.0
0.8
Pharmaceuticals
Alembic Pharma
Neutral
705
-
13,289
2,658
3,112
24.1
20.2
24.6
23.9
28.7
29.5
10.3
7.9
42.5
30.2
5.0
4.2
Aurobindo Pharma
Accumulate
825
872
48,192
14,923
17,162
23.0
23.0
38.2
43.6
21.6
18.9
6.7
5.0
36.0
30.2
3.6
3.0
Aventis*
Neutral
4,384
-
10,096
2,082
2,371
17.4
20.8
118.2
151.5
37.1
28.9
5.4
4.4
19.9
25.5
4.5
3.8
Cadila Healthcare
Neutral
401
-
41,052
10,224
11,840
21.0
22.0
14.6
17.6
27.5
22.8
7.5
5.9
30.8
29.0
4.1
3.4
Stock Watch
December 02, 2015
Company Name
Reco
CMP
Target
Mkt Cap
Sales ( Čcr )
OPM(%)
EPS (Č)
PER(x)
P/BV(x)
RoE(%)
EV/Sales(x)
(Č)
Price ( Č)
( Č cr )
FY16E FY17E
FY16E
FY17E
FY16E
FY17E
FY16E
FY17E
FY16E
FY17E
FY16E
FY17E
FY16E
FY17E
Pharmaceuticals
Cipla
Neutral
649
-
52,081
14,211
16,611
20.6
19.0
27.0
28.9
24.0
22.4
4.1
3.5
18.4
16.8
3.7
3.1
Dr Reddy's
Buy
3,213
3,933
54,784
16,838
19,575
25.0
23.1
167.5
178.8
19.2
18.0
4.0
3.4
23.1
20.4
3.2
2.7
Dishman Pharma
Neutral
323
-
2,607
1,733
1,906
21.5
21.5
17.0
19.9
19.0
16.2
1.9
1.7
10.5
11.2
2.0
1.7
GSK Pharma*
Neutral
3,275
-
27,744
2,870
3,158
20.0
22.1
59.5
68.3
55.1
48.0
16.2
16.7
28.5
34.3
9.2
8.4
Indoco Remedies
Neutral
327
-
3,015
1,033
1,199
15.9
18.2
9.4
13.6
34.8
24.1
5.2
4.4
15.7
19.7
3.0
2.6
Ipca labs
Accumulate
784
900
9,897
3,363
3,909
12.9
18.6
13.4
28.0
58.5
28.0
7.6
6.1
7.4
14.0
3.2
2.8
Lupin
Neutral
1,812
-
81,579
13,092
16,561
25.0
27.0
50.4
68.3
36.0
26.5
7.4
5.9
22.8
24.7
5.9
4.6
Sun Pharma
Buy
730
950
175,766
28,163
32,610
25.8
30.7
17.4
26.9
42.0
27.2
4.0
3.5
13.0
16.6
5.7
4.7
Power
Tata Power
Neutral
67
-
18,013
35,923
37,402
22.6
22.8
4.1
5.2
16.4
12.9
1.3
1.2
7.5
9.3
1.5
1.3
NTPC
Buy
133
157
109,376
87,064
98,846
23.5
23.5
11.7
13.2
11.3
10.1
1.3
1.2
11.4
12.1
2.3
2.0
Power Grid
Buy
136
170
71,045
20,702
23,361
86.7
86.4
12.1
13.2
11.2
10.3
1.7
1.5
15.6
15.1
8.4
7.8
Telecom
Bharti Airtel
Neutral
323
-
128,996
101,748
109,191
32.1
31.7
12.0
12.5
26.9
25.8
1.9
1.7
6.9
6.7
1.9
1.7
Idea Cellular
Neutral
142
-
50,952
34,282
36,941
32.0
31.5
5.9
6.2
24.0
22.8
2.2
2.0
9.9
9.3
2.1
1.9
zOthers
Abbott India
Neutral
5,196
-
11,041
2,715
3,153
14.5
14.1
134.3
152.2
38.7
34.1
9.7
8.0
27.4
25.6
3.8
3.2
Bajaj Electricals
Buy
218
341
2,198
4,719
5,287
5.2
5.8
8.6
12.7
25.5
17.2
2.9
2.6
11.4
14.8
0.5
0.4
Finolex Cables
Neutral
251
-
3,834
2,520
2,883
12.2
12.0
12.7
14.2
19.8
17.7
2.7
2.4
13.6
13.5
1.3
1.1
Goodyear India*
Accumulate
569
622
1,311
1,888
1,680
12.1
11.9
62.2
56.6
9.1
10.1
2.1
1.8
25.9
19.7
0.5
0.5
Hitachi
Neutral
1,332
-
3,623
1,779
2,081
7.8
8.8
21.8
33.4
61.1
39.9
9.9
8.0
17.4
22.1
2.1
1.8
Jyothy Laboratories
Neutral
316
-
5,714
1,620
1,847
11.5
11.5
7.3
8.5
43.3
37.2
5.6
5.2
13.3
14.4
3.4
2.9
MRF
Buy
39,213
45,575
16,631
20,316
14,488
21.4
21.1
5,488.0
3,798.0
7.2
10.3
2.4
2.0
41.1
21.2
0.8
1.0
Page Industries
Neutral
12,925
-
14,416
1,929
2,450
19.8
20.1
229.9
299.0
56.2
43.2
24.8
17.2
52.1
47.1
7.5
5.9
Relaxo Footwears
Neutral
507
-
6,082
1,767
2,152
12.3
12.5
19.3
25.1
26.3
20.2
6.5
5.0
27.7
27.8
3.5
2.8
Siyaram Silk Mills
Buy
947
1,145
887
1,636
1,815
11.5
11.5
89.9
104.1
10.5
9.1
1.7
1.5
17.9
17.8
0.7
0.6
Styrolution ABS India*
Neutral
729
-
1,282
1,271
1,440
8.6
9.2
32.0
41.1
22.8
17.8
2.3
2.1
10.7
12.4
1.0
0.8
TVS Srichakra
Accumulate
2,874
3,240
2,201
2,101
2,338
15.7
15.0
248.6
270.0
11.6
10.7
5.0
3.6
43.6
34.0
1.1
0.9
HSIL
Neutral
317
-
2,291
2,123
2,384
16.1
16.5
15.0
18.9
21.1
16.8
1.6
1.5
8.0
9.4
1.4
1.3
Kirloskar Engines India
Neutral
265
-
3,833
2,471
2,826
8.8
10.4
9.1
13.3
29.0
19.9
2.8
2.6
9.7
13.4
1.2
1.0
Ltd
M M Forgings
Buy
513
614
619
511
615
21.7
21.6
43.1
55.8
11.9
9.2
2.2
1.8
19.9
21.2
1.4
1.1
Banco Products (India)
Neutral
138
-
988
1,208
1,353
11.0
12.3
10.8
14.5
12.8
9.5
1.5
1.3
11.9
14.5
0.8
0.7
Stock Watch
December 02, 2015
Company Name
Reco
CMP
Target Mkt Cap
Sales ( Čcr )
OPM(%)
EPS (Č)
PER(x)
P/BV(x)
RoE(%)
EV/Sales(x)
(Č)
Price ( Č)
( Č cr )
FY16E FY17E FY16E FY17E FY16E FY17E FY16E FY17E FY16E FY17E FY16E FY17E FY16E FY17E
zOthers
Competent Automobiles Neutral
154
-
94
1,040
1,137
3.2
3.1
25.7
28.0
6.0
5.5
0.9
0.8
15.0
14.3
0.1
0.1
Nilkamal
Neutral
1,038
-
1,549
1,910
2,083
10.5
10.3
63.3
69.2
16.4
15.0
2.7
2.3
17.6
16.5
0.9
0.8
Visaka Industries
Buy
121
144
193
1,086
1,197
9.9
10.3
21.5
28.8
5.6
4.2
0.5
0.5
9.6
11.6
0.4
0.3
Transport Corporation of
Neutral
322
-
2,450
2,830
3,350
8.8
9.0
14.4
18.3
22.4
17.6
3.5
3.0
15.4
17.1
1.0
0.9
India
Elecon Engineering
Neutral
88
-
958
1,369
1,533
13.7
14.9
3.3
6.1
26.5
14.5
1.7
1.6
6.6
11.4
1.0
0.9
Surya Roshni
Buy
140
183
612
2,992
3,223
8.1
8.4
14.7
18.3
9.5
7.6
0.9
0.8
9.7
11.0
0.5
0.4
MT Educare
Buy
142
169
567
286
366
18.3
17.7
7.7
9.4
18.4
15.2
3.9
3.4
20.2
21.1
1.9
1.4
Radico Khaitan
Buy
110
156
1,464
1,565
1,687
12.2
13.0
5.7
7.1
19.3
15.5
1.6
1.5
8.3
9.6
1.4
1.3
Garware Wall Ropes
Accumulate
391
423
855
861
967
10.9
10.9
24.0
28.2
16.3
13.9
2.4
2.1
14.6
14.9
1.0
0.9
Wonderla Holidays
Neutral
358
-
2,020
206
308
44.0
43.6
9.0
12.9
39.7
27.7
5.4
4.9
13.7
17.8
9.7
6.5
Linc Pen & Plastics
Neutral
186
-
275
340
371
8.3
8.9
10.8
13.2
17.2
14.1
2.8
2.4
16.0
17.1
0.8
0.8
The Byke Hospitality
Accumulate
165
181
663
222
287
20.5
20.5
5.6
7.6
29.3
21.9
5.5
4.5
18.9
20.8
3.0
2.3
Interglobe Aviation
Neutral
1,094
-
39,423
17,022
21,122
20.7
14.5
63.9
53.7
17.1
20.4
25.7
21.0
149.9
103.2
2.3
1.9
Coffee Day Enterprises
Neutral
258
-
5,311
2,692
2,964
17.0
18.6
-
4.7
-
54.4
3.2
3.0
0.2
5.5
2.4
2.2
Ltd
Navneet Education
Accumulate
86
97
433
998
1,062
24.1
24.0
5.8
6.1
15.0
14.2
3.3
2.9
22.0
20.6
0.5
0.5
Source: Company, Angel Research; Note: *December year end; #September year end; &October year end; Price as on December 01, 2015
Market Outlook
December 02, 2015
Research Team Tel: 022 - 39357800
DISCLAIMER
Angel Broking Private Limited (hereinafter referred to as “Angel”) is a registered Member of National Stock Exchange of India Limited,
Bombay Stock Exchange Limited and Metropolitian Stock Exchange of India Limited. It is also registered as a Depository Participant with
CDSL and Portfolio Manager with SEBI. It also has registration with AMFI as a Mutual Fund Distributor. Angel Broking Private Limited is a
registered entity with SEBI for Research Analyst in terms of SEBI (Research Analyst) Regulations, 2014 vide registration number
INH000000164. Angel or its associates has not been debarred/ suspended by SEBI or any other regulatory authority for accessing
/dealing in securities Market. Angel or its associates including its relatives/analyst do not hold any financial interest/beneficial ownership
of more than 1% in the company covered by Analyst. Angel or its associates/analyst has not received any compensation / managed or co
-managed public offering of securities of the company covered by Analyst during the past twelve months. Angel/analyst has not served as
an officer, director or employee of company covered by Analyst and has not been engaged in market making activity of the company
covered by Analyst.
This document is solely for the personal information of the recipient, and must not be singularly used as the basis of any investment
decision. Nothing in this document should be construed as investment or financial advice. Each recipient of this document should make
such investigations as they deem necessary to arrive at an independent evaluation of an investment in the securities of the companies
referred to in this document (including the merits and risks involved), and should consult their own advisors to determine the merits and
risks of such an investment.
Reports based on technical and derivative analysis center on studying charts of a stock's price movement, outstanding positions and
trading volume, as opposed to focusing on a company's fundamentals and, as such, may not match with a report on a company's
fundamentals.
The information in this document has been printed on the basis of publicly available information, internal data and other reliable sources
believed to be true, but we do not represent that it is accurate or complete and it should not be relied on as such, as this document is for
general guidance only. Angel Broking Pvt. Limited or any of its affiliates/ group companies shall not be in any way responsible for any
loss or damage that may arise to any person from any inadvertent error in the information contained in this report. Angel Broking Pvt.
Limited has not independently verified all the information contained within this document. Accordingly, we cannot testify, nor make any
representation or warranty, express or implied, to the accuracy, contents or data contained within this document. While Angel Broking
Pvt. Limited endeavors to update on a reasonable basis the information discussed in this material, there may be regulatory, compliance,
or other reasons that prevent us from doing so.
This document is being supplied to you solely for your information, and its contents, information or data may not be reproduced,
redistributed or passed on, directly or indirectly.
Neither Angel Broking Pvt. Limited, nor its directors, employees or affiliates shall be liable for any loss or damage that may arise from or
in connection with the use of this information.
Note: Please refer to the important ‘Stock Holding Disclosure' report on the Angel website (Research Section). Also, please refer to the
latest update on respective stocks for the disclosure status in respect of those stocks. Angel Broking Pvt. Limited and its affiliates may have
investment positions in the stocks recommended in this report.