Market Outlook
November 2, 2015
Market Cues
Domestic Indices
Chg (%)
(Pts)
(Close)
Indian markets are expected to open in the red tracking the SGX Nifty and Asian
BSE Sensex
(0.7)
(181)
26,657
markets.
Nifty
(0.6)
(46)
8,066
US markets closed in the red due to some late selling pressure after choppy trading
Mid Cap
(0.1)
(14)
10,975
on account of mixed economic data. While US personal income and consumer
Small Cap
(0.8)
(89)
11,315
spending inched up marginally, both were lower than expected. US consumer
sentiment too inched up in October, but missed expectations.
Bankex
0.9
180
19,774
European markets also closed on a negative note led by weak economic data.
Despite the stimulus, Eurozone consumer prices remained flat in October. Eurozone
Global Indices
Chg (%)
(Pts)
(Close)
unemployment too remained high despite a marginal decline.
Dow Jones
(0.5)
(92)
17,664
The Indian markets fell for the fifth straight session led by uncertainty over the
Nasdaq
(0.4)
(21)
5,054
outcome of Bihar elections and disappointing earnings from majors L&T and ITC.
FTSE
(0.5)
(34)
6,361
Nikkei
0.8
147
19,083
News & Result Analysis
Hang Seng
(0.8)
(180)
22,640
Result Review: ICICI Bank, Larsen & Toubro, Indoco Remedies, GSK Pharma,
Shanghai Com
(0.1)
(5)
3,383
IPCA Labs, Relaxo Footwear
Detailed analysis on Pg2
Advances / Declines
BSE
NSE
Investor’s Ready Reckoner
Advances
964
479
Key Domestic & Global Indicators
Declines
1,652
1,024
Stock Watch: Latest investment recommendations on 150+ stocks
Unchanged
190
71
Refer P7 onwards
Top Picks
Volumes (` Cr)
CMP
Target
Upside
Company
Sector
Rating
BSE
3,187
(`)
(`)
(%)
Axis Bank
Financials
Buy
475
630
32.6
NSE
19,049
HCL Tech
IT
Buy
870
1,132
30.2
ICICI Bank
Financials
Buy
277
348
25.6
Net Inflows (` Cr)
Net
Mtd
Ytd
Power Grid
Power
Buy
129
170
32.0
FII
536
5,567
(13,457)
TCS
IT
Buy
2,497
3,165
26.7
MFs
(301)
1,307
48,719
More Top Picks on Pg5
Key Upcoming Events
Top Gainers
Price (`)
Chg (%)
Previous
Consensus
Date
Region
Event Description
Jet Airways
437
9.3
Reading
Expectations
Nov 1
China
PMI Manufacturing
49.8
50.0
Adani Ent.
1,669
6.7
Nov 2
US
ISM manufacturing PMI
50.2
50.0
Bharat Forge
859
5.4
Nov 2
China
Chinese Caixin Manufacturing PMI
47.2
47.6
Sun TV
396
5.2
Nov 2
UK
ISM manufacturing PMI
51.5
51.3
Glenmark
991
5.0
Top Losers
Price (`)
Chg (%)
Mphasis
478
(7.6)
Wockhardt Pharma
1,495
(6.5)
Vedanta
100
(6.4)
Apollo Tyre
171
(6.2)
Just Dial
806
(5.7)
As on October 30, 2015
Market Outlook
November 2, 2015
Result Review
ICICI Bank (CMP: `277/ TP: `348/ Upside: 25.6%)
ICICI Bank reported a decent set of number for 2QFY2016 results with PAT growth
of 11.9% yoy to `3,030cr in 2QFY2016 which was in-line with our expectations.
NII grew at steady pace of 12.8% yoy which was in-line with the expectations likely
due to growth in advances at 13.3% yoy as well as flat margins sequentially. The
bank managed to keep the operating expenses under check which grew 15.0%
yoy on a low base of the same quarter last year; below our estimates. The
provisions saw a decline of 1.4% qoq which was below our expectations.
The bank continues to grow its retail franchise and has seen healthy growth in
retail loan book at 25% yoy which now constituted about 44% of the loan portfolio
of the bank as of September 30, 2015. Also, the growing retail franchise is visible
in CASA ratio which came at 45.1% as against 43.7% in the year ago period.
The country's largest private sector lender today approved sale of 9.0% stake in
insurance company ICICI Lombard to Fairfax Financial Holdings Limited at a
valuation of `17,225cr which was higher than our estimates. Incorporating the
implied value from this stake sale, our SOTP based value for the non-life business
will increase by `10 per share.
Asset quality was in-line with our expectations since the management has guided
for more additions to stressed assets during the year. The Gross NPA ratio rose by
9bp qoq to 3.77% while the Net NPA ratio rose by 7bps qoq to 1.65% in
2QFY2016. However, we would wait for more clarity on the stress assets additions
during the year. At CMP, the bank’s core banking business (after adjusting
`58/share towards value of subsidiaries) is trading at 1.5x FY2017E ABV. We
recommend BUY rating on the stock.
Y/E
Op. Inc
NIM
PAT
EPS
ABV ROA ROE
P/E P/ABV
March
(` cr)
(%)
(` cr)
(`)
(`)
(%)
(%)
(x)
(x)
FY2016E
35,168
3.4
12,479
21.4
124.9
1.6
14.7
12.7
2.2
FY2017E
40,517
3.4
14,680
25.2
149.8
1.6
15.2
10.8
1.8
Larsen & Toubro (CMP: `1,414 / TP: `1,646 / Upside: 16.6%)
Larsen & Toubro (L&T; standalone entity) reported a poor set of numbers for
2QFY2016, both at the top-line and the bottom-line level. The company reported
a lower-than-expected top-line growth, i.e. of 4.1% YoY to INR 13,234cr. The
subtle revenue growth is owing to lower revenue booking across Infrastructure,
Metallurgical & Material Handling and Heavy Engineering segments. The
disappointment continued further towards the EBITDA level; the company reported
a 290bp YoY decline in the EBITDA margin to 7.6%. Revenue de-growth and
56.5% YoY increase in sales, administration and other expenses led to EBITDA
margin compression. During the quarter, L&T reported a gain from stake sale in a
subsidiary and an associate company to the tune of INR 546cr. Adjusting for the
same, the Adj. PAT of the company came in at INR 643cr (lower than our estimate
of INR 1,084cr). The Adj. PAT was impacted due to increase in interest expenses by
22.7% YoY.
Market Outlook
November 2, 2015
For 2QFY2016, L&T reported order inflows of INR 28,620cr. Due to lower order
inflows in two consecutive quarters (1QFY2016 & 2QFY2016), the Management
has revised down its order inflow guidance for FY2016E to 5-7% (from 15%
earlier).
Even though there have been delays on the awarding front, we believe in the
Indian Infra growth story. Given the company’s market positioning, we see L&T to
be well positioned to gain from an expected gradual recovery in the capex cycle,
given its exposure to a range of sectors, and better cash flow generating potential
vis-a-vis its peers. We maintain our positive view on L&T; we maintain our BUY
rating on the stock with price target of `1,646.
Y/E
Sales OPM
PAT
EPS ROE P/E P/BVEV/EBITDAEV/Sales
March
(` cr)
(%)
(` cr)
(`)
(%)
(x)
(x)
(x)
(x)
FY2016E
64,148
11.5
5,776
61.5
13.4
22.9
2.3
19.5
2.2
FY2017E
73,241
11.7
6,155
65.6
14.0
21.5
2.1
16.9
2.0
Indoco Remedies (CMP: `326 / TP: /Upside : )
For 2QFY2016, the company posted numbers lower than expected. The company
posted a 9.4% growth in sales to end the period at `248cr V/s `272cr expected
and `226cr in 2QFY2015, on back of domestic and exports posting a growth of
1.2% and 23.6% respectively. In domestic markets (`146cr), posted a growth of
1.2% yoy, mainly on back a tepid formulation sales (`138cr), a yoy growth of
0.5%, while API sales (`7.6cr), posted a 11.7% yoy growth. In exports (`101cr), a
yoy growth of 23.6%, on back of formulation exports (`92.8cr) a growth of 23.7%
yoy, while API exports (`6.9cr) posted a yoy growth of 3.6%.
On operating front, the EBITDA margins came in at 15.5% V/s 20.9% expected V/s
20.6% in 2QFY2015, on back of lower than expected sales and 28.3% yoy and
82.6% yoy rise in staff expenditure and R&D expenditure respectively. The R&D
expenditure during the quarter was 3.6% of sales V/s 2.2% of sales in 2QFY2015.
Thus, the Adj. net profit came in at `22.6cr V/s `33.4cr expected and `22.4cr in
2QFY2015, a yoy growth of 0.9%. The lower than expected net profit is on back of
lower than expected sales and OPM. On back of valuations, we maintain our
neutral stance on the stock.
Y/E
Sales OPM
PAT
EPS ROE P/E P/BV EV/EBITDA EV/Sales
March
(` cr)
(%)
(` cr)
(`)
(%)
(x)
(x)
(x)
(x)
FY2016E
1,008
18.2
120
13.1
21.2
24.9
4.9
15.9
2.9
FY2017E
1,262
18.2
143
15.5
21.1
21.0
4.1
13.4
2.4
Market Outlook
November 2, 2015
GSK Pharma (CMP: `3,295 / TP: /Upside : )
For 2QFY2016, the company posted a disappointing numbers, on back of lower
than expected sales. For the quarter, the company posted sales of `692cr V/s
`720cr expected a dip of 6.4% yoy. The dip in sales is on back of the supply
constraints. On the operating profits, the company posted gross margins of
56.4% V/s 53.5% during the last corresponding period. Inspite of the same, the
OPM’s came in at 17.4% V/s 21.3% during the last corresponding period, mainly
on back of the lower sales during the quarter. This was against the expectations of
20.2%. Thus the reported net profit came in at `96cr V/s `129cr in during the last
corresponding period. However Adj. net profit came in at `101cr V/s `129cr, a
yoy dip of 21.4%. We remain neutral on the stock.
Y/E
Sales OPM
PAT
EPS ROE P/E P/BV EV/EBITDA EV/Sales
March
(` cr)
(%)
(` cr)
(`)
(%)
(x)
(x)
(x)
(x)
FY2016E
2,870
20.0
504
59.5
28.5
63.0
18.6
52.3
10.5
FY2017E
3,158
22.1
574
68.3
34.3
54.8
19.1
43.3
9.6
IPCA Labs (CMP: `782 / TP: `900 / Upside: 15.0%)
For 2QFY2016, the company posted sales in line while, the net profit posted
numbers lower than estimates. The company, posted a 4.7% de-growth in sales to
end the period at `739cr V/s `750cr expected and `775cr in 2QFY2015, on back
of domestic and exports posting a dip of 2.3% and 6.9%, respectively. Domestic
markets (`364cr) posted a dip of 2.3% yoy, mainly on back of tepid formulation
sales (`331cr), a yoy growth of 0.9%, while API sales (`33cr), a 25.3% yoy dip.
Exports (`375cr) saw a yoy fall of 6.9%, on back of dip in formulation exports
(`227cr), a dip of 25.7% yoy, while API exports (`147cr) posted a yoy growth of
52.9%.
On operating front, the EBITDA margins came in at 10.6% V/s 11.4% expected V/s
10.0% in 2QFY2015, on back of lower than expected sales during the quarter,
while Gross margins , came in at 62.0% V/s 65.0% in 2QFY2015. Thus, the Adj.
net profit came in at `31cr V/s `41cr expected and `68cr in 2QFY2015, a yoy dip
of 54.3%.
However, on back of `24cr forex losses, the company posted a net profit of `12cr
V/s `61cr, a yoy dip of 80.9% yoy. While the current performance of the company
is impacted on back of its key plants being under the USFDA scanner, we believe
once out of it, the company can bounce back to its normalized ROE’s of 25%. Thus
we maintain our buy with a target price of `900.
Y/E
Sales OPM
PAT
EPS ROE P/E P/BV EV/EBITDA EV/Sales
March
(` cr)
(%)
(` cr)
(`)
(%)
(x)
(x)
(x)
(x)
FY2016E
3,363
12.9
169
13.4
7.4
58.4
4.2
24.8
3.2
FY2017E
3,909
18.6
354
28.0
14.0
27.9
3.7
14.8
2.8
Market Outlook
November 2, 2015
Relaxo Footwears (CMP: `524 / TP: - / Upside: -)
For 2QFY2016, Relaxo reported numbers that were in-line with our estimates. The
top-line grew by 15.8% yoy to `384cr, the same was lower than our estimate of
`398cr. The gross margin expanded by 267bp yoy to 58.7% and net raw material
cost as a percentage sales came in at 41.3%. On the back of lower raw material
cost, the EBITDA margin expanded by 174bp yoy to 12.8% vis-à-vis our estimate
of 11.6%. The interest expense has increased by 39.6% yoy to `6cr (as the debt
quantum has increased) and the other income during the quarter was higher as it
included sale of Long Term investment for the amount of `4.2cr. Adjusting for the
sale of investment, the net profit grew by 34.6% yoy to `23cr, which same as our
estimate. At current market price, the stock trades at 35.3x its FY2017E earnings.
We have a Neutral view on the stock.
Y/E
Sales OPM
PAT
EPS ROE P/E P/BV EV/EBITDA EV/Sales
March
(` cr)
(%)
(` cr)
(`)
(%)
(x)
(x)
(x)
(x)
FY2016E
1,760
14.3
135
11.2
31.3
46.6
12.7
25.6
3.7
FY2017E
2,120
15.0
178
14.9
30.9
35.3
9.5
19.9
3.0
Economic and Political News
Government unveils draft civil aviation policy to raise FDI limit beyond 50%,
make air travel cheaper
Rajasthan attracts investments of ~`1.5 lakh cr ahead of the Resurgent
Rajasthan Partnership Summit from solar, mining, textiles & petroleum sectors
India may need to import 10 MT of pulses to tame prices: Assocham Study
Corporate News
RCom to take over SSTL’s telecom business in ~`5,000cr cashless deal
IOC eyes 5-10% stake in Russia's Vankor oilfield
M&M October sales up by 20% led by festive season push
Market Outlook
November 2, 2015
Top Picks ★★★★★
Large Cap
Market Cap
CMP
Target
Upside
Company
Rationale
(` Cr)
(`)
(`)
(%)
Healthy pace of branch expansion, backed by distribution
Axis Bank
1,12,936
475
630
32.6
network, will be the driving force for the bank’s retail business
and overall earnings.
The stock is trading at attractive valuations and is factoring all
HCL Tech
1,22,281
870
1,132
30.2
the bad news.
Due to its robust franchise and capital adequacy position, the
bank is well positioned to grow by at least a few percentage
ICICI Bank
1,60,873
277
348
25.6
points higher than the average industry growth rate from a
structural point of view.
Back on the growth trend, expect a long term growth of 14% to
Infosys
2,60,944
1,136
1,306
15.0
be a US$20bn in FY2020.
Government thrust on Renewable sector and strong order book
Inox Wind
8,829
398
505
26.9
would drive future growth.
LICHF continues to grow its retail loan book at a healthy pace
with improvement in asset quality. We expect the company to
LIC HFL
24,229
480
571
18.9
post a healthy loan book which is likely to reflect in a strong
earnings growth.
Direct beneficiary of the huge investments lined up in the power
Power Grid
67,357
129
170
32.0
transmission sector.
Growth to pick up from 2HFY2017, attractive given the risk-
TCS
4,92,075
2,497
3,165
26.7
reward.
Tech Mahindra
51,865
539
646
19.9
Acquisitions, to drive growth, normalised valuations attractive.
An improving liability franchise, capital adequacy well above
Yes Bank
31,804
759
914
20.4
Basel-III requirements and lowest NPA ratio in the industry, will
help Yes Bank to deliver a stronger growth.
Source: Company, Angel Research
Mid Cap
Market Cap
CMP
Target
Upside
Company
Rationale
(` Cr)
(`)
(`)
(%)
Bajaj Electricals
2,481
246
341
38.7
Visible turnaround in E&P business to drive the earnings
Garware Wall Ropes
752
344
390
13.5
Higher exports & easing material prices to drive profitability
Comfortable balance sheet to support strong growth; this
MBL Infrastructures
866
209
285
36.4
coupled with attractive valuation to lead to rerating.
New product introductions and increased sourcing by clients to
Minda Industries
827
521
652
25.1
enable outpace industry growth
Strong brand & quality teaching with innovative technologies &
MT Educare
546
137
169
23.3
higher government educational spending to boost growth
Earnings boost on back of stable material prices and favourable
Radico Khaitan
1,346
101
119
17.6
pricing environment. Valuation discount to peers provides
additional comfort
Structural shift in the Lighting industry towards LED lighting will
Surya Roshni
585
134
183
37.1
drive growth.
Tree House
1,166
276
347
25.9
Robust expansion plan for pre-schools to drive growth
Source: Company, Angel Research
Market Outlook
November 2, 2015
Quarterly Bloomberg Brokers Consensus Estimate
Reliance Capital - November 02, 2015
Particulars (` cr)
2QFY16E
2QFY15
y-o-y (%)
1QFY16
q-o-q (%)
PAT
224
217
3.0
229
(2.4)
Adani Ports and Special Economic Zone Ltd - November 02, 2015
Particulars (` cr)
2QFY16E
2QFY15
y-o-y (%)
1QFY16
q-o-q (%)
Net sales
1,773
1,415
25.3
1,723
2.9
EBITDA
1,210
1,074
12.7
1,164
4.0
EBITDA margin (%)
68.3
75.9
67.6
Net profit
670
574
16.8
641
4.6
United Spirit Limited- November 02, 2015
Particulars (` cr)
2QFY16E
2QFY15
y-o-y (%)
1QFY16
q-o-q (%)
Net sales
2,341
2,157
8.6
1,988
17.7
EBITDA
258
233
10.8
202
27.9
EBITDA margin (%)
11.0
10.8
10.2
Net profit
86
(28)
410.1
20
333.7
Market Outlook
November 02, 2015
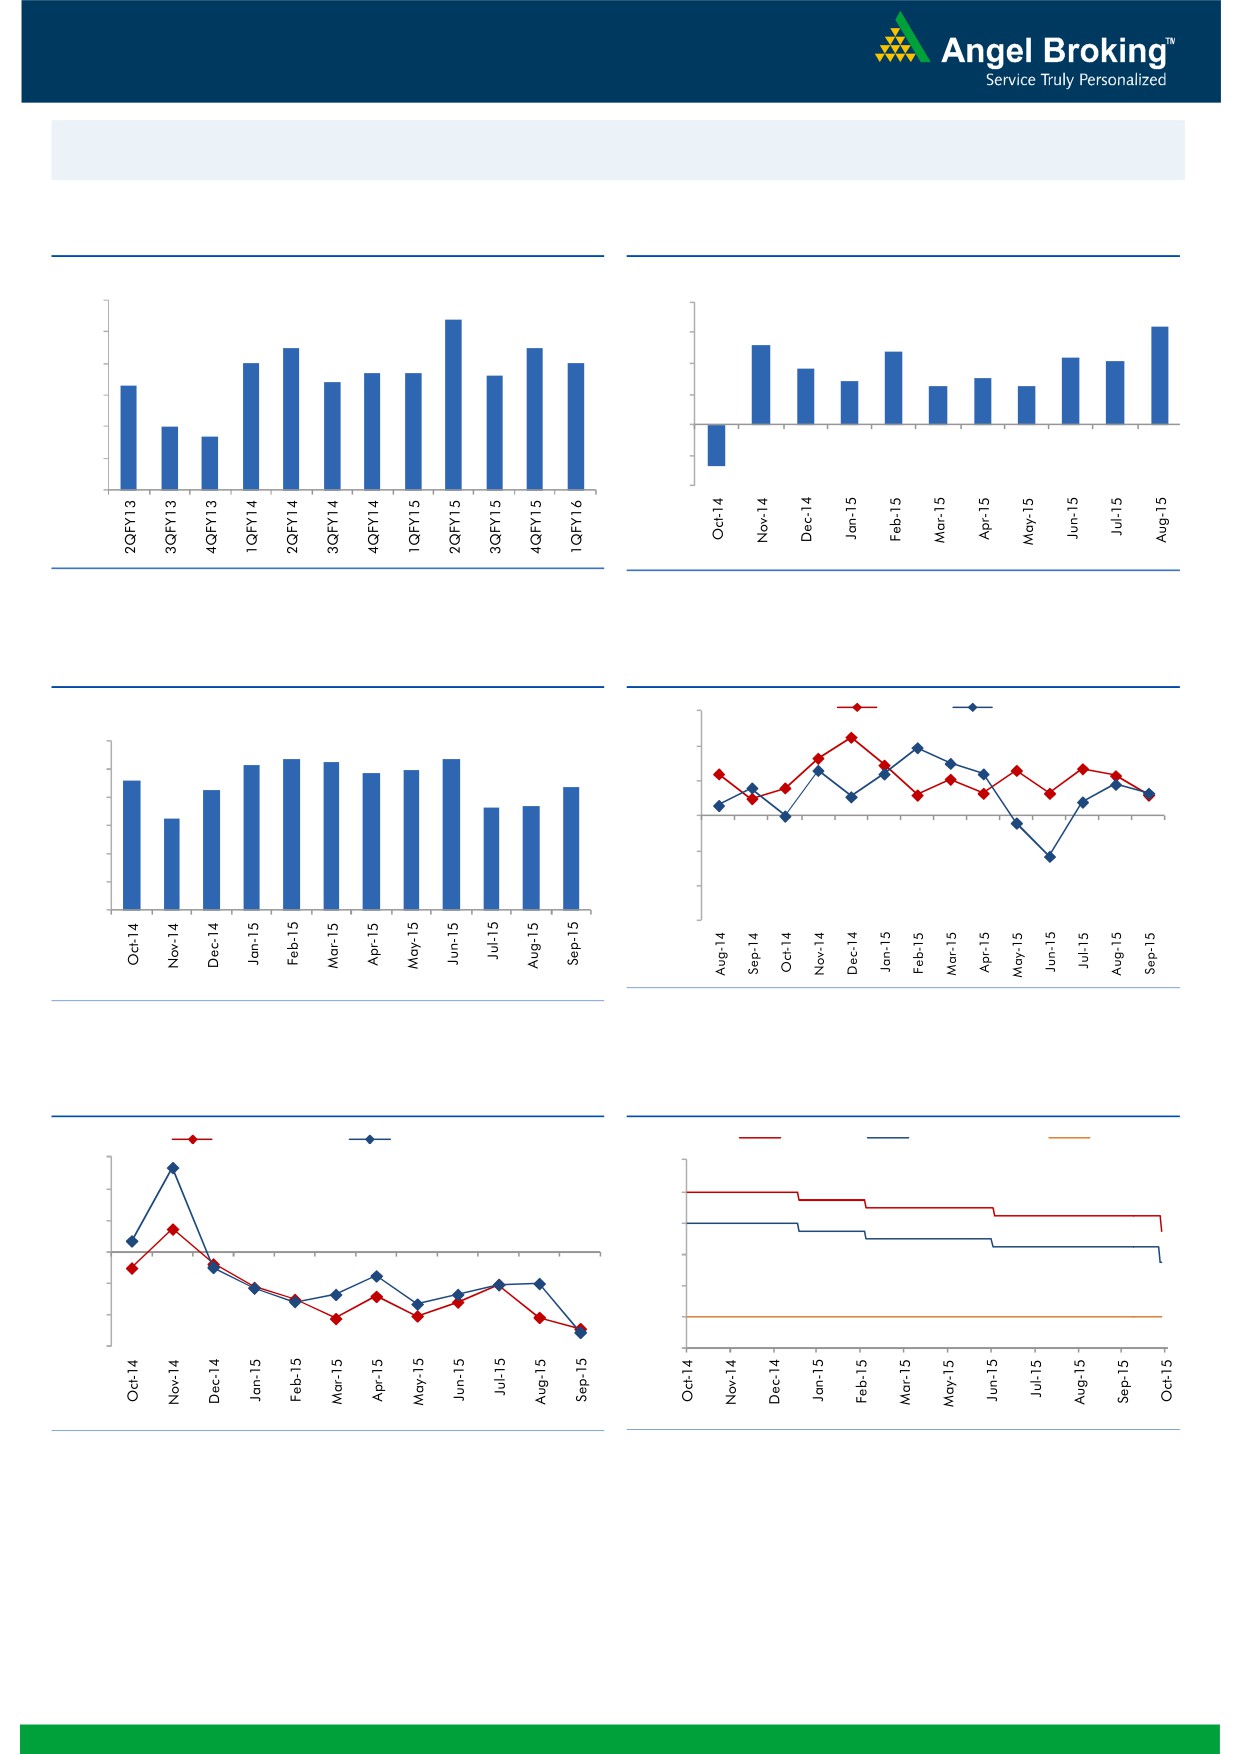
Macro watch
Exhibit 1: Quarterly GDP trends
Exhibit 2: IIP trends
(%)
(%)
9.0
8.4
8.0
6.4
7.5
7.5
5.2
8.0
6.0
4.8
7.0
7.0
4.4
4.1
6.7
6.7
6.6
3.6
7.0
6.4
4.0
2.8
3.0
6.3
2.5
2.5
6.0
2.0
5.0
4.7
5.0
-
4.0
(2.0)
3.0
(4.0)
(2.7)
Source: CSO, Angel Research
Source: MOSPI, Angel Research
Exhibit 3: Monthly CPI inflation trends
Exhibit 4: Manufacturing and services PMI
(%)
56.0
Mfg. PMI
Services PMI
6.0
5.4
5.3
5.4
54.0
5.2
5.0
4.9
4.6
5.0
4.3
4.4
52.0
3.7
3.7
4.0
3.3
50.0
3.0
2.0
48.0
1.0
46.0
-
44.0
Source: Market, Angel Research; Note: Level above 50 indicates expansion
Source: MOSPI, Angel Research
Exhibit 5: Exports and imports growth trends
Exhibit 6: Key policy rates
(%)
Exports yoy growth
Imports yoy growth
(%)
Repo rate
Reverse Repo rate
CRR
30.0
9.00
20.0
8.00
10.0
7.00
0.0
6.00
(10.0)
5.00
(20.0)
4.00
(30.0)
3.00
Source: Bloomberg, Angel Research
Source: RBI, Angel Research
Market Outlook
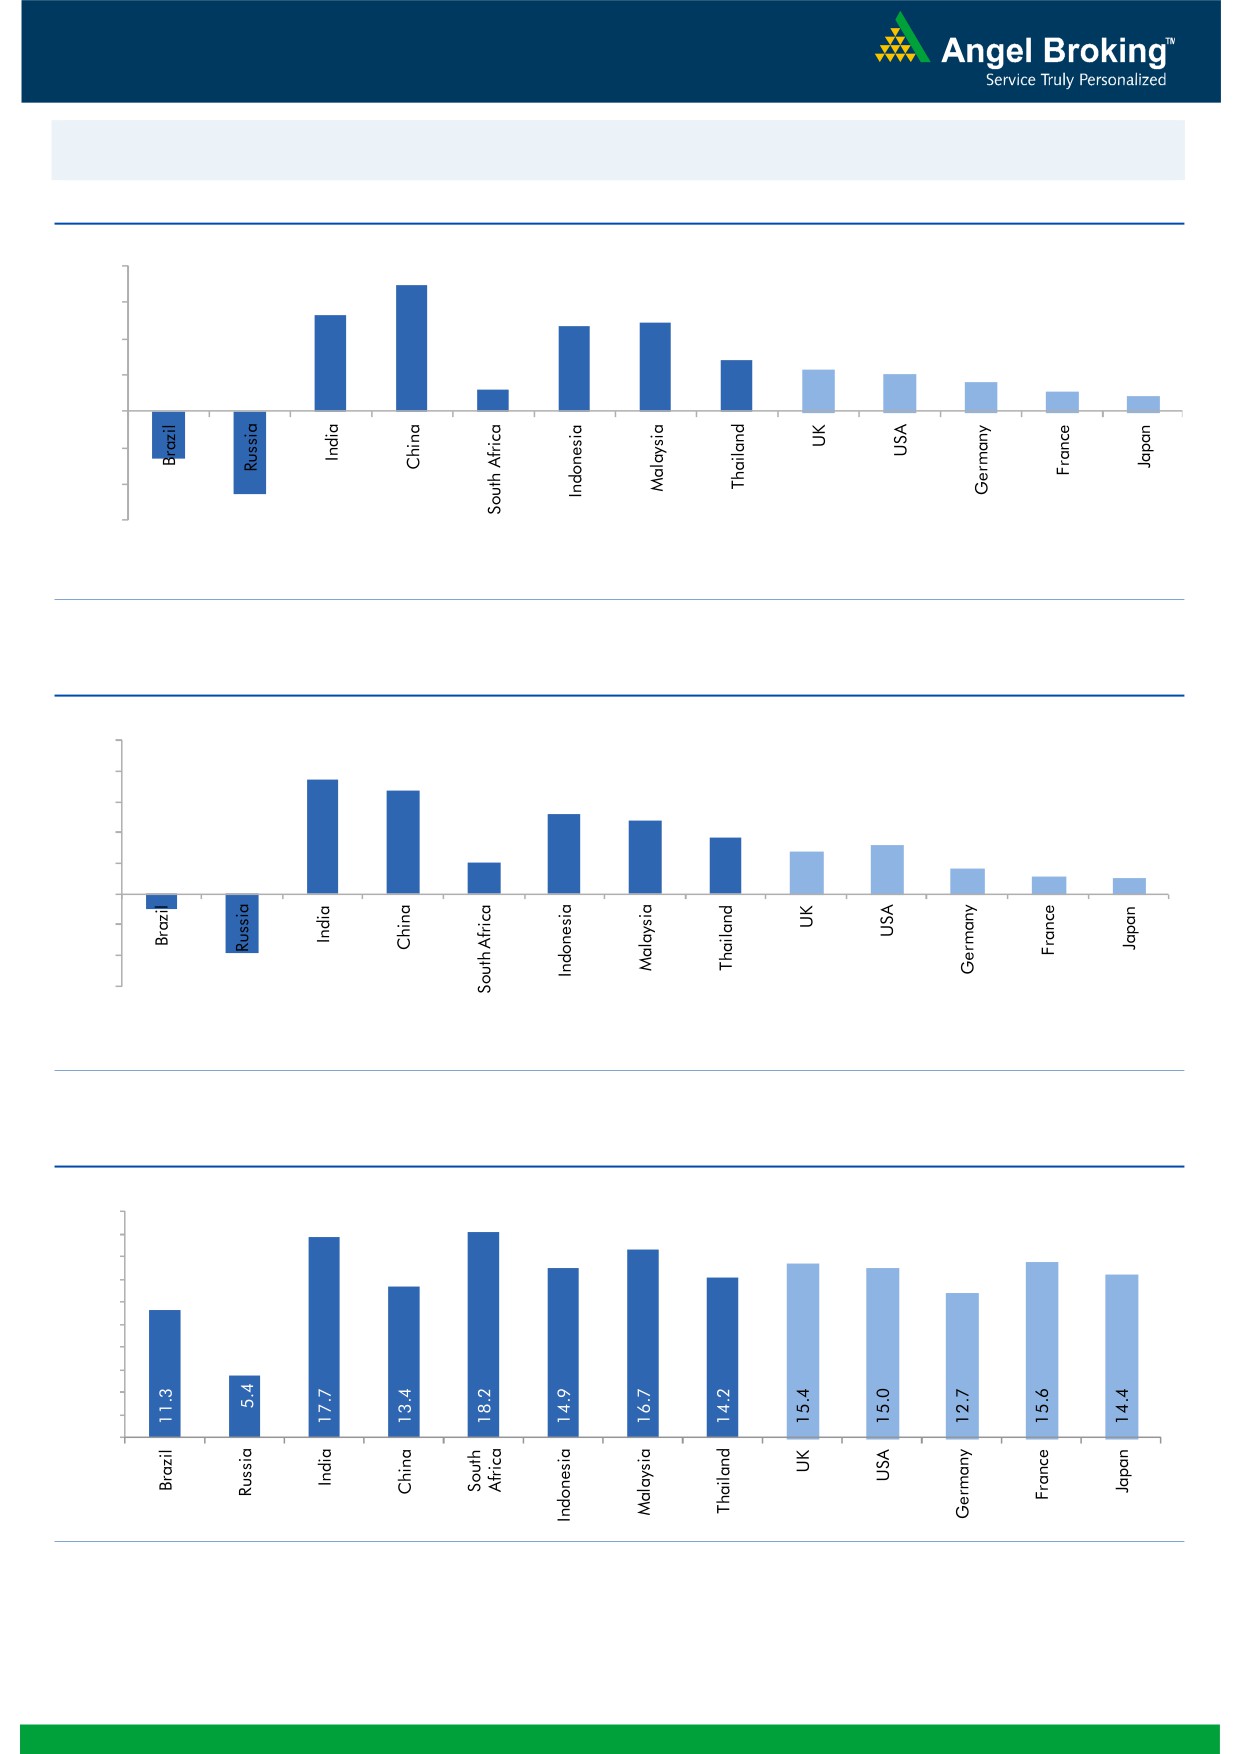
November 02, 2015
Global watch
Exhibit 1: Latest quarterly GDP Growth (%, yoy) across select developing and developed countries
(%)
8.0
6.9
6.0
5.3
4.9
4.7
4.0
2.8
2.3
2.0
1.6
2.0
1.2
1.1
0.8
(2.6)
-
(2.0)
(4.0)
(4.6)
(6.0)
Source: Bloomberg, Angel Research
Exhibit 2: 2015 GDP Growth projection by IMF (%, yoy) across select developing and developed countries
(%)
10.0
7.5
8.0
6.8
5.2
6.0
4.8
3.7
3.1
4.0
2.7
2.0
1.6
1.2
1.0
2.0
-
(2.0)
(4.0)
(1.0)
(3.8)
(6.0)
Source: IMF, Angel Research
Exhibit 3: One year forward P-E ratio across select developing and developed countries
(x)
20.0
18.0
16.0
14.0
12.0
10.0
8.0
6.0
4.0
2.0
-
Source: IMF, Angel Research
Market Outlook
November 02, 2015
Exhibit 4: Relative performance of indices across globe
Returns (%)
Country
Name of index
Closing price
1M
3M
1YR
Brazil
Bovespa
45,869
(2.5)
(6.2)
(16.0)
Russia
Micex
1,712
2.9
7.3
15.0
India
Nifty
8,066
1.5
(4.2)
(3.1)
China
Shanghai Composite
3,383
10.8
(8.7)
39.8
South Africa
Top 40
48,317
5.8
3.1
8.9
Mexico
Mexbol
44,543
4.2
(0.5)
(1.1)
Indonesia
LQ45
760
8.3
(4.5)
(12.5)
Malaysia
KLCI
1,666
2.3
(1.1)
(10.2)
Thailand
SET 50
900
3.6
(4.1)
(14.6)
USA
Dow Jones
17,664
7.2
(1.4)
1.6
UK
FTSE
6,361
3.8
(4.2)
(2.8)
Japan
Nikkei
19,083
7.7
(10.7)
16.3
Germany
DAX
10,850
13.6
(7.5)
16.3
France
CAC
4,898
9.8
(5.0)
15.7
Source: Bloomberg, Angel Research
Stock Watch
November 02, 2015
Company Name
Reco
CMP
Target
Mkt Cap
Sales ( Čcr )
OPM(%)
EPS (Č)
PER(x)
P/BV(x)
RoE(%)
EV/Sales(x)
(Č)
Price ( Č)
( Č cr )
FY16E FY17E
FY16E
FY17E
FY16E
FY17E
FY16E
FY17E
FY16E
FY17E
FY16E
FY17E
FY16E
FY17E
Agri / Agri Chemical
Rallis
Neutral
207
-
4,017
2,075
2,394
14.4
14.4
9.5
11.0
21.7
18.8
4.3
3.7
21.1
21.3
2.0
1.7
United Phosphorus
Accumulate
461
510
19,754
13,698
15,752
17.6
17.6
32.1
38.5
14.4
12.0
2.8
2.3
21.4
21.3
1.5
1.3
Auto & Auto Ancillary
Ashok Leyland
Buy
94
111
26,652
18,763
22,357
11.1
11.2
3.6
4.8
26.0
19.5
4.8
4.4
18.7
22.6
1.4
1.1
Bajaj Auto
Neutral
2,550
-
73,777
24,115
27,600
21.3
21.0
136.8
157.2
18.6
16.2
6.0
5.1
32.2
31.5
2.6
2.3
Eicher Motors
Buy
17,762
22,859
48,210
11,681
15,550
15.3
16.9
358.5
564.3
49.6
31.5
14.9
11.1
29.8
34.9
4.0
3.0
Hero Motocorp
Neutral
2,585
-
51,619
28,561
31,559
14.7
14.7
151.1
163.2
17.1
15.8
6.6
5.6
38.7
35.6
1.6
1.5
L G Balakrishnan & Bros Neutral
464
-
729
1,254
1,394
11.6
11.8
35.9
41.7
12.9
11.2
1.8
1.5
13.5
13.8
0.7
0.6
Mahindra and Mahindra Accumulate
1,183
1,357
73,444
37,986
42,660
12.8
13.2
51.6
61.9
22.9
19.1
3.4
3.0
14.6
15.6
1.6
1.3
Maruti
Accumulate
4,449
4,960
134,385
57,865
68,104
16.4
16.7
176.3
225.5
25.2
19.7
4.9
4.2
19.4
21.2
2.1
1.7
Minda Industries
Buy
521
652
827
2,567
2,965
7.3
8.0
38.8
54.3
13.4
9.6
1.9
1.6
14.4
16.8
0.4
0.4
Rane Brake Lining
Accumulate
322
366
255
454
511
11.1
11.4
23.8
28.1
13.5
11.4
1.9
1.7
14.2
15.3
0.7
0.6
Setco Automotive
Neutral
227
-
607
594
741
12.7
13.7
8.4
15.8
27.1
14.4
2.8
2.4
10.4
16.9
1.5
1.2
Tata Motors
Accumulate
384
424
110,999
264,038
297,882
13.8
13.9
34.5
38.9
11.1
9.9
1.9
1.6
17.6
16.8
0.6
0.6
TVS Motor
Accumulate
265
296
12,609
11,845
14,040
7.2
9.0
10.4
17.4
25.5
15.3
6.4
4.9
25.1
32.0
1.0
0.9
Amara Raja Batteries
Buy
903
1,040
15,427
4,892
5,871
17.4
17.6
28.8
37.1
31.4
24.3
7.3
5.9
23.4
24.1
3.1
2.5
Exide Industries
Accumulate
150
162
12,737
6,950
7,784
14.4
14.8
6.6
7.3
22.7
20.5
2.9
2.6
12.6
12.8
1.6
1.4
Apollo Tyres
Neutral
171
-
8,707
12,576
12,978
16.8
16.1
22.3
19.9
7.7
8.6
1.3
1.2
17.2
13.4
0.8
0.8
Ceat
Neutral
1,082
-
4,376
6,041
6,597
14.1
13.7
99.5
111.9
10.9
9.7
2.1
1.8
19.6
18.5
0.9
0.8
JK Tyres
Neutral
101
-
2,300
7,446
7,669
15.2
14.0
19.6
18.4
5.2
5.5
1.3
1.1
25.2
19.5
0.7
0.6
Swaraj Engines
Neutral
937
-
1,164
552
630
14.2
14.7
44.6
54.1
21.0
17.3
4.9
4.4
23.2
25.6
2.0
1.7
Subros
Neutral
89
-
534
1,268
1,488
11.6
11.9
3.7
6.6
24.1
13.5
1.6
1.5
6.8
11.4
0.7
0.6
Indag Rubber
Neutral
195
-
511
283
329
17.0
17.2
13.0
15.4
15.0
12.6
3.3
2.7
21.8
21.6
1.5
1.3
Capital Goods
ACE
Neutral
42
-
419
660
839
4.7
8.2
1.0
3.9
42.4
10.9
1.3
1.2
3.2
11.3
0.8
0.6
BEML
Neutral
1,167
-
4,859
3,277
4,006
6.0
8.9
29.2
64.3
40.0
18.2
2.2
2.0
5.7
11.7
1.6
1.2
BGR Energy
Neutral
110
-
790
3,615
3,181
9.5
9.4
16.7
12.4
6.6
8.8
0.6
0.6
10.0
7.0
0.6
0.8
BHEL
Neutral
199
-
48,671
33,722
35,272
10.8
11.7
10.5
14.2
18.9
14.0
1.4
1.3
7.0
9.0
1.5
1.5
Blue Star
Neutral
389
-
3,499
3,649
4,209
5.0
5.9
9.2
14.7
42.5
26.4
7.7
7.2
9.1
17.5
1.1
0.9
Crompton Greaves
Buy
174
204
10,902
13,484
14,687
4.9
6.2
4.5
7.1
38.7
24.5
2.7
2.6
7.2
10.8
0.9
0.9
Inox Wind
Buy
398
505
8,829
4,980
5,943
17.0
17.5
26.6
31.6
15.0
12.6
4.5
3.3
35.0
30.0
1.9
1.6
Stock Watch
November 02, 2015
Company Name
Reco
CMP
Target
Mkt Cap
Sales ( Čcr )
OPM(%)
EPS (Č)
PER(x)
P/BV(x)
RoE(%)
EV/Sales(x)
(Č)
Price ( Č)
( Č cr )
FY16E
FY17E
FY16E
FY17E
FY16E
FY17E
FY16E
FY17E
FY16E
FY17E
FY16E
FY17E
FY16E
FY17E
Capital Goods
KEC International
Neutral
134
-
3,449
8,791
9,716
6.1
6.8
5.4
8.2
24.8
16.4
2.5
2.3
10.0
14.0
0.6
0.6
Thermax
Neutral
848
-
10,104
6,413
7,525
7.4
8.5
30.5
39.3
27.8
21.6
4.3
3.7
15.0
17.0
1.6
1.3
Cement
ACC
Buy
1,376
1,630
25,836
13,151
14,757
16.4
18.3
63.9
83.4
21.5
16.5
2.8
2.5
13.3
16.1
1.8
1.5
Ambuja Cements
Accumulate
207
233
32,171
11,564
12,556
19.4
20.7
8.9
10.1
23.3
20.5
2.9
2.8
12.8
13.8
2.4
2.2
India Cements
Buy
78
112
2,405
4,716
5,133
15.9
16.9
3.7
7.5
21.2
10.4
0.8
0.7
3.8
7.3
0.8
0.7
JK Cement
Accumulate
678
767
4,738
4,056
4,748
14.5
17.0
22.6
41.1
30.0
16.5
2.7
2.4
9.3
15.3
1.6
1.3
J K Lakshmi Cement
Buy
372
430
4,376
2,947
3,616
16.7
19.9
11.5
27.2
32.3
13.7
3.1
2.7
9.8
20.8
1.9
1.5
Mangalam Cements
Neutral
227
-
607
1,053
1,347
10.5
13.3
8.4
26.0
27.1
8.7
1.1
1.1
4.3
12.5
1.0
0.7
Orient Cement
Accumulate
164
183
3,353
1,854
2,524
21.2
22.2
7.7
11.1
21.3
14.7
3.1
2.6
13.3
15.7
2.5
1.8
Ramco Cements
Neutral
362
-
8,612
4,036
4,545
20.8
21.3
15.1
18.8
24.0
19.2
2.9
2.6
12.9
14.3
2.6
2.3
Shree Cement^
Neutral
12,328
-
42,948
7,150
8,742
26.7
28.6
228.0
345.5
54.1
35.7
8.0
6.7
15.7
20.3
5.8
4.6
UltraTech Cement
Accumulate
2,884
3,282
79,132
25,021
30,023
19.1
21.6
89.0
132.0
32.4
21.9
3.8
3.3
12.2
15.9
3.2
2.7
Construction
ITNL
Neutral
94
-
3,084
7,360
8,825
34.0
35.9
1.0
5.0
93.8
18.8
0.4
0.4
0.3
1.4
3.9
3.7
KNR Constructions
Neutral
581
-
1,633
915
1,479
14.3
13.9
20.3
37.2
28.6
15.6
2.6
2.3
9.6
15.6
1.9
1.2
Larsen & Toubro
Buy
1,411
1,646
131,330
64,148
73,241
11.5
11.7
62.0
66.0
22.8
21.4
2.3
2.1
13.4
14.0
2.2
2.0
Gujarat Pipavav Port
Neutral
161
-
7,786
629
684
51.0
52.2
6.4
5.9
25.2
27.3
3.3
3.0
15.9
12.7
12.0
10.9
MBL Infrastructures
Buy
209
285
866
2,313
2,797
12.2
14.6
19.0
20.0
11.0
10.5
1.1
1.1
11.3
10.6
1.1
1.0
Nagarjuna Const.
Neutral
81
-
4,475
7,892
8,842
8.3
9.1
2.4
5.3
33.5
15.2
1.3
1.3
4.2
8.6
0.8
0.7
PNC Infratech
Neutral
513
-
2,631
1,798
2,132
13.2
13.5
22.0
30.0
23.3
17.1
2.1
1.9
11.5
11.4
1.6
1.3
Simplex Infra
Neutral
324
-
1,605
6,241
7,008
10.4
10.7
20.0
36.0
16.2
9.0
1.3
1.2
6.8
11.1
0.8
0.7
Financials
Allahabad Bank
Neutral
75
-
4,504
8,332
9,259
2.8
2.8
21.0
25.6
3.6
2.9
0.4
0.3
9.8
10.9
-
-
Axis Bank
Buy
475
630
112,936
26,473
31,527
3.5
3.6
35.7
43.5
13.3
10.9
2.6
2.2
17.9
18.9
-
-
Bank of Baroda
Neutral
160
-
36,936
19,105
21,474
2.0
2.0
19.1
24.8
8.4
6.5
0.9
0.8
10.2
12.1
-
-
Bank of India
Neutral
132
-
10,422
15,972
17,271
1.9
2.0
15.3
33.4
8.6
4.0
0.4
0.3
3.6
7.6
-
-
Canara Bank
Neutral
277
-
15,044
15,251
16,725
2.0
2.0
59.3
68.6
4.7
4.0
0.5
0.5
10.1
10.7
-
-
Dena Bank
Neutral
42
-
2,357
3,440
3,840
2.1
2.3
7.3
10.0
5.8
4.2
0.4
0.4
6.1
7.9
-
-
Federal Bank
Neutral
54
-
9,329
3,477
3,999
3.0
3.0
5.0
6.2
10.8
8.7
1.1
1.0
10.6
11.9
-
-
HDFC
Neutral
1,257
-
198,346
10,358
11,852
3.3
3.3
41.1
47.0
30.6
26.7
5.8
5.3
24.7
24.9
-
-
HDFC Bank
Buy
1,097
1,262
276,258
38,309
47,302
4.3
4.3
49.3
61.1
22.2
18.0
3.8
3.3
18.5
19.7
-
-
Stock Watch
November 02, 2015
Company Name
Reco
CMP
Target
Mkt Cap
Sales ( Čcr )
OPM(%)
EPS (Č)
PER(x)
P/BV(x)
RoE(%)
EV/Sales(x)
(Č)
Price ( Č)
( Č cr )
FY16E
FY17E
FY16E
FY17E
FY16E
FY17E
FY16E
FY17E
FY16E
FY17E
FY16E
FY17E
FY16E
FY17E
Financials
ICICI Bank
Buy
277
348
160,873
35,168
40,517
3.4
3.4
21.4
25.2
13.0
11.0
2.2
1.9
14.7
15.2
-
-
IDBI Bank
Neutral
86
-
13,778
9,625
10,455
1.8
1.8
8.5
14.2
10.1
6.0
0.6
0.6
5.9
9.3
-
-
Indian Bank
Neutral
125
-
6,008
6,160
6,858
2.5
2.5
24.5
29.8
5.1
4.2
0.4
0.4
7.7
8.6
-
-
LIC Housing Finance
Buy
480
571
24,229
3,101
3,745
2.5
2.5
33.0
40.2
14.6
12.0
2.7
2.3
19.7
20.5
-
-
Oriental Bank
Neutral
135
-
4,045
7,643
8,373
2.4
2.4
37.2
45.4
3.6
3.0
0.3
0.3
8.2
9.4
-
-
Punjab Natl.Bank
Neutral
128
-
25,213
23,638
26,557
2.8
2.8
17.9
27.2
7.2
4.7
0.7
0.6
8.5
12.0
-
-
South Ind.Bank
Neutral
21
-
2,768
1,965
2,185
2.5
2.5
2.5
3.3
8.2
6.2
0.8
0.7
9.5
11.7
-
-
St Bk of India
Buy
237
295
184,133
82,520
93,299
2.7
2.8
20.0
24.5
11.8
9.7
1.3
1.1
11.5
12.8
-
-
Union Bank
Neutral
157
-
10,793
12,646
14,129
2.3
2.4
31.0
39.1
5.1
4.0
0.5
0.5
9.8
11.4
-
-
Vijaya Bank
Neutral
37
-
3,157
3,536
3,827
1.9
1.9
5.5
6.7
6.7
5.5
0.6
0.5
7.8
8.8
-
-
Yes Bank
Buy
759
914
31,789
7,228
9,043
3.2
3.3
57.7
69.4
13.2
10.9
2.3
2.0
19.1
19.6
-
-
FMCG
Asian Paints
Neutral
829
-
79,489
16,553
19,160
16.0
16.2
17.7
21.5
46.9
38.5
12.4
11.2
29.4
31.2
4.6
4.0
Britannia
Neutral
3,227
-
38,717
8,065
9,395
9.6
10.2
47.2
65.5
68.4
49.3
22.7
21.5
38.3
41.2
4.7
4.0
Colgate
Neutral
956
-
26,011
4,836
5,490
19.5
19.7
48.5
53.2
19.7
18.0
14.5
12.6
99.8
97.5
5.3
4.6
Dabur India
Neutral
270
-
47,469
9,370
10,265
17.1
17.2
7.3
8.1
36.8
33.4
11.1
9.0
33.7
30.6
5.0
4.5
GlaxoSmith Con*
Neutral
5,976
-
25,133
4,919
5,742
17.2
17.4
168.3
191.2
35.5
31.3
10.1
8.6
28.8
28.9
4.7
4.0
Godrej Consumer
Neutral
1,264
-
43,040
10,168
12,886
16.1
16.1
32.1
38.4
39.4
32.9
8.0
7.4
19.7
21.0
4.3
3.4
HUL
Neutral
802
-
173,510
34,940
38,957
17.5
17.7
20.8
24.7
38.6
32.5
42.9
34.3
110.5
114.2
4.8
4.3
ITC
Buy
335
409
268,647
41,068
45,068
37.8
37.4
13.9
15.9
24.1
21.1
8.1
7.1
34.1
33.8
6.2
5.6
Marico
Neutral
387
-
24,978
6,551
7,766
15.7
16.0
10.4
12.5
37.3
31.0
10.8
9.0
33.2
32.4
3.7
3.2
Nestle*
Accumulate
6,180
6,646
59,580
11,291
12,847
22.2
22.3
158.9
184.6
38.9
33.5
20.3
18.3
55.0
57.3
5.1
4.5
Tata Global
Accumulate
133
144
8,394
8,635
9,072
9.8
9.9
6.5
7.6
20.5
17.5
2.0
2.0
6.8
7.4
0.9
0.9
IT
HCL Tech^
Buy
870
1,132
122,277
42,038
47,503
23.2
23.5
55.8
62.9
15.6
13.8
3.6
2.7
23.0
19.8
2.5
2.0
Infosys
Accumulate
1,136
1,306
260,944
60,250
66,999
28.0
28.0
58.3
63.7
19.5
17.8
4.1
3.5
20.9
19.7
3.6
3.1
TCS
Buy
2,497
3,165
492,075
111,274
126,852
28.4
28.7
125.4
143.9
19.9
17.4
7.9
7.3
39.9
42.2
4.0
3.5
Tech Mahindra
Buy
539
646
51,849
25,566
28,890
16.0
17.0
26.3
31.9
20.5
16.9
3.7
3.1
17.9
18.6
1.8
1.5
Wipro
Buy
573
719
141,599
52,414
58,704
23.7
23.8
38.4
42.3
14.9
13.6
2.9
2.6
19.5
18.0
2.3
1.9
Media
D B Corp
Accumulate
325
356
5,961
2,241
2,495
27.8
27.9
21.8
25.6
14.9
12.7
3.9
3.4
26.7
28.5
2.6
2.3
HT Media
Neutral
83
-
1,933
2,495
2,603
11.2
11.2
7.3
8.6
11.4
9.7
0.9
0.8
7.4
8.1
0.3
0.3
Stock Watch
November 02, 2015
Company Name
Reco
CMP
Target
Mkt Cap
Sales ( Čcr )
OPM(%)
EPS (Č)
PER(x)
P/BV(x)
RoE(%)
EV/Sales(x)
(Č)
Price ( Č)
( Č cr )
FY16E FY17E
FY16E
FY17E
FY16E
FY17E
FY16E
FY17E
FY16E
FY17E
FY16E
FY17E
FY16E
FY17E
Media
Jagran Prakashan
Buy
140
164
4,569
2,170
2,355
27.0
27.6
12.8
10.3
10.9
13.6
3.0
2.9
21.8
19.4
1.9
1.6
Sun TV Network
Neutral
396
-
15,594
2,779
3,196
70.2
70.5
22.8
27.3
17.4
14.5
4.3
3.9
26.7
28.3
5.4
4.6
Hindustan Media
Neutral
270
-
1,985
920
1,031
20.0
20.0
19.2
20.9
14.1
13.0
2.3
2.0
16.4
15.3
1.7
1.5
Ventures
Metals & Mining
Coal India
Buy
320
400
202,060
77,508
85,330
21.4
23.7
24.8
27.6
12.9
11.6
5.0
4.7
38.6
41.6
1.9
1.7
Hind. Zinc
Accumulate
157
175
66,316
14,641
14,026
50.4
50.4
17.7
16.0
8.9
9.8
1.4
1.2
16.2
13.2
2.1
2.0
Hindalco
Neutral
84
-
17,356
104,356
111,186
8.7
9.5
6.7
11.1
12.5
7.6
0.5
0.4
3.5
5.9
0.7
0.6
JSW Steel
Neutral
912
-
22,038
42,308
45,147
16.4
20.7
(10.3)
49.5
18.4
1.0
1.0
(1.0)
5.6
1.6
1.5
NMDC
Neutral
100
-
39,627
8,237
10,893
46.6
44.5
10.0
11.7
10.1
8.6
1.1
1.0
12.5
13.0
4.6
3.5
SAIL
Neutral
53
-
22,034
45,915
53,954
7.2
10.5
1.5
4.4
35.4
12.2
0.5
0.5
2.3
4.1
1.1
1.0
Vedanta
Neutral
100
-
29,647
71,445
81,910
26.2
26.3
12.9
19.2
7.8
5.2
0.5
0.5
7.2
8.9
0.9
0.7
Tata Steel
Neutral
247
-
23,965
126,760
137,307
8.9
11.3
6.4
23.1
38.8
10.7
0.8
0.8
2.0
7.1
0.8
0.7
Oil & Gas
Cairn India
Neutral
154
-
28,798
11,323
12,490
49.4
51.0
20.7
20.7
7.4
7.4
0.5
0.5
6.4
6.1
1.6
1.0
GAIL
Neutral
309
-
39,158
64,856
70,933
9.1
9.6
24.0
28.9
12.9
10.7
1.1
1.0
8.8
9.6
0.8
0.7
ONGC
Neutral
248
-
212,048
154,564
167,321
36.8
37.4
28.6
32.5
8.7
7.6
1.1
1.0
12.7
13.5
1.6
1.5
Petronet LNG
Accumulate
193
210
14,498
29,691
31,188
5.8
6.2
12.8
13.4
15.1
14.4
2.3
2.0
15.8
14.8
0.6
0.5
Indian Oil Corp
Accumulate
399
455
96,900
359,607
402,760
5.9
6.1
42.5
48.7
9.4
8.2
1.3
1.1
14.1
14.4
0.4
0.3
Reliance Industries
Accumulate
948
1,050
306,954
304,775
344,392
12.6
13.4
91.3
102.6
10.4
9.2
1.2
1.1
11.8
12.0
0.9
0.8
Pharmaceuticals
Alembic Pharma
Neutral
678
-
12,789
2,601
3,115
21.2
20.2
20.8
23.9
32.6
28.4
10.5
7.9
37.2
31.8
4.9
4.1
Aurobindo Pharma
Neutral
835
-
48,755
14,923
17,162
23.0
23.0
38.2
43.6
21.9
19.2
6.7
5.1
36.0
30.2
3.6
3.1
Aventis*
Neutral
4,545
-
10,467
2,082
2,371
17.4
20.8
118.2
151.5
38.5
30.0
5.6
4.5
19.9
25.5
4.7
3.9
Cadila Healthcare
Neutral
416
-
42,629
10,224
11,840
21.0
22.0
14.6
17.6
28.5
23.7
7.8
6.1
30.8
29.0
4.2
3.6
Cipla
Neutral
690
-
55,402
14,359
16,884
21.3
19.7
28.4
30.5
24.3
22.6
4.3
3.7
19.3
17.5
3.8
3.2
Dr Reddy's
Neutral
4,270
-
72,802
18,213
21,214
22.6
22.7
163.0
192.5
26.2
22.2
5.4
4.4
22.5
20.0
4.0
3.3
Dishman Pharma
Neutral
362
-
2,921
1,716
1,888
20.2
20.2
16.3
21.6
22.2
16.8
2.1
1.9
9.7
11.7
1.9
1.6
GSK Pharma*
Neutral
3,295
-
27,908
2,870
3,158
20.0
22.1
59.5
68.3
55.4
48.2
16.3
16.8
28.5
34.3
9.2
8.4
Indoco Remedies
Neutral
326
-
3,000
1,088
1,262
18.2
18.2
13.1
15.5
24.9
21.0
4.9
4.1
21.2
21.1
2.8
2.4
Ipca labs
Buy
782
900
9,864
3,363
3,909
12.9
18.6
13.4
28.0
58.3
27.9
7.6
6.1
7.4
14.0
3.2
2.8
Lupin
Neutral
1,926
-
86,712
14,864
17,244
26.9
26.9
62.1
71.1
31.0
27.1
7.5
6.0
27.4
24.6
5.6
4.7
Sun Pharma
Accumulate
889
950
213,932
28,163
32,610
25.8
30.7
17.4
26.9
51.1
33.1
4.8
4.2
13.0
16.6
7.1
5.9
Stock Watch
November 02, 2015
Company Name
Reco
CMP
Target
Mkt Cap
Sales ( Čcr )
OPM(%)
EPS (Č)
PER(x)
P/BV(x)
RoE(%)
EV/Sales(x)
(Č)
Price ( Č)
( Č cr )
FY16E FY17E
FY16E
FY17E
FY16E
FY17E
FY16E
FY17E
FY16E
FY17E
FY16E
FY17E
FY16E
FY17E
Power
Tata Power
Neutral
69
-
18,635
35,923
37,402
22.6
22.8
4.1
5.2
17.0
13.4
1.3
1.2
7.5
9.3
1.5
1.4
NTPC
Buy
133
157
109,417
87,064
98,846
23.5
23.5
11.7
13.2
11.3
10.1
1.3
1.2
11.4
12.1
2.3
2.0
Power Grid
Buy
129
170
67,357
20,702
23,361
86.7
86.4
12.1
13.2
10.7
9.8
1.6
1.4
15.6
15.1
8.2
7.6
Telecom
Bharti Airtel
Neutral
349
-
139,409
101,748
109,191
32.1
31.7
12.0
12.5
29.1
27.9
2.0
1.9
6.9
6.7
2.0
1.8
Idea Cellular
Neutral
140
-
50,305
34,282
36,941
32.0
31.5
5.9
6.2
23.7
22.5
2.2
2.0
9.9
9.3
2.0
1.9
zOthers
Abbott India
Neutral
5,570
-
11,835
2,715
3,153
14.5
14.1
134.3
152.2
41.5
36.6
10.4
8.5
27.4
25.6
4.1
3.4
Bajaj Electricals
Buy
246
341
2,481
4,719
5,287
5.2
5.8
8.6
12.7
28.7
19.4
3.3
2.9
11.4
14.8
0.5
0.5
Finolex Cables
Neutral
251
-
3,837
2,728
3,036
10.8
11.0
14.4
16.8
17.4
15.0
2.7
2.3
15.2
15.3
1.2
1.0
Goodyear India*
Buy
560
655
1,291
1,953
1,766
12.4
12.0
67.4
59.6
8.3
9.4
2.1
1.8
27.7
20.2
0.4
0.4
Hitachi
Neutral
1,345
-
3,657
1,779
2,081
7.8
8.8
21.8
33.4
61.7
40.2
10.0
8.1
17.4
22.1
2.1
1.8
Jyothy Laboratories
Neutral
308
-
5,581
1,620
1,847
11.5
11.5
7.3
8.5
42.3
36.4
5.5
5.1
13.3
14.4
3.3
2.8
MRF
Accumulate
39,692
45,575
16,834
20,316
14,488
21.4
21.1
5,488.0
3,798.0
7.2
10.5
2.5
2.0
41.1
21.2
0.8
1.0
Page Industries
Neutral
14,066
-
15,689
1,929
2,450
19.8
20.1
229.9
299.0
61.2
47.1
27.0
18.8
52.1
47.1
8.2
6.4
Relaxo Footwears
Neutral
524
-
6,288
1,767
2,152
12.3
12.5
19.3
25.1
27.2
20.9
6.7
5.1
27.7
27.8
3.6
2.9
Siyaram Silk Mills
Buy
933
1,145
875
1,636
1,815
11.5
11.5
89.9
104.1
10.4
9.0
1.7
1.5
17.9
17.8
0.7
0.6
Styrolution ABS India*
Neutral
790
-
1,390
1,271
1,440
8.6
9.2
32.0
41.1
24.7
19.3
2.5
2.3
10.7
12.4
1.1
0.9
Tree House
Buy
276
347
1,166
259
324
56.8
56.8
17.0
21.7
16.2
12.7
1.6
1.5
10.1
11.5
4.4
3.7
TVS Srichakra
Accumulate
2,902
3,210
2,222
2,127
2,388
15.2
14.9
237.7
267.5
12.2
10.9
5.2
3.7
51.7
39.8
1.1
0.9
HSIL
Accumulate
279
302
2,017
2,182
2,404
16.3
16.5
15.8
18.9
17.7
14.8
1.4
1.3
8.4
9.4
1.3
1.1
Kirloskar Engines India
Neutral
272
-
3,935
2,634
3,252
10.1
12.0
10.9
17.4
25.0
15.6
2.8
2.5
11.4
16.8
1.1
0.9
Ltd
M M Forgings
Buy
531
670
641
541
634
21.7
21.4
47.8
55.9
11.1
9.5
2.2
1.8
21.8
20.9
1.3
1.1
Banco Products (India)
Neutral
130
-
933
1,208
1,353
11.0
12.3
10.8
14.5
12.1
9.0
1.4
1.2
11.9
14.5
0.7
0.6
Competent Automobiles Neutral
146
-
90
1,007
1,114
3.1
3.1
23.7
28.2
6.2
5.2
0.9
0.8
13.9
14.6
0.1
0.1
Nilkamal
Neutral
997
-
1,487
1,948
2,147
10.6
10.3
60.0
67.0
16.6
14.9
2.6
2.2
16.8
16.1
0.8
0.7
Visaka Industries
Buy
132
166
210
1,158
1,272
8.6
9.5
23.7
32.7
5.6
4.0
0.6
0.5
10.1
12.5
0.4
0.3
Transport Corporation of
Neutral
281
-
2,134
2,830
3,350
8.8
9.0
14.4
18.3
19.5
15.3
3.0
2.6
15.4
17.1
0.9
0.8
India
Elecon Engineering
Neutral
77
-
838
1,452
1,596
14.0
14.7
4.4
6.2
17.4
12.4
1.5
1.3
8.6
11.2
0.9
0.7
Surya Roshni
Buy
134
183
585
2,992
3,223
8.3
8.5
14.7
18.3
9.1
7.3
0.9
0.8
9.7
11.0
0.5
0.4
MT Educare
Buy
137
169
546
286
366
18.3
17.7
7.7
9.4
17.8
14.6
3.7
3.3
20.2
21.1
1.8
1.4
Stock Watch
November 02, 2015
Company Name
Reco
CMP
Target Mkt Cap
Sales ( Čcr )
OPM(%)
EPS (Č)
PER(x)
P/BV(x)
RoE(%)
EV/Sales(x)
(Č)
Price ( Č)
( Č cr )
FY16E FY17E FY16E FY17E FY16E FY17E FY16E FY17E FY16E FY17E FY16E FY17E FY16E FY17E
zOthers
Radico Khaitan
Buy
101
119
1,346
1,565
1,687
11.9
12.4
5.4
6.6
18.7
15.4
1.5
1.4
8.0
9.0
1.4
1.3
Garware Wall Ropes
Accumulate
344
390
752
875
983
10.4
10.6
23.1
27.8
14.9
12.4
2.1
1.8
14.1
14.8
0.9
0.7
Wonderla Holidays
Neutral
324
-
1,833
206
308
44.0
43.6
9.0
12.9
36.0
25.1
4.9
4.5
13.7
17.8
8.8
5.9
Linc Pen & Plastics
Accumulate
163
185
240
340
371
8.3
8.9
10.8
13.2
15.1
12.3
2.4
2.1
16.0
17.1
0.7
0.7
The Byke Hospitality
Accumulate
159
181
636
222
287
20.5
20.5
5.6
7.6
28.1
21.0
5.3
4.4
18.9
20.8
2.9
2.2
Source: Company, Angel Research; Note: *December year end; #September year end; &October year end; Price as on October 30, 2015
Market Outlook
November 02, 2015
Research Team Tel: 022 - 39357800
DISCLAIMER
Angel Broking Private Limited (hereinafter referred to as “Angel”) is a registered Member of National Stock Exchange of India Limited,
Bombay Stock Exchange Limited and Metropolitian Stock Exchange of India Limited. It is also registered as a Depository Participant with
CDSL and Portfolio Manager with SEBI. It also has registration with AMFI as a Mutual Fund Distributor. Angel Broking Private Limited is a
registered entity with SEBI for Research Analyst in terms of SEBI (Research Analyst) Regulations, 2014 vide registration number
INH000000164. Angel or its associates has not been debarred/ suspended by SEBI or any other regulatory authority for accessing
/dealing in securities Market. Angel or its associates including its relatives/analyst do not hold any financial interest/beneficial ownership
of more than 1% in the company covered by Analyst. Angel or its associates/analyst has not received any compensation / managed or co
-managed public offering of securities of the company covered by Analyst during the past twelve months. Angel/analyst has not served as
an officer, director or employee of company covered by Analyst and has not been engaged in market making activity of the company
covered by Analyst.
This document is solely for the personal information of the recipient, and must not be singularly used as the basis of any investment
decision. Nothing in this document should be construed as investment or financial advice. Each recipient of this document should make
such investigations as they deem necessary to arrive at an independent evaluation of an investment in the securities of the companies
referred to in this document (including the merits and risks involved), and should consult their own advisors to determine the merits and
risks of such an investment.
Reports based on technical and derivative analysis center on studying charts of a stock's price movement, outstanding positions and
trading volume, as opposed to focusing on a company's fundamentals and, as such, may not match with a report on a company's
fundamentals.
The information in this document has been printed on the basis of publicly available information, internal data and other reliable sources
believed to be true, but we do not represent that it is accurate or complete and it should not be relied on as such, as this document is for
general guidance only. Angel Broking Pvt. Limited or any of its affiliates/ group companies shall not be in any way responsible for any
loss or damage that may arise to any person from any inadvertent error in the information contained in this report. Angel Broking Pvt.
Limited has not independently verified all the information contained within this document. Accordingly, we cannot testify, nor make any
representation or warranty, express or implied, to the accuracy, contents or data contained within this document. While Angel Broking
Pvt. Limited endeavors to update on a reasonable basis the information discussed in this material, there may be regulatory, compliance,
or other reasons that prevent us from doing so.
This document is being supplied to you solely for your information, and its contents, information or data may not be reproduced,
redistributed or passed on, directly or indirectly.
Neither Angel Broking Pvt. Limited, nor its directors, employees or affiliates shall be liable for any loss or damage that may arise from or
in connection with the use of this information.
Note: Please refer to the important ‘Stock Holding Disclosure' report on the Angel website (Research Section). Also, please refer to the
latest update on respective stocks for the disclosure status in respect of those stocks. Angel Broking Pvt. Limited and its affiliates may have
investment positions in the stocks recommended in this report.