Market Outlook
September 2, 2015
Dealer’s Diary
Domestic Indices
Chg (%)
(Pts)
(Close)
BSE Sensex
(2.2)
(587)
25,696
Indian markets are expected to open flat tracking the SGX Nifty and mixed Asian
cues.
Nifty
(2.3)
(185)
7,786
MID CAP
(2.0)
(211)
10,524
US markets closed negative led by concerns about the Chinese economy after
SMALL CAP
(2.2)
(238)
10,733
China’s official manufacturing PMI fell to a three-year low and the ISM reported an
BSE HC
(1.5)
(264)
17,698
unexpected drop in U.S. manufacturing data.
BSE PSU
(2.7)
(184)
6,731
European markets ended sharply lower as the concerns over China worsened. The
BANKEX
(3.6)
(714)
18,924
weak opening of the U.S. markets and the unexpected drop in U.S. manufacturing
AUTO
(2.6)
(473)
17,392
data also contributed to the sell-off.
METAL
(3.2)
(241)
7,205
Indian markets corrected sharply tracking the weakness in global cues and lower
OIL & GAS
(2.1)
(187)
8,691
than expected domestic GDP growth.
BSE IT
(1.0)
(114)
11,047
Global Indices
Chg (%)
(Pts)
(Close)
News & Result Analysis
Dow Jones
(2.8)
(470)
16,058
Hero Motocorp August 2015 sales decline 14% yoy, marginally below estimates
NASDAQ
(2.9)
(140)
4,636
Coal India misses August output target by 3.8%
Refer detailed news analysis on the following page
FTSE
(3.0)
(189)
6,059
Nikkei
(3.8)
(725)
18,166
Markets Today
Hang Sang
(2.2)
(485)
21,185
The trend deciding level for the day is 25,806 / 7,820 levels. If NIFTY trades above
Straits Times
(1.3)
(39)
2,883
this level during the first half-an-hour of trade then we may witness a further rally up
Shanghai Com
(1.2)
(39)
3,167
to 26,032 - 26,367 / 7,894 - 8,003 levels. However, if NIFTY trades below
25,806 / 7,820 levels for the first half-an-hour of trade then it may correct towards
Indian ADR
Chg (%)
(Pts)
(Close)
25,471 - 25,245 / 7,712 - 7,638 levels.
INFY
(1.7)
(0.3)
$16.9
Indices
S2
S1
PIVOT
R1
R2
WIT
(1.1)
(0.1)
$11.6
SENSEX
25,245
25,471
25,806
26,032
26,367
IBN
(2.4)
(0.2)
$8.5
NIFTY
7,638
7,712
7,820
7,894
8,003
HDB
(2.0)
(1.1)
$55.9
Net Inflows (August 31, 2015)
Advances / Declines
BSE
NSE
` cr
Purch
Sales
Net
MTD
YTD
Advances
584
234
FII
9,731
10,288
(557)
(17,209)
123,760
Declines
2,125
1,289
MFs
1,223
707
516
10,533
70,648
Unchanged
85
50
FII Derivatives (September 01, 2015)
Volumes (` cr)
` cr
Purch
Sales
Net
Open Interest
Index Futures
2,190
2,888
(698)
18,754
BSE
2,526
Stock Futures
2,525
2,717
(192)
43,119
NSE
17,647
Gainers / Losers
Gainer
Loser
Company
Price (`)
chg (%)
Company
Price (`)
chg (%)
ESSAROIL
197
12.7
SUNASIAN
211
(10.0)
BATAINDIA
526
4.6
MRPL
52
(7.2)
PMCFIN
1
4.4
VAKRANGEE
110
(7.0)
UBL
888
3.9
PNB
135
(6.9)
GPPL
178
3.5
JSWENERGY
71
(6.9)
Market Outlook
September 2, 2015
Hero Motocorp August 2015 sales decline 14% yoy, marginally
below estimates
Hero Motocorp reported double digit decline in volumes during the month of
August 2015. Overall sales dipped 14% yoy to 480,537 units. The sales were
marginally below our estimates of 5 lakh units. Poor sentiments in the rural areas
due to deficient rainfall and moderate growth in crop MSP’s impacted the volumes.
Further, the sales were also affected by high base of the corresponding month last
year (last year the festive season had commenced in September leading to
inventory built up in August 2014). The festive season this year is delayed by about
a month and would start in October 2015. Hero expects the sales to pick up from
2HFY2016 with the onset of festivals and low base of the corresponding period.
We currently have Accumulate rating on the stock.
Coal India misses August output target by 3.8%
Coal India recorded an output of 36.21 million tonnes (MT) in August, missing its
production target for the month of 37.65MT by 3.8%. The company has achieved
an output of 192.37MT in the first five months of the current fiscal, missing its
target of 196.73MT. We expect Coal India to achieve a production of 538MT in
FY2016 as against the target of 550MT. The stock has seen a sharp correction
recently led by the share sale overhang. We retain our Accumulate rating on the
stock with a price target of `400.
Economic and Political News
Finance Ministry accepts AP Shah Panel's recommendations on MAT; no levy
on FIIs prior to April 1, 2015
India’s manufacturing PMI eases to 52.3 in August
Passenger vehicle sales up 7% in August
States likely to auction 22 iron ore mines in Oct-Nov
Corporate News
Welspun shareholders approve borrowing up to `500cr
Edelweiss asset reconstruction company takes control of Bharati Shipyard
Maruti launches hybrid Ciaz at `8.23 lakh onwards
Adani Group wins 50MW solar power plant in UP
Market Outlook
September 2, 2015
Top Picks
Large Cap
Market Cap
CMP
Target
Upside
Company
Sector
Rating
(` Cr)
(`)
(`)
(%)
Axis Bank
Financials
1,14,109
Buy
480
704
46.6
ICICI Bank
Financials
1,57,707
Buy
272
373
37.3
Infosys
IT
2,50,287
Buy
1,090
1,306
19.9
Inox Wind
Capital Goods
8,306
Buy
374
505
34.9
LIC HFL
Financials
21,436
Buy
425
570
34.2
Power Grid
Power
67,461
Buy
129
170
31.8
TCS
IT
4,97,282
Buy
2,539
3,168
24.8
Tech Mahindra IT
49,283
Buy
512
646
26.1
Yes Bank
Financials
27,885
Buy
666
951
42.7
Source: Angel Research, Bloomberg
Mid Cap
Market Cap
CMP
Target
Upside
Company
Sector
Rating
(` Cr)
(`)
(`)
(%)
Bajaj Electricals
Others
2,456
Buy
244
341
40.0
Garware Wall
Others
623
Buy
285
390
37.0
Ropes
HMVL
Media
1,629
Buy
222
292
31.5
JK Tyre
Auto Ancillary
2,338
Buy
103
129
25.1
MBL Infra
Construction
967
Buy
233
360
54.3
Minda Industries Auto Ancillary
821
Buy
517
652
26.0
MT Educare
Others
504
Buy
127
169
33.5
Radico Khaitan
Others
1,149
Buy
86
112
29.7
Surya Roshni
Others
531
Buy
121
183
51.1
Source: Angel Research, Bloomberg
Market Outlook
September 02, 2015
Global economic events release calendar
Date
Time
Country Event Description
Unit
Period
Bloomberg Data
Last Reported Estimated
September 3, 2015
6:00PM
US
Initial Jobless claims
Thousands
Aug 29
271.00
275.00
1:25PM
Germany PMI Services
Value
Aug F
53.60
53.60
5:15PM
Euro Zone ECB announces interest rates
%
Sep 3
0.05
0.05
September 4, 2015
6:00PM
US
Change in Nonfarm payrolls
Thousands
Aug
215.00
218.00
6:00PM
US
Unnemployment rate
%
Aug
5.30
5.20
September 8, 2015
2:30PM
Euro Zone Euro-Zone GDP s.a. (QoQ)
% Change
2Q P
0.30
0.30
China
Exports YoY%
% Change
Aug
(8.30)
(5.00)
September 9, 2015
2:00PM
UK
Industrial Production (YoY)
% Change
Jul
1.50
--
September 10, 2015
India
Imports YoY%
% Change
Aug
(10.28)
--
India
Exports YoY%
% Change
Aug
(10.30)
--
7:00AM
China
Consumer Price Index (YoY)
% Change
Aug
1.60
1.90
4:30PM
UK
BOE Announces rates
% Ratio
Sep 10
0.50
0.50
September 11, 2015
5:30PM
India
Industrial Production YoY
% Change
Jul
3.80
--
September 13, 2015
11:00AM
China
Industrial Production (YoY)
% Change
Aug
6.00
6.60
September 14, 2015
12:00PM
India
Monthly Wholesale Prices YoY%
% Change
Aug
(4.05)
--
September 15, 2015
6:45PM
US
Industrial Production
%
Aug
0.56
--
2:00PM
UK
CPI (YoY)
% Change
Aug
0.10
--
September 16, 2015
2:00PM
UK
Jobless claims change
% Change
Aug
(4.90)
--
2:30PM
Euro Zone Euro-Zone CPI (YoY)
%
Aug F
0.20
--
6:00PM
US
Consumer price index (mom)
% Change
Aug
0.10
--
September 17, 2015
6:00PM
US
Building permits
Thousands
Aug
1,130.00
--
6:00PM
US
Housing Starts
Thousands
Aug
1,206.00
--
11:30PM
US
FOMC rate decision
%
Sep 17
0.25
0.50
September 21, 2015
7:30PM
US
Existing home sales
Million
Aug
5.59
--
September 22, 2015
7:30PM
Euro Zone Euro-Zone Consumer Confidence
Value
Sep A
(6.90)
--
September 24, 2015
7:30PM
US
New home sales
Thousands
Aug
507.00
--
September 25, 2015
6:00PM
US
GDP Qoq (Annualised)
% Change
2Q T
3.70
--
Source: Bloomberg, Angel Research
Market Outlook
September 2, 2015
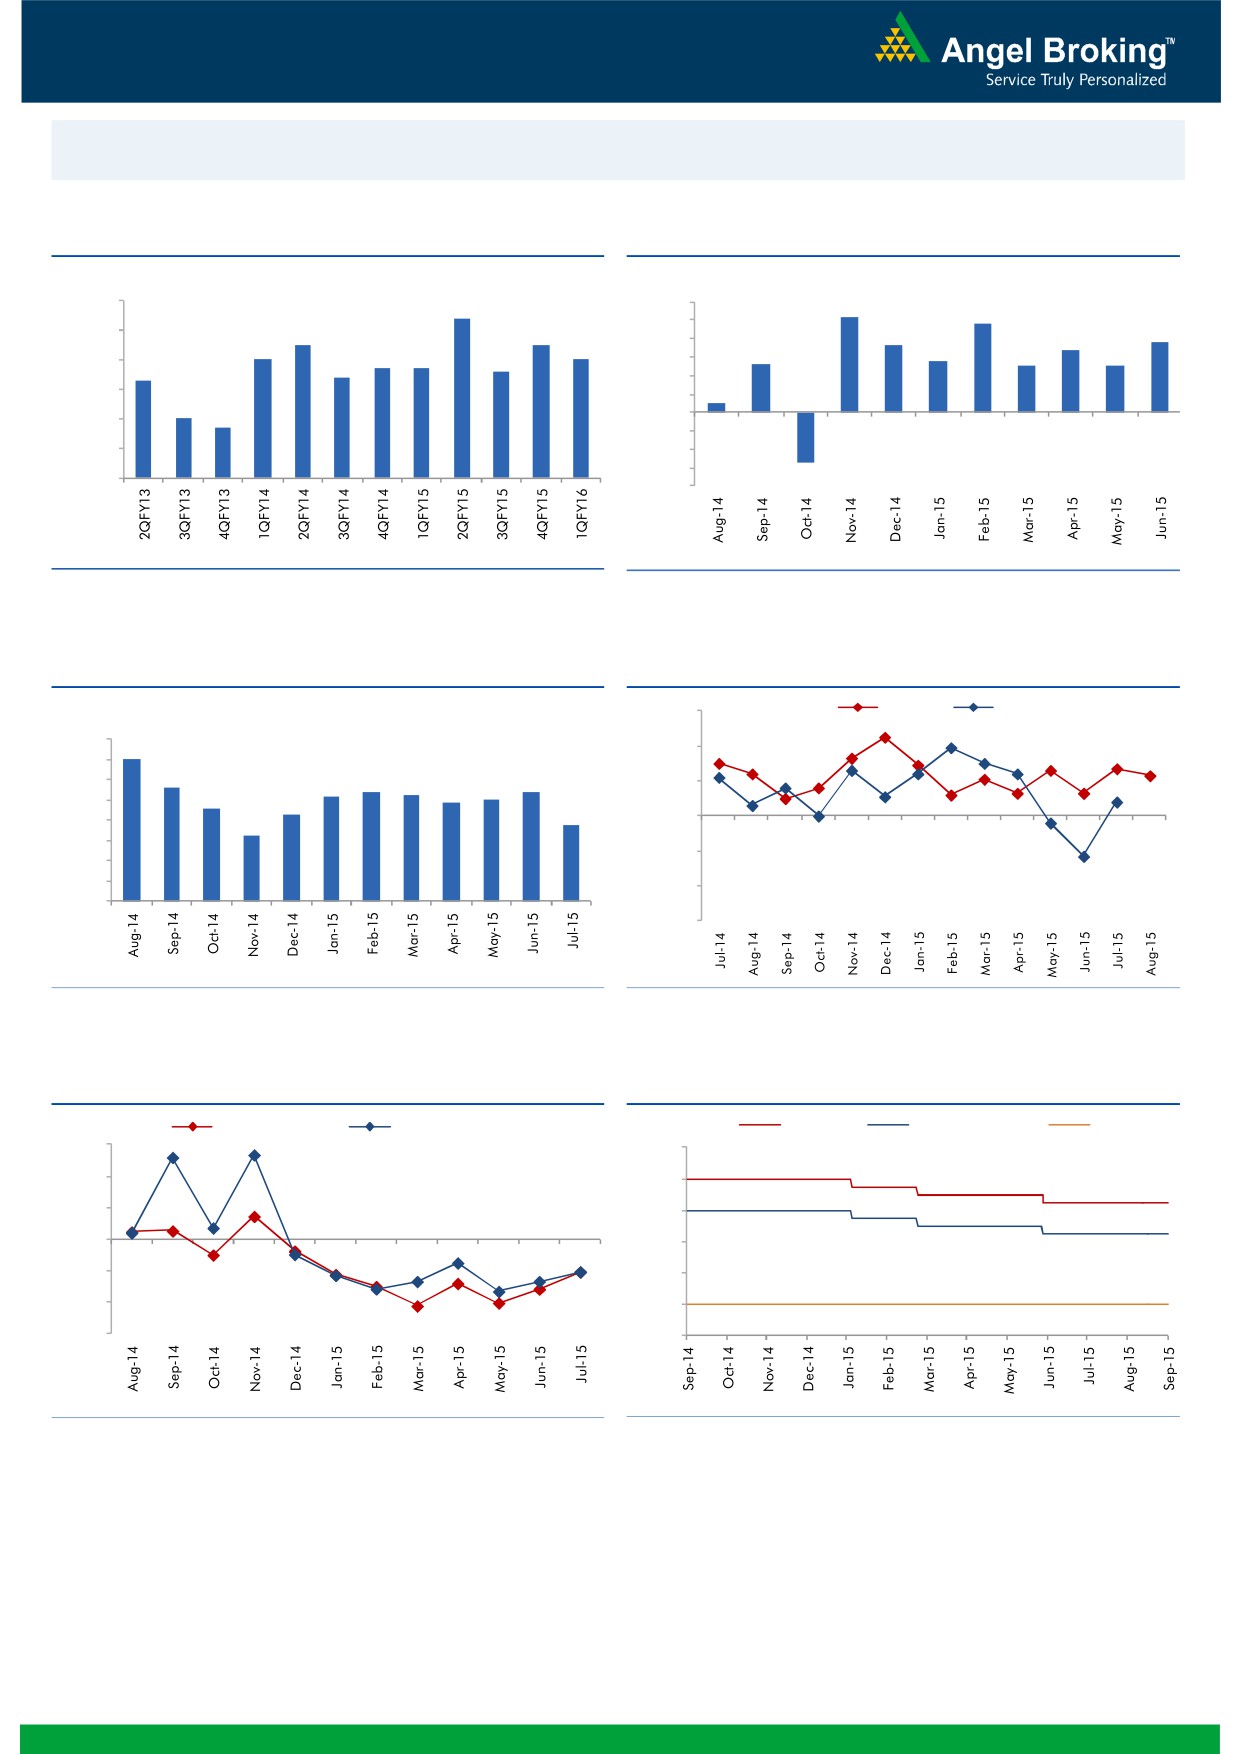
Macro watch
Exhibit 1: Quarterly GDP trends
Exhibit 2: IIP trends
(%)
(%)
9.0
8.4
6.0
5.2
4.8
7.5
7.5
5.0
3.8
8.0
3.6
3.4
7.0
7.0
4.0
2.8
6.7
6.7
2.6
2.5
2.5
7.0
6.3
6.4
6.6
3.0
2.0
6.0
0.5
1.0
5.0
4.7
-
5.0
(1.0)
4.0
(2.0)
(3.0)
3.0
(2.7)
(4.0)
Source: CSO, Angel Research
Source: MOSPI, Angel Research
Exhibit 3: Monthly CPI inflation trends
Exhibit 4: Manufacturing and services PMI
(%)
56.0
Mfg. PMI
Services PMI
8.0
7.0
54.0
7.0
5.6
5.4
6.0
5.2
5.4
5.3
5.0
52.0
4.6
4.9
5.0
4.3
3.8
4.0
3.3
50.0
3.0
48.0
2.0
1.0
46.0
-
44.0
Source: MOSPI, Angel Research
Source: Market, Angel Research; Note: Level above 50 indicates expansion
Exhibit 5: Exports and imports growth trends
Exhibit 6: Key policy rates
(%)
Exports yoy growth
Imports yoy growth
(%)
Repo rate
Reverse Repo rate
CRR
30.0
9.00
20.0
8.00
10.0
7.00
0.0
6.00
(10.0)
5.00
(20.0)
4.00
(30.0)
3.00
Source: Bloomberg, Angel Research
Source: RBI, Angel Research
Market Outlook
September 2, 2015
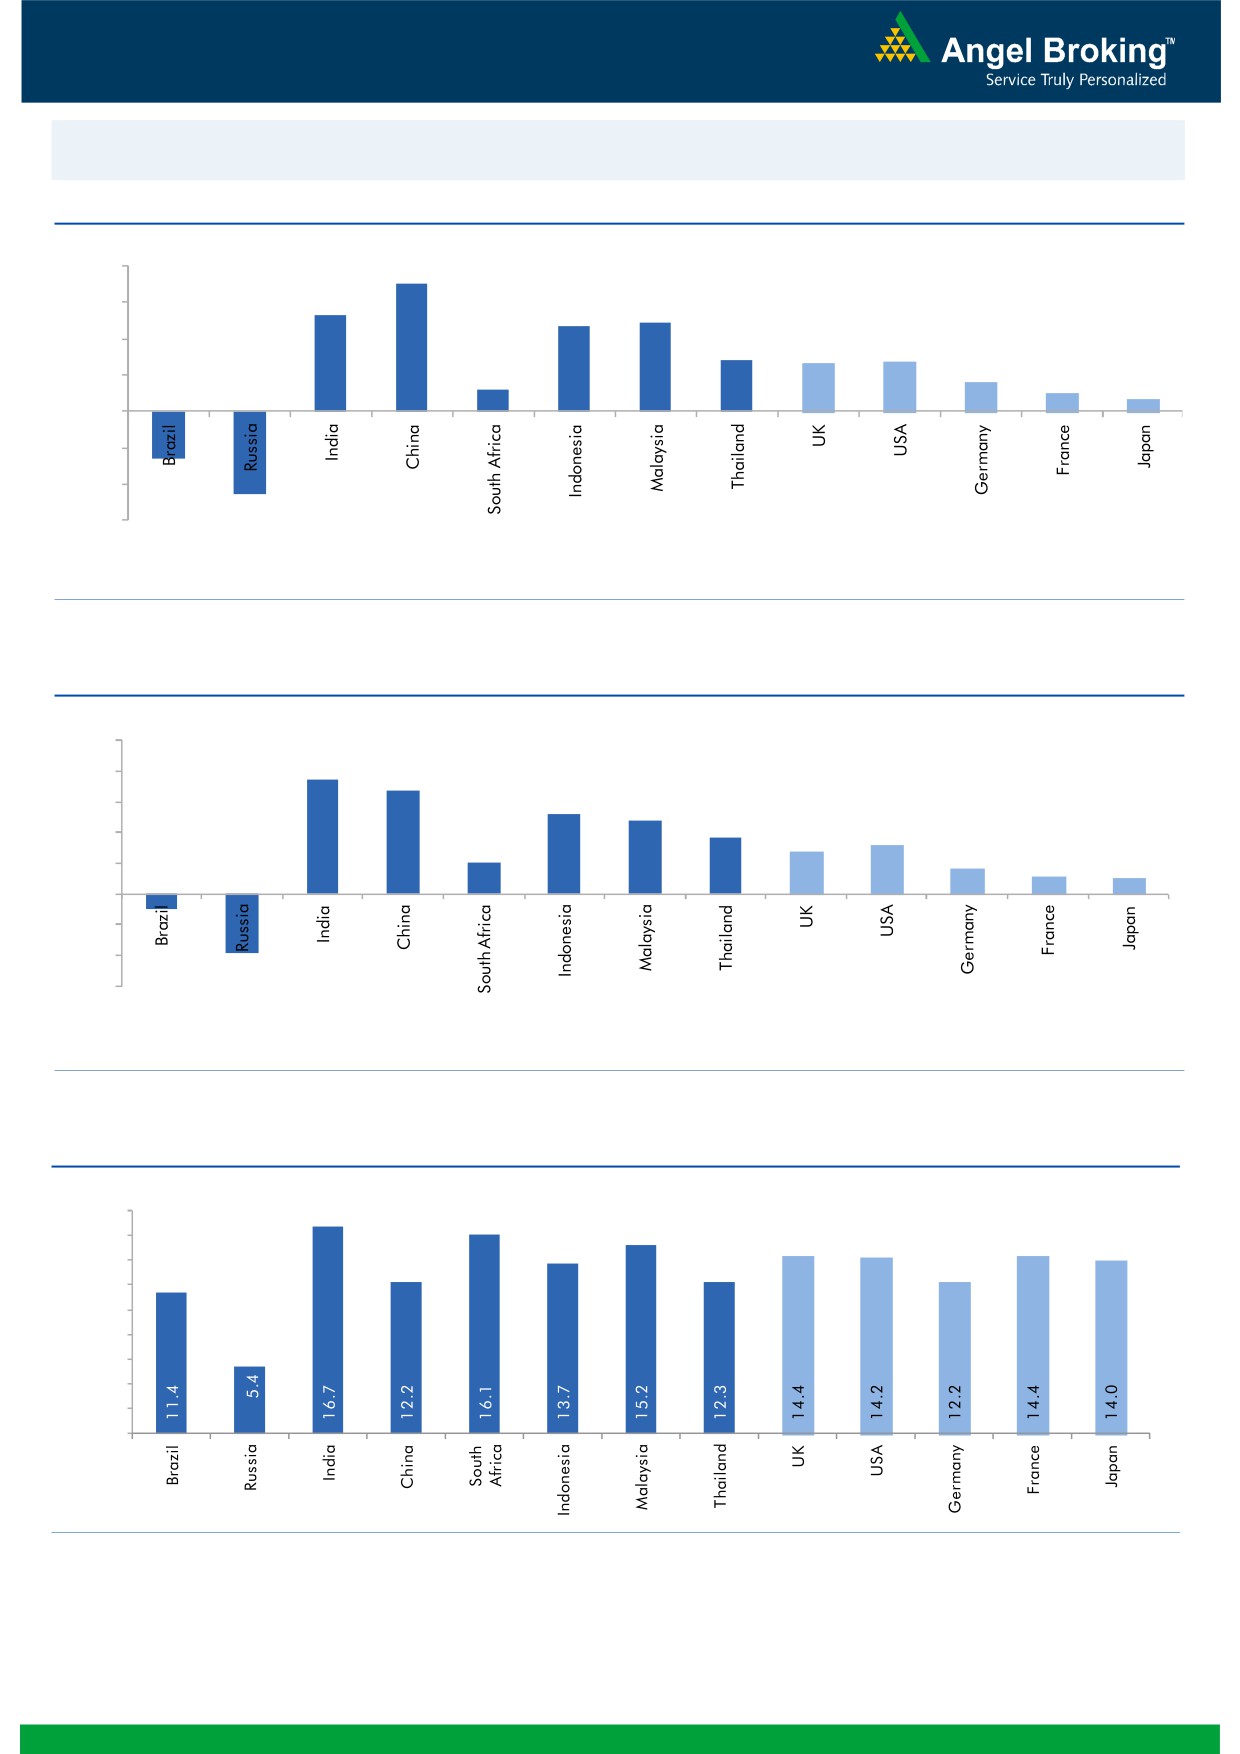
Global watch
Exhibit 1: Latest quarterly GDP Growth (%, yoy) across select developing and developed countries
(%)
8.0
7.0
6.0
5.3
4.9
4.7
4.0
2.8
2.6
2.7
1.6
2.0
1.2
1.0
0.7
(2.6)
(4.6)
-
(2.0)
(4.0)
(6.0)
Source: Bloomberg, Angel Research
Exhibit 2: 2015 GDP Growth projection by IMF (%, yoy) across select developing and developed countries
(%)
10.0
7.5
8.0
6.8
5.2
6.0
4.8
3.7
3.1
4.0
2.7
2.0
1.6
1.2
1.0
2.0
(3.8)
(1.0)
-
(2.0)
(4.0)
(6.0)
Source: IMF, Angel Research
Exhibit 3: One year forward P-E ratio across select developing and developed countries
(x)
18.0
16.0
14.0
12.0
10.0
8.0
6.0
4.0
2.0
-
Source: Bloomberg, Angel Research
Market Outlook
September 2, 2015
Exhibit 4: Relative performance of indices across globe
Returns (%)
Country
Name of index
Closing price
1M
3M
1YR
Brazil
Bovespa
45,477
(6.6)
(11.6)
(23.5)
Russia
Micex
1,698
2.6
4.2
22.3
India
Nifty
7,786
(8.8)
(4.3)
(1.5)
China
Shanghai Composite
3,167
(13.6)
(35.5)
41.3
South Africa
Top 40
42,980
(5.7)
(5.4)
(4.3)
Mexico
Mexbol
42,912
(1.5)
(2.7)
(4.2)
Indonesia
LQ45
749
(5.6)
(19.3)
(14.5)
Malaysia
KLCI
1,609
(5.3)
(7.7)
(13.6)
Thailand
SET 50
889
(4.8)
(9.8)
(14.7)
USA
Dow Jones
16,058
(6.9)
(8.4)
(3.2)
UK
FTSE
6,059
(8.3)
(11.8)
(11.1)
Japan
Nikkei
18,166
(11.8)
(11.6)
16.9
Germany
DAX
10,016
(11.6)
(12.4)
5.5
France
CAC
4,541
(10.2)
(9.3)
1.8
Source: Bloomberg, Angel Research
Market Outlook
September 02, 2015
Stock Watch
Company Name
Reco
CMP
Target
Mkt Cap
Sales ( Čcr )
OPM(%)
EPS (Č)
PER(x)
P/BV(x)
RoE(%)
EV/Sales(x)
(Č)
Price ( Č)
( Č cr )
FY16E FY17E
FY16E
FY17E
FY16E
FY17E
FY16E
FY17E
FY16E
FY17E
FY16E
FY17E
FY16E
FY17E
Agri / Agri Chemical
Rallis
Neutral
209
-
4,062
2,075
2,394
14.4
14.4
9.5
11.0
22.0
19.0
4.4
3.8
21.1
21.3
2.0
1.7
United Phosphorus
Neutral
526
-
22,527
13,698
15,752
17.6
17.6
32.1
38.5
16.4
13.7
3.2
2.7
21.4
21.3
1.7
1.5
Auto & Auto Ancillary
Ashok Leyland
Accumulate
88
94
24,916
17,850
20,852
10.6
11.1
3.2
4.3
27.4
20.4
4.5
4.2
16.4
20.8
1.4
1.1
Bajaj Auto
Accumulate
2,252
2,454
65,158
23,842
27,264
19.8
19.6
128.4
144.4
17.5
15.6
5.4
4.6
30.5
29.5
2.3
2.0
Eicher Motors
Buy
18,259
22,859
49,560
11,681
15,550
15.3
16.9
358.5
564.3
50.9
32.4
15.3
11.4
29.8
34.9
4.1
3.1
Hero Motocorp
Accumulate
2,385
2,660
47,631
28,500
33,028
13.8
14.1
144.2
166.3
16.5
14.3
6.1
5.2
36.7
36.0
1.5
1.3
L G Balakrishnan & Bros Neutral
471
-
740
1,254
1,394
11.6
11.8
35.9
41.7
13.1
11.3
1.8
1.6
13.5
13.8
0.7
0.6
Mahindra and Mahindra Buy
1,177
1,493
73,090
40,088
45,176
13.8
14.0
59.6
70.4
19.7
16.7
3.3
2.9
16.6
17.2
1.5
1.2
Maruti
Buy
4,058
4,735
122,587
58,102
68,587
16.7
16.9
182.0
225.5
22.3
18.0
4.4
3.8
19.9
21.0
1.9
1.5
Minda Industries
Buy
517
652
821
2,567
2,965
7.3
8.0
38.8
54.3
13.3
9.5
1.9
1.6
14.4
16.8
0.4
0.4
Rane Brake Lining
Buy
282
366
223
454
511
11.1
11.4
23.8
28.1
11.8
10.0
1.7
1.5
14.2
15.3
0.6
0.6
Setco Automotive
Neutral
219
-
584
594
741
12.7
13.7
8.4
15.8
26.0
13.8
2.7
2.3
10.4
16.9
1.4
1.2
Tata Motors
Buy
330
432
95,162
267,464
307,211
13.7
13.7
34.6
40.7
9.5
8.1
1.2
1.1
13.2
13.6
0.5
0.5
TVS Motor
Buy
217
255
10,298
11,839
13,985
7.0
8.0
10.8
15.9
20.1
13.6
5.1
4.0
25.5
29.7
0.8
0.7
Amara Raja Batteries
Neutral
990
-
16,905
5,101
6,224
17.8
17.6
31.1
39.2
31.8
25.3
7.9
6.3
24.8
24.8
3.3
2.6
Exide Industries
Accumulate
148
159
12,567
7,363
8,247
13.7
14.5
6.6
7.7
22.4
19.2
2.8
2.6
12.6
13.3
1.4
1.3
Apollo Tyres
Accumulate
170
179
8,641
12,576
12,978
16.8
16.1
22.3
19.9
7.6
8.5
1.3
1.1
17.2
13.4
0.8
0.8
Ceat
Accumulate
1,077
1,166
4,355
6,041
6,597
14.3
14.2
101.5
116.6
10.6
9.2
2.1
1.8
20.0
19.1
0.9
0.7
JK Tyres
Buy
103
129
2,338
7,446
7,669
15.2
14.0
19.6
18.4
5.3
5.6
1.3
1.1
25.2
19.5
0.7
0.6
Swaraj Engines
Neutral
880
-
1,093
593
677
14.5
14.8
51.2
60.8
17.2
14.5
4.0
3.6
23.3
24.8
1.7
1.4
Subros
Neutral
75
-
452
1,268
1,488
11.6
11.9
3.7
6.6
20.4
11.4
1.4
1.2
6.8
11.4
0.7
0.5
Indag Rubber
Neutral
174
-
458
283
329
17.0
17.2
13.0
15.4
13.5
11.3
2.9
2.4
21.8
21.6
1.3
1.1
Capital Goods
ACE
Neutral
39
-
387
660
839
4.7
8.2
1.0
3.9
39.1
10.0
1.2
1.1
3.2
11.3
0.7
0.6
BEML
Neutral
1,234
-
5,140
3,277
4,006
6.0
8.9
29.2
64.3
42.3
19.2
2.4
2.1
5.7
11.7
1.7
1.3
BGR Energy
Neutral
105
-
757
3,615
3,181
9.5
9.4
16.7
12.4
6.3
8.5
0.6
0.6
10.0
7.0
0.6
0.8
BHEL
Neutral
218
-
53,272
33,722
35,272
10.8
11.7
10.5
14.2
20.7
15.3
1.5
1.4
7.0
9.0
1.7
1.6
Blue Star
Accumulate
341
387
3,066
3,649
4,209
5.0
5.9
9.2
14.7
37.3
23.2
6.7
6.3
9.1
17.5
0.9
0.8
Crompton Greaves
Buy
166
204
10,420
13,484
14,687
4.9
6.2
4.5
7.1
36.9
23.4
2.6
2.4
7.2
10.8
0.9
0.8
Inox Wind
Buy
374
505
8,306
4,980
5,943
17.0
17.5
26.6
31.6
14.1
11.8
4.2
3.1
35.0
30.0
1.8
1.5
Market Outlook
September 02, 2015
Stock Watch
Company Name
Reco
CMP
Target
Mkt Cap
Sales ( Čcr )
OPM(%)
EPS (Č)
PER(x)
P/BV(x)
RoE(%)
EV/Sales(x)
(Č)
Price ( Č)
( Č cr )
FY16E
FY17E
FY16E
FY17E
FY16E
FY17E
FY16E
FY17E
FY16E
FY17E
FY16E
FY17E
FY16E
FY17E
Capital Goods
KEC International
Neutral
123
-
3,162
8,791
9,716
6.1
6.8
5.4
8.2
22.8
15.0
2.3
2.1
10.0
14.0
0.6
0.5
Thermax
Neutral
961
-
11,446
6,413
7,525
7.4
8.5
30.5
39.3
31.5
24.4
4.9
4.2
15.0
17.0
1.8
1.5
Cement
ACC
Buy
1,332
1,548
25,002
11,856
14,092
14.5
17.8
47.6
76.1
28.0
17.5
2.9
2.6
10.6
15.7
2.0
1.6
Ambuja Cements
Accumulate
208
233
32,241
10,569
12,022
20.7
22.2
8.7
10.7
23.9
19.4
3.0
2.9
13.0
15.2
2.7
2.3
India Cements
Buy
69
112
2,132
4,716
5,133
15.9
16.9
3.7
7.5
18.8
9.3
0.7
0.7
3.8
7.3
0.8
0.6
JK Cement
Buy
612
767
4,280
4,056
4,748
14.5
17.0
22.6
41.1
27.1
14.9
2.4
2.2
9.3
15.3
1.5
1.2
J K Lakshmi Cement
Buy
346
430
4,070
2,947
3,616
16.7
19.9
11.5
27.2
30.1
12.7
2.9
2.5
9.8
20.8
1.8
1.4
Mangalam Cements
Neutral
219
-
584
1,053
1,347
10.5
13.3
8.4
26.0
26.1
8.4
1.1
1.0
4.3
12.5
0.9
0.7
Orient Cement
Accumulate
164
183
3,350
1,854
2,524
21.2
22.2
7.7
11.1
21.2
14.7
3.1
2.6
13.3
15.7
2.5
1.8
Ramco Cements
Accumulate
318
350
7,561
4,036
4,545
20.8
21.3
15.1
18.8
21.0
16.9
2.6
2.3
12.9
14.3
2.4
2.0
Shree Cement^
Neutral
10,968
-
38,209
7,150
8,742
26.7
28.6
228.0
345.5
48.1
31.8
7.1
5.9
15.7
20.3
5.1
4.1
UltraTech Cement
Buy
2,831
3,282
77,687
27,562
31,548
20.4
22.3
111.9
143.3
25.3
19.8
3.6
3.1
15.2
16.8
2.9
2.5
Construction
ITNL
Neutral
93
-
2,293
7,360
8,825
34.0
35.9
1.0
5.0
93.0
18.6
0.4
0.4
0.3
1.4
3.7
3.6
KNR Constructions
Neutral
556
-
1,564
915
1,479
14.3
13.9
20.3
37.2
27.4
15.0
2.5
2.2
9.6
15.6
1.8
1.2
Larsen & Toubro
Buy
1,558
2,013
145,030
68,920
82,446
10.9
11.5
57.0
73.0
27.3
21.4
2.5
2.3
13.6
15.5
2.3
1.9
Gujarat Pipavav Port
Neutral
178
-
8,583
721
784
53.1
53.6
8.2
9.1
21.6
19.5
3.5
2.8
20.0
18.3
11.5
10.2
MBL Infrastructures
Buy
233
360
967
2,313
2,797
12.2
14.6
19.0
20.0
12.3
11.7
1.3
1.2
11.3
10.6
1.1
1.0
Nagarjuna Const.
Neutral
70
-
3,867
7,892
8,842
8.3
9.1
2.4
5.3
29.0
13.1
1.2
1.1
4.2
8.6
0.7
0.6
PNC Infratech
Neutral
477
-
2,447
1,798
2,132
13.2
13.5
22.0
30.0
21.7
15.9
2.0
1.8
11.5
11.4
1.5
1.2
Simplex Infra
Neutral
300
-
1,486
6,241
7,008
10.4
10.7
20.0
36.0
15.0
8.3
1.2
1.1
6.8
11.1
0.7
0.6
Financials
Allahabad Bank
Neutral
80
-
4,574
8,859
9,817
3.0
3.0
23.7
30.1
3.4
2.7
0.4
0.3
10.6
12.3
-
-
Axis Bank
Buy
480
704
114,109
26,522
31,625
3.6
3.6
36.2
45.4
13.3
10.6
2.6
2.3
18.2
19.6
-
-
Bank of Baroda
Neutral
173
-
38,170
18,934
21,374
2.0
2.0
13.2
15.1
13.1
11.4
1.0
0.9
7.1
7.7
-
-
Bank of India
Neutral
135
-
8,950
17,402
20,003
2.0
2.1
40.3
50.7
3.3
2.7
0.3
0.3
9.0
10.4
-
-
Canara Bank
Neutral
268
-
13,825
15,805
17,745
2.0
2.2
64.3
73.5
4.2
3.7
0.5
0.4
10.8
11.3
-
-
Dena Bank
Neutral
41
-
2,301
3,580
4,040
2.1
2.2
8.4
10.9
4.9
3.8
0.4
0.3
6.8
8.4
-
-
Federal Bank
Neutral
59
-
10,172
3,522
4,045
3.2
3.2
12.2
14.1
4.9
4.2
0.6
0.5
12.9
13.4
-
-
HDFC
Neutral
1,158
-
182,592
11,198
13,321
3.5
3.5
45.1
53.7
25.7
21.6
5.3
4.8
27.2
28.2
-
-
HDFC Bank
Buy
1,001
1,255
251,538
38,629
47,500
4.5
4.7
52.6
66.4
19.0
15.1
3.5
3.0
19.6
21.2
-
-
Market Outlook
September 02, 2015
Stock Watch
Company Name
Reco
CMP
Target
Mkt Cap
Sales ( Čcr )
OPM(%)
EPS (Č)
PER(x)
P/BV(x)
RoE(%)
EV/Sales(x)
(Č)
Price ( Č)
( Č cr )
FY16E FY17E
FY16E
FY17E
FY16E
FY17E
FY16E
FY17E
FY16E
FY17E
FY16E
FY17E
FY16E
FY17E
Financials
ICICI Bank
Buy
272
373
157,707
36,037
41,647
3.5
3.6
22.9
26.7
11.8
10.2
2.0
1.7
15.7
15.9
-
-
IDBI Bank
Neutral
57
-
9,143
9,806
11,371
1.7
1.9
10.0
16.3
5.7
3.5
0.4
0.4
6.8
10.4
-
-
Indian Bank
Neutral
129
-
6,201
6,454
7,321
2.5
2.6
26.4
33.3
4.9
3.9
0.4
0.4
8.1
9.6
-
-
LIC Housing Finance
Buy
425
570
21,436
2,934
3,511
2.3
2.3
30.9
36.8
13.8
11.5
2.2
1.9
16.8
17.5
-
-
Oriental Bank
Neutral
127
-
3,811
7,930
8,852
2.5
2.5
51.8
57.1
2.5
2.2
0.3
0.3
9.3
9.5
-
-
Punjab Natl.Bank
Neutral
135
-
24,999
24,160
27,777
2.9
3.0
18.5
24.6
7.3
5.5
0.7
0.6
8.8
10.8
-
-
South Ind.Bank
Neutral
20
-
2,646
1,999
2,249
2.4
2.4
3.5
4.0
5.6
4.9
0.7
0.6
12.6
13.1
-
-
St Bk of India
Buy
239
309
180,908
86,900
100,550
3.1
3.1
22.1
27.7
10.8
8.6
1.3
1.2
12.7
14.3
-
-
Union Bank
Neutral
168
-
10,659
12,995
14,782
2.4
2.4
32.3
40.9
5.2
4.1
0.6
0.5
10.7
12.3
-
-
Vijaya Bank
Neutral
35
-
3,033
3,474
3,932
1.8
1.9
5.9
7.2
6.0
4.9
0.5
0.5
8.1
9.3
-
-
Yes Bank
Buy
666
951
27,885
7,006
8,825
3.1
3.3
61.4
77.1
10.9
8.6
2.0
1.7
20.1
21.3
-
-
FMCG
Asian Paints
Neutral
816
-
78,271
16,553
19,160
16.0
16.2
17.7
21.5
46.2
38.0
12.3
11.0
29.4
31.2
4.6
3.9
Britannia
Neutral
2,922
-
35,053
8,065
9,395
9.6
10.2
47.2
65.5
61.9
44.6
20.6
19.4
38.3
41.2
4.2
3.6
Colgate
Accumulate
1,924
2,022
26,164
4,836
5,490
19.5
19.7
48.5
53.2
39.7
36.2
29.1
25.3
99.8
97.5
5.3
4.7
Dabur India
Neutral
271
-
47,627
9,370
10,265
17.1
17.2
7.3
8.1
37.0
33.5
11.2
9.1
33.7
30.6
5.0
4.6
GlaxoSmith Con*
Neutral
6,224
-
26,175
4,919
5,742
17.2
17.4
168.3
191.2
37.0
32.6
10.5
8.9
28.8
28.9
4.9
4.1
Godrej Consumer
Neutral
1,336
-
45,480
10,168
12,886
16.1
16.1
32.1
38.4
41.6
34.8
8.5
7.8
19.7
21.0
4.6
3.6
HUL
Neutral
854
-
184,880
34,940
38,957
17.5
17.7
20.8
24.7
41.1
34.6
45.7
36.5
110.5
114.2
5.1
4.5
ITC
Buy
316
409
253,179
41,068
45,068
37.8
37.4
13.9
15.9
22.7
19.9
7.6
6.7
34.1
33.8
5.8
5.2
Marico
Neutral
406
-
26,184
6,551
7,766
15.7
16.0
10.4
12.5
39.1
32.5
11.4
9.4
33.2
32.4
3.9
3.3
Nestle*
Accumulate
5,992
6,646
57,770
11,291
12,847
22.2
22.3
158.9
184.6
37.7
32.5
19.7
17.7
55.0
57.3
5.0
4.3
Tata Global
Buy
115
152
7,265
8,635
9,072
9.8
9.9
6.5
7.6
17.7
15.2
1.8
1.7
6.8
7.4
0.8
0.7
IT
HCL Tech^
Buy
947
1,132
133,166
42,038
47,503
23.5
23.5
56.4
62.9
16.8
15.1
3.9
3.0
23.2
19.8
2.8
2.2
Infosys
Buy
1,090
1,306
250,287
60,250
66,999
28.0
28.0
58.3
63.7
18.7
17.1
3.9
3.4
20.9
19.7
3.5
3.0
TCS
Buy
2,539
3,168
497,282
108,420
123,559
28.8
28.7
127.2
143.9
20.0
17.6
8.0
7.4
39.9
41.8
4.2
3.6
Tech Mahindra
Buy
512
646
49,283
25,566
28,890
16.0
17.0
26.3
31.9
19.5
16.1
3.5
3.0
17.9
18.6
1.7
1.4
Wipro
Buy
563
719
139,004
52,414
58,704
23.7
23.8
38.4
42.3
14.7
13.3
2.9
2.6
19.5
18.0
2.2
1.8
Media
D B Corp
Buy
308
356
5,656
2,241
2,495
27.8
27.9
21.8
25.6
14.2
12.0
3.7
3.3
26.7
28.5
2.5
2.2
HT Media
Neutral
80
-
1,860
2,495
2,603
11.2
11.2
7.3
8.6
11.0
9.3
0.9
0.8
7.4
8.1
0.3
0.2
Market Outlook
September 02, 2015
Stock Watch
Company Name
Reco
CMP
Target
Mkt Cap
Sales ( Čcr )
OPM(%)
EPS (Č)
PER(x)
P/BV(x)
RoE(%)
EV/Sales(x)
(Č)
Price ( Č)
( Č cr )
FY16E FY17E
FY16E
FY17E
FY16E
FY17E
FY16E
FY17E
FY16E
FY17E
FY16E
FY17E
FY16E
FY17E
Media
Jagran Prakashan
Buy
134
156
4,372
1,939
2,122
26.0
26.0
8.3
9.2
16.1
14.5
2.8
2.5
17.5
17.1
2.2
2.0
Sun TV Network
Neutral
346
-
13,620
2,779
3,196
70.2
70.5
22.8
27.3
15.2
12.7
3.7
3.4
26.7
28.3
4.7
4.0
Hindustan Media
Buy
222
292
1,629
920
1,031
20.0
20.0
19.2
20.9
11.6
10.6
1.9
1.6
16.4
15.3
1.3
1.1
Ventures
Metals & Mining
Coal India
Accumulate
355
400
224,484
72,015
78,415
21.2
21.5
21.7
25.3
16.4
14.1
5.6
5.5
33.1
39.1
2.3
2.2
Hind. Zinc
Neutral
126
-
53,155
15,546
16,821
47.5
49.0
19.7
20.3
6.4
6.2
1.1
0.9
17.2
16.6
1.2
0.7
Hindalco
Neutral
76
-
15,673
112,328
119,817
7.7
7.9
16.3
20.1
4.7
3.8
0.3
0.3
8.0
8.5
0.6
0.5
JSW Steel
Neutral
901
-
21,776
48,125
53,595
18.8
21.0
46.9
97.5
19.2
9.2
0.9
0.9
4.4
9.5
1.3
1.1
NMDC
Neutral
100
-
39,627
12,544
13,330
59.5
59.7
16.3
16.5
6.1
6.1
1.1
1.0
5.1
9.9
1.9
1.9
SAIL
Neutral
47
-
19,329
56,365
63,383
6.9
8.0
7.1
8.2
6.6
5.7
0.4
0.4
7.0
7.1
0.9
0.8
Vedanta
Neutral
95
-
28,090
81,842
88,430
30.6
32.8
20.2
25.7
4.7
3.7
0.3
0.3
7.5
8.5
0.7
0.5
Tata Steel
Neutral
216
-
20,998
136,805
149,228
11.3
11.9
26.4
36.8
8.2
5.9
0.7
0.6
6.0
8.0
0.7
0.6
Oil & Gas
Cairn India
Neutral
146
-
27,326
12,617
14,513
33.7
40.0
25.5
27.7
5.7
5.3
0.4
0.4
7.4
7.7
0.8
0.7
GAIL
Neutral
293
-
37,147
75,595
85,554
8.6
8.0
31.8
36.1
9.2
8.1
1.0
0.9
10.7
11.4
0.6
0.5
ONGC
Neutral
234
-
200,070
174,773
192,517
22.7
24.8
34.6
38.2
6.8
6.1
1.0
0.9
14.2
14.9
1.3
1.1
Petronet LNG
Buy
176
210
13,185
39,007
40,785
3.8
4.2
9.2
11.0
19.2
16.0
2.1
2.0
11.6
12.7
0.4
0.4
Indian Oil Corp
Accumulate
406
455
98,563
359,607
402,760
5.9
6.1
42.5
48.7
9.6
8.3
1.3
1.1
14.1
14.4
0.4
0.3
Reliance Industries
Accumulate
840
930
272,053
339,083
384,014
7.8
9.5
75.7
94.5
11.1
8.9
1.1
1.1
10.7
12.2
1.1
1.0
Pharmaceuticals
Alembic Pharma
Neutral
700
-
13,189
2,601
3,115
21.2
20.2
20.8
23.9
33.6
29.3
10.8
8.2
37.2
31.8
5.1
4.2
Aurobindo Pharma
Buy
737
872
43,021
14,923
17,162
23.0
23.0
38.2
43.6
19.3
16.9
5.9
4.5
36.0
30.2
3.2
2.7
Aventis*
Neutral
3,872
-
8,918
2,156
2,455
15.1
16.8
109.7
133.9
35.3
28.9
4.8
4.0
18.4
22.5
3.8
3.2
Cadila Healthcare
Neutral
1,879
-
38,465
10,224
11,840
20.0
21.0
71.0
85.6
26.5
22.0
7.1
5.6
30.1
28.5
3.8
3.2
Cipla
Neutral
663
-
53,266
14,051
16,515
20.4
18.7
26.6
28.4
24.9
23.4
4.2
3.6
18.2
16.5
3.8
3.2
Dr Reddy's
Neutral
4,253
-
72,514
17,903
20,842
22.7
22.8
160.5
189.5
26.5
22.5
5.4
4.5
22.2
21.7
4.0
3.4
Dishman Pharma
Buy
225
290
1,816
1,716
1,888
20.2
20.2
16.3
21.6
13.8
10.4
1.3
1.2
9.7
11.7
1.2
1.0
GSK Pharma*
Neutral
3,377
-
28,605
2,870
3,158
20.0
22.1
59.5
68.3
56.8
49.5
16.7
17.2
28.5
34.3
9.5
8.7
Indoco Remedies
Neutral
335
-
3,083
1,088
1,262
18.2
18.2
13.1
15.5
25.5
21.6
5.0
4.2
21.2
21.1
2.9
2.5
Ipca labs
Neutral
789
-
9,956
3,507
4,078
17.6
18.6
25.8
32.0
30.6
24.7
4.0
3.4
13.8
14.9
3.1
2.7
Lupin
Neutral
1,863
-
83,839
14,864
17,244
26.9
26.9
62.1
71.1
30.0
26.2
7.3
5.8
27.4
24.6
5.4
4.5
Sun Pharma
Accumulate
901
950
216,760
28,163
32,610
25.8
30.7
17.4
26.9
51.8
33.5
4.9
4.3
13.0
16.6
7.2
6.0
Market Outlook
September 02, 2015
Stock Watch
Company Name
Reco
CMP
Target
Mkt Cap
Sales ( Čcr )
OPM(%)
EPS (Č)
PER(x)
P/BV(x)
RoE(%)
EV/Sales(x)
(Č)
Price ( Č)
( Č cr )
FY16E FY17E
FY16E
FY17E
FY16E
FY17E
FY16E
FY17E
FY16E
FY17E
FY16E
FY17E
FY16E
FY17E
Power
Tata Power
Neutral
60
-
16,322
38,302
38,404
14.1
13.1
5.1
6.0
11.8
10.1
1.1
1.1
9.2
10.3
1.3
1.3
NTPC
Buy
120
157
99,110
87,064
98,846
23.5
23.5
11.7
13.2
10.3
9.1
1.1
1.1
11.4
12.1
2.2
1.9
Power Grid
Buy
129
170
67,461
20,702
23,361
86.7
86.4
12.1
13.2
10.7
9.8
1.6
1.4
15.6
15.1
8.2
7.6
Telecom
Bharti Airtel
Neutral
345
-
138,050
101,748
109,191
32.1
31.7
12.0
12.5
28.8
27.6
2.0
1.9
6.9
6.7
2.0
1.8
Idea Cellular
Neutral
150
-
53,855
34,282
36,941
32.0
31.5
5.9
6.2
25.4
24.1
2.3
2.1
9.9
9.3
2.1
2.0
zOthers
Abbott India
Neutral
4,703
-
9,993
2,715
3,153
14.5
14.1
134.3
152.2
35.0
30.9
8.7
7.2
27.4
25.6
3.4
2.9
Bajaj Electricals
Buy
244
341
2,456
4,719
5,287
5.2
5.8
8.6
12.7
28.5
19.2
3.3
2.9
11.4
14.8
0.5
0.5
Finolex Cables
Neutral
232
-
3,541
2,728
3,036
10.8
11.0
14.4
16.8
16.1
13.8
2.4
2.1
15.2
15.3
1.0
0.9
Goodyear India*
Buy
553
655
1,276
1,953
1,766
12.4
12.0
67.4
59.6
8.2
9.3
2.0
1.7
27.7
20.2
0.4
0.4
Hitachi
Neutral
1,382
-
3,757
1,806
2,112
9.0
9.2
28.6
29.1
48.3
47.5
12.0
9.7
28.1
22.6
2.2
1.8
Jyothy Laboratories
Neutral
315
-
5,709
1,620
1,847
11.5
11.5
7.3
8.5
43.3
37.2
5.6
5.2
13.3
14.4
3.4
2.9
MRF
Accumulate
39,681
43,575
16,829
20,727
14,841
19.3
18.6
4,905.8
3,351.9
8.1
11.8
2.6
2.1
37.6
19.6
0.8
1.0
Page Industries
Neutral
14,101
-
15,728
1,929
2,450
19.8
20.1
229.9
299.0
61.3
47.2
27.1
18.8
52.1
47.1
8.2
6.4
Relaxo Footwears
Neutral
517
-
6,208
1,767
2,152
12.3
12.5
19.3
25.1
26.9
20.6
6.6
5.1
27.7
27.8
3.6
2.9
Siyaram Silk Mills
Accumulate
1,080
1,221
1,012
1,653
1,873
11.7
12.2
99.3
122.1
10.9
8.8
2.0
1.6
19.5
20.2
0.8
0.7
Styrolution ABS India*
Neutral
743
-
1,306
1,271
1,440
8.6
9.2
32.0
41.1
23.2
18.1
2.4
2.1
10.7
12.4
1.0
0.9
Tree House
Buy
388
449
1,642
259
324
56.8
56.8
17.0
21.7
22.8
17.9
2.3
2.1
10.1
11.5
6.3
5.2
TVS Srichakra
Buy
2,508
3,210
1,920
2,127
2,388
15.2
14.9
237.7
267.5
10.6
9.4
4.5
3.2
51.7
39.8
1.0
0.8
HSIL
Buy
260
434
1,876
2,085
2,436
18.5
18.6
21.7
28.9
12.0
9.0
1.2
1.1
10.0
12.1
1.0
0.8
Kirloskar Engines India
Accumulate
270
297
3,904
2,634
3,252
10.1
12.0
10.9
17.4
24.8
15.5
2.8
2.5
11.4
16.8
1.1
0.8
Ltd
M M Forgings
Buy
588
797
710
563
671
22.1
22.9
51.0
66.5
11.5
8.9
2.4
1.9
23.1
24.1
1.4
1.2
Banco Products (India)
Neutral
117
-
837
1,208
1,353
11.0
12.3
10.8
14.5
10.9
8.1
1.2
1.1
11.9
14.5
0.7
0.6
Competent Automobiles Neutral
152
-
93
1,007
1,114
3.1
3.1
23.7
28.2
6.4
5.4
0.9
0.8
13.9
14.6
0.1
0.1
Nilkamal
Accumulate
955
1,005
1,426
1,948
2,147
10.6
10.3
60.0
67.0
15.9
14.3
2.5
2.1
16.8
16.1
0.8
0.7
Visaka Industries
Accumulate
145
166
231
1,158
1,272
8.6
9.5
23.7
32.7
6.1
4.4
0.6
0.6
10.1
12.5
0.4
0.3
Transport Corporation of
Accumulate
257
293
1,953
2,830
3,350
8.8
9.0
14.4
18.3
17.9
14.0
2.8
2.4
15.4
17.1
0.8
0.7
India
Elecon Engineering
Buy
68
87
736
1,452
1,596
14.0
14.7
4.4
6.2
15.3
10.8
1.3
1.2
8.6
11.2
0.8
0.7
Surya Roshni
Buy
121
183
531
2,992
3,223
8.3
8.5
14.7
18.3
8.2
6.6
0.8
0.7
9.8
11.0
0.5
0.4
MT Educare
Buy
127
169
504
286
366
18.3
17.7
7.7
9.4
16.4
13.5
3.5
3.0
20.2
21.1
1.7
1.3
Market Outlook
September 02, 2015
Stock Watch
Company Name
Reco
CMP
Target Mkt Cap
Sales ( Čcr )
OPM(%)
EPS (Č)
PER(x)
P/BV(x)
RoE(%)
EV/Sales(x)
(Č)
Price ( Č)
( Č cr )
FY16E FY17E FY16E FY17E FY16E FY17E FY16E FY17E FY16E FY17E FY16E FY17E FY16E FY17E
zOthers
Radico Khaitan
Buy
86
112
1,149
1,565
1,687
11.9
12.4
5.4
6.6
16.0
13.1
1.3
1.2
8.0
9.0
1.2
1.2
Garware Wall Ropes
Buy
285
390
623
875
983
10.4
10.6
23.1
27.8
12.3
10.2
1.7
1.5
14.1
14.8
0.7
0.6
Wonderla Holidays
Buy
275
322
1,555
206
308
44.0
43.6
9.0
12.9
30.6
21.3
4.2
3.8
13.7
17.8
7.5
4.9
Linc Pen & Plastics
Buy
154
185
227
340
371
8.3
8.9
10.8
13.2
14.2
11.6
2.3
2.0
16.0
17.1
0.7
0.6
Source: Company, Angel Research; Note: *December year end; #September year end; &October year end; Price as on September 01, 2015
Market Outlook
September 02, 2015
Research Team Tel: 022 - 39357800
DISCLAIMER
Angel Broking Private Limited (hereinafter referred to as “Angel”) is a registered Member of National Stock Exchange of India Limited,
Bombay Stock Exchange Limited and MCX Stock Exchange Limited. It is also registered as a Depository Participant with CDSL and
Portfolio Manager with SEBI. It also has registration with AMFI as a Mutual Fund Distributor. Angel Broking Private Limited is a registered
entity with SEBI for Research Analyst in terms of SEBI (Research Analyst) Regulations, 2014 vide registration number INH000000164.
Angel or its associates has not been debarred/ suspended by SEBI or any other regulatory authority for accessing /dealing in securities
Market. Angel or its associates including its relatives/analyst do not hold any financial interest/beneficial ownership of more than 1% in
the company covered by Analyst. Angel or its associates/analyst has not received any compensation / managed or co-managed public
offering of securities of the company covered by Analyst during the past twelve months. Angel/analyst has not served as an officer,
director or employee of company covered by Analyst and has not been engaged in market making activity of the company covered by
Analyst.
This document is solely for the personal information of the recipient, and must not be singularly used as the basis of any investment
decision. Nothing in this document should be construed as investment or financial advice. Each recipient of this document should make
such investigations as they deem necessary to arrive at an independent evaluation of an investment in the securities of the companies
referred to in this document (including the merits and risks involved), and should consult their own advisors to determine the merits and
risks of such an investment.
Reports based on technical and derivative analysis center on studying charts of a stock's price movement, outstanding positions and
trading volume, as opposed to focusing on a company's fundamentals and, as such, may not match with a report on a company's
fundamentals.
The information in this document has been printed on the basis of publicly available information, internal data and other reliable sources
believed to be true, but we do not represent that it is accurate or complete and it should not be relied on as such, as this document is for
general guidance only. Angel Broking Pvt. Limited or any of its affiliates/ group companies shall not be in any way responsible for any
loss or damage that may arise to any person from any inadvertent error in the information contained in this report. Angel Broking Pvt.
Limited has not independently verified all the information contained within this document. Accordingly, we cannot testify, nor make any
representation or warranty, express or implied, to the accuracy, contents or data contained within this document. While Angel Broking
Pvt. Limited endeavors to update on a reasonable basis the information discussed in this material, there may be regulatory, compliance,
or other reasons that prevent us from doing so.
This document is being supplied to you solely for your information, and its contents, information or data may not be reproduced,
redistributed or passed on, directly or indirectly.
Neither Angel Broking Pvt. Limited, nor its directors, employees or affiliates shall be liable for any loss or damage that may arise from or
in connection with the use of this information.
Note: Please refer to the important ‘Stock Holding Disclosure' report on the Angel website (Research Section). Also, please refer to the
latest update on respective stocks for the disclosure status in respect of those stocks. Angel Broking Pvt. Limited and its affiliates may have
investment positions in the stocks recommended in this report.