Market Outlook
October 01, 2015
Market Cues
Domestic Indices
Chg (%)
(Pts)
(Close)
Indian markets are expected to open in green tracking the SGX Nifty and the Asian
BSE Sensex
1.5
376
26,155
cues.
Nifty
1.3
106
7,949
The U.S. Stocks ended in green led partly by reaction to rallies by stocks overseas,
Mid Cap
1.7
182
10,799
with most markets across Europe and the Asia-Pacific region seeing considerable
Small Cap
1.1
117
11,021
strength on the day and stronger than expected private sector job growth in the
Bankex
(0.4)
(88)
19,682
month of September.
The European markets also ended the session in positive led by mining stocks which
Global Indices
Chg (%)
(Pts)
(Close)
bounced back after Glencore, which had a few turbulent sessions of late, reassured
Dow Jones
1.5
236
16,285
investors that it has taken proactive steps to position the company to withstand
Nasdaq
2.3
103
4,620
current commodity market conditions and USA private sector employment growth
FTSE
2.6
152
6,062
also provided support to the markets.
Nikkei
2.7
457
17,388
Indian shares rose for a second day, with a dovish outlook by the RBI, a firming
Hang Seng
1.4
290
20,846
trend in rupee and positive global cues. News that India has surpassed U.S. and
Shanghai Com
0.5
15
3,053
China as the biggest Foreign Direct Investment (FDI) destination in the first half of
2015 and a significant improvement in India's ranking in this year's Global
Competitiveness Index also raised hopes that the Indian economy will likely expand
Advances / Declines
Bse
Nse
by a faster clip this year than last year's 7.3 percent.
Advances
1,672
1,010
Declines
1,001
478
News Analysis
Unchanged
101
74
HCL Technologies- Pre-Quarter Guidance for 1QFY2016
Glaxo Pharmaceuticals-Update
Detailed analysis on Pg2
Volumes (` Cr)
BSE
4,344
Investor’s Ready Reckoner
NSE
20,153
Key Domestic & Global Indicators
Stock Watch: Latest investment recommendations on 150+ stocks
Net Inflows (` Cr)
Net
Mtd
Ytd
Refer Pg5 onwards
FII
(1,111)
(5,918)
1,17,842
Top Picks
MFs
1,032
7,708
78,356
CMP
Target
Upside
Company
Sector
Rating
(`)
(`)
(%)
Top Gainers
Price (`)
Chg (%)
Aurobindo
Pharma
Buy
768
872
13.5
Axis Bank
Financials
Buy
496
701
41.5
Rtnpower
7
12.2
ICICI Bank
Financials
Buy
270
370
36.9
Natcopharm
8
10.1
Infosys
IT
Buy
1,160
1,306
12.5
Monsanto
2,603
8.4
Inox Wind
Capital Goods
Buy
359
505
40.7
Godrejprop
329
7.6
More Top Picks on Pg3
Wockpharma
1,526
7.3
Key Upcoming Events
Previous
Consensus
Top Losers
Price (`)
Chg (%)
Date
Region
Event Description
Reading
Expectations
Dishtv
106
(3.8)
Oct 01
US
Initial Jobless claims
267.00
271.00
Renuka
7
(3.7)
UK
PMI Manufacturing
51.50
51.30
Idbi
79
(3.2)
Oct 08
UK
BOE Announces rates
0.50
0.50
Unionbank
175
(2.8)
Oct 09
India
Imports YoY%
(9.95)
--
J&Kbank
90
(2.4)
India
Exports YoY%
(20.66)
--
As on September 30, 2015
Oct 12
India
Industrial Production YoY
(4.20)
--
Full list on Pg4
Market Outlook
October 01, 2015
HCL Technologies- Pre-Quarter Guidance for 1QFY2016
For 1QFY2016, the company has given a pre-quarter guidance indicating that
revenues to be reported in US dollar to have an adverse impact of 80bps on
account of sharp depreciation of multiple currencies against US dollar. The
company expects tepid revenue growth in the first quarter on account of 1) adverse
currency impact, b) a client specific issue, and c) skewness in revenue growth due
to transition timelines for complex engagements in infrastructure services.
In one of the multi-million custom application development project being executed
for one of the customers certain differences have arisen on with the customer. The
company reserved up to US$20mn as a matter of prudence. These factors will
have a significant impact on the overall performance of the company in
1QFY2016. Though currency is a quarterly impact, the client specific issues can
have an impact for the FY2016 numbers. Though exact impact is not ascertained,
as of now hence we are not changing our numbers and will wait for more clarity
on the issue. However, we believe that the worst case scenario, the impact would
be around 5-6% on EPS in FY2016. We currently maintain our buy with a price
target of `1,132.
Glaxo Pharmaceuticals-Update
Company has completed its transaction with Novartis Healthcare Pvt. Ltd.
(‘Novartis India’) on September 30, 2015 whereby the Company has acquired
Novartis’ vaccines business and divested its marketed oncology portfolio to
Novartis India. This follows a global transaction between GlaxoSmithKline plc, UK
(GSK) and Novartis AG, Switzerland (Novartis) which was completed in March
2015 on the same basis.
The acquisition of the vaccines business of Novartis provides GSK an exciting
opportunity to build an even stronger, sustainable global vaccines business. The
transaction will enhance GSK’s vaccines portfolio and bring together its expertise
in virology, bacterial infection and technological platforms to deliver a reliable
supply of high quality vaccines. We remain neutral on the stock.
Economic and Political News
Apr-Aug fiscal deficit at 66.5% of Budget estimate
India's August core industries output jumps 2.6%
India Ratings maintains negative outlook on the toll roads sector
Corporate News
SBI, Bank of Baroda allot shares to government for capital infusion
Reliance Communications to partner Reliance Jio in 4G services
Bharat Electronics to set up new facility in Andhra
Market Outlook
October 01, 2015
Top Picks ★★★★★
Large Cap
Market Cap
CMP
Target
Upside
Company
Rationale
(` Cr)
(`)
(`)
(%)
Robust US sales along with the acquisations, will aid the growth
Aurobindo
44,854
768
872
13.5
and stable margins.
Healthy pace of branch expansion, backed by distribution
Axis Bank
1,17,820
496
701
41.5
network.
Robust franchise and capital adequacy position will help the
ICICI Bank
1,56,951
270
370
36.9
bank to outperform the industry average.
Back on the growth trend, expect a long term growth of 14% to
Infosys
2,66,549
1,160
1,306
12.5
be a US$20bn in FY2020.
Government thrust on Renewable sector and strong order book
Inox Wind
7,962
359
505
40.7
would drive future growth.
LICHF continues to grow its retail loan book at a healthy pace
LIC HFL
23,729
470
570
21.2
with improvement in asset quality.
Direct beneficiary of the huge investments lined up in the power
Power Grid
69,135
132
170
28.6
transmission sector.
Growth to pick up from 2HFY2017, attractive given the risk-
TCS
5,06,860
2,588
3,168
22.4
reward.
Tech Mahindra
53,691
558
646
15.8
Acquisitions, to drive growth, normalised valuations attractive.
An improving liability franchise, capital adequacy well above
Yes Bank
30,553
730
953
30.6
Basel III requirements and lowest NPA ratio in the industry.
FY2017, to be a good year for the company in terms of growth
Sun Pharma
2,08,987
868
950
9.4
and margins.
Source: Company, Angel Research
Mid Cap
Market Cap
CMP
Target
Upside
Company
Rationale
(` Cr)
(`)
(`)
(%)
Bajaj Electricals
2,518
250
341
36.6
Visible turnaround in E&P business to drive the earnings.
Garware Wall Ropes
733
335
390
16.5
Higher exports & easing material prices to drive profitability.
Comfortable balance sheet to support strong growth; this
MBL Infrastructures
1,002
242
360
49.0
coupled with attractive valuation to lead to rerating.
New product introductions and increased sourcing by clients to
Minda Industries
811
511
652
27.6
enable outpace industry growth.
Strong brand & quality teaching with innovative technologies &
MT Educare
511
128
169
31.6
higher government educational spending to boost growth.
Earnings boost on back of stable material prices and favourable
Radico Khaitan
1,122
84
112
32.9
pricing environment. Valuation discount to peers provides
additional comfort.
Structural shift in the Lighting industry towards LED lighting will
Surya Roshni
576
131
183
39.4
drive growth.
Tree House
1,273
301
449
49.3
Robust expansion plan for pre-schools to drive growth.
Source: Company, Angel Research
Market Outlook
October 01, 2015
Global economic events release calendar
Date
Time
Country
Event Description
Unit
Period
Bloomberg Data
Last Reported Estimated
Oct 1, 2015
1:25PM
Germany PMI Manufacturing
Value
Sep F
52.50
52.50
6:00PM
US
Initial Jobless claims
Thousands
Sep 25
267.00
271.00
6:30AM
China
PMI Manufacturing
Value
Sep
49.70
49.70
2:00PM
UK
PMI Manufacturing
Value
Sep
51.50
51.30
Oct 2, 2015
6:00PM
US
Change in Nonfarm payrolls
Thousands
Sep
173.00
200.00
6:00PM
US
Unnemployment rate
%
Sep
5.10
5.10
Oct 5, 2015
1:25PM
Germany PMI Services
Value
Sep F
54.30
--
Oct 7, 2015
2:00PM
UK
Industrial Production (YoY)
% Change
Aug
0.80
--
Oct 8, 2015
4:30PM
UK
BOE Announces rates
% Ratio
Oct 8
0.50
0.50
Oct 9, 2015
India
Imports YoY%
% Change
Sep
(9.95)
--
India
Exports YoY%
% Change
Sep
(20.66)
--
Oct 12, 2015
5:30PM
India
Industrial Production YoY
% Change
Aug
4.20
--
Oct 13, 2015
2:00PM
UK
CPI (YoY)
% Change
Sep
--
--
China
Exports YoY%
% Change
Sep
(5.50)
--
Oct 14, 2015
2:00PM
UK
Jobless claims change
% Change
Sep
1.20
--
12:00PM
India
Monthly Wholesale Prices YoY%
% Change
Sep
(4.95)
--
7:00AM
China
Consumer Price Index (YoY)
% Change
Sep
2.00
--
Oct 15, 2015
6:00PM
US
Consumer price index (mom)
% Change
Sep
(0.10)
--
Oct 16, 2015
6:45PM
US
Industrial Production
%
Sep
(0.38)
--
2:30PM
Euro Zone Euro-Zone CPI (YoY)
%
Sep F
(0.10)
--
Oct 19, 2015
7:30AM
China
Industrial Production (YoY)
% Change
Sep
6.10
--
7:30AM
China
Real GDP (YoY)
% Change
3Q
7.00
--
Oct 20, 2015
6:00PM
US
Housing Starts
Thousands
Sep
1,126.00
--
6:00PM
US
Building permits
Thousands
Sep
1,161.00
--
Oct 22, 2015
7:30PM
Euro Zone Euro-Zone Consumer Confidence
Value
Oct A
(7.10)
--
7:30PM
US
Existing home sales
Million
Sep
5.31
--
5:15PM
Euro Zone ECB announces interest rates
%
Oct 22
0.05
--
Oct 26, 2015
7:30PM
US
New home sales
Thousands
Sep
552.00
--
Oct 27, 2015
7:30PM
US
Consumer Confidence
S.A./ 1985=100
Oct
103.04
--
Oct 28, 2015
11:30PM
US
FOMC rate decision
%
Oct 28
0.25
0.25
Oct 29, 2015
6:00PM
US
GDP Qoq (Annualised)
% Change
3Q A
3.90
--
Source: Bloomberg, Angel Research
Market Outlook
October 01, 2015
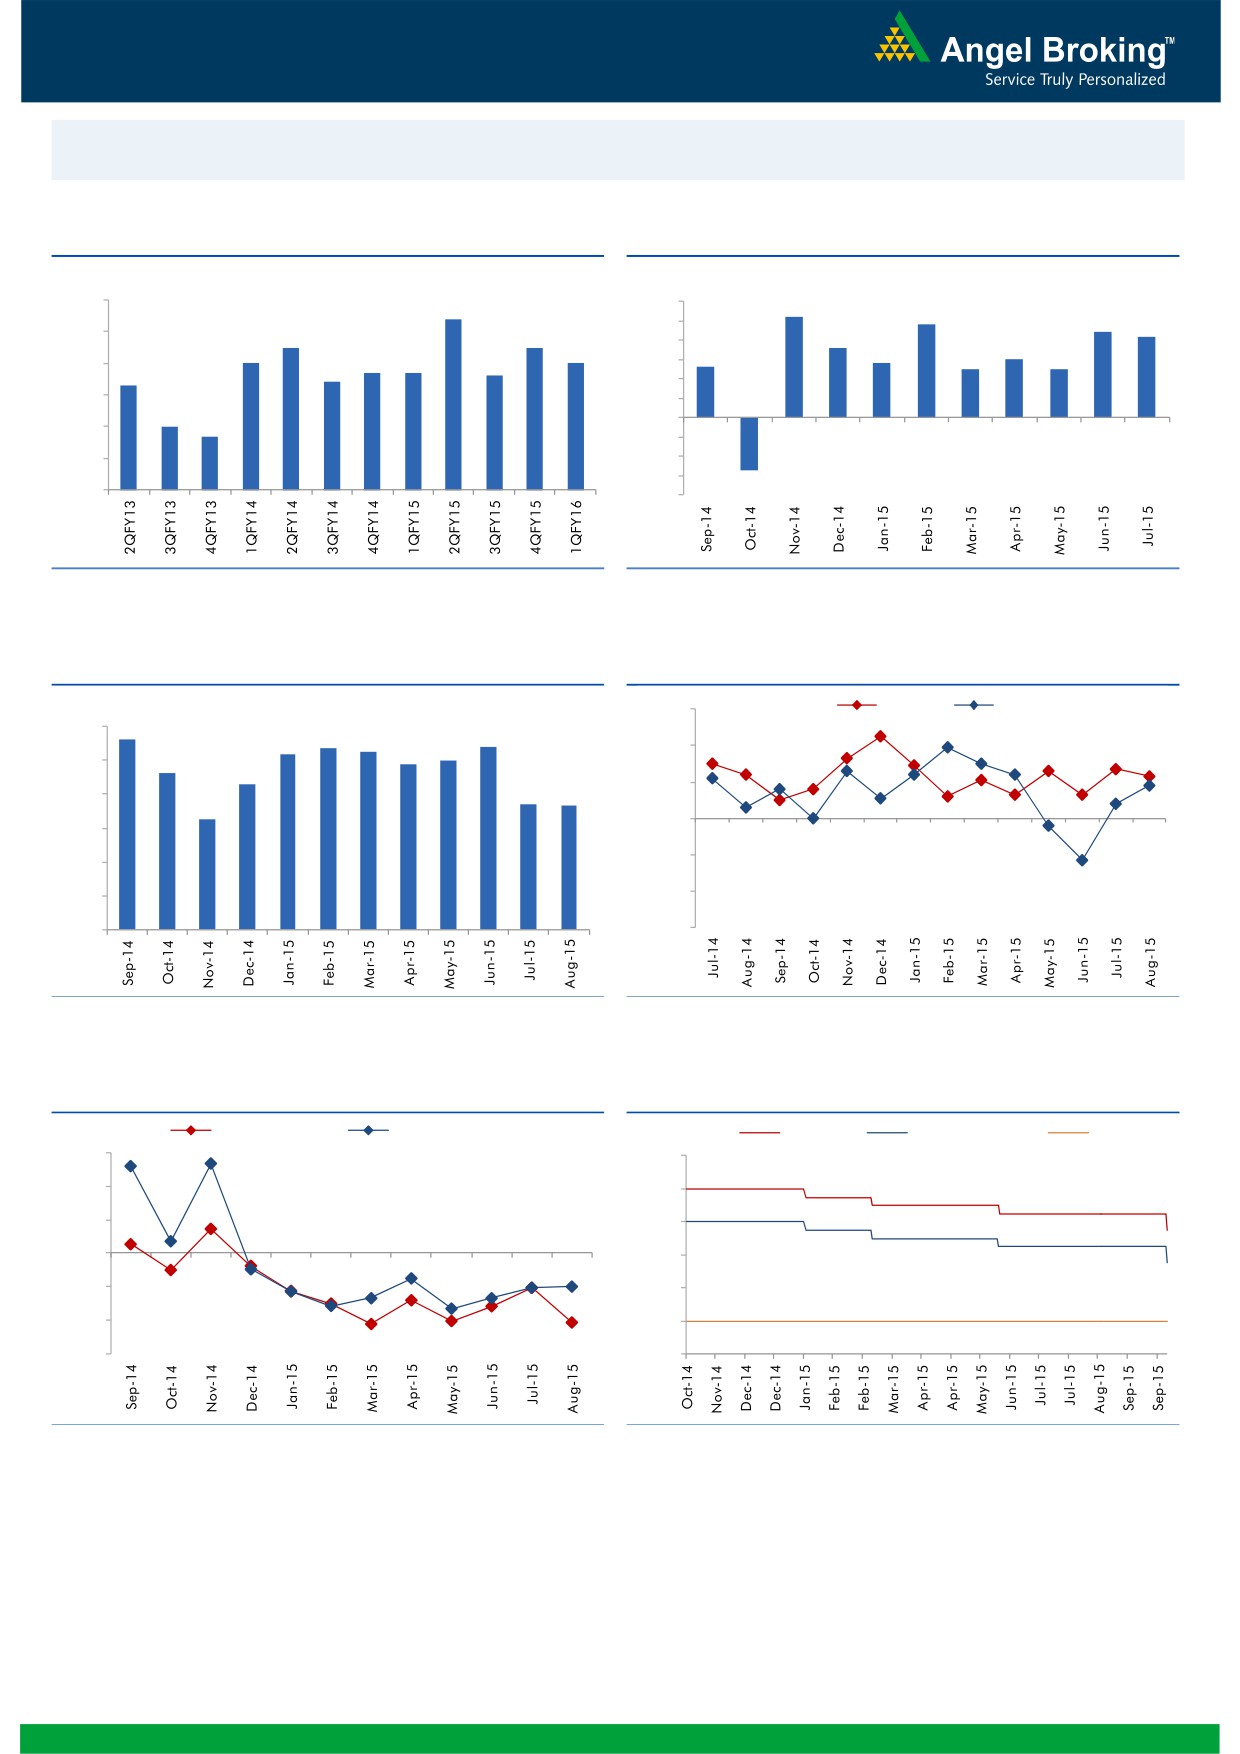
Macro watch
Exhibit 1: Quarterly GDP trends
Exhibit 2: IIP trends
(%)
(%)
9.0
8.4
6.0
5.2
4.8
5.0
4.4
4.2
8.0
7.5
7.5
3.6
4.0
3.0
7.0
7.0
2.8
6.7
6.7
2.6
2.5
2.5
7.0
6.6
3.0
6.3
6.4
2.0
6.0
1.0
5.0
4.7
-
5.0
(1.0)
4.0
(2.0)
(3.0)
3.0
(2.7)
(4.0)
Source: CSO, Angel Research
Source: MOSPI, Angel Research
Exhibit 3: Monthly CPI inflation trends
Exhibit 4: Manufacturing and services PMI
(%)
56.0
Mfg. PMI
Services PMI
5.6
6.0
5.4
5.4
5.2
5.3
4.9
5.0
54.0
5.0
4.6
4.3
52.0
3.7
3.7
4.0
3.3
50.0
3.0
48.0
2.0
1.0
46.0
-
44.0
Source: MOSPI, Angel Research
Source: Market, Angel Research; Note: Level above 50 indicates expansion
Exhibit 5: Exports and imports growth trends
Exhibit 6: Key policy rates
(%)
Exports yoy growth
Imports yoy growth
(%)
Repo rate
Reverse Repo rate
CRR
30.0
9.00
20.0
8.00
10.0
7.00
0.0
6.00
(10.0)
5.00
(20.0)
4.00
(30.0)
3.00
Source: Bloomberg, Angel Research
Source: RBI, Angel Research
Market Outlook
October 01, 2015
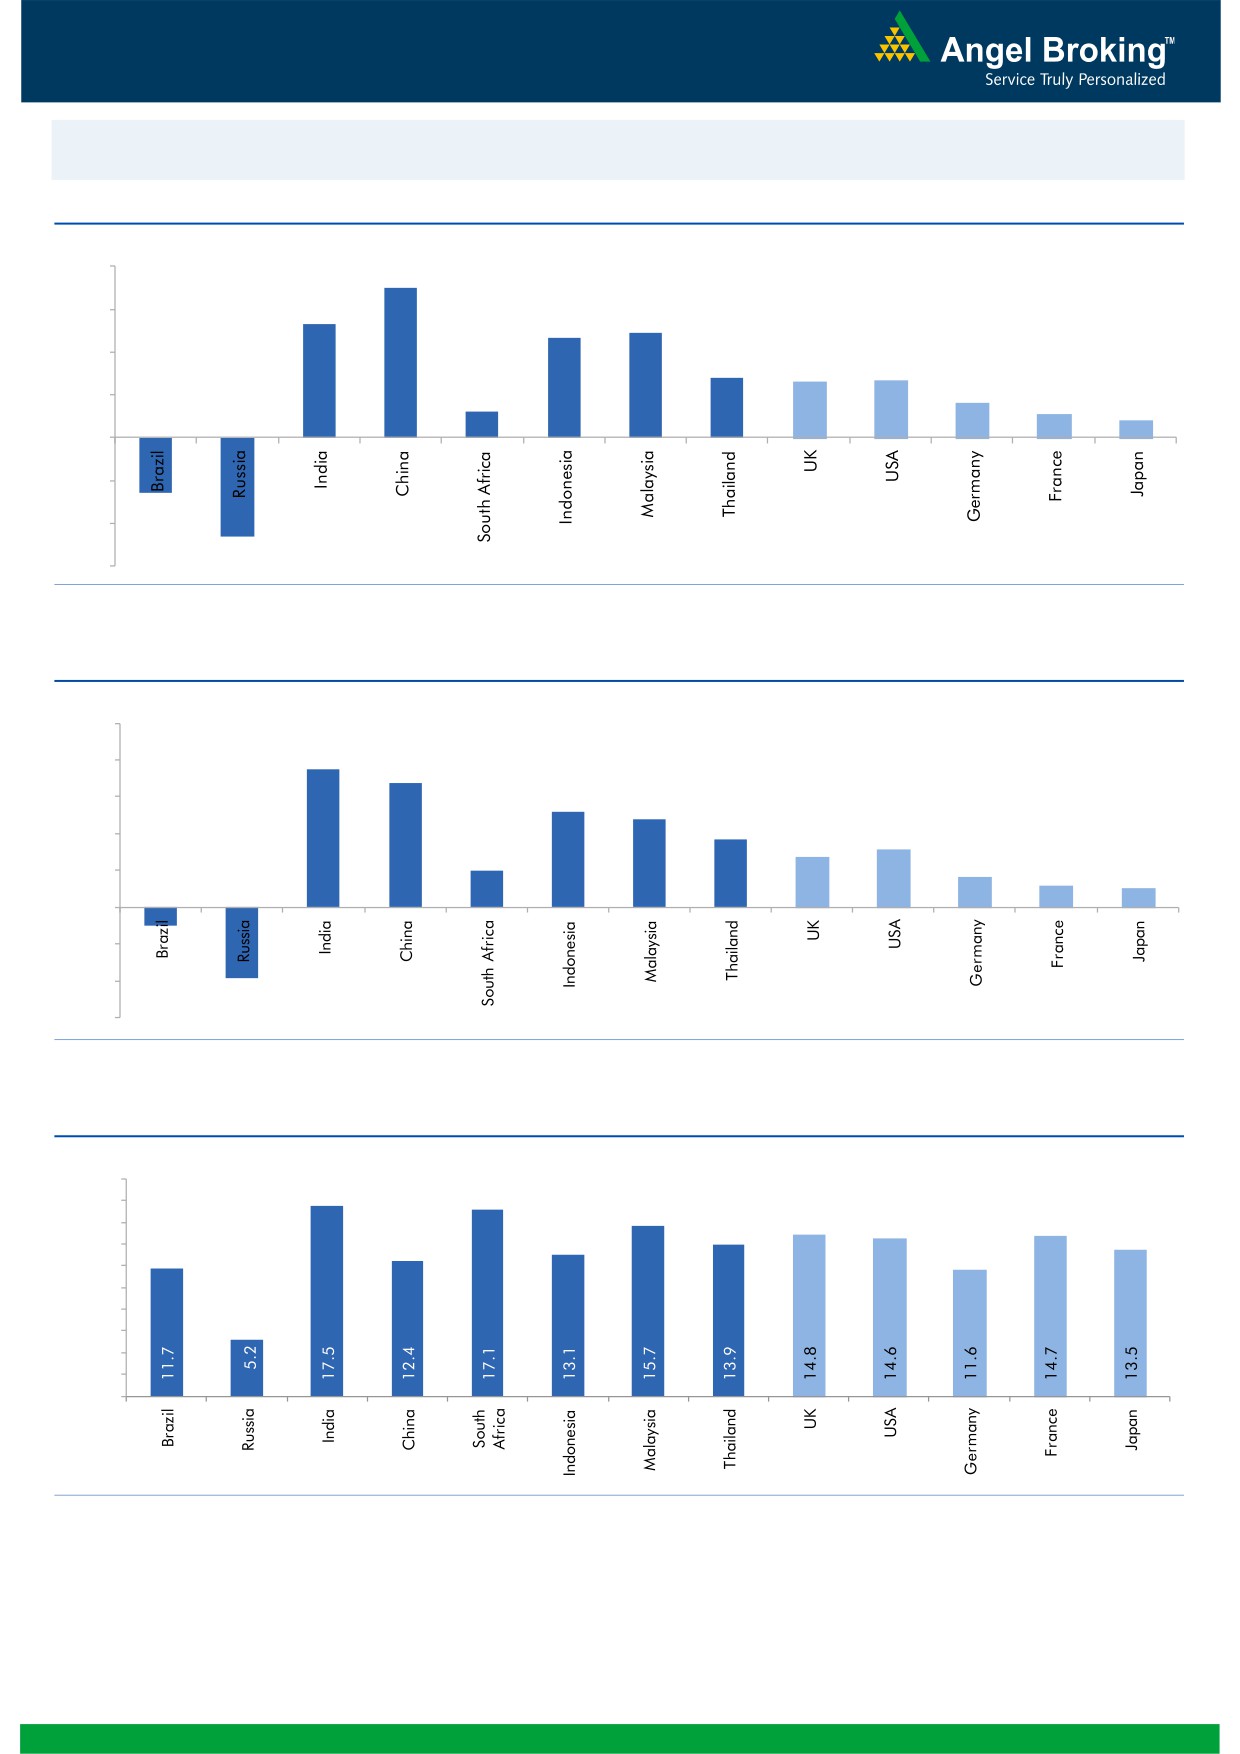
Global watch
Exhibit 1: Latest quarterly GDP Growth (%, yoy) across select developing and developed countries
(%)
8.0
7.0
5.3
6.0
4.9
4.7
4.0
2.8
2.6
2.7
1.6
2.0
1.2
1.1
0.8
-
(2.0)
(2.6)
(4.0)
(4.6)
(6.0)
Source: Bloomberg, Angel Research
Exhibit 2: 2015 GDP Growth projection by IMF (%, yoy) across select developing and developed countries
(%)
10.0
7.5
8.0
6.8
6.0
5.2
4.8
3.7
4.0
3.1
2.7
2.0
1.6
2.0
1.2
1.0
-
(2.0)
(1.0)
(4.0)
(3.8)
(6.0)
Source: IMF, Angel Research
Exhibit 3: One year forward P-E ratio across select developing and developed countries
(x)
20.0
18.0
16.0
14.0
12.0
10.0
8.0
6.0
4.0
2.0
-
Source: IMF, Angel Research
Market Outlook
October 01, 2015
Exhibit 4: Relative performance of indices across globe
Returns (%)
Country
Name of index
Closing price
1M
3M
1YR
Brazil
Bovespa
45,059
(4.4)
(15.1)
(19.5)
Russia
Micex
1,643
(5.2)
0.1
16.7
India
Nifty
7,949
(0.0)
(5.0)
(2.4)
China
Shanghai Composite
3,053
(1.0)
(28.6)
31.1
South Africa
Top 40
44,881
1.1
(2.7)
1.5
Mexico
Mexbol
42,633
(1.5)
(5.1)
(5.2)
Indonesia
LQ45
705
(8.3)
(15.9)
(19.6)
Malaysia
KLCI
1,621
2.6
(5.2)
(11.9)
Thailand
SET 50
869
(4.1)
(12.8)
(17.8)
USA
Dow Jones
16,285
(2.2)
(7.6)
(3.1)
UK
FTSE
6,062
(3.0)
(8.3)
(6.0)
Japan
Nikkei
17,388
(5.4)
(16.0)
8.2
Germany
DAX
9,660
(5.8)
(13.0)
2.0
France
CAC
4,455
(4.2)
(7.9)
3.9
Source: Bloomberg, Angel Research
Stock Watch
October 01, 2015
Company Name
Reco
CMP
Target
Mkt Cap
Sales ( Čcr )
OPM(%)
EPS (Č)
PER(x)
P/BV(x)
RoE(%)
EV/Sales(x)
(Č)
Price ( Č)
( Č cr )
FY16E FY17E
FY16E
FY17E
FY16E
FY17E
FY16E
FY17E
FY16E
FY17E
FY16E
FY17E
FY16E
FY17E
Agri / Agri Chemical
Rallis
Neutral
220
-
4,271
2,075
2,394
14.4
14.4
9.5
11.0
23.1
20.0
4.6
4.0
21.1
21.3
2.1
1.8
United Phosphorus
Accumulate
458
510
19,626
13,698
15,752
17.6
17.6
32.1
38.5
14.3
11.9
2.8
2.3
21.4
21.3
1.5
1.3
Auto & Auto Ancillary
Ashok Leyland
Accumulate
92
97
26,239
18,186
21,529
10.8
11.2
3.3
4.5
27.9
20.5
4.8
4.4
17.3
21.6
1.4
1.2
Bajaj Auto
Accumulate
2,310
2,438
66,837
23,544
27,245
19.8
19.8
127.0
143.4
18.2
16.1
5.5
4.7
30.3
29.4
2.4
2.0
Eicher Motors
Buy
17,792
22,859
48,291
11,681
15,550
15.3
16.9
358.5
564.3
49.6
31.5
14.9
11.1
29.8
34.9
4.0
3.0
Hero Motocorp
Accumulate
2,396
2,672
47,838
28,500
32,764
14.1
14.3
146.9
167.0
16.3
14.4
6.2
5.2
37.8
36.5
1.5
1.3
L G Balakrishnan & Bros Neutral
439
-
690
1,254
1,394
11.6
11.8
35.9
41.7
12.3
10.6
1.7
1.5
13.5
13.8
0.7
0.6
Mahindra and Mahindra Accumulate
1,261
1,383
78,301
38,337
43,069
13.0
13.4
52.9
63.5
23.8
19.9
3.6
3.2
15.0
15.9
1.7
1.4
Maruti
Neutral
4,689
-
141,654
58,102
68,587
16.7
16.9
182.0
225.5
25.8
20.8
5.1
4.4
19.9
21.0
2.2
1.8
Minda Industries
Buy
511
652
811
2,567
2,965
7.3
8.0
38.8
54.3
13.2
9.4
1.9
1.6
14.4
16.8
0.4
0.3
Rane Brake Lining
Buy
288
366
228
454
511
11.1
11.4
23.8
28.1
12.1
10.3
1.7
1.6
14.2
15.3
0.6
0.6
Setco Automotive
Neutral
231
-
616
594
741
12.7
13.7
8.4
15.8
27.5
14.6
2.9
2.5
10.4
16.9
1.5
1.2
Tata Motors
Neutral
298
-
86,169
264,038
297,882
13.8
13.9
34.5
38.9
8.7
7.7
1.5
1.2
17.6
16.8
0.5
0.5
TVS Motor
Neutral
230
-
10,937
11,702
13,713
6.8
7.7
10.1
14.5
22.8
15.9
5.6
4.5
24.5
28.3
0.9
0.8
Amara Raja Batteries
Neutral
1,028
-
17,559
5,101
6,224
17.8
17.6
31.1
39.2
33.1
26.2
8.2
6.5
24.8
24.8
3.4
2.7
Exide Industries
Neutral
155
-
13,201
7,363
8,247
13.7
14.5
6.6
7.7
23.5
20.2
3.0
2.7
12.6
13.3
1.5
1.4
Apollo Tyres
Neutral
180
-
9,157
12,576
12,978
16.8
16.1
22.3
19.9
8.1
9.0
1.4
1.2
17.2
13.4
0.8
0.8
Ceat
Neutral
1,281
-
5,181
6,041
6,597
14.3
14.2
101.5
116.6
12.6
11.0
2.5
2.1
20.0
19.1
1.0
0.9
JK Tyres
Neutral
102
-
2,308
7,446
7,669
15.2
14.0
19.6
18.4
5.2
5.5
1.3
1.1
25.2
19.5
0.7
0.6
Swaraj Engines
Neutral
872
-
1,083
593
677
14.5
14.8
51.2
60.8
17.0
14.3
4.0
3.6
23.3
24.8
1.7
1.4
Subros
Neutral
77
-
464
1,268
1,488
11.6
11.9
3.7
6.6
20.9
11.7
1.4
1.3
6.8
11.4
0.7
0.6
Indag Rubber
Neutral
173
-
454
283
329
17.0
17.2
13.0
15.4
13.4
11.2
2.9
2.4
21.8
21.6
1.3
1.1
Capital Goods
ACE
Neutral
37
-
369
660
839
4.7
8.2
1.0
3.9
37.3
9.6
1.2
1.0
3.2
11.3
0.7
0.6
BEML
Neutral
1,241
-
5,166
3,277
4,006
6.0
8.9
29.2
64.3
42.5
19.3
2.4
2.2
5.7
11.7
1.7
1.3
BGR Energy
Neutral
106
-
764
3,615
3,181
9.5
9.4
16.7
12.4
6.3
8.5
0.6
0.6
10.0
7.0
0.6
0.8
BHEL
Neutral
206
-
50,310
33,722
35,272
10.8
11.7
10.5
14.2
19.6
14.5
1.5
1.4
7.0
9.0
1.6
1.5
Blue Star
Accumulate
352
387
3,162
3,649
4,209
5.0
5.9
9.2
14.7
38.4
23.9
6.9
6.5
9.1
17.5
1.0
0.8
Crompton Greaves
Buy
170
204
10,673
13,484
14,687
4.9
6.2
4.5
7.1
37.8
24.0
2.7
2.5
7.2
10.8
0.9
0.8
Inox Wind
Buy
359
505
7,962
4,980
5,943
17.0
17.5
26.6
31.6
13.5
11.4
4.0
3.0
35.0
30.0
1.7
1.4
Stock Watch
October 01, 2015
Company Name
Reco
CMP
Target
Mkt Cap
Sales ( Čcr )
OPM(%)
EPS (Č)
PER(x)
P/BV(x)
RoE(%)
EV/Sales(x)
(Č)
Price ( Č)
( Č cr )
FY16E
FY17E
FY16E
FY17E
FY16E
FY17E
FY16E
FY17E
FY16E
FY17E
FY16E
FY17E
FY16E
FY17E
Capital Goods
KEC International
Neutral
142
-
3,646
8,791
9,716
6.1
6.8
5.4
8.2
26.3
17.3
2.6
2.4
10.0
14.0
0.6
0.6
Thermax
Neutral
852
-
10,152
6,413
7,525
7.4
8.5
30.5
39.3
27.9
21.7
4.3
3.7
15.0
17.0
1.6
1.3
Cement
ACC
Buy
1,344
1,548
25,236
11,856
14,092
14.5
17.8
47.6
76.1
28.2
17.7
2.9
2.7
10.6
15.7
2.0
1.6
Ambuja Cements
Accumulate
206
233
31,915
10,569
12,022
20.7
22.2
8.7
10.7
23.6
19.2
3.0
2.8
13.0
15.2
2.6
2.3
India Cements
Buy
78
112
2,399
4,716
5,133
15.9
16.9
3.7
7.5
21.1
10.4
0.8
0.7
3.8
7.3
0.8
0.7
JK Cement
Buy
656
767
4,588
4,056
4,748
14.5
17.0
22.6
41.1
29.0
16.0
2.6
2.3
9.3
15.3
1.6
1.3
J K Lakshmi Cement
Buy
371
430
4,360
2,947
3,616
16.7
19.9
11.5
27.2
32.2
13.6
3.1
2.6
9.8
20.8
1.9
1.5
Mangalam Cements
Neutral
219
-
585
1,053
1,347
10.5
13.3
8.4
26.0
26.1
8.4
1.1
1.0
4.3
12.5
0.9
0.7
Orient Cement
Buy
158
183
3,232
1,854
2,524
21.2
22.2
7.7
11.1
20.5
14.2
2.9
2.5
13.3
15.7
2.5
1.7
Ramco Cements
Accumulate
328
350
7,801
4,036
4,545
20.8
21.3
15.1
18.8
21.7
17.4
2.7
2.4
12.9
14.3
2.4
2.1
Shree Cement^
Neutral
11,777
-
41,029
7,150
8,742
26.7
28.6
228.0
345.5
51.7
34.1
7.6
6.4
15.7
20.3
5.5
4.4
UltraTech Cement
Buy
2,680
3,282
73,537
27,562
31,548
20.4
22.3
111.9
143.3
24.0
18.7
3.4
2.9
15.2
16.8
2.7
2.3
Construction
ITNL
Neutral
99
-
2,438
7,360
8,825
34.0
35.9
1.0
5.0
98.8
19.8
0.4
0.4
0.3
1.4
3.8
3.7
KNR Constructions
Neutral
560
-
1,574
915
1,479
14.3
13.9
20.3
37.2
27.6
15.0
2.5
2.2
9.6
15.6
1.8
1.2
Larsen & Toubro
Buy
1,467
2,013
136,500
68,920
82,446
10.9
11.5
57.0
73.0
25.7
20.1
2.4
2.2
13.6
15.5
2.2
1.8
Gujarat Pipavav Port
Neutral
185
-
8,944
721
784
53.1
53.6
8.2
9.1
22.5
20.3
3.6
2.9
20.0
18.3
12.0
10.6
MBL Infrastructures
Buy
242
360
1,002
2,313
2,797
12.2
14.6
19.0
20.0
12.7
12.1
1.3
1.2
11.3
10.6
1.1
1.0
Nagarjuna Const.
Neutral
75
-
4,153
7,892
8,842
8.3
9.1
2.4
5.3
31.1
14.1
1.3
1.2
4.2
8.6
0.8
0.6
PNC Infratech
Neutral
497
-
2,549
1,798
2,132
13.2
13.5
22.0
30.0
22.6
16.6
2.0
1.8
11.5
11.4
1.5
1.3
Simplex Infra
Neutral
290
-
1,434
6,241
7,008
10.4
10.7
20.0
36.0
14.5
8.1
1.2
1.1
6.8
11.1
0.7
0.6
Financials
Allahabad Bank
Neutral
77
-
4,388
8,438
9,521
2.8
2.8
21.9
27.0
3.5
2.9
0.4
0.3
10.2
11.5
-
-
Axis Bank
Buy
496
701
117,820
26,941
32,298
3.5
3.6
37.4
46.4
13.3
10.7
2.7
2.3
18.7
20.0
-
-
Bank of Baroda
Neutral
183
-
40,537
19,027
21,737
1.9
2.0
16.9
24.5
10.9
7.5
1.0
0.9
9.1
12.1
-
-
Bank of India
Neutral
136
-
9,013
16,438
18,706
1.9
2.0
19.2
40.9
7.1
3.3
0.4
0.3
4.5
9.1
-
-
Canara Bank
Neutral
280
-
14,410
15,491
17,269
2.0
2.0
61.6
70.9
4.5
3.9
0.5
0.5
10.5
11.1
-
-
Dena Bank
Neutral
40
-
2,228
3,498
3,977
2.1
2.3
7.8
10.7
5.1
3.7
0.4
0.3
6.5
8.4
-
-
Federal Bank
Neutral
64
-
10,987
3,527
4,135
3.0
3.1
5.2
6.7
12.3
9.6
1.3
1.2
10.8
12.7
-
-
HDFC
Neutral
1,213
-
191,412
10,883
12,799
3.5
3.4
43.0
50.6
28.2
24.0
5.6
5.1
25.9
26.7
-
-
HDFC Bank
Buy
1,069
1,255
269,170
38,059
46,851
4.4
4.5
50.0
62.7
21.4
17.1
3.7
3.2
18.8
20.2
-
-
Stock Watch
October 01, 2015
Company Name
Reco
CMP
Target
Mkt Cap
Sales ( Čcr )
OPM(%)
EPS (Č)
PER(x)
P/BV(x)
RoE(%)
EV/Sales(x)
(Č)
Price ( Č)
( Č cr )
FY16E
FY17E
FY16E
FY17E
FY16E
FY17E
FY16E
FY17E
FY16E
FY17E
FY16E
FY17E
FY16E
FY17E
Financials
ICICI Bank
Buy
270
370
156,951
35,810
41,871
3.4
3.5
22.0
26.2
12.3
10.3
2.2
1.8
15.0
15.6
-
-
IDBI Bank
Neutral
79
-
12,631
9,860
10,978
1.8
1.9
9.3
15.6
8.5
5.1
0.6
0.5
6.4
10.1
-
-
Indian Bank
Neutral
135
-
6,498
6,267
7,171
2.4
2.5
25.4
32.1
5.3
4.2
0.4
0.4
8.0
9.3
-
-
LIC Housing Finance
Buy
470
570
23,729
2,934
3,511
2.3
2.3
30.9
36.8
15.2
12.8
2.5
2.1
16.8
17.5
-
-
Oriental Bank
Neutral
130
-
3,912
7,730
8,595
2.4
2.5
38.8
47.4
3.4
2.8
0.3
0.3
8.6
9.8
-
-
Punjab Natl.Bank
Neutral
133
-
24,749
23,446
26,624
2.8
2.9
17.8
27.5
7.5
4.9
0.7
0.6
8.5
12.1
-
-
South Ind.Bank
Neutral
23
-
3,058
1,930
2,215
2.4
2.4
2.6
3.6
8.7
6.3
0.9
0.8
9.9
12.5
-
-
St Bk of India
Buy
237
307
179,509
83,847
96,307
2.8
2.8
20.1
25.1
11.8
9.5
1.3
1.1
11.5
13.1
-
-
Union Bank
Neutral
175
-
11,136
12,755
14,439
2.3
2.4
31.5
39.9
5.6
4.4
0.6
0.5
9.9
11.6
-
-
Vijaya Bank
Neutral
34
-
2,955
3,594
3,969
1.8
1.9
5.8
7.1
5.9
4.9
0.5
0.5
8.2
9.3
-
-
Yes Bank
Buy
730
953
30,553
7,204
9,078
3.2
3.2
57.8
69.5
12.6
10.5
2.3
1.9
19.6
22.6
-
-
FMCG
Asian Paints
Neutral
841
-
80,678
16,553
19,160
16.0
16.2
17.7
21.5
47.6
39.1
12.6
11.4
29.4
31.2
4.7
4.1
Britannia
Neutral
3,083
-
36,987
8,065
9,395
9.6
10.2
47.2
65.5
65.3
47.1
21.7
20.5
38.3
41.2
4.4
3.8
Colgate
Neutral
961
-
26,126
4,836
5,490
19.5
19.7
48.5
53.2
19.8
18.1
14.5
12.6
99.8
97.5
5.3
4.7
Dabur India
Neutral
276
-
48,541
9,370
10,265
17.1
17.2
7.3
8.1
37.7
34.1
11.4
9.2
33.7
30.6
5.1
4.6
GlaxoSmith Con*
Neutral
6,035
-
25,382
4,919
5,742
17.2
17.4
168.3
191.2
35.9
31.6
10.2
8.7
28.8
28.9
4.7
4.0
Godrej Consumer
Neutral
1,216
-
41,404
10,168
12,886
16.1
16.1
32.1
38.4
37.9
31.7
7.7
7.1
19.7
21.0
4.2
3.3
HUL
Neutral
813
-
175,987
34,940
38,957
17.5
17.7
20.8
24.7
39.1
32.9
43.5
34.8
110.5
114.2
4.8
4.3
ITC
Buy
329
409
263,991
41,068
45,068
37.8
37.4
13.9
15.9
23.6
20.7
7.9
7.0
34.1
33.8
6.1
5.5
Marico
Neutral
404
-
26,087
6,551
7,766
15.7
16.0
10.4
12.5
39.0
32.4
11.3
9.4
33.2
32.4
3.9
3.3
Nestle*
Neutral
6,350
-
61,227
11,291
12,847
22.2
22.3
158.9
184.6
40.0
34.4
20.9
18.8
55.0
57.3
5.3
4.6
Tata Global
Accumulate
128
144
8,059
8,635
9,072
9.8
9.9
6.5
7.6
19.7
16.8
2.0
1.9
6.8
7.4
0.9
0.8
IT
HCL Tech^
Buy
982
1,132
138,111
42,038
47,503
23.5
23.5
56.4
62.9
17.4
15.6
4.0
3.1
23.2
19.8
2.9
2.3
Infosys
Accumulate
1,160
1,306
266,549
60,250
66,999
28.0
28.0
58.3
63.7
19.9
18.2
4.2
3.6
20.9
19.7
3.7
3.2
TCS
Buy
2,588
3,168
506,860
108,420
123,559
28.8
28.7
127.2
143.9
20.3
18.0
8.1
7.5
39.9
41.8
4.3
3.7
Tech Mahindra
Buy
558
646
53,691
25,566
28,890
16.0
17.0
26.3
31.9
21.2
17.5
3.8
3.3
17.9
18.6
1.9
1.6
Wipro
Buy
597
719
147,486
52,414
58,704
23.7
23.8
38.4
42.3
15.6
14.1
3.0
2.7
19.5
18.0
2.4
2.0
Media
D B Corp
Accumulate
322
356
5,909
2,241
2,495
27.8
27.9
21.8
25.6
14.8
12.6
3.9
3.4
26.7
28.5
2.6
2.3
HT Media
Neutral
81
-
1,886
2,495
2,603
11.2
11.2
7.3
8.6
11.1
9.4
0.9
0.8
7.4
8.1
0.3
0.2
Stock Watch
October 01, 2015
Company Name
Reco
CMP
Target
Mkt Cap
Sales ( Čcr )
OPM(%)
EPS (Č)
PER(x)
P/BV(x)
RoE(%)
EV/Sales(x)
(Č)
Price ( Č)
( Č cr )
FY16E FY17E
FY16E
FY17E
FY16E
FY17E
FY16E
FY17E
FY16E
FY17E
FY16E
FY17E
FY16E
FY17E
Media
Jagran Prakashan
Accumulate
142
156
4,634
1,939
2,122
26.0
26.0
8.3
9.2
17.1
15.4
2.9
2.6
17.5
17.1
2.3
2.1
Sun TV Network
Neutral
360
-
14,185
2,779
3,196
70.2
70.5
22.8
27.3
15.8
13.2
3.9
3.5
26.7
28.3
4.9
4.2
Hindustan Media
Buy
233
292
1,710
920
1,031
20.0
20.0
19.2
20.9
12.1
11.2
2.0
1.7
16.4
15.3
1.4
1.2
Ventures
Metals & Mining
Coal India
Buy
327
400
206,229
72,015
78,415
21.2
21.5
21.7
25.3
15.0
12.9
5.1
5.0
33.1
39.1
2.1
2.0
Hind. Zinc
Neutral
140
-
59,007
15,258
16,495
44.2
45.6
17.6
19.2
7.9
7.3
1.2
1.1
15.9
15.3
1.6
1.1
Hindalco
Neutral
71
-
14,589
104,356
111,186
8.7
9.5
6.7
11.1
10.5
6.4
0.4
0.4
3.5
5.9
0.7
0.6
JSW Steel
Neutral
888
-
21,470
48,125
53,595
18.8
21.0
46.9
97.5
18.9
9.1
0.9
0.9
4.4
9.5
1.3
1.1
NMDC
Neutral
93
-
36,951
8,237
10,893
46.6
44.5
10.0
11.7
9.4
8.0
1.0
0.9
12.5
13.0
4.3
3.3
SAIL
Neutral
51
-
21,249
45,915
53,954
7.2
10.5
1.5
4.4
34.2
11.8
0.5
0.5
2.3
4.1
1.1
1.0
Vedanta
Neutral
85
-
25,111
71,445
81,910
26.2
26.3
12.9
19.2
6.6
4.4
0.5
0.4
7.2
8.9
0.8
0.6
Tata Steel
Neutral
212
-
20,580
136,805
149,228
11.3
11.9
26.4
36.8
8.0
5.8
0.6
0.6
6.0
8.0
0.7
0.6
Oil & Gas
Cairn India
Neutral
153
-
28,760
11,323
12,490
49.4
51.0
20.7
20.7
7.4
7.4
0.5
0.5
6.4
6.1
1.6
0.9
GAIL
Neutral
302
-
38,321
64,856
70,933
9.1
9.6
24.0
28.9
12.6
10.5
1.1
1.0
8.8
9.6
0.8
0.7
ONGC
Neutral
230
-
196,349
154,564
167,321
36.8
37.4
28.6
32.5
8.0
7.1
1.0
0.9
12.7
13.5
1.5
1.4
Petronet LNG
Buy
179
210
13,448
39,007
40,785
3.8
4.2
9.2
11.0
19.6
16.4
2.2
2.0
11.6
12.7
0.4
0.4
Indian Oil Corp
Accumulate
402
455
97,652
359,607
402,760
5.9
6.1
42.5
48.7
9.5
8.3
1.3
1.1
14.1
14.4
0.4
0.3
Reliance Industries
Accumulate
861
930
278,667
313,085
362,904
13.1
13.8
78.4
92.9
11.0
9.3
1.2
1.0
10.8
11.6
1.3
1.2
Pharmaceuticals
Alembic Pharma
Neutral
685
-
12,905
2,601
3,115
21.2
20.2
20.8
23.9
32.9
28.6
10.6
8.0
37.2
31.8
5.0
4.1
Aurobindo Pharma
Accumulate
768
872
44,854
14,923
17,162
23.0
23.0
38.2
43.6
20.1
17.6
6.2
4.7
36.0
30.2
3.4
2.9
Aventis*
Neutral
4,111
-
9,468
2,156
2,455
15.1
16.8
109.7
133.9
37.5
30.7
5.1
4.2
18.4
22.5
4.1
3.4
Cadila Healthcare
Neutral
2,093
-
42,846
10,224
11,840
20.0
21.0
71.0
85.6
29.5
24.5
7.9
6.2
30.1
28.5
4.3
3.6
Cipla
Accumulate
638
671
51,222
14,359
16,884
21.3
19.7
28.4
30.5
22.5
20.9
4.0
3.4
19.3
17.5
3.6
3.0
Dr Reddy's
Neutral
4,155
-
70,857
18,213
21,214
22.6
22.7
163.0
192.5
25.5
21.6
5.2
4.3
22.5
20.0
3.8
3.3
Dishman Pharma
Neutral
320
-
2,582
1,716
1,888
20.2
20.2
16.3
21.6
19.6
14.8
1.8
1.6
9.7
11.7
1.7
1.4
GSK Pharma*
Neutral
3,339
-
28,286
2,870
3,158
20.0
22.1
59.5
68.3
56.1
48.9
16.6
17.0
28.5
34.3
9.4
8.6
Indoco Remedies
Neutral
322
-
2,963
1,088
1,262
18.2
18.2
13.1
15.5
24.5
20.7
4.8
4.0
21.2
21.1
2.8
2.4
Ipca labs
Accumulate
741
800
9,355
3,507
4,078
17.6
18.6
25.8
32.0
28.7
23.2
3.7
3.2
13.8
14.9
2.9
2.5
Lupin
Neutral
2,033
-
91,517
14,864
17,244
26.9
26.9
62.1
71.1
32.7
28.6
8.0
6.3
27.4
24.6
5.9
4.9
Sun Pharma
Accumulate
868
950
208,987
28,163
32,610
25.8
30.7
17.4
26.9
49.9
32.3
4.7
4.1
13.0
16.6
6.9
5.7
Stock Watch
October 01, 2015
Company Name
Reco
CMP
Target
Mkt Cap
Sales ( Čcr )
OPM(%)
EPS (Č)
PER(x)
P/BV(x)
RoE(%)
EV/Sales(x)
(Č)
Price ( Č)
( Č cr )
FY16E FY17E
FY16E
FY17E
FY16E
FY17E
FY16E
FY17E
FY16E
FY17E
FY16E
FY17E
FY16E
FY17E
Power
Tata Power
Neutral
65
-
17,567
35,923
37,402
22.6
22.8
4.1
5.2
16.0
12.6
1.2
1.1
7.5
9.3
1.4
1.3
NTPC
Buy
124
157
102,038
87,064
98,846
23.5
23.5
11.7
13.2
10.6
9.4
1.2
1.1
11.4
12.1
2.2
2.0
Power Grid
Buy
132
170
69,135
20,702
23,361
86.7
86.4
12.1
13.2
10.9
10.0
1.6
1.4
15.6
15.1
8.3
7.7
Telecom
Bharti Airtel
Neutral
338
-
135,112
101,748
109,191
32.1
31.7
12.0
12.5
28.2
27.0
1.9
1.8
6.9
6.7
2.0
1.8
Idea Cellular
Neutral
149
-
53,756
34,282
36,941
32.0
31.5
5.9
6.2
25.3
24.1
2.3
2.1
9.9
9.3
2.1
2.0
zOthers
Abbott India
Neutral
5,703
-
12,118
2,715
3,153
14.5
14.1
134.3
152.2
42.5
37.5
10.6
8.7
27.4
25.6
4.2
3.5
Bajaj Electricals
Buy
250
341
2,518
4,719
5,287
5.2
5.8
8.6
12.7
29.2
19.7
3.3
2.9
11.4
14.8
0.5
0.5
Finolex Cables
Neutral
232
-
3,555
2,728
3,036
10.8
11.0
14.4
16.8
16.1
13.9
2.5
2.1
15.2
15.3
1.0
0.9
Goodyear India*
Buy
568
655
1,310
1,953
1,766
12.4
12.0
67.4
59.6
8.4
9.5
2.1
1.8
27.7
20.2
0.5
0.4
Hitachi
Neutral
1,422
-
3,867
1,806
2,112
9.0
9.2
28.6
29.1
49.7
48.9
12.4
10.0
28.1
22.6
2.2
1.9
Jyothy Laboratories
Neutral
316
-
5,718
1,620
1,847
11.5
11.5
7.3
8.5
43.3
37.3
5.6
5.2
13.3
14.4
3.4
2.9
MRF
Neutral
41,932
-
17,784
20,727
14,841
19.3
18.6
4,905.8
3,351.9
8.6
12.5
2.7
2.2
37.6
19.6
0.8
1.1
Page Industries
Neutral
13,233
-
14,760
1,929
2,450
19.8
20.1
229.9
299.0
57.6
44.3
25.4
17.7
52.1
47.1
7.7
6.0
Relaxo Footwears
Neutral
529
-
6,347
1,767
2,152
12.3
12.5
19.3
25.1
27.5
21.1
6.7
5.2
27.7
27.8
3.6
3.0
Siyaram Silk Mills
Buy
979
1,221
918
1,653
1,873
11.7
12.2
99.3
122.1
9.9
8.0
1.8
1.5
19.5
20.2
0.7
0.6
Styrolution ABS India*
Neutral
742
-
1,305
1,271
1,440
8.6
9.2
32.0
41.1
23.2
18.1
2.4
2.1
10.7
12.4
1.0
0.9
Tree House
Buy
301
449
1,273
259
324
56.8
56.8
17.0
21.7
17.7
13.9
1.8
1.6
10.1
11.5
4.8
4.0
TVS Srichakra
Buy
2,595
3,210
1,987
2,127
2,388
15.2
14.9
237.7
267.5
10.9
9.7
4.6
3.3
51.7
39.8
1.0
0.8
HSIL
Accumulate
268
302
1,939
2,182
2,404
16.3
16.5
15.8
18.9
17.0
14.2
1.4
1.3
8.4
9.4
1.2
1.1
Kirloskar Engines India
Accumulate
281
297
4,058
2,634
3,252
10.1
12.0
10.9
17.4
25.7
16.1
2.9
2.6
11.4
16.8
1.2
0.9
Ltd
M M Forgings
Buy
545
797
658
563
671
22.1
22.9
51.0
66.5
10.7
8.2
2.2
1.8
23.1
24.1
1.3
1.1
Banco Products (India)
Neutral
117
-
835
1,208
1,353
11.0
12.3
10.8
14.5
10.8
8.1
1.2
1.1
11.9
14.5
0.7
0.6
Competent Automobiles Neutral
149
-
92
1,007
1,114
3.1
3.1
23.7
28.2
6.3
5.3
0.9
0.8
13.9
14.6
0.1
0.1
Nilkamal
Neutral
970
-
1,447
1,948
2,147
10.6
10.3
60.0
67.0
16.2
14.5
2.5
2.2
16.8
16.1
0.8
0.7
Visaka Industries
Buy
130
166
206
1,158
1,272
8.6
9.5
23.7
32.7
5.5
4.0
0.6
0.5
10.1
12.5
0.3
0.3
Transport Corporation of
Buy
242
293
1,840
2,830
3,350
8.8
9.0
14.4
18.3
16.8
13.2
2.6
2.3
15.4
17.1
0.8
0.7
India
Elecon Engineering
Buy
72
87
782
1,452
1,596
14.0
14.7
4.4
6.2
16.2
11.5
1.4
1.2
8.6
11.2
0.8
0.7
Surya Roshni
Buy
131
183
576
2,992
3,223
8.3
8.5
14.7
18.3
8.9
7.2
0.8
0.8
9.8
11.0
0.5
0.4
MT Educare
Buy
128
169
512
286
366
18.3
17.7
7.7
9.4
16.6
13.7
3.5
3.1
20.2
21.1
1.7
1.3
Stock Watch
October 01, 2015
Company Name
Reco
CMP
Target Mkt Cap
Sales ( Čcr )
OPM(%)
EPS (Č)
PER(x)
P/BV(x)
RoE(%)
EV/Sales(x)
(Č)
Price ( Č)
( Č cr )
FY16E FY17E FY16E FY17E FY16E FY17E FY16E FY17E FY16E FY17E FY16E FY17E FY16E FY17E
zOthers
Radico Khaitan
Buy
84
112
1,122
1,565
1,687
11.9
12.4
5.4
6.6
15.6
12.8
1.3
1.2
8.0
9.0
1.2
1.2
Garware Wall Ropes
Buy
335
390
733
875
983
10.4
10.6
23.1
27.8
14.5
12.0
2.1
1.8
14.1
14.8
0.9
0.7
Wonderla Holidays
Accumulate
291
322
1,642
206
308
44.0
43.6
9.0
12.9
32.3
22.5
4.4
4.0
13.7
17.8
7.9
5.2
Linc Pen & Plastics
Buy
153
185
226
340
371
8.3
8.9
10.8
13.2
14.1
11.6
2.3
2.0
16.0
17.1
0.7
0.6
The Byke Hospitality
Accumulate
165
181
660
222
287
20.5
20.5
5.6
7.6
29.2
21.8
5.5
4.5
18.9
20.8
3.0
2.3
Source: Company, Angel Research; Note: *December year end; #September year end; &October year end; Price as on September 30, 2015
Market Outlook
October 01, 2015
Research Team Tel: 022 - 39357800
DISCLAIMER
Angel Broking Private Limited (hereinafter referred to as “Angel”) is a registered Member of National Stock Exchange of India Limited,
Bombay Stock Exchange Limited and Metropolitian Stock Exchange of India Limited. It is also registered as a Depository Participant with
CDSL and Portfolio Manager with SEBI. It also has registration with AMFI as a Mutual Fund Distributor. Angel Broking Private Limited is a
registered entity with SEBI for Research Analyst in terms of SEBI (Research Analyst) Regulations, 2014 vide registration number
INH000000164. Angel or its associates has not been debarred/ suspended by SEBI or any other regulatory authority for accessing
/dealing in securities Market. Angel or its associates including its relatives/analyst do not hold any financial interest/beneficial ownership
of more than 1% in the company covered by Analyst. Angel or its associates/analyst has not received any compensation / managed or co
-managed public offering of securities of the company covered by Analyst during the past twelve months. Angel/analyst has not served as
an officer, director or employee of company covered by Analyst and has not been engaged in market making activity of the company
covered by Analyst.
This document is solely for the personal information of the recipient, and must not be singularly used as the basis of any investment
decision. Nothing in this document should be construed as investment or financial advice. Each recipient of this document should make
such investigations as they deem necessary to arrive at an independent evaluation of an investment in the securities of the companies
referred to in this document (including the merits and risks involved), and should consult their own advisors to determine the merits and
risks of such an investment.
Reports based on technical and derivative analysis center on studying charts of a stock's price movement, outstanding positions and
trading volume, as opposed to focusing on a company's fundamentals and, as such, may not match with a report on a company's
fundamentals.
The information in this document has been printed on the basis of publicly available information, internal data and other reliable sources
believed to be true, but we do not represent that it is accurate or complete and it should not be relied on as such, as this document is for
general guidance only. Angel Broking Pvt. Limited or any of its affiliates/ group companies shall not be in any way responsible for any
loss or damage that may arise to any person from any inadvertent error in the information contained in this report. Angel Broking Pvt.
Limited has not independently verified all the information contained within this document. Accordingly, we cannot testify, nor make any
representation or warranty, express or implied, to the accuracy, contents or data contained within this document. While Angel Broking
Pvt. Limited endeavors to update on a reasonable basis the information discussed in this material, there may be regulatory, compliance,
or other reasons that prevent us from doing so.
This document is being supplied to you solely for your information, and its contents, information or data may not be reproduced,
redistributed or passed on, directly or indirectly.
Neither Angel Broking Pvt. Limited, nor its directors, employees or affiliates shall be liable for any loss or damage that may arise from or
in connection with the use of this information.
Note: Please refer to the important ‘Stock Holding Disclosure' report on the Angel website (Research Section). Also, please refer to the
latest update on respective stocks for the disclosure status in respect of those stocks. Angel Broking Pvt. Limited and its affiliates may have
investment positions in the stocks recommended in this report.