Market Outlook
July 01, 2016
Market Cues
Domestic Indices
Chg (%)
(Pts)
(Close)
Indian markets are expected to open on a Flat note tracing SGX Nifty and Global
BSE Sensex
1.0
259
27,000
cues.
Nifty
1.0
84
8,288
U.S. stocks rallied for third consecutive session on Thursday, as investor’s anxiety
Mid Cap
1.3
145
11,717
about Britain's vote last week to leave the European Union eased. Markets also
Small Cap
0.9
110
11,801
reacted positively to speech by Bank of England Governor Mark Carney hinting at
Bankex
1.5
296
20,531
providing further monetary stimulus.
European shares rose for a third straight session yesterday as investors widely expect
Global Indices
Chg (%)
(Pts)
(Close)
central banks to cut interest rates and ramp up bond buying in order to ease fears
Dow Jones
1.3
235
17,930
over Britain's vote to exit EU.
Nasdaq
1.3
63
4,843
Indian shares closed higher for a fourth consecutive session, bouncing back to its
FTSE
2.3
144
6,504
pre-BREXIT levels on Thursday. The recovery is believed to be on the back of
Nikkei
0.1
9
15,576
improving prospects of domestic economy, hopes of good monsoon and clearance
Hang Seng
1.8
358
20,794
of the GST bill in next parliament session.
Shanghai Com
(0.1)
(2)
2,930
News Analysis
April-May fiscal deficit at 43% of Budget estimates
Advances / Declines
BSE
NSE
NTPC power generation up 10% at 64.6 BUs in Q1
Advances
1,599
1,040
Detailed analysis on Pg2
Declines
1,035
528
Investor’s Ready Reckoner
Unchanged
210
64
Key Domestic & Global Indicators
Stock Watch: Latest investment recommendations on 150+ stocks
Volumes (` Cr)
Refer Pg6 onwards
BSE
3,109
NSE
26,626
Top Picks
CMP
Target
Upside
Company
Sector
Rating
(`)
(`)
(%)
Net Inflows (` Cr)
Net
Mtd
Ytd
Amara Raja
Auto/Auto Ancillary
Buy
869
1,076
23.9
FII
146
3,693
18,062
HCL Tech
IT
Buy
731
1,000
36.9
MFs
130
265
9,696
LIC Housing
Financials
Buy
495
592
19.6
Bharat Electronics
Capital Goods
Accumulate
1,267
1,414
11.6
Top Gainers
Price (`)
Chg (%)
Navkar Corporation Others
Buy
215
265
23.2
More Top Picks on Pg3
Jpassociat
9
13.3
Sadbhav
292
5.7
Key Upcoming Events
Atul
2,046
5.6
Previous
Consensus
Date
Region
Event Description
Reading
Expectations
Sintex
81
5.5
July 01 UK
Industrial Production (YoY)
1.6
--
Cub
116
5.3
July 01 UK
GDP (YoY)
2.0
2.0
July 01 Germany
PMI Manufacturing
50.1
50.1
Top Losers
Price (`)
Chg (%)
July 05 China
PMI Manufacturing
50.1
50.0
6.(
Sparc
333
(2.8)
More Events on Pg4
Godrejind
397
(2.6)
Indhotel
127
(2.1)
Sunasian
8
(2.0)
Hindcopper
53
(1.8)
As on June 30, 2016
Market Outlook
July 01, 2016
April-May fiscal deficit at 43% of Budget estimates
Fiscal deficit in the first two months of the current fiscal was `2.28 lakh crore, or
42.9% of Budget estimates for 2016-17. The fiscal deficit situation during April-
May of 20115-16 was 37.5% of the Budget estimates.
As per the Controller General of Accounts, the gap between expenditure and
revenue for the entire current fiscal has been pegged at `5.33 lakh crore. Tax
revenue during the period was `49,690 crore or 4.7% of the estimate. Total
receipts from revenue and non-debt capital during the two months was `69,060
crore or 4.8% of the estimates for the current year. It was 4.4% of the estimates for
2015-16.
Total expenditure of the government during April-May was `2.98 lakh crore or
15.1% of the entire year estimates. Of the total expenditure, plan spending was
`90,570 crore and non-plan was over `207,476 crore. The revenue deficit during
the two month was over `1.99 lakh crore or 56.2% of the estimates, CGA data
showed. Revenue deficit refers to shortfall in total government revenue realization
from the targeted figure. For the 2016-17 year, the government aims to restrict
fiscal deficit to `5.33 lakh crore or 3.5% of the GDP.
NTPC power generation up 10% at 64.6 BUs in Q1
NTPC Ltd has announces that it has recorded a 10% yoy increase in power
generation to
64.6 billion units (BUs) in 1QFY2017. NTPC group achieved
generation increase of 11.65% during the same period.
The company stated that electricity tariff billed by NTPC to power distribution
companies reduced significantly despite increase in fuel prices. The company said
that its efforts under UDAY (Ujwal DISCOM Assurance Yojna) have led to
reduction in energy charges of coal stations benefiting the Discoms and the
consumers.
NTPC has a total installed capacity of 47,178 MW through its 18 coal-based,
seven gas-based, nine solar PV, one Hydro and eight Subsidiaries / Joint Venture
power stations. The company has a capacity of over 24,000 MW under different
phases of construction.
Economic and Political News
Odisha Govt commits 10% equity participation in rail corridor to transport
thermal coal
AP govt inks 6 pacts with Chinese firms for different projects
India's infrastructure output growth hits 5-month low in May
Corporate News
Aluminium makers worried by China's plans to raise output
Airtel expands footprint in Arunachal Pradesh
Tata group-owned TCIL to consolidate domestic business in 2016-17
HDFC, SBI Life take 18.5% stake in IDFC Infra Debt Fund
Market Outlook
July 01, 2016
Top Picks ★★★★★
Large Cap
Market Cap
CMP
Target
Upside
Company
Rationale
(` Cr)
(`)
(`)
(%)
To outpace battery industry growth due to better technological
Amara Raja Batteries
14,837
869
1,076
23.9
products leading to market share gains in both the automotive
OEM and replacement segments.
Uptick in defense capex by government, coupled with BELs
Bharat Electronics
30,410
1,267
1,414
11.6
strong market positioning, indicate good times ahead for BEL.
HCL Tech
1,03,063
731
1,000
36.9
Stock is trading at attractive valuations & factors all bad news.
Strong visibility for a robust 20% earnings trajectory, coupled
HDFC Bank
2,97,707
1,176
1,262
7.3
with high quality of earnings on account of high quality retail
business and strategic focus on highly rated corporates.
Back on the growth trend, expect a long term growth of 14% to
Infosys
2,68,915
1,171
1,374
17.4
be a US$20bn in FY2020.
Continues to grow its retail loan book at healthy pace with
LIC Housing Finance
24,966
495
592
19.6
improvement in asset quality. Expect LICHF to post a healthy
loan book which is likely to reflect in a strong earnings growth.
Huge bid pipeline of re-development works at Delhi and other
NBCC
11,436
191
220
15.4
State Governments and opportunity from Smart City, positions
NBCC to report strong growth, going forward.
Strong market positioning within the domestic AC markets to
Voltas
10,631
321
407
26.7
continue, EMP business set to revive
Source: Company, Angel Research
Mid Cap
Market Cap
CMP
Target
Upside
Company
Rationale
(` Cr)
(`)
(`)
(%)
Among the top 4 players in the consumer durables segment.
Bajaj Electricals
2,399
237
268
12.9
Improved profitability backed by turn around in E&P segment.
Strong order book lends earnings visibility.
Favourable outlook for AC industry to augur well for Cooling
Blue Star
3,940
438
495
13.0
products business. EMPPAC division's profitability to improve
once operating environment turns around.
With a focus on the low and medium income (LMI) consumer
Dewan Housing
5,944
204
270
32.5
segment, the company has increased its presence in tier-II & III
cities where the growth opportunity is immense.
Strong loan growth backed by diversified loan portfolio and
Equitas Holdings
5,960
178
235
32.2
adequate CAR. ROE & ROA likely to remain decent as risk of
dilution remains low. Attractive valuations considering growth.
Commencement of new projects, downtrend in the interest rate
IL&FS Transport
2,413
73
93
26.8
cycle, to lead to stock re-rating
Economic recovery to have favourable impact on advertising &
circulation revenue growth. Further, the acquisition of a radio
Jagran Prakashan
5,899
180
205
13.6
business (Radio City) would also boost the company's revenue
growth.
Speedier execution and speedier sales, strong revenue visibility
Mahindra Lifespace
1,929
470
554
17.9
in short-to-long run, attractive valuations
Massive capacity expansion along with rail advantage at ICD
Navkar Corporation
3,067
215
265
23.2
as well CFS augurs well for the company
Earnings boost on back of stable material prices and
Radico Khaitan
1,237
93
125
34.4
favourable pricing environment. Valuation discount to peers
provides additional comfort
Strong brands and distribution network would boost growth
Siyaram Silk Mills
1,053
1,124
1,347
19.9
going ahead. Stock currently trades at an inexpensive
valuation.
Source: Company, Angel Research
Market Outlook
July 1, 2016
Key Upcoming Events
Global economic events release calendar
Bloomberg Data
Date
Time
Country
Event Description
Unit
Period
Last Reported
Estimated
Jul 01, 2016
2:00 PM
UK GDP (YoY)
% Change
1Q F
2.00
2.00
2:00 PM
UK PMI Manufacturing
Value
Jun
50.10
50.10
2:00 PM
UK Industrial Production (YoY)
% Change
May
1.60
Jul 05, 2016
6:30 AM
China PMI Manufacturing
Value
Jun
50.10
50.00
Jul 07, 2016
1:25 PM Germany PMI Services
Value
Jun F
53.20
Jul 08, 2016
India
Imports YoY%
% Change
Jun
-13.20
India
Exports YoY%
% Change
Jun
-0.80
6:00 PM
US
Change in Nonfarm payrolls
Thousands
Jun
38.00
180.00
6:00 PM
US
Unnemployment rate
%
Jun
4.70
7:12 PM
Jul 10, 2016
7:00 AM
China Consumer Price Index (YoY)
% Change
Jun
2.00
1.90
Jul 12, 2016
5:30 PM
India
Industrial Production YoY
% Change
May
-0.80
Jul 13, 2016
China Exports YoY%
% Change
Jun
(4.10)
(4.00)
Jul 14, 2016
4:30 PM
UK BOE Announces rates
% Ratio
Jul 14
0.50
US
Producer Price Index (mom)
% Change
Jun
0.50
2:30 PM Euro Zone Euro-Zone CPI (YoY)
%
Jun F
0.10
Jul 15, 2016
12:00 PM
India
Monthly Wholesale Prices YoY%
% Change
Jun
0.79
6:00 PM
US
Consumer price index (mom)
% Change
Jun
0.20
6:45 PM
US
Industrial Production
%
Jun
(0.42)
7:30 AM
China Industrial Production (YoY)
% Change
Jun
6.00
Source: Bloomberg, Angel Research
Market Outlook
July 01, 2016
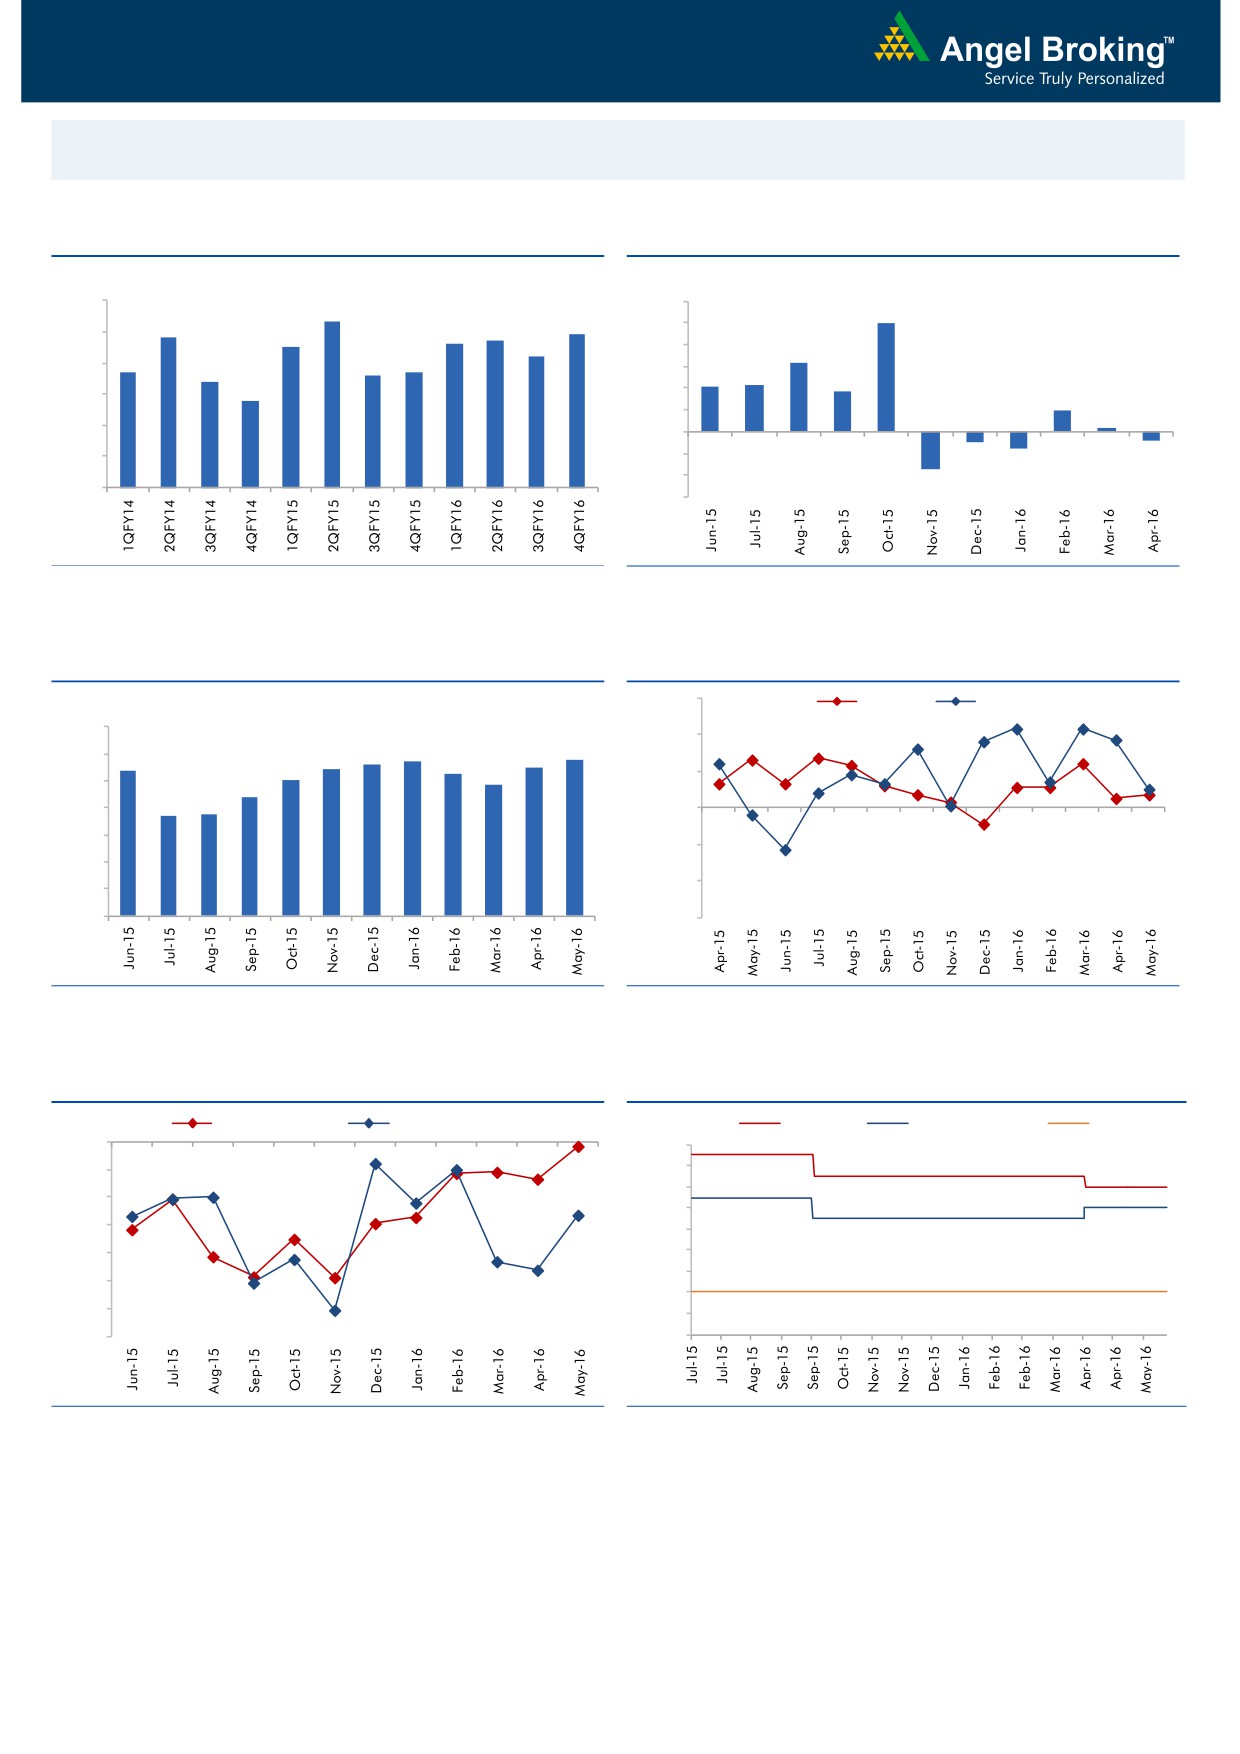
Macro watch
Exhibit 1: Quarterly GDP trends
Exhibit 2: IIP trends
(%)
(%)
9.0
12.0
8.3
9.9
7.8
7.7
7.9
10.0
8.0
7.5
7.6
7.2
8.0
6.3
6.7
6.6
6.7
7.0
6.4
6.0
4.2
4.3
3.7
5.8
4.0
6.0
2.0
2.0
0.3
5.0
-
4.0
(2.0)
(0.9)
(0.8)
(1.6)
(4.0)
3.0
(3.4)
(6.0)
Source: CSO, Angel Research
Source: MOSPI, Angel Research
Exhibit 3: Monthly CPI inflation trends
Exhibit 4: Manufacturing and services PMI
56.0
Mfg. PMI
Services PMI
(%)
7.0
54.0
5.6
5.7
5.8
5.4
5.4
5.5
6.0
5.3
5.0
4.8
52.0
5.0
4.4
3.7
3.7
4.0
50.0
3.0
48.0
2.0
46.0
1.0
-
44.0
Source: MOSPI, Angel Research
Source: Market, Angel Research; Note: Level above 50 indicates expansion
Exhibit 5: Exports and imports growth trends
Exhibit 6: Key policy rates
(%)
Exports yoy growth
Imports yoy growth
(%)
Repo rate
Reverse Repo rate
CRR
0.0
7.50
(5.0)
7.00
6.50
(10.0)
6.00
(15.0)
5.50
(20.0)
5.00
4.50
(25.0)
4.00
(30.0)
3.50
(35.0)
3.00
Source: Bloomberg, Angel Research
Source: RBI, Angel Research
Market Outlook
July 01, 2016
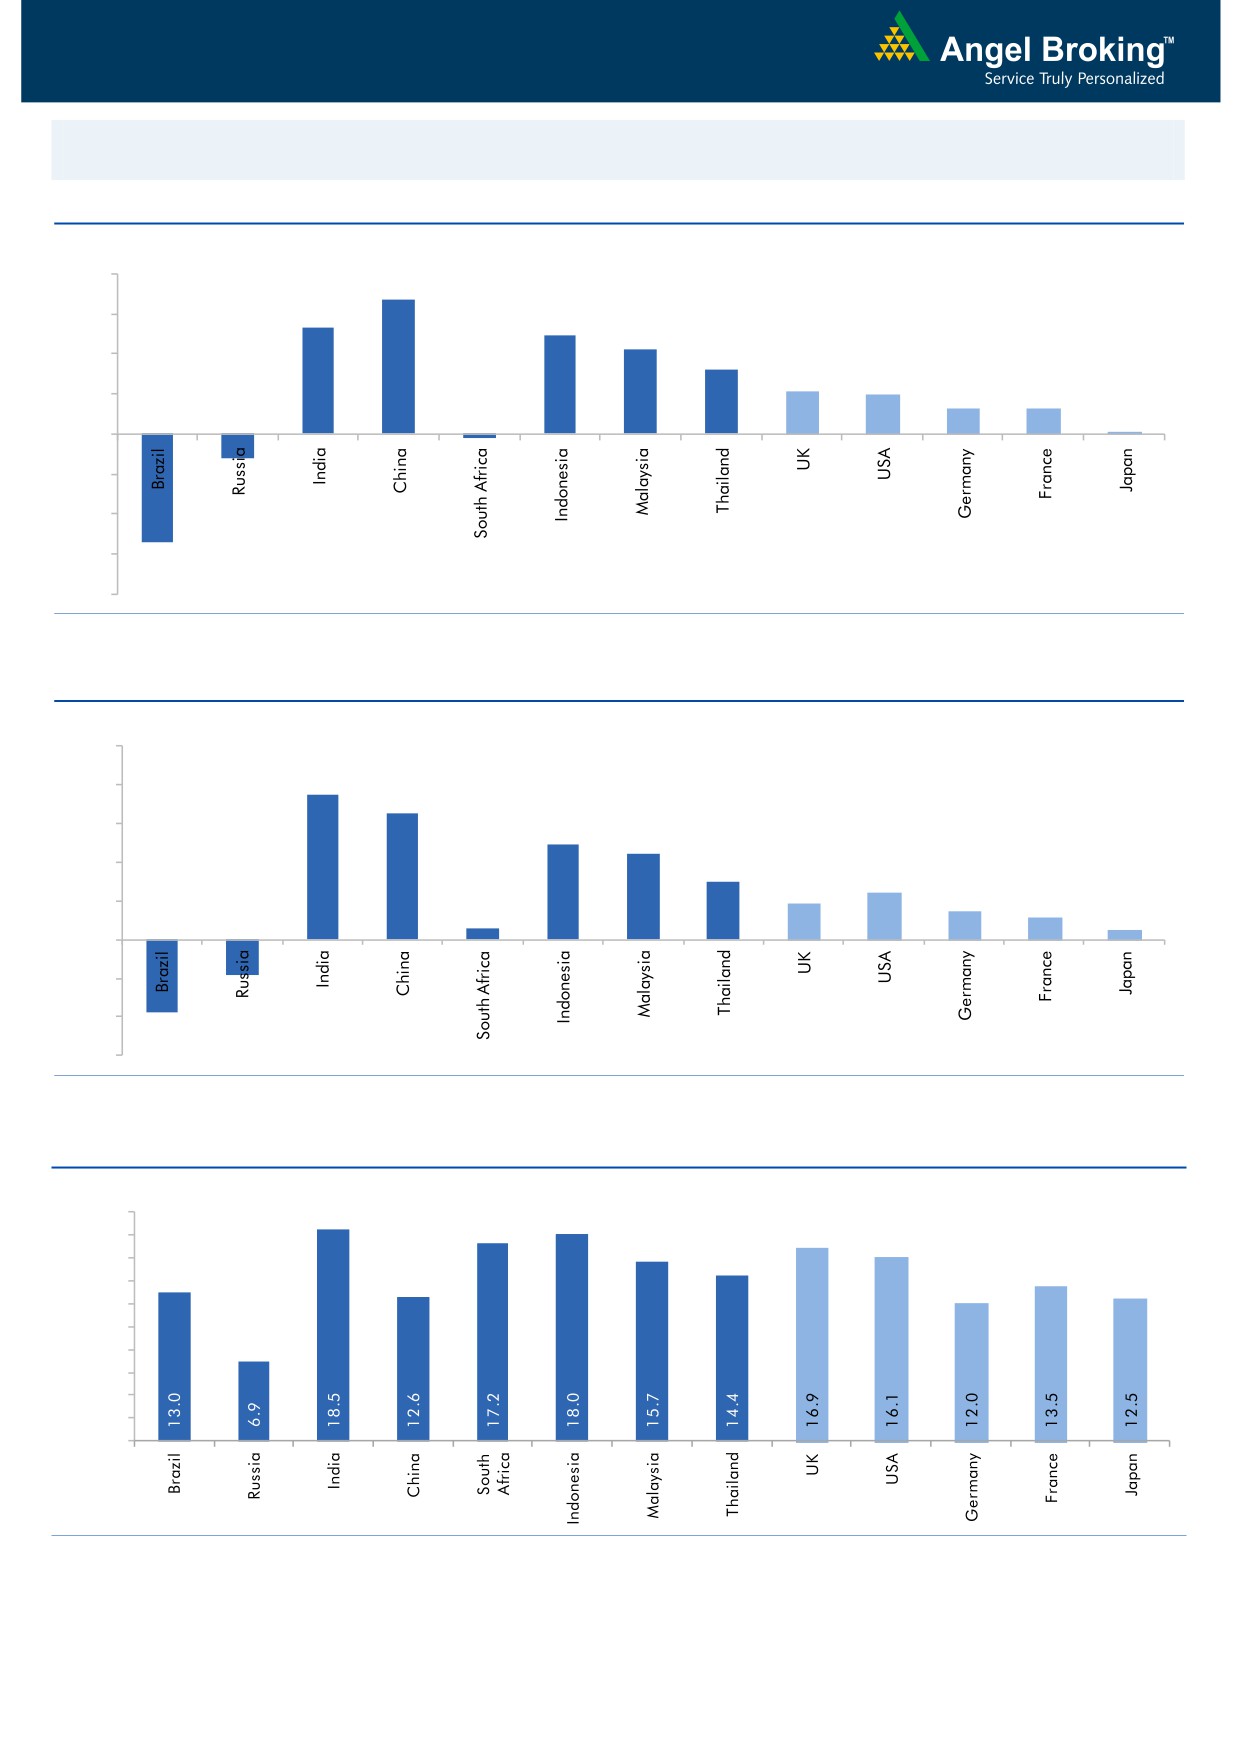
Global watch
Exhibit 1: Latest quarterly GDP Growth (%, yoy) across select developing and developed countries
(%)
8.0
6.7
6.0
5.3
4.9
4.2
4.0
3.2
2.1
2.0
2.0
1.3
1.3
0.1
-
(2.0)
(4.0)
(1.2)
(6.0)
(0.2)
(5.4)
(8.0)
Source: Bloomberg, Angel Research
Exhibit 2: 2016 GDP Growth projection by IMF (%, yoy) across select developing and developed countries
(%)
10.0
7.5
8.0
6.5
6.0
4.9
4.4
4.0
3.0
2.4
1.9
1.5
2.0
1.1
0.6
0.5
(3.8)
(1.8)
-
(2.0)
(4.0)
(6.0)
Source: IMF, Angel Research
Exhibit 3: One year forward P-E ratio across select developing and developed countries
(x)
20.0
18.0
16.0
14.0
12.0
10.0
8.0
6.0
4.0
2.0
-
Source: IMF, Angel Research
Market Outlook
July 01, 2016
Exhibit 4: Relative performance of indices across globe
Returns (%)
Country
Name of index
Closing price
1M
3M
1YR
Brazil
Bovespa
51,527
6.3
0.5
(4.3)
Russia
Micex
1,891
(2.3)
2.3
14.3
India
Nifty
8,288
1.6
9.1
(1.3)
China
Shanghai Composite
2,930
4.1
0.6
(35.8)
South Africa
Top 40
45,974
(5.1)
0.3
(0.4)
Mexico
Mexbol
45,966
1.1
(0.2)
1.8
Indonesia
LQ45
861
5.0
3.0
1.0
Malaysia
KLCI
1,654
1.5
(3.7)
(4.5)
Thailand
SET 50
911
(0.1)
0.9
(8.0)
USA
Dow Jones
17,930
0.8
1.4
1.1
UK
FTSE
6,504
4.4
4.9
(1.2)
Japan
Nikkei
15,576
(9.6)
(9.1)
(23.8)
Germany
DAX
9,680
(5.7)
(2.9)
(11.1)
France
CAC
4,237
(6.0)
(2.0)
(10.9)
Source: Bloomberg, Angel Research
Stock Watch
July 01, 2016
Company Name
Reco
CMP
Target
Mkt Cap
Sales ( Čcr )
OPM(%)
EPS (Č)
PER(x)
P/BV(x)
RoE(%)
EV/Sales(x)
(Č)
Price ( Č)
( Č cr )
FY16E FY17E
FY16E
FY17E
FY16E
FY17E
FY16E
FY17E
FY16E
FY17E
FY16E
FY17E
FY16E
FY17E
Agri / Agri Chemical
Rallis
Neutral
221
-
4,294
1,612
1,911
13.3
13.3
7.4
9.5
29.8
23.2
4.8
4.3
16.7
18.4
2.6
2.2
United Phosphorus
Accumulate
551
684
23,612
13,083
15,176
18.5
18.5
31.5
37.4
17.5
14.7
3.5
2.9
21.4
21.4
2.2
1.8
Auto & Auto Ancillary
Ashok Leyland
Neutral
99
-
28,060
17,995
21,544
11.4
11.6
3.4
4.7
29.0
21.0
5.1
4.7
17.7
22.2
1.6
1.3
Bajaj Auto
Neutral
2,686
-
77,731
22,709
25,860
20.9
20.1
129.0
143.6
20.8
18.7
6.4
5.5
30.7
29.4
2.9
2.5
Bharat Forge
Buy
758
875
17,647
7,351
8,318
19.9
19.7
31.2
36.5
24.3
20.8
4.4
3.7
19.3
19.2
2.5
2.2
Eicher Motors
Accumulate
19,222
20,044
52,210
15,556
16,747
15.5
17.3
464.8
597.5
41.4
32.2
15.1
11.1
36.2
34.3
3.2
2.9
Gabriel India
Accumulate
94
101
1,345
1,415
1,544
8.7
9.0
4.6
5.4
20.4
17.3
3.7
3.3
18.1
18.9
0.9
0.8
Hero Motocorp
Neutral
3,181
-
63,518
28,244
30,532
15.5
15.9
156.7
168.5
20.3
18.9
8.1
6.9
39.9
36.4
2.1
1.9
Jamna Auto Industries Neutral
174
-
1,391
1,281
1,473
11.2
11.5
7.6
9.2
22.9
18.9
5.8
4.8
25.4
25.2
1.1
0.9
L G Balakrishnan & Bros Neutral
479
-
752
1,254
1,394
11.6
11.8
35.9
41.7
13.4
11.5
1.8
1.6
13.5
13.8
0.7
0.6
Mahindra and Mahindra Neutral
1,429
-
88,751
38,416
42,904
13.7
13.9
54.8
63.4
26.1
22.5
4.0
3.6
15.4
15.8
1.8
1.6
Maruti
Neutral
4,185
-
126,425
57,865
68,104
16.4
16.7
176.3
225.5
23.7
18.6
4.6
3.9
19.4
21.2
2.0
1.6
Minda Industries
Neutral
1,167
-
1,852
2,523
2,890
8.7
9.0
55.0
65.4
21.2
17.9
4.1
3.3
19.3
18.7
0.8
0.7
Motherson Sumi
Accumulate
290
313
38,399
39,343
45,100
8.8
9.1
10.1
12.5
28.7
23.2
9.1
7.1
35.3
34.4
1.0
0.9
Rane Brake Lining
Buy
385
465
305
454
511
11.5
12.0
25.2
31.0
15.3
12.4
2.3
2.1
14.9
16.6
0.8
0.7
Setco Automotive
Neutral
53
-
706
594
741
12.7
13.7
1.7
3.2
31.1
16.5
3.3
2.8
10.4
16.9
1.3
1.1
Tata Motors
Neutral
459
-
132,595
259,686
273,957
13.0
13.4
25.9
29.5
17.7
15.6
2.3
2.0
8.0
9.0
0.7
0.7
TVS Motor
Accumulate
310
330
14,713
11,263
13,122
6.9
8.5
9.2
15.0
33.7
20.7
7.7
6.1
22.7
29.6
1.2
1.0
Amara Raja Batteries
Buy
869
1,076
14,837
4,690
5,429
17.5
17.5
28.5
35.3
30.5
24.6
7.1
5.8
23.1
25.9
3.0
2.6
Exide Industries
Neutral
170
-
14,420
6,950
7,784
14.4
14.8
6.6
7.3
25.7
23.2
3.2
3.0
12.6
12.8
1.6
1.5
Apollo Tyres
Buy
152
183
7,712
12,056
12,714
17.2
16.4
23.0
20.3
6.6
7.5
1.2
1.0
17.7
13.6
0.7
0.7
Ceat
Buy
845
1,119
3,420
6,041
6,597
14.1
13.7
99.5
111.9
8.5
7.6
1.7
1.4
19.6
18.5
0.8
0.6
JK Tyres
Neutral
90
-
2,032
7,446
7,669
15.2
14.0
19.6
18.4
4.6
4.9
1.2
1.0
25.2
19.5
0.7
0.6
Swaraj Engines
Neutral
1,184
-
1,470
552
630
14.2
14.7
44.6
54.1
26.5
21.9
6.2
5.6
23.2
25.6
2.3
2.0
Subros
Neutral
91
-
546
1,293
1,527
11.8
11.9
4.2
6.7
21.7
13.6
1.6
1.5
7.7
11.5
0.7
0.6
Indag Rubber
Neutral
193
-
506
283
329
17.0
17.2
13.0
15.4
14.9
12.5
3.3
2.7
21.8
21.6
1.5
1.2
Capital Goods
ACE
Neutral
47
-
468
660
839
4.7
8.2
1.0
3.9
47.3
12.1
1.5
1.3
3.2
11.3
0.8
0.6
BEML
Buy
853
1,157
3,554
3,277
4,006
6.0
8.9
36.2
64.3
23.6
13.3
1.6
1.5
5.7
11.7
1.1
0.9
Bharat Electronics
Buy
1,267
1,414
30,410
7,295
8,137
20.0
16.8
56.5
58.7
22.4
21.6
3.3
3.0
42.1
44.6
3.0
2.5
Stock Watch
July 01, 2016
Company Name
Reco
CMP
Target
Mkt Cap
Sales ( Čcr )
OPM(%)
EPS (Č)
PER(x)
P/BV(x)
RoE(%)
EV/Sales(x)
(Č)
Price ( Č)
( Č cr )
FY16E
FY17E
FY16E
FY17E
FY16E
FY17E
FY16E
FY17E
FY16E
FY17E
FY16E
FY17E
FY16E
FY17E
Capital Goods
Voltas
Buy
321
407
10,631
5,857
6,511
7.5
7.9
11.7
12.9
27.5
24.9
4.5
3.9
17.1
16.7
1.9
1.7
BGR Energy
Neutral
116
-
836
3,615
3,181
9.5
9.4
16.7
12.4
6.9
9.3
0.7
0.6
10.0
7.0
0.6
0.8
BHEL
Neutral
128
-
31,244
33,722
35,272
10.8
11.7
10.5
14.2
12.2
9.0
0.9
0.9
7.0
9.0
0.9
0.9
Blue Star
Buy
438
495
3,940
3,770
4,351
5.7
6.4
11.4
17.2
38.3
25.5
5.9
5.5
18.4
23.1
1.0
0.9
Crompton Greaves
Neutral
74
-
4,622
13,484
14,687
4.9
6.2
4.5
7.1
16.4
10.4
1.2
1.1
7.2
10.8
0.5
0.4
Greaves Cotton
Neutral
139
-
3,382
1,655
1,755
16.6
16.8
7.4
7.8
18.7
17.8
3.7
3.6
21.1
20.6
2.0
1.9
Inox Wind
Buy
238
286
5,276
4,406
5,605
15.5
15.7
20.4
24.8
11.7
9.6
2.7
2.0
27.9
25.9
1.3
1.0
KEC International
Neutral
144
-
3,698
8,791
9,716
6.1
6.8
5.4
8.2
26.6
17.5
2.7
2.4
10.0
14.0
0.6
0.6
Thermax
Neutral
824
-
9,813
6,413
7,525
7.4
8.5
30.5
39.3
27.0
21.0
4.2
3.6
15.0
17.0
1.4
1.1
VATech Wabag
Neutral
592
-
3,229
2,722
3,336
7.9
8.1
19.5
24.6
30.4
24.1
3.2
2.8
11.1
12.4
1.3
1.1
Cement
ACC
Neutral
1,614
-
30,302
13,151
14,757
16.4
18.3
63.9
83.4
25.3
19.4
3.3
3.0
13.3
16.1
2.0
1.7
Ambuja Cements
Neutral
254
-
39,473
11,564
12,556
19.4
20.7
8.9
10.1
28.6
25.2
3.6
3.4
12.8
13.8
2.7
2.5
HeidelbergCement
Neutral
118
-
2,679
1,772
1,926
13.3
15.4
1.0
3.0
118.2
39.4
3.0
2.8
2.6
7.9
1.9
1.7
India Cements
Neutral
113
-
3,471
4,216
4,840
18.0
19.5
4.0
9.9
28.3
11.4
1.1
1.0
4.0
9.5
1.0
0.8
JK Cement
Neutral
665
-
4,653
3,661
4,742
10.1
15.8
7.5
28.5
88.7
23.4
2.7
2.4
7.5
22.9
1.6
1.2
J K Lakshmi Cement
Neutral
386
-
4,543
2,947
3,616
16.7
19.9
11.5
27.2
33.6
14.2
3.2
2.8
9.8
20.8
1.8
1.4
Mangalam Cements
Neutral
310
-
826
1,053
1,347
10.5
13.3
8.4
26.0
36.9
11.9
1.6
1.4
4.3
12.5
1.1
0.8
Orient Cement
Neutral
183
-
3,757
1,854
2,524
21.2
22.2
7.7
11.1
23.8
16.5
3.4
3.0
13.3
15.7
2.6
1.8
Ramco Cements
Neutral
554
-
13,193
4,036
4,545
20.8
21.3
15.1
18.8
36.7
29.5
4.5
4.0
12.9
14.3
3.5
3.0
Shree Cement^
Neutral
14,545
-
50,670
7,150
8,742
26.7
28.6
228.0
345.5
63.8
42.1
9.4
7.9
15.7
20.3
6.4
5.1
UltraTech Cement
Neutral
3,412
-
93,635
24,669
29,265
18.2
20.6
82.0
120.0
41.6
28.4
4.5
3.9
11.3
14.7
3.6
3.1
Construction
ITNL
Buy
73
93
2,413
7,360
8,682
34.0
32.2
7.0
8.6
10.5
8.5
0.4
0.4
3.2
2.5
3.7
3.5
KNR Constructions
Neutral
558
-
1,570
937
1,470
14.3
14.0
44.2
38.6
12.6
14.5
2.5
2.2
15.4
15.4
1.8
1.2
Larsen & Toubro
Buy
1,496
1,700
139,447
58,870
65,708
8.3
10.3
42.0
53.0
35.6
28.2
2.5
2.2
8.8
11.2
2.5
2.3
Gujarat Pipavav Port
Neutral
162
-
7,853
629
684
51.0
52.2
6.4
5.9
25.4
27.5
3.3
3.1
15.9
12.7
11.8
10.7
MBL Infrastructures
Buy
120
285
496
2,313
2,797
12.2
14.6
19.0
20.0
6.3
6.0
0.7
0.6
11.3
10.6
0.9
0.8
Nagarjuna Const.
Neutral
74
-
4,131
7,892
8,842
8.8
9.1
3.0
5.3
24.8
14.0
1.2
1.1
5.0
8.5
0.7
0.6
PNC Infratech
Neutral
570
-
2,925
1,873
2,288
13.2
13.5
24.0
32.0
23.8
17.8
2.3
2.1
12.1
12.3
1.6
1.3
Simplex Infra
Neutral
266
-
1,317
5,955
6,829
10.3
10.5
16.0
31.0
16.6
8.6
0.9
0.8
5.3
9.9
0.7
0.6
Stock Watch
July 01, 2016
Company Name
Reco
CMP
Target
Mkt Cap
Sales ( Čcr )
OPM(%)
EPS (Č)
PER(x)
P/BV(x)
RoE(%)
EV/Sales(x)
(Č)
Price ( Č)
( Č cr )
FY16E
FY17E
FY16E
FY17E
FY16E
FY17E
FY16E
FY17E
FY16E
FY17E
FY16E
FY17E
FY16E
FY17E
Construction
Power Mech Projects
Neutral
543
-
799
1,539
1,801
12.8
12.7
59.0
72.1
9.2
7.5
1.4
1.2
18.6
16.8
0.6
0.5
Sadbhav Engineering
Accumulate
293
298
5,018
3,186
3,598
10.2
10.3
8.0
9.0
36.6
32.5
3.4
3.0
9.4
9.9
1.8
1.6
NBCC
Accumulate
191
220
11,436
5,838
7,428
6.0
7.9
5.2
8.2
36.7
23.2
1.2
0.9
21.9
28.2
1.8
1.3
MEP Infra
Neutral
42
-
687
1,956
1,876
28.1
30.5
1.3
3.0
32.5
14.1
6.8
4.6
21.2
32.8
1.7
1.7
SIPL
Neutral
100
-
3,522
675
1,042
62.4
64.7
-
-
3.8
4.3
-
-
16.7
11.3
Engineers India
Neutral
204
-
6,863
1,667
1,725
13.5
16.0
9.7
11.4
21.0
17.9
2.5
2.4
11.7
13.4
2.7
2.7
Financials
Allahabad Bank
Neutral
69
-
4,996
8,569
9,392
2.8
2.9
16.3
27.5
4.2
2.5
0.4
0.3
7.6
11.9
-
-
Axis Bank
Neutral
533
-
127,322
26,204
29,738
3.6
3.5
34.5
35.4
15.5
15.1
2.4
2.2
16.8
14.9
-
-
Bank of Baroda
Neutral
154
-
35,484
18,802
21,088
2.0
2.2
(7.4)
13.0
11.8
1.2
1.0
(4.2)
7.3
-
-
Bank of India
Neutral
101
-
9,443
15,972
17,271
1.9
2.0
15.3
33.4
6.6
3.0
0.3
0.3
3.6
7.6
-
-
Canara Bank
Neutral
218
-
11,862
15,441
16,945
2.0
2.1
46.6
70.4
4.7
3.1
0.4
0.4
8.0
11.2
-
-
Dena Bank
Neutral
39
-
2,624
3,440
3,840
2.1
2.3
7.3
10.0
5.4
3.9
0.4
0.3
6.1
7.9
-
-
Dewan Housing Finance Buy
204
270
5,944
1,828
2,225
2.9
3.0
24.9
29.7
8.2
6.9
1.3
1.1
15.1
16.1
-
-
Equitas Holdings
Buy
178
235
5,960
679
1,076
12.4
11.7
6.2
6.7
28.7
26.5
3.6
2.6
13.3
12.5
-
-
Federal Bank
Neutral
58
-
9,888
3,279
3,787
2.8
2.9
3.9
5.5
14.6
10.4
1.2
1.1
8.4
10.8
-
-
HDFC
Neutral
1,253
-
198,047
10,358
11,852
3.3
3.3
41.1
47.0
30.5
26.6
5.8
5.3
24.7
24.9
-
-
HDFC Bank
Accumulate
1,176
1,262
297,707
38,606
47,696
4.4
4.5
48.8
61.4
24.1
19.2
4.1
3.6
18.7
20.0
-
-
ICICI Bank
Neutral
240
-
139,722
34,279
39,262
3.3
3.3
21.0
24.4
11.5
9.9
1.9
1.6
14.4
14.7
-
-
IDBI Bank
Neutral
70
-
14,360
9,625
10,455
1.8
1.8
8.5
14.2
8.2
4.9
0.5
0.5
5.9
9.3
-
-
Indian Bank
Neutral
141
-
6,779
6,160
6,858
2.5
2.5
24.5
29.8
5.8
4.7
0.5
0.4
7.7
8.6
-
-
LIC Housing Finance
Buy
495
592
24,966
3,179
3,758
2.6
2.6
32.9
40.6
15.0
12.2
2.8
2.4
19.6
20.7
-
-
Oriental Bank
Neutral
108
-
3,740
7,643
8,373
2.4
2.4
37.2
45.4
2.9
2.4
0.3
0.2
8.2
9.4
-
-
Punjab Natl.Bank
Neutral
106
-
20,775
23,122
26,022
2.8
2.8
7.0
21.6
15.1
4.9
0.8
0.7
3.4
10.0
-
-
South Ind.Bank
Neutral
20
-
2,653
1,965
2,185
2.5
2.5
2.5
3.3
7.9
6.0
0.8
0.7
9.5
11.7
-
-
St Bk of India
Neutral
219
-
169,733
79,958
86,061
2.6
2.6
13.4
20.7
16.3
10.6
1.3
1.2
11.5
12.8
-
-
Union Bank
Neutral
128
-
8,820
12,646
14,129
2.3
2.4
31.0
39.1
4.1
3.3
0.4
0.4
9.8
11.4
-
-
Vijaya Bank
Neutral
38
-
3,746
3,536
3,827
1.9
1.9
5.5
6.7
6.8
5.6
0.6
0.5
7.8
8.8
-
-
Yes Bank
Neutral
1,107
-
46,583
7,190
9,011
3.2
3.3
58.2
69.7
19.0
15.9
3.4
2.9
19.2
19.6
-
-
FMCG
Asian Paints
Neutral
1,004
-
96,270
15,534
17,445
17.7
16.8
18.4
19.6
54.7
51.2
19.3
18.2
34.6
35.6
6.2
5.5
Stock Watch
July 01, 2016
Company Name
Reco
CMP
Target
Mkt Cap
Sales ( Čcr )
OPM(%)
EPS (Č)
PER(x)
P/BV(x)
RoE(%)
EV/Sales(x)
(Č)
Price ( Č)
( Č cr )
FY16E FY17E
FY16E
FY17E
FY16E
FY17E
FY16E
FY17E
FY16E
FY17E
FY16E
FY17E
FY16E
FY17E
FMCG
Britannia
Neutral
2,757
-
33,075
8,481
9,795
14.0
14.1
65.5
78.3
42.1
35.2
19.9
16.3
38.3
41.2
3.8
3.3
Colgate
Neutral
919
-
24,987
4,136
4,632
22.5
23.3
22.2
25.3
41.4
36.3
25.2
22.4
68.6
67.5
5.6
5.0
Dabur India
Neutral
308
-
54,217
9,370
10,265
17.6
17.3
7.3
8.1
42.0
38.1
10.9
10.0
31.7
30.6
5.6
5.1
GlaxoSmith Con*
Accumulate
5,912
6,118
24,862
4,519
5,142
19.6
19.8
164.3
191.2
36.0
30.9
10.0
8.5
30.8
29.9
4.7
4.1
Godrej Consumer
Neutral
1,602
-
54,567
9,003
10,335
18.1
18.7
34.1
41.8
47.0
38.3
10.2
8.7
23.9
24.8
6.1
5.3
HUL
Neutral
899
-
194,479
33,299
35,497
17.1
17.1
18.9
20.0
47.6
44.9
41.7
36.3
87.6
80.8
5.6
5.2
ITC
Accumulate
368
380
296,218
36,837
39,726
38.8
38.7
12.2
13.5
30.1
27.3
8.4
7.4
27.8
26.9
7.2
6.7
Marico
Neutral
264
-
34,106
6,151
6,966
17.2
17.3
5.4
6.4
49.0
41.3
15.4
12.1
33.2
32.4
5.2
4.6
Nestle*
Neutral
6,489
-
62,562
9,393
10,507
22.2
22.3
106.8
121.8
60.8
53.3
21.3
19.2
34.8
36.7
6.2
5.6
Tata Global
Accumulate
131
137
8,280
8,635
9,072
9.8
9.9
5.8
7.2
22.6
18.2
2.0
1.9
6.8
7.4
0.9
0.9
Procter & Gamble
Buy
6,263
7,369
20,331
2,588
2,939
23.3
23.2
130.2
146.2
48.1
42.9
95.9
92.0
27.6
25.3
7.4
6.4
Hygiene
IT
HCL Tech^
Buy
731
1,000
103,063
37,061
30,781
21.5
20.5
51.4
40.0
14.2
18.3
3.7
2.7
20.1
20.3
2.5
2.7
Infosys
Accumulate
1,171
1,374
268,915
62,441
70,558
27.5
27.5
59.0
65.3
19.8
17.9
4.0
3.6
22.2
22.4
4.1
3.5
TCS
Accumulate
2,551
3,004
502,617
108,646
122,770
28.3
28.3
123.7
141.0
20.6
18.1
6.8
6.3
33.1
34.6
4.3
3.7
Tech Mahindra
Buy
506
700
49,162
26,494
30,347
16.3
17.0
32.2
37.5
15.7
13.5
3.4
3.0
21.7
21.8
1.8
1.5
Wipro
Buy
558
680
137,952
50,808
56,189
23.7
23.8
37.3
40.7
15.0
13.7
2.9
2.6
19.2
17.7
2.1
1.7
Media
D B Corp
Neutral
376
-
6,905
2,025
2,187
27.4
27.4
17.4
18.9
21.6
19.9
4.9
4.4
22.9
23.7
3.4
3.1
HT Media
Neutral
77
-
1,796
2,495
2,673
12.9
13.2
6.8
7.2
11.4
10.7
0.9
0.8
7.5
7.8
0.3
0.3
Jagran Prakashan
Buy
180
205
5,899
2,107
2,355
33.5
28.0
10.1
10.8
18.0
16.7
4.2
3.6
23.3
21.7
2.7
2.4
Sun TV Network
Neutral
363
-
14,323
2,510
2,763
71.8
71.5
21.9
24.8
16.6
14.7
3.9
3.6
22.8
24.3
5.2
4.7
Hindustan Media
Neutral
273
-
2,005
914
1,016
21.7
21.5
21.9
23.3
12.5
11.8
2.2
1.9
18.0
16.2
1.6
1.4
Ventures
Metals & Mining
Coal India
Buy
313
380
197,797
76,167
84,130
19.9
22.3
22.4
25.8
14.0
12.1
5.0
4.9
35.5
41.0
1.9
1.7
Hind. Zinc
Neutral
180
-
75,971
14,641
14,026
50.4
50.4
17.7
16.0
10.2
11.2
1.6
1.4
16.2
13.2
2.5
2.3
Hindalco
Neutral
123
-
25,348
104,356
111,186
8.7
9.5
6.7
11.1
18.3
11.1
0.7
0.6
3.5
5.9
0.7
0.7
JSW Steel
Neutral
1,465
-
35,410
42,308
45,147
16.4
20.7
(10.3)
49.5
29.6
1.6
1.6
(1.0)
5.6
1.8
1.7
NMDC
Neutral
94
-
37,189
8,237
10,893
46.6
44.5
10.0
11.7
9.4
8.0
1.1
0.9
12.5
13.0
4.1
3.1
SAIL
Neutral
45
-
18,647
45,915
53,954
7.2
10.5
1.5
4.4
30.0
10.3
0.4
0.4
2.3
4.1
1.0
0.9
Vedanta
Neutral
132
-
39,119
71,445
81,910
26.2
26.3
12.9
19.2
10.2
6.9
0.7
0.6
7.2
8.9
0.9
0.7
Tata Steel
Neutral
322
-
31,263
126,760
137,307
8.9
11.3
6.4
23.1
50.6
14.0
1.0
1.0
2.0
7.1
0.8
0.8
Stock Watch
July 01, 2016
Company Name
Reco
CMP
Target
Mkt Cap
Sales ( Čcr )
OPM(%)
EPS (Č)
PER(x)
P/BV(x)
RoE(%)
EV/Sales(x)
(Č)
Price ( Č)
( Č cr )
FY16E FY17E
FY16E
FY17E
FY16E
FY17E
FY16E
FY17E
FY16E
FY17E
FY16E
FY17E
FY16E
FY17E
Oil & Gas
Cairn India
Neutral
140
-
26,314
11,323
12,490
49.4
51.0
20.7
20.7
6.8
6.8
0.4
0.4
6.4
6.1
1.4
0.8
GAIL
Neutral
385
-
48,862
64,856
70,933
9.1
9.6
24.0
28.9
16.1
13.3
1.4
1.3
8.8
9.6
0.9
0.8
ONGC
Neutral
216
-
185,055
154,564
145,998
36.8
37.4
20.8
22.6
10.4
9.6
1.0
0.9
10.1
9.7
1.4
1.5
Petronet LNG
Neutral
294
-
22,073
29,691
31,188
5.8
6.2
12.8
13.4
23.0
21.9
3.4
3.1
15.8
14.8
0.8
0.7
Indian Oil Corp
Accumulate
441
455
107,073
359,607
402,760
5.9
6.1
42.5
48.7
10.4
9.1
1.4
1.2
14.1
14.4
0.4
0.3
Reliance Industries
Buy
969
1,150
314,339
304,775
344,392
12.6
13.4
91.3
102.6
10.6
9.5
1.2
1.1
11.8
12.0
0.9
0.8
Pharmaceuticals
Alembic Pharma
Neutral
574
-
10,813
3,274
3,802
26.9
19.4
35.0
28.7
16.4
20.0
7.3
5.5
55.6
31.2
3.2
2.7
Aurobindo Pharma
Accumulate
743
856
43,502
14,923
17,162
22.0
23.0
35.7
42.8
20.8
17.4
6.1
4.6
34.0
30.2
3.5
3.0
Aventis*
Accumulate
4,435
4,738
10,214
2,049
2,375
15.4
17.3
115.4
153.5
38.4
28.9
6.3
4.9
19.3
25.8
4.6
3.9
Cadila Healthcare
Buy
328
400
33,563
9,469
11,246
21.2
22.0
14.9
17.1
22.0
19.2
6.3
4.9
28.8
26.6
3.4
2.9
Cipla
Buy
501
605
40,295
13,979
16,447
20.2
18.6
25.7
27.5
19.5
18.2
3.2
2.7
17.6
16.1
2.7
2.2
Dr Reddy's
Accumulate
3,384
3,476
57,702
15,471
17,479
24.6
24.6
138.2
152.4
24.5
22.2
4.5
3.8
19.7
18.7
3.4
3.0
Dishman Pharma
Neutral
140
-
2,252
1,733
1,906
21.5
21.5
10.1
10.0
13.8
14.0
1.6
1.5
10.5
11.2
1.9
1.7
GSK Pharma*
Neutral
3,474
-
29,426
2,870
3,158
20.0
22.1
59.5
68.3
58.4
50.9
17.2
17.7
28.5
34.3
9.9
9.1
Indoco Remedies
Neutral
275
-
2,536
1,033
1,199
15.9
18.2
9.4
13.6
29.3
20.2
4.3
3.7
15.7
19.7
2.6
2.3
Ipca labs
Buy
487
750
6,147
3,363
3,909
12.9
18.6
13.4
28.0
36.4
17.4
2.6
2.3
7.4
14.0
1.9
1.6
Lupin
Buy
1,537
1,809
69,310
13,702
15,912
23.7
26.4
50.5
58.1
30.4
26.5
6.3
5.2
22.9
21.4
5.2
4.2
Sun Pharma
Buy
764
950
183,775
28,163
32,610
25.8
30.7
17.4
26.9
43.9
28.4
4.2
3.6
13.0
16.6
5.8
4.8
Power
Tata Power
Neutral
73
-
19,838
35,923
37,402
22.6
22.8
4.1
5.2
18.1
14.2
1.4
1.3
7.5
9.3
1.5
1.4
NTPC
Neutral
156
-
128,959
87,271
99,297
23.5
23.5
11.8
13.3
13.3
11.8
1.5
1.4
11.5
12.2
2.4
2.2
Power Grid
Accumulate
163
170
85,249
20,702
23,361
86.7
86.4
12.1
13.2
13.5
12.3
2.0
1.8
15.6
15.1
8.7
8.1
Real Estate
MLIFE
Buy
470
554
1,929
826
1,011
20.1
21.9
22.7
30.7
20.7
15.3
1.2
1.1
6.0
7.4
4.1
3.1
Telecom
Bharti Airtel
Neutral
366
-
146,365
101,748
109,191
32.1
31.7
12.0
12.5
30.5
29.3
2.1
2.0
6.9
6.7
2.0
1.9
Idea Cellular
Neutral
107
-
38,367
34,282
36,941
32.0
31.5
5.9
6.2
18.1
17.2
1.7
1.5
9.9
9.3
1.7
1.6
zOthers
Abbott India
Neutral
4,613
-
9,801
2,715
3,153
14.5
14.1
134.3
152.2
34.4
30.3
8.6
7.1
27.4
25.6
3.3
2.8
Bajaj Electricals
Buy
237
268
2,399
4,612
5,351
5.6
5.7
23.4
18.0
10.1
13.2
3.1
2.8
12.5
14.4
0.5
0.4
Finolex Cables
Neutral
363
-
5,547
2,520
2,883
12.2
12.0
12.7
14.2
28.6
25.5
3.9
3.5
13.6
13.5
1.9
1.6
Goodyear India*
Accumulate
526
582
1,214
1,800
1,600
11.7
11.5
58.7
52.9
9.0
9.9
2.0
1.7
24.6
18.7
0.4
0.4
Hitachi
Neutral
1,394
-
3,789
1,779
2,081
7.8
8.8
21.8
33.4
63.9
41.7
10.3
8.4
17.4
22.1
2.0
1.7
Stock Watch
July 01, 2016
Company Name
Reco
CMP
Target
Mkt Cap
Sales ( Čcr )
OPM(%)
EPS (Č)
PER(x)
P/BV(x)
RoE(%)
EV/Sales(x)
(Č)
Price ( Č)
( Č cr )
FY16E
FY17E
FY16E
FY17E
FY16E
FY17E
FY16E
FY17E
FY16E
FY17E
FY16E
FY17E
FY16E
FY17E
zOthers
Jyothy Laboratories
Neutral
303
-
5,483
1,620
1,847
11.5
11.5
7.3
8.5
41.5
35.7
5.4
5.0
13.3
14.4
3.1
2.7
MRF
Buy
33,085
45,575
14,032
20,316
14,488
21.4
21.1
5,488.0
3,798.0
6.0
8.7
2.1
1.7
41.1
21.2
0.6
0.9
Page Industries
Neutral
13,986
-
15,600
1,929
2,450
19.8
20.1
229.9
299.0
60.8
46.8
26.8
18.7
52.1
47.1
8.2
6.4
Relaxo Footwears
Neutral
503
-
6,038
1,767
2,152
12.3
12.5
19.3
25.1
26.1
20.1
6.4
4.9
27.7
27.8
3.0
2.5
Siyaram Silk Mills
Buy
1,124
1,347
1,053
1,619
1,799
11.6
11.6
93.5
104.9
12.0
10.7
2.1
1.8
17.1
16.4
0.8
0.8
Styrolution ABS India* Neutral
627
-
1,103
1,271
1,440
8.6
9.2
32.0
41.1
19.6
15.3
2.0
1.8
10.7
12.4
0.8
0.7
TVS Srichakra
Buy
2,383
2,932
1,825
2,035
2,252
15.9
15.3
248.6
268.1
9.6
8.9
4.2
3.0
43.6
33.9
0.9
0.8
HSIL
Accumulate
276
310
1,996
2,123
2,384
16.1
16.5
15.0
18.9
18.4
14.6
1.4
1.3
8.0
9.4
1.3
1.1
Kirloskar Engines India
Neutral
268
-
3,882
2,403
2,554
8.6
9.9
9.2
10.5
29.2
25.6
2.8
2.7
9.7
10.7
1.2
1.1
Ltd
M M Forgings
Buy
442
546
534
511
615
21.7
21.6
43.1
55.8
10.3
7.9
1.9
1.5
19.9
21.2
1.3
1.0
Banco Products (India) Neutral
153
-
1,097
1,208
1,353
11.0
12.3
10.8
14.5
14.2
10.6
1.6
1.5
11.9
14.5
0.8
0.7
Competent Automobiles Neutral
149
-
92
1,040
1,137
3.2
3.1
25.7
28.0
5.8
5.3
0.9
0.8
15.0
14.3
0.1
0.1
Nilkamal
Neutral
1,262
-
1,883
1,871
2,031
10.7
10.5
63.2
69.8
20.0
18.1
3.3
2.8
17.6
16.6
1.0
0.9
Visaka Industries
Buy
157
162
249
1,020
1,120
8.7
9.1
13.9
20.1
11.3
7.8
0.7
0.7
6.4
8.7
0.4
0.4
Transport Corporation of
Neutral
315
-
2,416
2,830
3,350
8.8
9.0
14.4
18.3
22.0
17.2
3.4
2.9
15.4
17.1
0.9
0.8
India
Elecon Engineering
Neutral
65
-
705
1,359
1,482
10.3
13.7
0.8
3.9
80.6
16.6
1.3
1.3
1.6
7.8
0.8
0.7
Surya Roshni
Buy
167
201
730
2,992
3,223
8.1
8.4
14.7
18.3
11.3
9.1
1.1
1.0
9.7
11.0
0.5
0.5
MT Educare
Neutral
171
-
681
286
366
18.3
17.7
7.7
9.4
22.1
18.2
4.7
4.1
20.2
21.1
2.4
1.8
Radico Khaitan
Buy
93
125
1,237
1,543
1,659
12.6
13.0
5.8
6.3
16.1
14.7
1.4
1.3
8.5
8.6
1.3
1.2
Garware Wall Ropes
Buy
393
460
861
828
898
11.2
10.3
28.3
29.0
13.9
13.6
2.3
2.0
16.8
14.9
0.9
0.8
Wonderla Holidays
Neutral
406
-
2,292
206
308
44.0
43.6
9.0
12.9
45.1
31.5
6.2
5.6
13.7
17.8
10.4
6.9
Linc Pen & Plastics
Accumulate
244
235
360
344
382
9.1
9.1
12.4
13.1
19.7
18.6
3.5
3.1
18.0
16.7
1.0
0.9
The Byke Hospitality
Neutral
162
-
651
222
287
20.5
20.5
5.6
7.6
28.8
21.5
5.4
4.5
18.9
20.8
3.1
2.4
Interglobe Aviation
Neutral
1,015
-
36,589
17,022
21,122
20.7
14.5
63.9
53.7
15.9
18.9
23.8
19.5
149.9
103.2
2.1
1.7
Coffee Day Enterprises
Neutral
256
-
5,263
2,692
2,964
17.0
18.6
-
4.7
-
53.9
3.1
3.0
0.2
5.5
2.4
2.2
Ltd
Navneet Education
Neutral
97
-
2,317
998
1,062
24.1
24.0
5.8
6.1
16.9
16.0
3.7
3.3
22.0
20.6
2.1
2.0
Navkar Corporation
Buy
215
265
3,067
347
408
43.2
42.9
6.7
6.8
32.2
31.8
2.4
2.2
7.3
6.9
8.7
7.9
UFO Moviez
Neutral
570
-
1,573
558
619
32.0
33.2
22.5
30.0
25.3
19.0
3.0
2.6
12.0
13.8
2.5
2.1
VRL Logistics
Neutral
318
-
2,902
1,725
1,902
16.5
16.7
12.2
14.6
26.1
21.8
5.4
4.8
20.8
21.9
1.6
1.4
Stock Watch
July 01, 2016
Company Name
Reco
CMP
Target Mkt Cap
Sales ( Čcr )
OPM(%)
EPS (Č)
PER(x)
P/BV(x)
RoE(%)
EV/Sales(x)
(Č)
Price ( Č)
( Č cr )
FY16E FY17E FY16E FY17E FY16E FY17E FY16E FY17E FY16E FY17E FY16E FY17E FY16E FY17E
zOthers
Team Lease Serv.
Neutral
1,089
-
1,861
2,565
3,229
1.3
1.5
15.2
22.8
71.7
47.8
5.7
5.1
8.0
10.7
0.5
0.4
S H Kelkar & Co.
Neutral
213
-
3,086
928
1,036
15.3
15.1
4.9
6.1
43.2
35.0
4.0
3.7
9.4
10.7
3.2
2.8
Quick Heal
Neutral
270
-
1,892
339
408
27.8
27.3
7.1
7.7
38.2
34.9
3.2
3.2
8.5
9.3
3.8
3.2
Narayana Hrudaya
Neutral
314
-
6,409
1,603
1,873
10.9
11.5
1.0
2.6
329.2
118.6
7.9
7.3
2.4
6.1
4.1
3.5
Manpasand Bever.
Neutral
553
-
2,770
540
836
19.9
19.6
10.2
16.9
54.0
32.8
4.4
3.9
8.1
12.0
4.7
3.0
Source: Company, Angel Research; Note: *December year end; #September year end; &October year end; Price as on June 30, 2016
Market Outlook
July 01, 2016
Research Team Tel: 022 - 39357800
DISCLAIMER
Angel Broking Private Limited (hereinafter referred to as “Angel”) is a registered Member of National Stock Exchange of India Limited,
Bombay Stock Exchange Limited and Metropolitian Stock Exchange of India Limited. It is also registered as a Depository Participant with
CDSL and Portfolio Manager with SEBI. It also has registration with AMFI as a Mutual Fund Distributor. Angel Broking Private Limited is a
registered entity with SEBI for Research Analyst in terms of SEBI (Research Analyst) Regulations, 2014 vide registration number
INH000000164. Angel or its associates has not been debarred/ suspended by SEBI or any other regulatory authority for accessing
/dealing in securities Market. Angel or its associates including its relatives/analyst do not hold any financial interest/beneficial ownership
of more than 1% in the company covered by Analyst. Angel or its associates/analyst has not received any compensation / managed or co
-managed public offering of securities of the company covered by Analyst during the past twelve months. Angel/analyst has not served as
an officer, director or employee of company covered by Analyst and has not been engaged in market making activity of the company
covered by Analyst.
This document is solely for the personal information of the recipient, and must not be singularly used as the basis of any investment
decision. Nothing in this document should be construed as investment or financial advice. Each recipient of this document should make
such investigations as they deem necessary to arrive at an independent evaluation of an investment in the securities of the companies
referred to in this document (including the merits and risks involved), and should consult their own advisors to determine the merits and
risks of such an investment.
Reports based on technical and derivative analysis center on studying charts of a stock's price movement, outstanding positions and
trading volume, as opposed to focusing on a company's fundamentals and, as such, may not match with a report on a company's
fundamentals.
The information in this document has been printed on the basis of publicly available information, internal data and other reliable sources
believed to be true, but we do not represent that it is accurate or complete and it should not be relied on as such, as this document is for
general guidance only. Angel Broking Pvt. Limited or any of its affiliates/ group companies shall not be in any way responsible for any
loss or damage that may arise to any person from any inadvertent error in the information contained in this report. Angel Broking Pvt.
Limited has not independently verified all the information contained within this document. Accordingly, we cannot testify, nor make any
representation or warranty, express or implied, to the accuracy, contents or data contained within this document. While Angel Broking
Pvt. Limited endeavors to update on a reasonable basis the information discussed in this material, there may be regulatory, compliance,
or other reasons that prevent us from doing so.
This document is being supplied to you solely for your information, and its contents, information or data may not be reproduced,
redistributed or passed on, directly or indirectly.
Neither Angel Broking Pvt. Limited, nor its directors, employees or affiliates shall be liable for any loss or damage that may arise from or
in connection with the use of this information.
Note: Please refer to the important ‘Stock Holding Disclosure' report on the Angel website (Research Section). Also, please refer to the
latest update on respective stocks for the disclosure status in respect of those stocks. Angel Broking Pvt. Limited and its affiliates may have
investment positions in the stocks recommended in this report.