Market Outlook
February 1, 2016
Market Cues
Domestic Indices
Chg (%)
(Pts)
(Close)
Indian markets are expected to open in positive tracking the SGX Nifty.
BSE Sensex
1.6
401
24,871
Traders reacted positively to an unexpected monetary policy move by the Bank of
Nifty
1.9
139
7,564
Japan which led Dow Jones rose 2.5% on Friday. The gains on the day helped the
Mid Cap
2.0
206
10,417
major averages more than offset the steep drop seen on Wednesday. The rally on
Small Cap
1.1
115
10,870
Wall Street was partly in reaction to the Bank of Japan's surprise decision to
Bankex
0.7
123
17,604
introduce negative interest rates. Traders were also digesting the latest U.S.
economic news which included a Commerce Department report showing a
slowdown in GDP growth in the December quarter.
Global Indices
Chg (%)
(Pts)
(Close)
Dow Jones
2.5
397
16,466
The European markets ended in positive territory with the markets followed their
Asian peers higher after the Bank of Japan's negative interest rate move. Crude oil
Nasdaq
2.4
107
4,614
prices also continued their recent recovery Friday, rising back to around $34 a
FTSE
2.6
152
6,084
barrel.
Nikkei
2.8
477
17,518
Indian shares joined the global rally on Friday as oil extended overnight gains.
Hang Seng
2.5
487
19,683
Chinese shares steadied and investors reacted to the the Bank of Japan's negative
Shanghai Com
3.1
82
2,738
interest rate move. Yes Bank soared 10.9% after reporting a better-than-expected
25% increase in Q3 profit. Vedanta climbed 6.7% despite reporting a 99% fall in
Advances / Declines
BSE
NSE
quarterly profit. Maruti Suzuki India ended flat and ICICI Bank dropped 1.2% after
posting disappointing results for the December quarter.
Advances
1,558
1,021
Declines
1,047
541
News & Result Analysis
Unchanged
191
64
Result Review: Yes Bank, Blue Star, Larsen & Toubro, United Phosphorus,
Banco Products, Elecon Engineering, Relaxo Footwear, Indoco Remedies
Volumes (` Cr)
Result Preview: Tech Mahindra
Detailed analysis on Pg2
BSE
2,697
NSE
20,637
Investor’s Ready Reckoner
Key Domestic & Global Indicators
Net Inflows (` Cr)
Net
Mtd
Ytd
Stock Watch: Latest investment recommendations on 150+ stocks
FII
(761)
(8,251)
(7,584)
Refer P8 onwards
MFs
810
2,764
72,180
Top Picks
CMP
Target
Upside
Company
Sector
Rating
Top Gainers
Price (`)
Chg (%)
(`)
(`)
(%)
Amara Raja Batteries Auto & Auto Ancillary
Buy
837
1,040
24.2
Srtransfin
842
11.9
HCL Tech
IT
Buy
866
1,038
19.9
Yesbank
747
10.9
HDFC Bank
Financials
Buy
1,049
1,262
20.3
Suzlon
20
7.7
LIC Housing Finance Financials
Buy
476
592
24.3
Titan
364
7.3
Navkar Corporation Others
Buy
200
265
32.7
Suntv
379
7.0
More Top Picks on Pg7
Key Upcoming Events
Top Losers
Price (`)
Chg (%)
Previous
Consensus
Date
Region
Event Description
Justdial
609
(15.2)
Reading
Expectations
Syndibank
68
(3.8)
Feb 01
UK
PMI Manufacturing
51.90
51.60
Feb 02
India
RBI Repo Rate (%)
6.75
6.75
Jetairways
603
(3.8)
Feb 05
US
Change in Nonfarm payrolls (thousands)
292
190
Unitdspr
2,488
(3.6)
Feb 04
UK
BOE Announces rates
0.50
0.50
Bankbaroda
126
(3.3)
6.(
As on January 29, 2015
Market Outlook
February 1, 2016
Result Review
Yes Bank (CMP: `747/ TP: `767/ Upside: 2.7%)
Yes Bank reported a healthy performance during the quarter with PAT growth of
25.1% yoy to `675.7cr, above our expectations. NII for the bank grew at healthy
pace of 27.3% yoy, on account of strong growth in advances and Retail & CASA
deposits. Reported NIM inched up to 3.4% as compared to 3.3% in 2QFY16.
CASA Ratio improved to 26.6% from 22.6% a year ago on the back of savings
deposits robust growth of 64.1% y-o-y. Advances jumped 26.7% yoy to `84,396cr
which is a healthy number given the sluggish credit growth in the economy. Non
Interest Income continued to deliver healthy growth at 39.0% yoy while operating
expenses grew by 29.2% yoy led by growth in staff as well as other operating
expenses. On the asset quality front, Gross NPA and Net NPA ratios marginally
inched up to 0.66% and 0.22% respectively in 3QFY2016 as compared to 0.61%
and 0.20% in 2QFY2016 which remains comfortable. The bank indicated that
there has neither been any sale to ARC during the previous four quarters nor the
bank has refinanced any loan through 5-25 route.
The bank’s asset quality performance has held up well so far. Going forward, we
have factored higher provisions and slippages given the bank’s corporate
exposure to metals and EPC. Even after factoring the higher provisions and
slippages, we expect Yes Bank to deliver a CAGR of 20.5% in earnings for
FY2015-17E. Currently the stock trades at 1.9x FY2017E ABV. We recommend
NEUTRAL rating on the stock.
Y/E
Op. Inc NIM
PAT
EPS
ABV ROA ROE
P/E
P/ABV
Mar
(` cr)
(%)
(` cr)
(`)
(%)
(x)
(x)
(x)
(x)
FY2016E
7,190
3.2
2,433
58.2
326.1
1.6
19.2
12.8
2.3
FY2017E
9,011
3.3
2,910
69.7
383.7
1.6
19.6
10.7
1.9
Blue Star Ltd (CMP: `362/ TP: `439 / Upside: 21.5%)
Blue Star reported 3QFY2016 numbers that were broadly in line with our
estimates. The standalone top-line for the quarter reported an impressive 15.1%
yoy increase to `686cr. This is above our estimate of `641cr. Both Electro
Mechanical Projects and Packaged Air-conditioning Systems (EMPPAC) business
and Cooling Products business reported healthy growth of 21.5% yoy and 21.0%
yoy to `439cr and `238cr, respectively. The PEIS business top-line came in at `9cr
against `38cr in 3QFY2015. However yoy comparison for PEIS business is not
reasonable as the segment has been transferred to Blue Star’s subsidiary, BSEEL.
On operating front, the EBITDA margin expanded by 259bp yoy to 4.1% which is
in-line with our estimate of 4.0%. The raw material cost as a percentage of sales
increased by 175bp yoy to 68.9% but this was made up by 94bp yoy and 341bp
yoy decline in Employee and Other expenses to 9.7% and 17.4%, respectively. The
EBIT margins for EMPPAC, Cooling Products and PEIS were 5.8%, 7.1% and 18.7%
respectively. There was an exceptional loss of `2cr during the quarter due to bonus
expenses for earlier years pursuant to retrospective amendment in the statute.
Adjusting for exceptional item, the net profit came in at `7cr which is marginally
below our estimate of `8cr.
Market Outlook
February 1, 2016
We remain positive on the stock as its RAC business continues to outperform the
market by 10% points and continues to gain market share. Also, the performance
of the EMPPAC business is showing gradual improvement which should also aid
growth. We maintain our Buy rating on the stock.
Y/E
Sales OPM
PAT
EPS ROE P/E P/BV EV/EBITDA EV/Sales
March
(` cr)
(%)
(` cr)
(`)
(%)
(x)
(x)
(x)
(x)
FY2016E
3,548
6.3
123
13.7
26.1
26.4
6.6
16.0
1.0
FY2017E
3,977
6.9
164
17.2
25.4
21.1
4.3
12.5
0.9
FY2018E
4,375
7.1
182
19.1
21.1
18.9
3.7
10.7
0.8
Larsen & Toubro (CMP: `1,102/ TP: ` Under Review )
Larsen & Toubro (L&T; standalone entity) reported bad set of numbers for
3QFY2016, both at the top-line and the bottom-line level. The company reported
YoY top-line de-growth at 1.5% YoY to `14,774cr (vs. our expectation of 6% YoY
growth). Revenue de-growth on YoY basis is owing to lower revenue booking
across Infrastructure and Metallurgical & Material Handling segments. The
disappointment continued further towards the EBITDA level; the company reported
a 368bp YoY decline in EBITDA margin to 6.8%. Revenue de-growth and 38.0%
YoY increase in sales, admin and other expenses, led to EBITDA margin
compression. During the quarter, L&T reported gain from stake sale in subsidiary
and associate company to the tune of `92cr. Adjusting for the same, Adj. PAT of
the company were at `791cr. Adj. PAT was also impacted due to muted other
income, which declined 0.8% YoY to `617cr.
For 3QFY2016 L&T reported consol, order inflows of `38,500cr. L&T in order to
attain its revised flattish Order inflow guidance for FY2016 needs to report ~
`61,900cr in 4QFY2016. This translates to asking rate of 30% order inflows
growth in 4QFY2016, which in our view is very challenging.
Even though there have been delays on the awarding front, we believe in the
Indian Infra growth story. Given the company’s market positioning, we expect L&T
to be well positioned and to gain from an expected gradual recovery in the capex
cycle, given its exposure to a range of sectors, and better cash flow generating
potential vis-a-vis its peers. We maintain our positive view on L&T; and maintain
our BUY rating on the stock.
United Phosphorus (CMP: `411/ TP: `510/ Upside: 24.1%)
United Phosphorus, posted sales of `3050cr, a yoy growth of 1.3% in 3QFY2016.
The sales were impacted as all the key markets during the quarter were under
pressure, while USA and Latin America, posted a 12% and 14% yoy growth in
3QFY2016. Other key markets like India, Europe and ROW posted a dip of 17%,
9% and 8% respectively. Overall, the growth was driven by price and volume
growth of 3% and 11% respectively, the exchange which was the main culprit was
dipped by 13%.
India (`498cr) posted a 17% dip on back of serious drought conditions affecting
agrochemical usage both in Kharif & Rabi crops. Europe ( `300cr) posted a 9%
dip due to devaluation of Euro which impacted growth in `terms. European
Market Outlook
February 1, 2016
markets likely to be reported flat to de-growth in Europe. Latin America (`1,279cr),
posted a yoy 14% growth on back of high demand of fungicide.
On operating front, the OPM’s came in at 19.0% V/s 17.9% in 3QFY2015, in spite
of the lower sales, as the GPM improved from 54.2% V/s 48.8% in 3QFY2015 on
back of healthy volume growth and price rise. This aided the Adj. net profit to
come in at `306cr V/s `264cr, a 15.8% yoy growth. We maintain our buy with a
price target of `510.
Y/E
Sales OPM
PAT
EPS ROE P/E P/BV EV/EBITDA EV/Sales
March
(` cr)
(%)
(` cr)
(`)
(%)
(x)
(x)
(x)
(x)
FY2016E
13,698
17.6
1,376
32.1
21.4
13.6
2.7
10.3
1.8
FY2017E
15,752
17.6
1,651
38.5
21.3
11.3
2.2
8.6
1.5
Banco Products (CMP: `128/ TP: -/ Upside: -)
For 3QFY2016, Banco has posted numbers that are in-line with our estimates. The
Consolidated top-line has grown by 8.4% yoy to `264cr, against our expectation
of `270 cr. The operating performance has improved mainly due to 168bp yoy
decline in employee cost to 14.4% of sales. The EBITDA grew by 25.1% yoy to
`27cr (in-line with our estimate of `28cr) and EBITDA margin expanded by
137bp yoy to 10.3% which is also in-line with our estimate of 10.5%. Aided by
better operating performance, the consolidated net profit grew by 32.2% yoy to
`15cr.
The improvement company’s performance on the consolidated level is mainly on
the back of its strong performance by the standalone business where it posted a
top-line growth of 16.3% yoy to `112cr, EBITDA almost doubled to `20cr, and net
profit grew by 51.5% yoy to `14cr. This indicates that the Netherland subsidiary is
proving to be a drag on the overall performance while the standalone business
maintains its performance. Additionally, the company had recently filed an
application with the Directorate General of Anti-Dumping and Allied
Duties alleging that there are cheaper imports of Aluminium Radiators, Sub-
Assemblies and Aluminium Radiator Core coming in from China. Since the
company is a major player, levying of anti dumping duty on radiators from China
will definitely be crucial from company’s standpoint.
At the current market price, the stock is trading at PE of 8.2x its FY2017E earnings.
We maintain our Neutral view on the stock.
Y/E
Sales OPM
PAT
EPS ROE P/E P/BV EV/EBITDA EV/Sales
March
(` cr)
(%)
(` cr)
(`)
(%)
(x)
(x)
(x)
(x)
FY2016E
1,191
11.9
85
11.9
13.1
10.7
1.3
6.0
0.7
FY2017E
1,334
13.3
111
15.5
15.3
8.2
1.2
4.6
0.6
Elecon Engineering (CMP: `65/ TP: -/ Upside: -)
For 3QFY2016, Elecon Engineering reported a disappointing set of numbers. The
consolidated top-line grew by 10.6% on yoy basis to `330cr mainly led by the
overseas business and MHE business. The standalone top-line grew by 6.0% yoy to
`120cr. On operating front, the consolidated EBITDA margins deteriorated sharply
by 872bp yoy to 2.8% mainly on the back of spike in raw material cost and other
expenses. Raw material cost and other expenses increased by 717bp yoy and
Market Outlook
February 1, 2016
189bp yoy to 69.0% and 16.6% of sales respectively. The standalone EBITDA
margins declined by 891bp yoy mainly on account of unfavorable revenue mix
involving bulk of the shipments of low margins. The other income was higher at
`30cr on account of profit from the sale of surplus land amounting to `21.6cr.
Adjusting for profit from sale of land and accounting for minority interest and
share of profits from associates, the company reported a consolidated loss of
`10cr.
The standalone (gear) business reported a 56.4% yoy decline in net profit to `3cr
while the MHE business reported a total loss of ~`19.5cr (as per our estimates).
Although the long term prospect of the company remains intact, we acknowledge
the cautious commentary provided by the management in the result update. Hence
we currently have a Neutral view on the stock and will update our rating and
numbers post management discussion.
Relaxo Footwears (CMP: `467/ TP: -/ Upside: -)
For 3QFY2016, Relaxo reported numbers that were in-line with our estimates. The
top-line grew by 16.9% yoy to `386cr, which is in line with our estimate of `387cr.
The gross margin expanded by 72bp yoy to 58.3% and net raw material cost as a
percentage sales came in at 41.7%. On the back of lower raw material cost, the
EBITDA margin expanded by 119bp yoy to 13.5% vis-à-vis our estimate of 13.4%.
The interest expense has increased by 44.6% yoy to `6cr while depreciation cost
increased by 24.1% yoy to `12cr. As a result, the net profit grew by 22.6% yoy to
`24cr, which slightly below our estimate of `26xr. At current market price, the
stock trades at 32.3x its FY2017E earnings. We have a Neutral view on the stock.
Y/E
Sales OPM
PAT
EPS ROE P/E P/BV EV/EBITDA EV/Sales
March
(` cr)
(%)
(` cr)
(`)
(%)
(x)
(x)
(x)
(x)
FY2016E
1,741
13.8
129
10.7
30.0
43.6
11.5
23.9
3.3
FY2017E
2,097
14.9
174
14.5
30.6
32.3
8.7
18.2
2.7
Indoco Remedies (CMP: `323/ TP: / Upside: )
Indoco Remedies results were in line with expectations, on sales front, while net
profit was lower on back of the lower than expected OPM’s. On sales the company
posted sales of `255cr ( V/s 257cr estimated) , a yoy growth of 19.6%. The growth
during the quarter came in through exports (`112.1cr) a yoy growth of 34.6%,
while domestic markets posted sales of `141.9cr, a yoy growth of 9.8%. Exports
growth during the period was aided by the regulated markets (`90.4cr) a yoy
growth of 36.3% and emerging markets (`139.0cr) a yoy growth of 32.6%. The
domestic formulation (`135.7cr) posted a yoy growth of 10.5%.
On the operating front, the OPM’s have come in at 15.4% (V/s 16.5% expected)
and 18.3% in 3QFY2015. The margins have declined on back of 30.7% and
76.3% rise in employee expenditure and R&D expenditure respectively. Thus the,
net profit came in at `20.4cr V/s `21.6cr in 3QFY2015, a yoy dip of 5.6%. This is
against expectations of `25.4cr.
Also, during the quarter, USFDA audited Company’s finished dosage (Plant I) at
Goa. Establishment Inspection Reports (EIRs) for the Finished Dosage Plant I,
Sterile Plant II and Finished Dosage Plant III at Goa are awaited. Overall, we are
neutral on the stock.
Market Outlook
February 1, 2016
Y/E
Sales OPM
PAT
EPS ROE P/E P/BV EV/EBITDA EV/Sales
March
(` cr)
(%)
(` cr)
(`)
(%)
(x)
(x)
(x)
(x)
FY2016E
1,033
15.9
87
9.4
15.7
34.3
5.1
19.0
3.0
FY2017E
1,199
18.2
125
13.6
19.7
23.7
4.3
14.2
2.6
Result Preview
Tech Mahindra (CMP: `502/ TP: `646 / Upside: 28.7% )
Tech Mahindra for 3QFY2016 is expected to post a 1.0% QoQ growth in the sales
front to end the period at US$1,021mn V/s US$1,011mn in 2QFY2016. In rupee
terms, the company is expected to post sales of `6,729cr V/s `6,616cr, a QoQ
growth of 1.7%. On the operating front, the EBDITA is expected to come in at
17.2% V/s 16.6% in 2QFY2016, an QoQ expansion of 53bps, while the EBIT
would come in at 14.2% V/s 13.7% in 2QFY2016. On net profit, the company is
expected to post a net profit of `809cr V/s `786cr in 2QFY2016, a QoQ growth
of 3.0%. We remain positive on the stock with a price target of `646.
Y/E
Sales OPM
PAT
EPS ROE P/E P/BV EV/EBITDA EV/Sales
Mar
(` cr)
(%)
(` cr)
(`)
(%)
(x)
(x)
(x)
(x)
FY2016E
25,566
16.0
2,528
26.3 17.9 19.1
3.4
10.9
1.7
FY2017E
28,890
17.0
3,066
31.9 18.6 15.7
2.9
8.7
1.5
Quarterly Bloomberg Brokers Consensus Estimate
Tech Mahindra Ltd - February 1, 2016
Particulars (` cr)
3QFY16E
3QFY15
y-o-y (%)
2QFY16
q-o-q (%)
Net sales
6,749
5,752
17.3
6,615
2.0
EBITDA
1,162
1,059
9.7
1,101
5.5
EBITDA margin (%)
17.2
18.4
16.6
Net profit
771
805
(4.2)
785
(1.8)
Economic and Political News
Coal Secretary appreciates MCL, eyes 250 mn ton output by 2020
Excise duty raised on petrol by `1/litre, on diesel by `1.5
Jaitley vows more reforms, eyes 8-9% growth
Corporate News
Grasim to spend over `4,000 crore on capex in FY17
Blue Star enters air cooler segment, eyes `150 cr sales
NBCC aims for `1 lakh crore order book by 2020-end
Market Outlook
February 1, 2016
Top Picks ★★★★★
Large Cap
Market Cap
CMP
Target
Upside
Company
Rationale
(` Cr)
(`)
(`)
(%)
To outpace battery industry growth due to better technological
Amara Raja Batteries
14,298
837
1,040
24.2
products leading to market share gains in both the automotive
OEM and replacement segments.
Earnings to grow strongly given the MHCV cyclical upturn.
Ashok Leyland
25,428
89
111
24.2
Focus on exports and LCV's provides additional growth
avenue.
The stock is trading at attractive valuations and is factoring all
HCL Tech
1,22,047
866
1,038
19.9
the bad news.
Strong visibility for a robust 20% earnings trajectory, coupled
HDFC Bank
2,64,869
1,049
1,262
20.3
with high quality of earnings on account of high quality retail
business and strategic focus on highly rated corporates.
Back on the growth trend, expect a long term growth of 14%
Infosys
2,67,560
1,165
1,347
15.6
to be a US$20bn in FY2020.
Well positioned to benefit from such expected gradual
recovery in the overall domestic capex cycle, given its presence
Larsen & Toubro
1,02,638
1,102
1,646
49.3
across various infrastructure segments, its execution
capabilities, and its strong balance sheet.
LICHF continues to grow its retail loan book at a healthy pace
with improvement in asset quality. We expect the company to
LIC Housing Finance
24,017
476
592
24.3
post a healthy loan book which is likely to reflect in a strong
earnings growth.
Source: Company, Angel Research
Mid Cap
Market Cap
CMP
Target
Upside
Company
Rationale
(` Cr)
(`)
(`)
(%)
Favourable outlook for the AC industry to augur well for
Cooling products business which is out pacing the market
Blue Star
3,253
362
439
21.4
growth. EMPPAC division's profitability to improve once
operating environment turns around.
Change in business focus towards high-margin chronic &
Garware Wall Ropes
778
355
473
33.1
lifestyle segments and increasing penetration in Europe and
US
Economic recovery to have favourable impact on advertising &
circulation revenue growth. Further, the acquisition of a radio
Jagran Prakashan
5,299
162
189
16.6
business (Radio City) would also boost the company's revenue
growth.
Massive capacity expansion along with rail advantage at ICD
Navkar Corporation
2,849
200
265
32.7
as well CFS augurs well for the company
Earnings boost on back of stable material prices and
Radico Khaitan
1,517
114
156
36.8
favourable pricing environment. Valuation discount to peers
provides additional comfort
Strong brands and distribution network would boost growth
Siyaram Silk Mills
1,018
1,086
1,354
24.7
going ahead. Stock currently trades at an inexpensive
valuation.
Structural shift in the Lighting industry towards LED lighting will
Surya Roshni
661
151
201
33.3
drive growth.
Source: Company, Angel Research
Market Outlook
February 01, 2016
Key Upcoming Events
Result Calendar
Date
Company
Feb 1, 2016
Tech Mahindra, Abbott India, Transport Corporation of India
Feb 2, 2016
Amara Raja Batteries, Cummins India, Crompton Greaves, HSIL, DLF
Feb 3, 2016
Mangalam Cement, Hexaware, IOC, The Byke Hospitality
Feb 4, 2016
Bajaj Auto, ABB, J K Lakshmi Cements, Mphasis, Tata Steel, GSPL, Styrolution, Visaka Industries, Aventis, MT Educare
Feb 5, 2016
Bosch India, Vijaya Bank, Goodyear, Lupin, Cadila Healthcare, Divi's Lab., Tata Power Co., PTC India, Radico Khaitan
Feb 6, 2016
Prakash Industries, TVS Srichakra
Feb 8, 2016
JK Tyre, GlaxoSmith Con, Hitachi, Sterling Tools, Ipca labs
Motherson Sumi, Apollo Tyres, Ramco Cements, Allahabad Bank, Britannia, SAIL, Hindalco, MOIL, GAIL, Petronet
Feb 9, 2016
LNG, Dr Reddy's, Aurobindo Pharma, CESC
Tata Chemicals, Tata Global, Automotive Axle, Ambuja Cements, ACC, India Cements, Rural Elec.Corp., Bank of
Feb 10, 2016
Maharashtra, Bajaj Electrical, Finolex Cables, GSK Pharma, NHPC
Tata Motors, Ashok Leyland, BHEL, BGR Energy , Indian Bank, ONGC, Indraprasth Gas, Page Industries, GIPCL,
Feb 11, 2016
Coffee Day Enterprises Ltd
Feb 12, 2016
M&M, FAG Bearings, Nestle, BPCL, HPCL, Sun Pharma
Source: Bloomberg, Angel Research
Global economic events release calendar
Date
Time
Country
Event Description
Unit
Period
Bloomberg Data
Last Reported Estimated
Feb 1, 2016
2:25PM
Germany
PMI Manufacturing
Value
Jan F
52.10
52.10
3:00PM
UK
PMI Manufacturing
Value
Jan
51.90
51.60
6:30AM
China
PMI Manufacturing
Value
Jan
49.70
49.60
Feb 2, 2016
2:25PM
Germany
Unemployment change (000's)
Thousands
Jan
(14.00)
(8.00)
11:00AM
India
RBI Reverse Repo rate
%
Feb 2
5.75
5.75
11:00AM
India
RBI Repo rate
%
Feb 2
6.75
6.75
11:00AM
India
RBI Cash Reserve ratio
%
Feb 2
4.00
4.00
Feb 3, 2016
2:25PM
Germany
PMI Services
Value
Jan F
55.40
55.40
Feb 4, 2016
7:00PM
US
Initial Jobless claims
Thousands
Jan 30
278.00
280.00
5:30PM
UK
BOE Announces rates
% Ratio
Feb 4
0.50
0.50
Feb 5, 2016
7:00PM
US
Change in Nonfarm payrolls
Thousands
Jan
292.00
190.00
7:00PM
US
Unnemployment rate
%
Jan
5.00
5.00
Feb 10, 2016
India
Imports YoY%
% Change
Jan
(3.90)
--
India
Exports YoY%
% Change
Jan
(14.70)
--
3:00PM
UK
Industrial Production (YoY)
% Change
Dec
0.90
--
Feb 12, 2016
7:30AM
India
Industrial Production YoY
% Change
Dec
(3.20)
--
3:30PM
Euro Zone
Euro-Zone GDP s.a. (QoQ)
% Change
4Q A
0.30
--
12:30PM
Germany
GDP nsa (YoY)
% Change
4Q P
1.80
--
Feb 15, 2016
12:00PM
India
Monthly Wholesale Prices YoY%
% Change
Jan
(0.73)
--
China
Exports YoY%
% Change
Jan
(1.40)
--
Feb 16, 2016
3:00PM
UK
CPI (YoY)
% Change
Jan
0.20
--
Feb 17, 2016
7:00PM
US
Housing Starts
Thousands
Jan
1,149.00
--
7:00PM
US
Building permits
Thousands
Jan
1,204.00
--
3:00PM
UK
Jobless claims change
% Change
Jan
(4.30)
--
7:45PM
US
Industrial Production
%
Jan
(0.36)
--
US
Producer Price Index (mom)
% Change
Jan
(0.70)
--
Feb 18, 2016
7:00AM
China
Consumer Price Index (YoY)
% Change
Jan
1.60
--
Feb 19, 2016
7:00PM
US
Consumer price index (mom)
% Change
Jan
(0.10)
--
8:30PM
Euro Zone
Euro-Zone Consumer Confidence
Value
Feb A
(6.30)
--
Feb 23, 2016
8:30PM
US
Existing home sales
Million
Jan
5.46
--
8:30PM
US
Consumer Confidence
S.A./ 1985=100
Feb
98.10
--
Market Outlook
February 01, 2016
Key Upcoming Events
Feb 24, 2016 8:30PM US
New home sales
Thousands
Jan
544.00
--
Feb 25, 2016 3:00PM UK
GDP (YoY)
% Change
4Q P
1.90
--
3:30PM Euro Zone
Euro-Zone CPI (YoY)
%
Jan F
0.40
--
Feb 26, 2016 7:00PM US
GDP Qoq (Annualised)
% Change
4Q S
0.70
--
Source: Bloomberg, Angel Research
Market Outlook
February 1, 2016
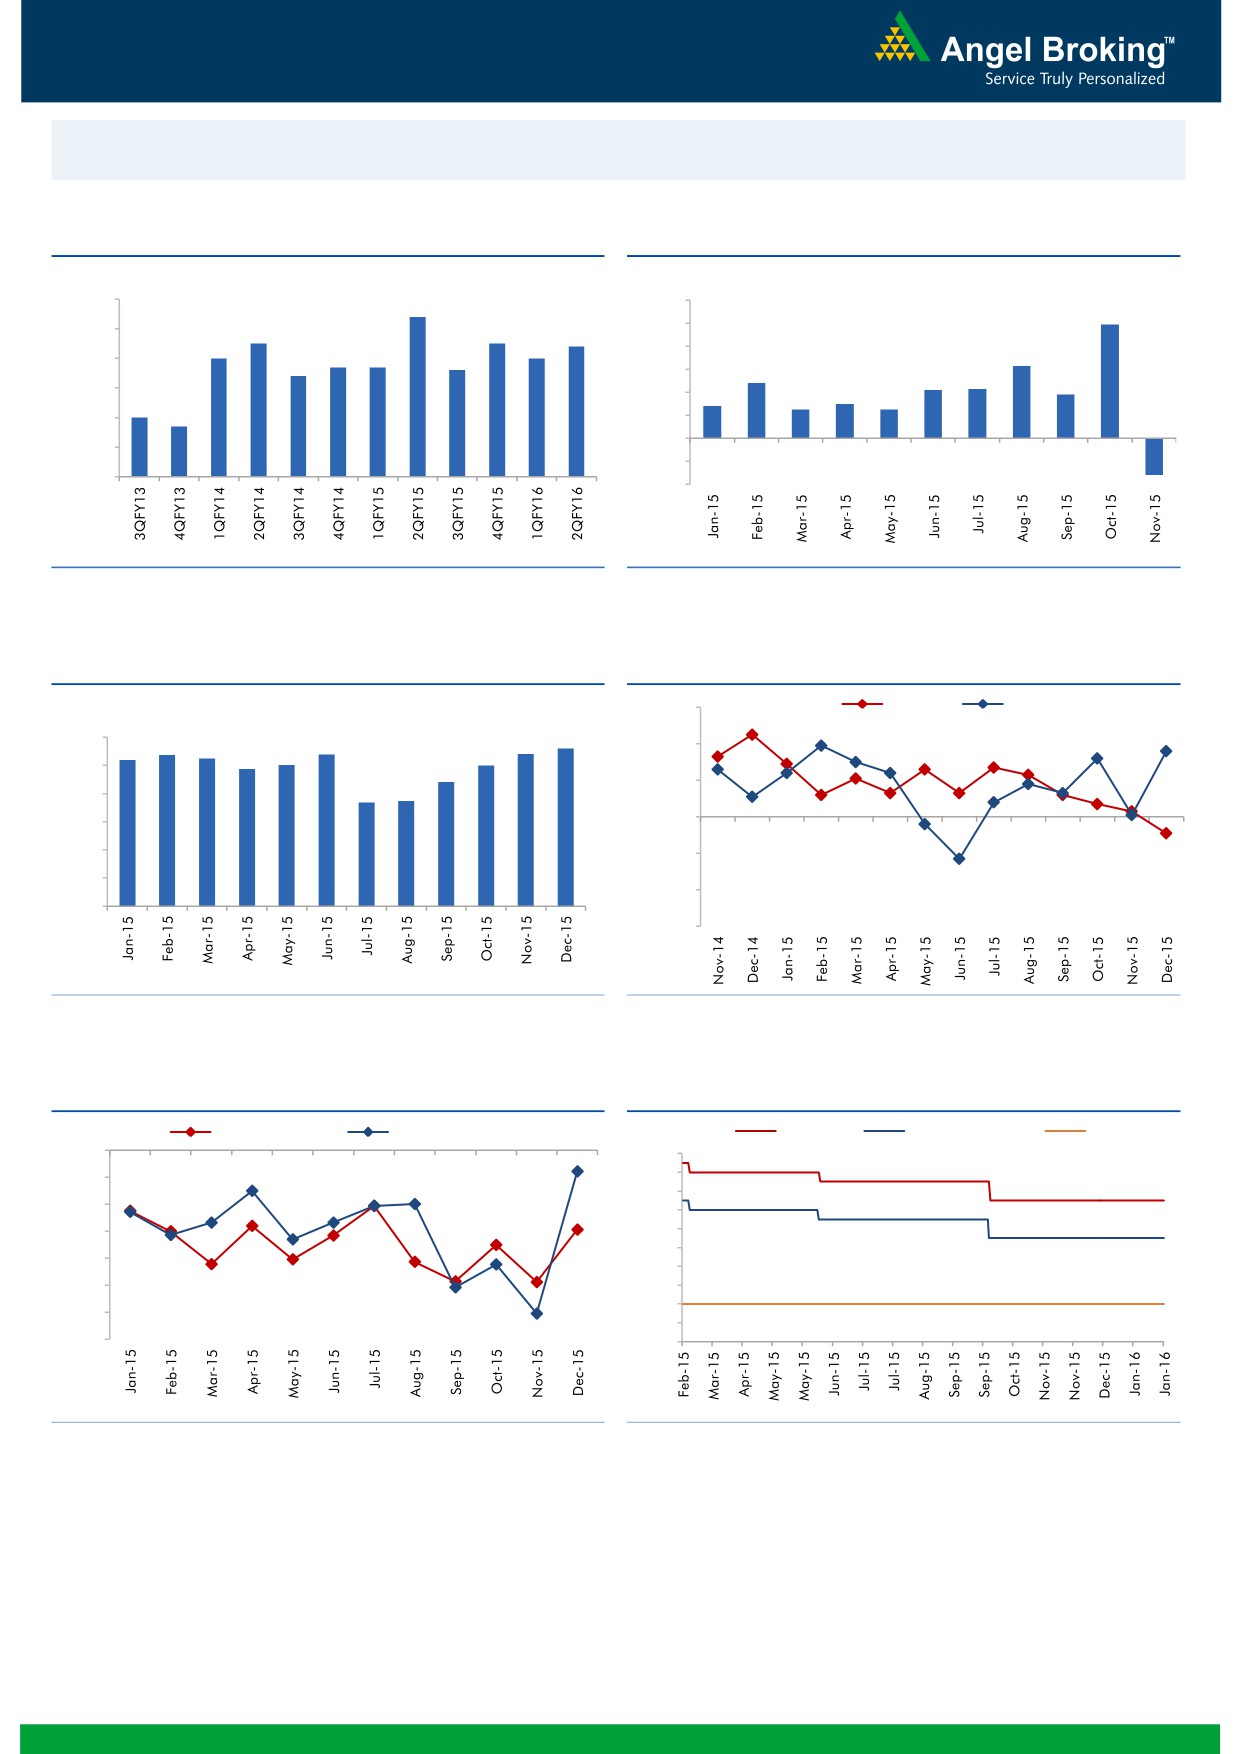
Macro watch
Exhibit 1: Quarterly GDP trends
Exhibit 2: IIP trends
(%)
(%)
9.0
8.4
12.0
9.9
7.5
7.5
10.0
8.0
7.4
7.0
7.0
6.7
6.7
6.6
8.0
6.3
7.0
6.4
6.0
4.8
4.3
4.2
3.8
6.0
2.8
3.0
4.0
2.5
2.5
5.0
4.7
5.0
2.0
(3.2)
-
4.0
(2.0)
3.0
(4.0)
Source: CSO, Angel Research
Source: MOSPI, Angel Research
Exhibit 3: Monthly CPI inflation trends
Exhibit 4: Manufacturing and services PMI
(%)
56.0
Mfg. PMI
Services PMI
5.4
5.4
5.6
6.0
5.2
5.4
5.3
54.0
4.9
5.0
5.0
5.0
4.4
3.7
3.7
52.0
4.0
3.0
50.0
2.0
48.0
1.0
46.0
-
44.0
Source: MOSPI, Angel Research
Source: Market, Angel Research; Note: Level above 50 indicates expansion
Exhibit 5: Exports and imports growth trends
Exhibit 6: Key policy rates
(%)
Exports yoy growth
Imports yoy growth
(%)
Repo rate
Reverse Repo rate
CRR
0.0
8.00
(5.0)
7.50
7.00
(10.0)
6.50
(15.0)
6.00
5.50
(20.0)
5.00
(25.0)
4.50
4.00
(30.0)
3.50
(35.0)
3.00
Source: Bloomberg, Angel Research
Source: RBI, Angel Research
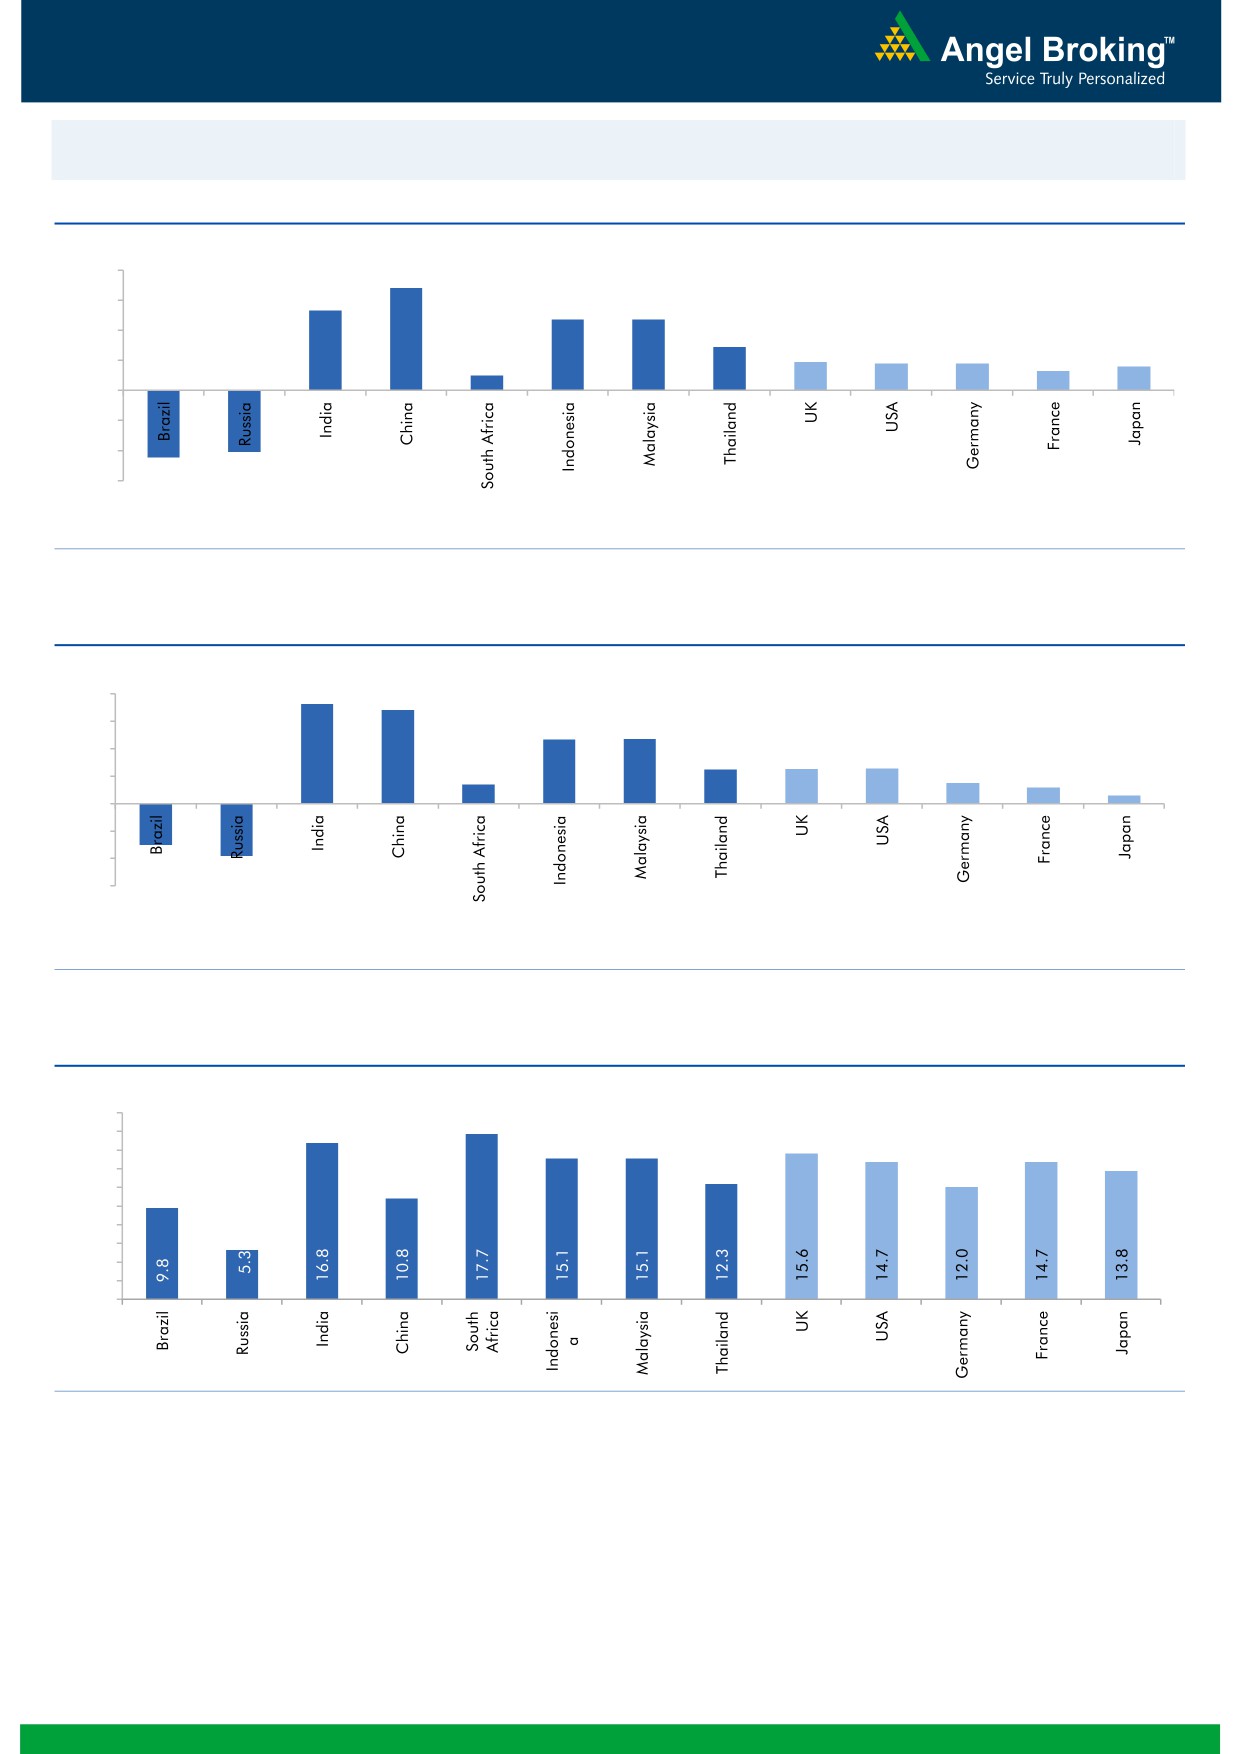
Market Outlook
February 1, 2016
Global watch
Exhibit 1: Latest quarterly GDP Growth (%, yoy) across select developing and developed countries
(%)
8.0
6.8
5.3
6.0
4.7
4.7
4.0
2.9
1.9
1.8
1.8
1.0
1.3
1.6
2.0
-
(2.0)
(4.0)
(4.1)
(4.5)
(6.0)
Source: Bloomberg, Angel Research
Exhibit 2: 2015 GDP Growth projection by IMF (%, yoy) across select developing and developed countries
(%)
7.3
8.0
6.8
6.0
4.7
4.7
4.0
2.5
2.5
2.6
1.4
1.5
1.2
2.0
(3.0)
0.6
(3.8)
-
(2.0)
(4.0)
(6.0)
Source: IMF, Angel Research
Exhibit 3: One year forward P-E ratio across select developing and developed countries
(x)
20.0
18.0
16.0
14.0
12.0
10.0
8.0
6.0
4.0
2.0
-
Source: IMF, Angel Research
Market Outlook
February 1, 2016
Exhibit 4: Relative performance of indices across globe
Returns (%)
Country
Name of index
Closing price
1M
3M
1YR
Brazil
Bovespa
40,406
(16.1)
(19.4)
(21.6)
Russia
Micex
1,785
(6.4)
(5.9)
3.4
India
Nifty
7,564
(5.8)
(11.3)
(13.9)
China
Shanghai Composite
2,738
(19.4)
(12.9)
(9.3)
South Africa
Top 40
44,066
(7.4)
(12.8)
(3.4)
Mexico
Mexbol
43,631
(6.1)
(7.9)
(2.2)
Indonesia
LQ45
800
1.7
(0.1)
(14.4)
Malaysia
KLCI
1,668
(0.2)
(2.3)
(5.8)
Thailand
SET 50
826
(7.3)
(16.0)
(23.8)
USA
Dow Jones
16,466
(11.2)
(8.4)
(10.2)
UK
FTSE
6,084
(3.7)
(5.5)
(10.3)
Japan
Nikkei
17,518
(6.7)
(6.9)
1.4
Germany
DAX
9,798
(10.1)
(7.1)
(10.0)
France
CAC
4,417
(11.8)
(11.7)
(10.8)
Source: Bloomberg, Angel Research
Stock Watch
February 01, 2016
Company Name
Reco
CMP
Target
Mkt Cap
Sales ( Čcr )
OPM(%)
EPS (Č)
PER(x)
P/BV(x)
RoE(%)
EV/Sales(x)
(Č)
Price ( Č)
( Č cr )
FY16E FY17E
FY16E
FY17E
FY16E
FY17E
FY16E
FY17E
FY16E
FY17E
FY16E
FY17E
FY16E
FY17E
Agri / Agri Chemical
Rallis
Neutral
165
-
3,212
2,097
2,415
14.4
14.4
9.5
11.0
17.4
15.0
3.5
3.0
21.1
21.3
1.6
1.4
United Phosphorus
Buy
437
510
18,726
13,698
15,752
17.6
17.6
32.1
38.5
13.6
11.4
2.7
2.2
21.4
21.3
1.5
1.2
Auto & Auto Ancillary
Ashok Leyland
Buy
89
111
25,428
17,995
21,544
11.4
11.6
3.4
4.7
26.3
19.0
4.6
4.2
17.7
22.2
1.4
1.1
Bajaj Auto
Buy
2,342
2,728
67,767
23,695
27,298
21.3
20.4
134.6
151.5
17.4
15.5
5.5
4.7
31.8
30.6
2.4
2.1
Bharat Forge
Accumulate
832
943
19,379
7,867
8,881
20.0
20.3
34.4
41.0
24.2
20.3
4.7
3.9
21.1
20.9
2.6
2.2
Eicher Motors
Buy
16,547
19,036
44,931
15,379
16,498
15.6
16.6
473.2
574.8
35.0
28.8
12.9
9.6
36.7
33.2
2.8
2.6
Gabriel India
Buy
87
101
1,251
1,415
1,544
8.7
9.0
4.6
5.4
18.9
16.1
3.4
3.1
18.1
18.9
0.9
0.8
Hero Motocorp
Accumulate
2,563
2,774
51,176
28,561
31,559
14.7
14.7
151.1
163.2
17.0
15.7
6.6
5.6
38.7
35.6
1.6
1.4
Jamna Auto Industries Neutral
146
-
1,164
1,292
1,486
9.3
9.8
6.0
7.5
24.3
19.4
5.0
4.3
20.7
21.8
1.0
0.9
L G Balakrishnan & Bros Neutral
473
-
742
1,254
1,394
11.6
11.8
35.9
41.7
13.2
11.4
1.8
1.6
13.5
13.8
0.7
0.6
Mahindra and Mahindra Buy
1,233
1,449
76,562
39,031
44,440
13.8
13.9
57.9
67.6
21.3
18.2
3.4
3.0
16.1
16.6
1.6
1.4
Maruti
Neutral
4,097
-
123,776
57,865
68,104
16.4
16.7
176.3
225.5
23.2
18.2
4.5
3.8
19.4
21.2
1.9
1.6
Minda Industries
Accumulate
810
867
1,285
2,567
2,965
8.0
8.3
46.1
57.8
17.6
14.0
2.9
2.4
16.7
17.3
0.6
0.5
Motherson Sumi
Buy
265
313
35,065
39,343
45,100
8.8
9.1
10.1
12.5
26.3
21.2
8.3
6.5
35.3
34.4
1.0
0.8
Rane Brake Lining
Buy
398
465
315
454
511
11.5
12.0
25.2
31.0
15.8
12.9
2.4
2.1
14.9
16.6
0.8
0.8
Setco Automotive
Neutral
34
-
452
594
741
12.7
13.7
1.7
3.2
19.9
10.6
2.1
1.8
10.4
16.9
1.2
1.0
Tata Motors
Buy
337
409
97,212
266,022
312,667
12.8
13.1
26.3
38.3
12.8
8.8
1.7
1.4
8.4
12.1
0.5
0.5
TVS Motor
Buy
292
338
13,849
11,569
13,648
7.3
8.7
10.3
16.1
28.3
18.1
7.0
5.5
24.8
30.5
1.2
1.0
Amara Raja Batteries
Buy
837
1,040
14,298
4,892
5,871
17.4
17.6
28.8
37.1
29.1
22.6
6.8
5.4
23.4
24.1
2.9
2.3
Exide Industries
Buy
120
162
10,221
6,950
7,784
14.4
14.8
6.6
7.3
18.2
16.5
2.3
2.1
12.6
12.8
1.2
1.1
Apollo Tyres
Buy
148
171
7,513
12,146
12,689
16.8
16.0
21.2
19.0
7.0
7.8
1.2
1.0
16.5
13.0
0.7
0.7
Ceat
Buy
940
1,119
3,804
6,041
6,597
14.1
13.7
99.5
111.9
9.5
8.4
1.9
1.6
19.6
18.5
0.8
0.7
JK Tyres
Neutral
91
-
2,063
7,446
7,669
15.2
14.0
19.6
18.4
4.6
4.9
1.2
1.0
25.2
19.5
0.7
0.6
Swaraj Engines
Accumulate
850
919
1,056
552
630
14.2
14.7
44.6
54.1
19.1
15.7
4.4
4.0
23.2
25.6
1.8
1.5
Subros
Neutral
93
-
557
1,293
1,527
11.8
11.9
4.2
6.7
22.1
13.9
1.7
1.5
7.7
11.5
0.7
0.6
Indag Rubber
Neutral
180
-
471
283
329
17.0
17.2
13.0
15.4
13.9
11.6
3.0
2.5
21.8
21.6
1.4
1.1
Capital Goods
ACE
Neutral
40
-
393
660
839
4.7
8.2
1.0
3.9
39.8
10.2
1.2
1.1
3.2
11.3
0.7
0.6
BEML
Neutral
1,047
-
4,359
3,277
4,006
6.0
8.9
29.2
64.3
35.8
16.3
2.0
1.8
5.7
11.7
1.4
1.1
Bharat Electronics
Accumulate
1,232
1,414
29,557
7,737
8,634
16.8
17.2
54.0
61.0
22.8
20.2
3.3
2.9
39.3
45.6
2.9
2.5
Stock Watch
February 01, 2016
Company Name
Reco
CMP
Target
Mkt Cap
Sales ( Čcr )
OPM(%)
EPS (Č)
PER(x)
P/BV(x)
RoE(%)
EV/Sales(x)
(Č)
Price ( Č)
( Č cr )
FY16E
FY17E
FY16E
FY17E
FY16E
FY17E
FY16E
FY17E
FY16E
FY17E
FY16E
FY17E
FY16E
FY17E
Capital Goods
Voltas
Buy
286
353
9,472
5,363
5,963
8.0
9.1
11.0
13.8
26.0
20.7
4.0
3.5
16.2
17.9
1.7
1.5
BGR Energy
Neutral
114
-
824
3,615
3,181
9.5
9.4
16.7
12.4
6.8
9.2
0.6
0.6
10.0
7.0
0.6
0.8
BHEL
Neutral
139
-
33,985
33,722
35,272
10.8
11.7
10.5
14.2
13.2
9.8
1.0
0.9
7.0
9.0
1.1
1.0
Blue Star
Buy
362
439
3,253
3,548
3,977
6.3
6.9
13.7
17.2
26.4
21.1
6.6
4.3
26.1
25.4
1.0
0.9
Crompton Greaves
Buy
171
204
10,724
13,484
14,687
4.9
6.2
4.5
7.1
38.0
24.1
2.7
2.5
7.2
10.8
0.9
0.8
Greaves Cotton
Neutral
129
-
3,150
1,655
1,755
16.6
16.8
7.4
7.8
17.4
16.5
3.5
3.3
21.1
20.6
1.9
1.7
Inox Wind
Buy
317
458
7,033
4,980
5,943
17.0
17.5
26.6
31.6
11.9
10.0
3.6
2.6
35.0
30.0
1.6
1.3
KEC International
Neutral
123
-
3,167
8,791
9,716
6.1
6.8
5.4
8.2
22.8
15.0
2.3
2.1
10.0
14.0
0.6
0.5
Thermax
Neutral
837
-
9,969
6,413
7,525
7.4
8.5
30.5
39.3
27.4
21.3
4.2
3.7
15.0
17.0
1.5
1.3
Cement
ACC
Buy
1,240
1,630
23,288
13,151
14,757
16.4
18.3
63.9
83.4
19.4
14.9
2.5
2.3
13.3
16.1
1.6
1.4
Ambuja Cements
Buy
195
233
30,239
11,564
12,556
19.4
20.7
8.9
10.1
21.9
19.3
2.7
2.6
12.8
13.8
2.3
2.0
HeidelbergCement
Neutral
70
-
1,589
1,772
1,926
13.3
15.4
1.0
3.0
70.1
23.4
1.8
1.6
2.6
7.9
1.5
1.3
India Cements
Buy
94
112
2,883
4,216
4,840
18.0
19.5
4.0
9.9
23.5
9.5
0.9
0.9
4.0
9.5
1.0
0.8
JK Cement
Buy
497
744
3,477
3,661
4,742
10.1
15.8
18.0
61.0
27.6
8.2
2.0
1.8
7.5
22.9
1.4
1.1
J K Lakshmi Cement
Buy
301
430
3,542
2,947
3,616
16.7
19.9
11.5
27.2
26.2
11.1
2.5
2.1
9.8
20.8
1.6
1.3
Mangalam Cements
Neutral
178
-
475
1,053
1,347
10.5
13.3
8.4
26.0
21.2
6.9
0.9
0.8
4.3
12.5
0.8
0.6
Orient Cement
Buy
144
183
2,940
1,854
2,524
21.2
22.2
7.7
11.1
18.6
12.9
2.7
2.3
13.3
15.7
2.3
1.6
Ramco Cements
Neutral
387
-
9,218
4,036
4,545
20.8
21.3
15.1
18.8
25.6
20.6
3.1
2.8
12.9
14.3
2.8
2.4
Shree Cement^
Neutral
10,473
-
36,486
7,150
8,742
26.7
28.6
228.0
345.5
45.9
30.3
6.8
5.7
15.7
20.3
4.9
3.9
UltraTech Cement
Buy
2,826
3,282
77,552
25,021
30,023
19.1
21.6
89.0
132.0
31.8
21.4
3.7
3.2
12.2
15.9
3.2
2.7
Construction
ITNL
Neutral
80
-
2,625
7,360
8,825
34.0
35.9
7.0
9.0
11.4
8.9
0.4
0.4
3.2
3.7
3.7
3.6
KNR Constructions
Buy
494
673
1,388
937
1,470
14.3
14.0
33.5
38.6
14.7
12.8
2.2
1.9
15.4
15.4
1.6
1.0
Larsen & Toubro
Buy
1,102
1,646
102,638
65,065
77,009
11.5
11.7
61.5
65.6
17.9
16.8
1.8
1.7
13.4
14.0
1.8
1.5
Gujarat Pipavav Port
Neutral
162
-
7,824
629
684
51.0
52.2
6.4
5.9
25.3
27.4
3.3
3.1
15.9
12.7
12.1
10.9
MBL Infrastructures
Buy
162
285
672
2,313
2,797
12.2
14.6
19.0
20.0
8.5
8.1
0.9
0.8
11.3
10.6
1.0
0.9
Nagarjuna Const.
Neutral
64
-
3,577
7,892
8,842
8.8
9.1
3.0
5.3
21.5
12.1
1.1
1.0
5.0
8.5
0.7
0.6
PNC Infratech
Accumulate
509
558
2,610
1,873
2,288
13.2
13.5
24.0
32.0
21.2
15.9
2.1
1.8
12.1
12.3
1.5
1.2
Simplex Infra
Neutral
278
-
1,375
5,955
6,829
10.3
10.5
16.0
31.0
17.4
9.0
0.9
0.8
5.3
9.9
0.7
0.6
Power Mech Projects
Neutral
591
-
869
1,539
1,801
12.8
12.7
59.0
72.1
10.0
8.2
1.5
1.3
18.6
16.8
0.6
0.5
Stock Watch
February 01, 2016
Company Name
Reco
CMP
Target
Mkt Cap
Sales ( Čcr )
OPM(%)
EPS (Č)
PER(x)
P/BV(x)
RoE(%)
EV/Sales(x)
(Č)
Price ( Č)
( Č cr )
FY16E
FY17E
FY16E
FY17E
FY16E
FY17E
FY16E
FY17E
FY16E
FY17E
FY16E
FY17E
FY16E
FY17E
Construction
Sadbhav Engineering
Neutral
309
-
5,300
3,481
4,219
10.7
10.8
8.0
12.0
38.6
25.8
3.6
3.2
10.3
13.5
1.8
1.5
NBCC
Accumulate
963
1,089
11,555
7,382
9,506
7.7
8.6
39.8
54.4
24.2
17.7
5.8
4.6
26.7
29.1
1.3
1.0
MEP Infra
Neutral
43
-
703
1,956
1,876
28.1
30.5
1.3
3.0
33.3
14.4
7.0
4.7
21.2
32.8
1.8
1.8
SIPL
Neutral
88
-
3,084
675
1,042
62.4
64.7
-
-
3.3
3.7
-
-
16.2
11.0
Financials
Allahabad Bank
Neutral
54
-
3,222
8,569
9,392
2.8
2.9
16.3
27.5
3.3
2.0
0.3
0.2
7.6
11.9
-
-
Axis Bank
Buy
408
494
97,134
26,473
31,527
3.5
3.6
35.7
43.5
11.4
9.4
1.9
1.7
17.9
18.9
-
-
Bank of Baroda
Neutral
126
-
28,986
18,485
21,025
1.9
2.0
13.5
21.1
9.4
6.0
0.7
0.7
7.3
10.6
-
-
Bank of India
Neutral
100
-
8,123
15,972
17,271
1.9
2.0
15.3
33.4
6.5
3.0
0.3
0.3
3.6
7.6
-
-
Canara Bank
Neutral
194
-
10,534
15,441
16,945
2.0
2.1
46.6
70.4
4.2
2.8
0.4
0.3
8.0
11.2
-
-
Dena Bank
Neutral
36
-
2,326
3,440
3,840
2.1
2.3
7.3
10.0
5.0
3.6
0.4
0.3
6.1
7.9
-
-
Federal Bank
Neutral
46
-
7,927
3,477
3,999
3.0
3.0
5.0
6.2
9.2
7.4
0.9
0.8
10.6
11.9
-
-
HDFC
Neutral
1,178
-
185,911
10,358
11,852
3.3
3.3
41.1
47.0
28.7
25.0
5.5
5.0
24.7
24.9
-
-
HDFC Bank
Buy
1,049
1,262
264,869
38,309
47,302
4.3
4.3
49.3
61.1
21.3
17.2
3.7
3.2
18.5
19.7
-
-
ICICI Bank
Accumulate
230
254
133,742
34,279
39,262
3.3
3.3
21.0
24.4
11.0
9.4
1.9
1.6
14.4
14.7
-
-
IDBI Bank
Neutral
59
-
11,191
9,625
10,455
1.8
1.8
8.5
14.2
6.9
4.1
0.4
0.4
5.9
9.3
-
-
Indian Bank
Neutral
91
-
4,373
6,160
6,858
2.5
2.5
24.5
29.8
3.7
3.1
0.3
0.3
7.7
8.6
-
-
LIC Housing Finance
Buy
476
592
24,017
3,101
3,745
2.5
2.5
33.0
40.2
14.4
11.9
2.7
2.3
19.7
20.5
-
-
Oriental Bank
Neutral
112
-
3,361
7,643
8,373
2.4
2.4
37.2
45.4
3.0
2.5
0.3
0.2
8.2
9.4
-
-
Punjab Natl.Bank
Neutral
91
-
17,898
23,638
26,557
2.8
2.8
17.9
27.2
5.1
3.4
0.5
0.4
8.5
12.0
-
-
South Ind.Bank
Neutral
19
-
2,498
1,965
2,185
2.5
2.5
2.5
3.3
7.4
5.6
0.7
0.7
9.5
11.7
-
-
St Bk of India
Accumulate
180
202
139,691
82,520
93,299
2.7
2.8
20.0
24.5
9.0
7.4
1.0
0.9
11.5
12.8
-
-
Union Bank
Neutral
130
-
8,968
12,646
14,129
2.3
2.4
31.0
39.1
4.2
3.3
0.5
0.4
9.8
11.4
-
-
Vijaya Bank
Neutral
31
-
2,676
3,536
3,827
1.9
1.9
5.5
6.7
5.6
4.7
0.5
0.4
7.8
8.8
-
-
Yes Bank
Neutral
747
-
31,349
7,190
9,011
3.2
3.3
58.2
69.7
12.8
10.7
2.3
2.0
19.2
19.6
-
-
FMCG
Asian Paints
Neutral
869
-
83,340
16,553
19,160
16.0
16.2
17.7
21.5
49.2
40.4
13.1
11.7
29.4
31.2
4.9
4.2
Britannia
Neutral
2,683
-
32,188
8,065
9,395
9.6
10.2
47.2
65.5
56.8
41.0
18.9
17.9
38.3
41.2
3.8
3.3
Colgate
Neutral
856
-
23,293
4,836
5,490
19.5
19.7
48.5
53.2
17.7
16.1
12.9
11.3
99.8
97.5
4.7
4.1
Dabur India
Accumulate
250
267
43,987
9,370
10,265
17.1
17.2
7.3
8.1
34.1
30.9
10.3
8.4
33.7
30.6
4.6
4.2
GlaxoSmith Con*
Neutral
5,835
-
24,539
4,919
5,742
17.2
17.4
168.3
191.2
34.7
30.5
9.8
8.4
28.8
28.9
4.6
3.9
Stock Watch
February 01, 2016
Company Name
Reco
CMP
Target
Mkt Cap
Sales ( Čcr )
OPM(%)
EPS (Č)
PER(x)
P/BV(x)
RoE(%)
EV/Sales(x)
(Č)
Price ( Č)
( Č cr )
FY16E FY17E
FY16E
FY17E
FY16E
FY17E
FY16E
FY17E
FY16E
FY17E
FY16E
FY17E
FY16E
FY17E
FMCG
Godrej Consumer
Neutral
1,224
-
41,690
10,168
12,886
16.1
16.1
32.1
38.4
38.2
31.9
7.8
7.2
19.7
21.0
4.2
3.3
HUL
Neutral
817
-
176,767
34,940
38,957
17.5
17.7
20.8
24.7
39.3
33.1
43.7
34.9
110.5
114.2
4.9
4.3
ITC
Buy
320
382
256,772
41,068
45,068
37.8
37.4
13.9
15.9
23.0
20.1
7.7
6.8
34.1
33.8
5.9
5.3
Marico
Neutral
222
-
28,655
6,551
7,766
15.7
16.0
10.4
12.5
21.4
17.8
6.2
5.2
33.2
32.4
4.3
3.6
Nestle*
Buy
5,491
6,646
52,938
11,291
12,847
22.2
22.3
158.9
184.6
34.6
29.7
18.1
16.2
55.0
57.3
4.5
3.9
Tata Global
Accumulate
127
144
7,984
8,635
9,072
9.8
9.9
6.5
7.6
19.5
16.6
1.9
1.9
6.8
7.4
0.9
0.8
IT
HCL Tech^
Buy
866
1,038
122,047
42,038
47,503
21.2
21.5
51.5
57.7
16.8
15.0
3.6
2.8
21.5
18.8
2.5
2.0
Infosys
Buy
1,165
1,347
267,560
61,850
69,981
27.5
27.5
59.4
65.7
19.6
17.7
4.2
3.6
21.2
20.1
3.6
3.0
TCS
Buy
2,391
2,854
471,169
108,487
122,590
28.3
28.5
122.8
138.4
19.5
17.3
7.4
6.7
38.0
38.9
3.9
3.4
Tech Mahindra
Buy
502
646
48,511
25,566
28,890
16.0
17.0
26.3
31.9
19.1
15.7
3.4
2.9
17.9
18.6
1.7
1.4
Wipro
Buy
561
719
138,644
50,808
58,713
23.7
23.8
37.3
42.3
15.1
13.3
2.9
2.5
19.0
17.9
2.3
1.8
Media
D B Corp
Accumulate
320
356
5,878
2,241
2,495
27.8
27.9
21.8
25.6
14.7
12.5
3.8
3.4
26.7
28.5
2.6
2.3
HT Media
Neutral
78
-
1,805
2,495
2,603
11.2
11.2
7.3
8.6
10.6
9.0
0.8
0.8
7.4
8.1
0.2
0.2
Jagran Prakashan
Buy
162
189
5,299
2,170
2,355
27.2
26.2
8.9
9.9
18.2
16.4
3.8
3.3
20.9
20.5
2.3
2.2
Sun TV Network
Neutral
379
-
14,924
2,779
3,196
70.2
70.5
22.8
27.3
16.6
13.9
4.1
3.7
26.7
28.3
5.1
4.4
Hindustan Media
Neutral
278
-
2,042
920
1,031
20.0
20.0
19.2
20.9
14.5
13.3
2.4
2.0
16.4
15.3
1.8
1.5
Ventures
Metals & Mining
Coal India
Buy
320
380
202,155
76,167
84,130
19.9
22.3
22.4
25.8
14.3
12.4
5.2
5.0
35.5
41.0
2.0
1.8
Hind. Zinc
Accumulate
161
175
67,880
14,641
14,026
50.4
50.4
17.7
16.0
9.1
10.0
1.4
1.3
16.2
13.2
2.3
2.1
Hindalco
Neutral
71
-
14,568
104,356
111,186
8.7
9.5
6.7
11.1
10.5
6.4
0.4
0.4
3.5
5.9
0.7
0.6
JSW Steel
Neutral
1,059
-
25,586
42,308
45,147
16.4
20.7
(10.3)
49.5
21.4
1.2
1.1
(1.0)
5.6
1.7
1.5
NMDC
Neutral
81
-
32,055
8,237
10,893
46.6
44.5
10.0
11.7
8.1
6.9
0.9
0.8
12.5
13.0
3.7
2.8
SAIL
Neutral
43
-
17,677
45,915
53,954
7.2
10.5
1.5
4.4
28.4
9.8
0.4
0.4
2.3
4.1
1.0
0.9
Vedanta
Neutral
72
-
21,272
71,445
81,910
26.2
26.3
12.9
19.2
5.6
3.7
0.4
0.4
7.2
8.9
0.7
0.6
Tata Steel
Neutral
250
-
24,285
126,760
137,307
8.9
11.3
6.4
23.1
39.3
10.8
0.8
0.8
2.0
7.1
0.8
0.7
Oil & Gas
Cairn India
Neutral
122
-
22,901
11,323
12,490
49.4
51.0
20.7
20.7
5.9
5.9
0.4
0.4
6.4
6.1
1.1
0.5
GAIL
Neutral
367
-
46,566
64,856
70,933
9.1
9.6
24.0
28.9
15.3
12.7
1.3
1.2
8.8
9.6
0.9
0.8
ONGC
Neutral
226
-
193,440
154,564
167,321
36.8
37.4
28.6
32.5
7.9
7.0
1.0
0.9
12.7
13.5
1.5
1.4
Petronet LNG
Neutral
245
-
18,401
29,691
31,188
5.8
6.2
12.8
13.4
19.2
18.3
2.9
2.6
15.8
14.8
0.7
0.7
Indian Oil Corp
Accumulate
402
455
97,677
359,607
402,760
5.9
6.1
42.5
48.7
9.5
8.3
1.3
1.1
14.1
14.4
0.4
0.3
Stock Watch
February 01, 2016
Company Name
Reco
CMP
Target
Mkt Cap
Sales ( Čcr )
OPM(%)
EPS (Č)
PER(x)
P/BV(x)
RoE(%)
EV/Sales(x)
(Č)
Price ( Č)
( Č cr )
FY16E FY17E
FY16E
FY17E
FY16E
FY17E
FY16E
FY17E
FY16E
FY17E
FY16E
FY17E
FY16E
FY17E
Oil & Gas
Reliance Industries
Accumulate
1,035
1,150
335,294
304,775
344,392
12.6
13.4
91.3
102.6
11.3
10.1
1.3
1.2
11.8
12.0
1.0
0.9
Pharmaceuticals
Alembic Pharma
Neutral
618
-
11,646
2,658
3,112
24.1
20.2
24.6
23.9
25.1
25.9
9.0
6.9
42.5
30.2
4.4
3.7
Aurobindo Pharma
Neutral
833
-
48,730
14,923
17,162
22.0
23.0
35.7
42.8
23.3
19.5
6.9
5.2
34.0
30.2
3.6
3.1
Aventis*
Neutral
4,242
-
9,769
2,082
2,371
17.4
20.8
118.2
151.5
35.9
28.0
5.3
4.2
19.9
25.5
4.4
3.6
Cadila Healthcare
Buy
305
352
31,193
10,224
11,840
21.0
22.0
14.6
17.6
20.9
17.3
5.7
4.5
30.8
29.0
3.1
2.6
Cipla
Accumulate
586
636
47,046
14,211
16,611
20.6
19.0
27.0
28.9
21.7
20.3
3.7
3.2
18.4
16.8
3.3
2.8
Dr Reddy's
Buy
3,104
3,933
52,927
16,838
19,575
25.0
23.1
167.5
178.8
18.5
17.4
3.9
3.3
23.1
20.4
3.1
2.6
Dishman Pharma
Neutral
331
-
2,667
1,733
1,906
21.5
21.5
17.0
19.9
19.4
16.6
2.0
1.8
10.5
11.2
2.1
1.8
GSK Pharma*
Neutral
3,224
-
27,309
2,870
3,158
20.0
22.1
59.5
68.3
54.2
47.2
16.0
16.4
28.5
34.3
9.0
8.2
Indoco Remedies
Neutral
323
-
2,977
1,033
1,199
15.9
18.2
9.4
13.6
34.4
23.8
5.1
4.3
15.7
19.7
3.0
2.6
Ipca labs
Buy
669
900
8,439
3,363
3,909
12.9
18.6
13.4
28.0
49.9
23.9
3.6
3.1
7.4
14.0
2.8
2.4
Lupin
Neutral
1,710
-
77,052
13,092
16,561
25.0
27.0
50.4
68.3
33.9
25.0
7.0
5.5
22.8
24.7
5.6
4.3
Sun Pharma
Accumulate
873
950
210,097
28,163
32,610
25.8
30.7
17.4
26.9
50.2
32.5
4.8
4.1
13.0
16.6
6.9
5.8
Power
Tata Power
Neutral
60
-
16,255
35,923
37,402
22.6
22.8
4.1
5.2
14.8
11.7
1.1
1.1
7.5
9.3
1.4
1.3
NTPC
Accumulate
142
157
117,251
87,064
98,846
23.5
23.5
11.7
13.2
12.2
10.8
1.4
1.3
11.4
12.1
2.4
2.1
Power Grid
Buy
148
170
77,218
20,702
23,361
86.7
86.4
12.1
13.2
12.2
11.2
1.8
1.6
15.6
15.1
8.7
8.0
Telecom
Bharti Airtel
Neutral
290
-
115,805
101,748
109,191
32.1
31.7
12.0
12.5
24.1
23.2
1.7
1.6
6.9
6.7
1.8
1.6
Idea Cellular
Neutral
103
-
37,120
34,282
36,941
32.0
31.5
5.9
6.2
17.5
16.6
1.6
1.5
9.9
9.3
1.7
1.6
zOthers
Abbott India
Neutral
5,048
-
10,727
2,715
3,153
14.5
14.1
134.3
152.2
37.6
33.2
9.4
7.7
27.4
25.6
3.7
3.1
Bajaj Electricals
Buy
183
290
1,845
4,719
5,287
5.2
5.8
8.6
12.7
21.4
14.4
2.4
2.1
11.4
14.8
0.4
0.4
Finolex Cables
Neutral
232
-
3,546
2,520
2,883
12.2
12.0
12.7
14.2
18.3
16.3
2.5
2.2
13.6
13.5
1.2
1.0
Goodyear India*
Buy
495
622
1,142
1,888
1,680
12.1
11.9
62.2
56.6
8.0
8.8
1.9
1.6
25.9
19.7
0.4
0.4
Hitachi
Neutral
1,191
-
3,240
1,779
2,081
7.8
8.8
21.8
33.4
54.7
35.6
8.8
7.1
17.4
22.1
1.9
1.6
Jyothy Laboratories
Neutral
285
-
5,167
1,620
1,847
11.5
11.5
7.3
8.5
39.1
33.7
5.1
4.7
13.3
14.4
3.1
2.6
MRF
Buy
35,607
45,575
15,101
20,316
14,488
21.4
21.1
5,488.0
3,798.0
6.5
9.4
2.2
1.8
41.1
21.2
0.7
0.9
Page Industries
Neutral
12,086
-
13,480
1,929
2,450
19.8
20.1
229.9
299.0
52.6
40.4
23.2
16.1
52.1
47.1
7.0
5.5
Relaxo Footwears
Neutral
467
-
5,609
1,767
2,152
12.3
12.5
19.3
25.1
24.3
18.6
6.0
4.6
27.7
27.8
3.2
2.6
Siyaram Silk Mills
Buy
1,086
1,354
1,018
1,636
1,815
11.5
11.5
89.9
104.1
12.1
10.4
2.0
1.7
17.9
17.8
0.8
0.7
Styrolution ABS India*
Neutral
697
-
1,225
1,271
1,440
8.6
9.2
32.0
41.1
21.8
17.0
2.2
2.0
10.7
12.4
0.9
0.8
Stock Watch
February 01, 2016
Company Name
Reco
CMP
Target
Mkt Cap
Sales ( Čcr )
OPM(%)
EPS (Č)
PER(x)
P/BV(x)
RoE(%)
EV/Sales(x)
(Č)
Price ( Č)
( Č cr )
FY16E
FY17E
FY16E
FY17E
FY16E
FY17E
FY16E
FY17E
FY16E
FY17E
FY16E
FY17E
FY16E
FY17E
zOthers
TVS Srichakra
Buy
2,557
3,240
1,958
2,101
2,338
15.7
15.0
248.6
270.0
10.3
9.5
4.5
3.2
43.6
34.0
1.0
0.8
HSIL
Accumulate
273
302
1,977
2,123
2,384
16.1
16.5
15.0
18.9
18.2
14.5
1.4
1.3
8.0
9.4
1.3
1.1
Kirloskar Engines India
Neutral
241
-
3,481
2,471
2,826
8.8
10.4
9.1
13.3
26.4
18.1
2.5
2.3
9.7
13.4
1.1
0.9
Ltd
M M Forgings
Buy
470
614
567
511
615
21.7
21.6
43.1
55.8
10.9
8.4
2.0
1.6
19.9
21.2
1.3
1.0
Banco Products (India) Neutral
128
-
915
1,208
1,353
11.0
12.3
10.8
14.5
11.9
8.8
1.4
1.2
11.9
14.5
0.7
0.6
Competent Automobiles Neutral
142
-
87
1,040
1,137
3.2
3.1
25.7
28.0
5.5
5.1
0.8
0.7
15.0
14.3
0.1
0.1
Nilkamal
Neutral
1,346
-
2,009
1,910
2,083
10.5
10.3
63.3
69.2
21.3
19.5
3.5
3.0
17.6
16.5
1.1
1.0
Visaka Industries
Buy
109
144
174
1,086
1,197
9.9
10.3
21.5
28.8
5.1
3.8
0.5
0.4
9.6
11.6
0.4
0.3
Transport Corporation of
Neutral
250
-
1,899
2,830
3,350
8.8
9.0
14.4
18.3
17.4
13.6
2.7
2.3
15.4
17.1
0.8
0.7
India
Elecon Engineering
Neutral
65
-
711
1,369
1,533
13.7
14.9
3.3
6.1
19.7
10.8
1.3
1.2
6.6
11.4
0.9
0.8
Surya Roshni
Buy
151
201
661
2,992
3,223
8.1
8.4
14.7
18.3
10.3
8.2
1.0
0.9
9.7
11.0
0.5
0.5
MT Educare
Neutral
165
-
656
286
366
18.3
17.7
7.7
9.4
21.3
17.6
4.5
3.9
20.2
21.1
2.2
1.7
Radico Khaitan
Buy
114
156
1,517
1,565
1,687
12.2
13.0
5.7
7.1
20.0
16.1
1.7
1.5
8.3
9.6
1.4
1.3
Garware Wall Ropes
Buy
355
473
778
862
974
11.2
11.2
24.9
29.6
14.3
12.0
2.2
1.9
15.1
15.4
0.9
0.8
Wonderla Holidays
Neutral
399
-
2,252
206
308
44.0
43.6
9.0
12.9
44.3
30.9
6.1
5.5
13.7
17.8
10.8
7.2
Linc Pen & Plastics
Neutral
211
-
312
340
371
8.3
8.9
10.8
13.2
19.5
16.0
3.1
2.7
16.0
17.1
1.0
0.9
The Byke Hospitality
Neutral
159
-
637
222
287
20.5
20.5
5.6
7.6
28.2
21.0
5.3
4.4
18.9
20.8
2.9
2.2
Interglobe Aviation
Neutral
875
-
31,520
17,022
21,122
20.7
14.5
63.9
53.7
13.7
16.3
20.5
16.8
149.9
103.2
1.9
1.5
Coffee Day Enterprises
Neutral
263
-
5,424
2,692
2,964
17.0
18.6
-
4.7
-
55.6
3.2
3.0
0.2
5.5
2.4
2.2
Ltd
Navneet Education
Neutral
91
-
2,170
998
1,062
24.1
24.0
5.8
6.1
15.8
15.0
3.5
3.1
22.0
20.6
2.3
2.1
Navkar Corporation
Buy
200
265
2,849
365
436
38.3
37.5
5.6
5.9
35.4
34.0
2.2
2.1
6.3
6.1
8.6
7.4
Source: Company, Angel Research; Note: *December year end; #September year end; &October year end; Price as on January 29, 2016
Market Outlook
February 01, 2016
Research Team Tel: 022 - 39357800
DISCLAIMER
Angel Broking Private Limited (hereinafter referred to as “Angel”) is a registered Member of National Stock Exchange of India Limited,
Bombay Stock Exchange Limited and Metropolitian Stock Exchange of India Limited. It is also registered as a Depository Participant with
CDSL and Portfolio Manager with SEBI. It also has registration with AMFI as a Mutual Fund Distributor. Angel Broking Private Limited is a
registered entity with SEBI for Research Analyst in terms of SEBI (Research Analyst) Regulations, 2014 vide registration number
INH000000164. Angel or its associates has not been debarred/ suspended by SEBI or any other regulatory authority for accessing
/dealing in securities Market. Angel or its associates including its relatives/analyst do not hold any financial interest/beneficial ownership
of more than 1% in the company covered by Analyst. Angel or its associates/analyst has not received any compensation / managed or co
-managed public offering of securities of the company covered by Analyst during the past twelve months. Angel/analyst has not served as
an officer, director or employee of company covered by Analyst and has not been engaged in market making activity of the company
covered by Analyst.
This document is solely for the personal information of the recipient, and must not be singularly used as the basis of any investment
decision. Nothing in this document should be construed as investment or financial advice. Each recipient of this document should make
such investigations as they deem necessary to arrive at an independent evaluation of an investment in the securities of the companies
referred to in this document (including the merits and risks involved), and should consult their own advisors to determine the merits and
risks of such an investment.
Reports based on technical and derivative analysis center on studying charts of a stock's price movement, outstanding positions and
trading volume, as opposed to focusing on a company's fundamentals and, as such, may not match with a report on a company's
fundamentals.
The information in this document has been printed on the basis of publicly available information, internal data and other reliable sources
believed to be true, but we do not represent that it is accurate or complete and it should not be relied on as such, as this document is for
general guidance only. Angel Broking Pvt. Limited or any of its affiliates/ group companies shall not be in any way responsible for any
loss or damage that may arise to any person from any inadvertent error in the information contained in this report. Angel Broking Pvt.
Limited has not independently verified all the information contained within this document. Accordingly, we cannot testify, nor make any
representation or warranty, express or implied, to the accuracy, contents or data contained within this document. While Angel Broking
Pvt. Limited endeavors to update on a reasonable basis the information discussed in this material, there may be regulatory, compliance,
or other reasons that prevent us from doing so.
This document is being supplied to you solely for your information, and its contents, information or data may not be reproduced,
redistributed or passed on, directly or indirectly.
Neither Angel Broking Pvt. Limited, nor its directors, employees or affiliates shall be liable for any loss or damage that may arise from or
in connection with the use of this information.
Note: Please refer to the important ‘Stock Holding Disclosure' report on the Angel website (Research Section). Also, please refer to the
latest update on respective stocks for the disclosure status in respect of those stocks. Angel Broking Pvt. Limited and its affiliates may have
investment positions in the stocks recommended in this report.