M M Forging | Others
March 18, 2013
MM Forgings
BUY
CMP
`98
Forging the future
Target Price
`131
MM Forgings (MMFL) is one of the largest exporters of forgings from India with a
Investment Period
12 months
capacity of 40,000MT (exports contributed ~70.0% to the revenue in FY2013). It
is engaged in the manufacturing of steel forgings, catering to the forging
Stock Info
requirements of almost all sections of industry including Automotive, Valve and
Sector
Others
Oil-field, Engineering and Off Highway segments, with a focus on commercial
vehicle (CV) industry which contributed ~76.0% to the total revenue in FY2013.
Market Cap (` cr)
118
The company is now focusing on improving its operational efficiencies and increasing
Net debt (` cr)
115
capacity utilization, providing the company an immense potential to grow.
Beta
0.8
Sufficient capacity to cater to improving demand across the globe
52 Week High / Low
114/ 60
The company has a capacity of 40,000MT (last reported in FY2011). It is now
focusing on optimum capacity utilisation to take advantage of the production
Avg. Daily Volume
3,754
capacities that it has created. The company mainly caters to the global market
Face Value (`)
10
with a focus on the commercial vehicle industry and export focus on America and
BSE Sensex
21,810
Europe. After the recession, the American economy is now seeing an upturn, and
thus we are witnessing a growth in CV sales as well. In addition, the production in
Nifty
6,504
domestic CV industry grew by a CAGR of 22% over FY2008-12 and is expected to
Reuters Code
MMFO.BO
grow as a CAGR of 11% over FY2012-21E to 23.5lakh units. We expect this to
Bloomberg Code
MMFG IN
provide enormous opportunities to the company.
Rupee depreciation against US$ to boost company’s growth
The contribution of exports to the company’s revenue has increased from 57.4%
Shareholding Pattern (%)
in FY2008 to 70.3% in FY2013. Given that USA and Europe are the major
markets to which the company exports, the depreciating rupee against the US$
Promoters
59.5
and Euro is a positive for the company. In addition, the Chinese currency, Yuan,
MF / Banks / Indian Fls
14.3
has appreciated by 2.7% against the US$ in the past one year, while the INR has
FII / NRIs / OCBs
0.4
depreciated by 12.4% in the same period against the US$. This is providing the
Indian players an added competitive advantage in the export markets.
Indian Public / Others
25.9
Outlook and valuation: We expect MMFL to register a revenue CAGR of 13.9%
over FY2013-16E to `534cr with an operating margin of 18.1% in FY2016E. The
profit is expected to grow at a CAGR of 17.4% over the same period to `40cr in
Abs.(%)
3m
1yr
3yr
FY2016E. At the CMP, the company is trading at a PE of 3.0x FY2016E earnings.
Sensex
5.6
11.4
18.3
On account of positive growth outlook and low valuation, we initiate coverage on
MMFL
13.1
28.6
(8.8)
the company with a Buy recommendation with a target price of `131 on a target
PE of 4.0x FY2016E earnings.
Key financials
Y/E March (` cr)
FY2012 FY2013 FY2014E
FY2015E
FY2016E
Net Sales
350
361
412
469
534
% chg
28.7
3.1
14.1
13.9
13.9
Adj. Net Profit
21
24
28
32
40
% chg
(4.1)
14.7
13.0
16.9
22.4
OPM (%)
17.3
16.0
18.1
18.1
18.1
EPS (`)
17.7
20.3
22.9
26.8
32.8
P/E (x)
5.5
4.8
4.3
3.7
3.0
P/BV (x)
0.8
0.7
0.6
0.5
0.5
RoE (%)
15.2
15.1
15.1
15.8
17.1
RoCE (%)
14.2
12.7
13.3
15.0
16.6
Tejashwini Kumari
EV/Sales (x)
0.7
0.6
0.6
0.5
0.4
022-39357800 Ext: 6856
EV/EBITDA (x)
4.1
4.0
3.0
2.6
2.3
Source: Company, Angel Research, Note: CMP as of March 14, 2014
Please refer to important disclosures at the end of this report
1
M M Forgings | Initiating Coverage
Investment arguments
Sufficient capacity to cater to improving demand across the globe
The company has a capacity of 40,000MT (last reported in FY2011). It is now
focusing on optimum capacity utilisation to take advantage of the production
capacities created by it. The company mainly caters to the global market with a
focus on the CV industry.
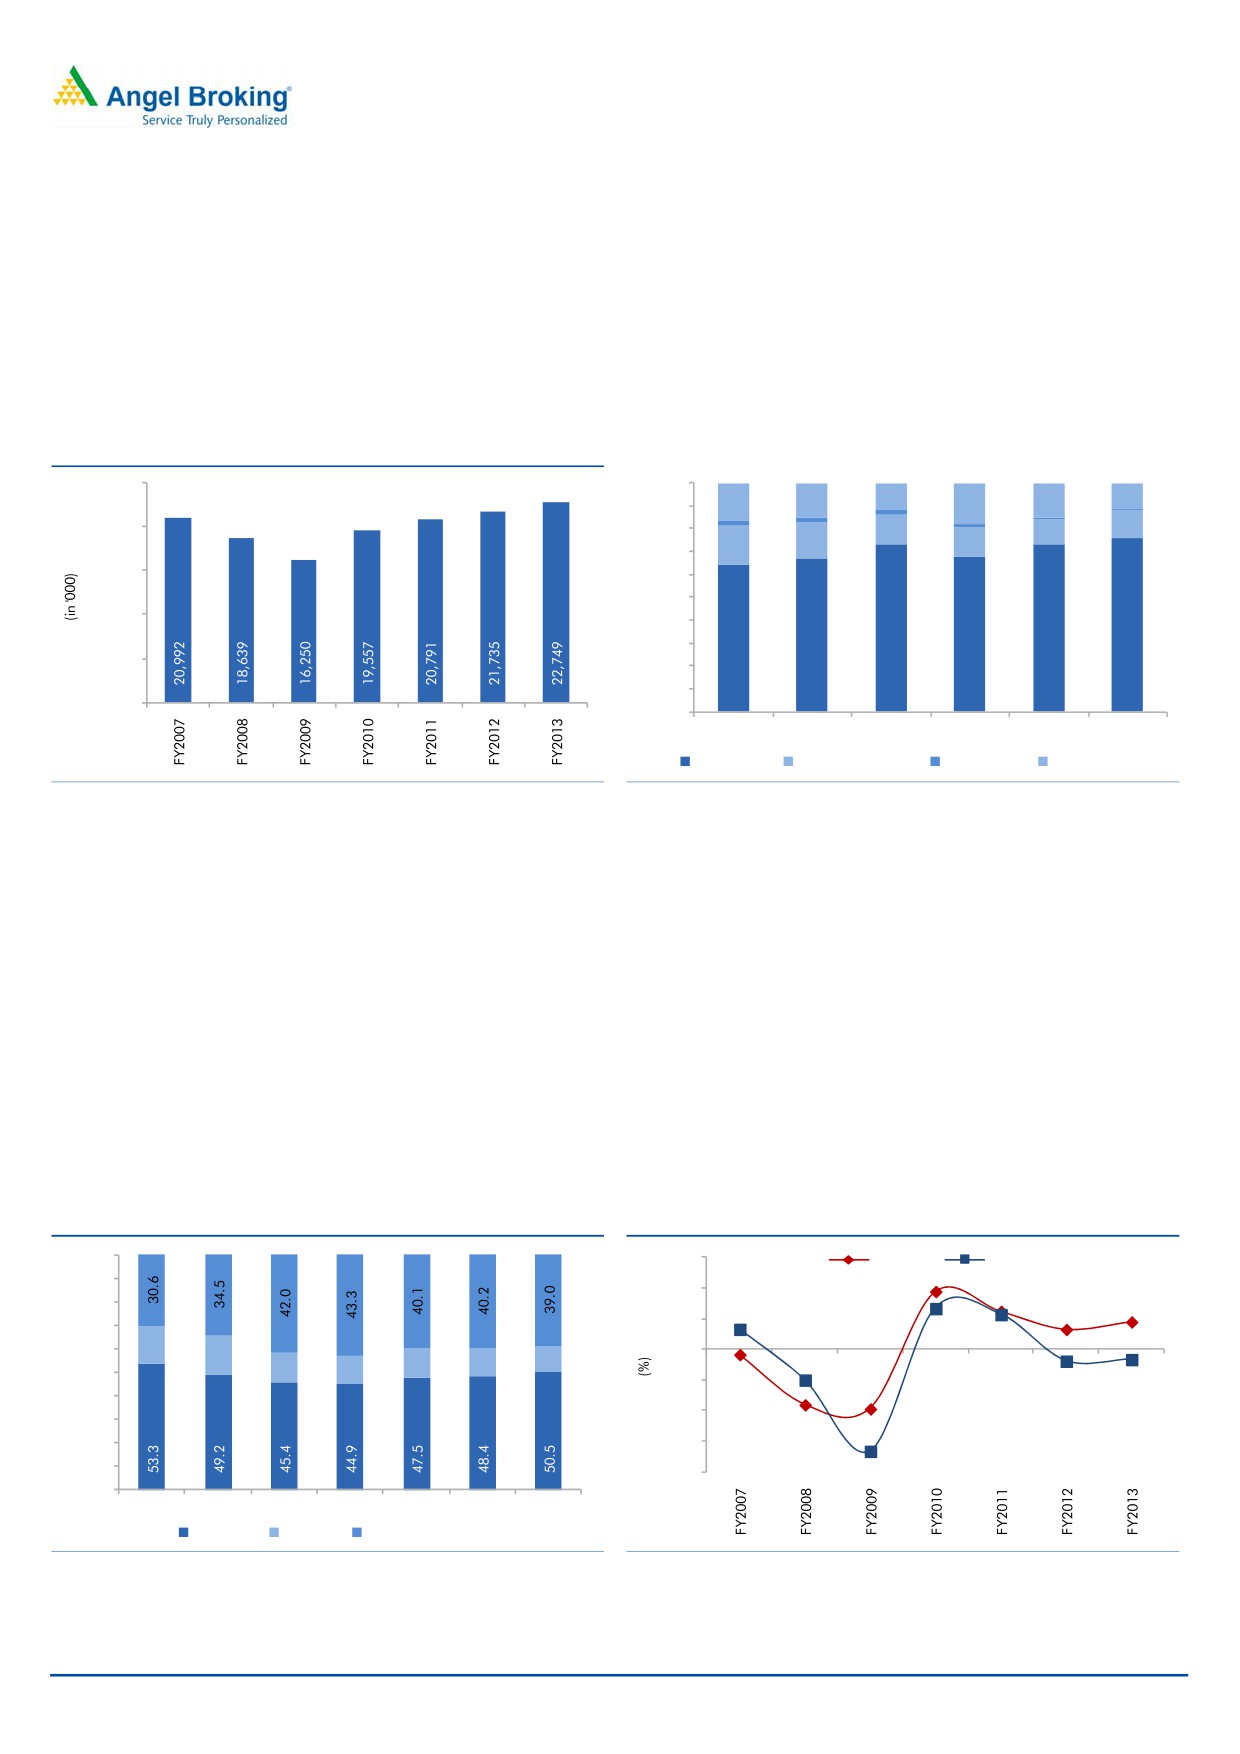
Exhibit 1: Global CV sales
Exhibit 2: Automotive segment’s contribution increases in net sales
25,000
100%
15.0
12.0
15.0
11.0
90%
16.5
18.0
20,000
12.0
80%
13.0
11.0
17.0
16.1
13.0
70%
15,000
60%
50%
10,000
40%
30%
5,000
20%
10%
64.5
66.8
73.0
68.0
73.0
76.0
-
0%
FY2008
FY2009
FY2010
FY2011
FY2012
FY2013
Automotive
Valve and Oilfiled
Engineering
Off Highway
Source: OICA, Angel Research
Source: OICA, Angel Research
The CV industry contributed 76.0% to the company’s sales in FY2013. We expect
the demand to improve going forward as the economy recovers. The company
majorly exports to America and Europe. The American economy is now seeing an
upturn, and thus we are witnessing a growth in CV sales as well. In FY2013, the
CV sales grew by 9.0%. However, the scenario in Europe is still gloomy. The CV
sales in Europe are still sluggish; however, UK, one of the major markets has
shown some respite in the month of January and grew by 5.4% yoy.
According to Automotive Component Manufacturers Association (ACMA), the
production in domestic CV industry grew at a CAGR of 22% over FY2008-12 and
is expected to grow at a CAGR of 11% over FY2012-21E to 23.5lakh units. We
believe these factors provide MMFL a strong growth opportunity.
Exhibit 3: Geographical contribution in CV sales
Exhibit 4: CV sales pattern in America and Europe
100%
30.0
America
Europe
90%
20.0
19.0
12.5
80%
9.0
10.0
6.6
70%
6.6
13.4
11.4
60%
16.1
-
16.4
10.5
12.4
11.4
(10.0)
50%
12.5
11.8
(1.7)
(10.0)
(3.8)
(3.3)
40%
(19.4)
(20.0)
30%
(18.1)
20%
(30.0)
(33.3)
10%
(40.0)
0%
FY2007 FY2008 FY2009 FY2010 FY2011 FY2012 FY2013
America
Europe
Rest of the world
Source: Company, Angel Research
Source: Company, Angel Research
February 18, 2014
2
M M Forgings | Initiating Coverage
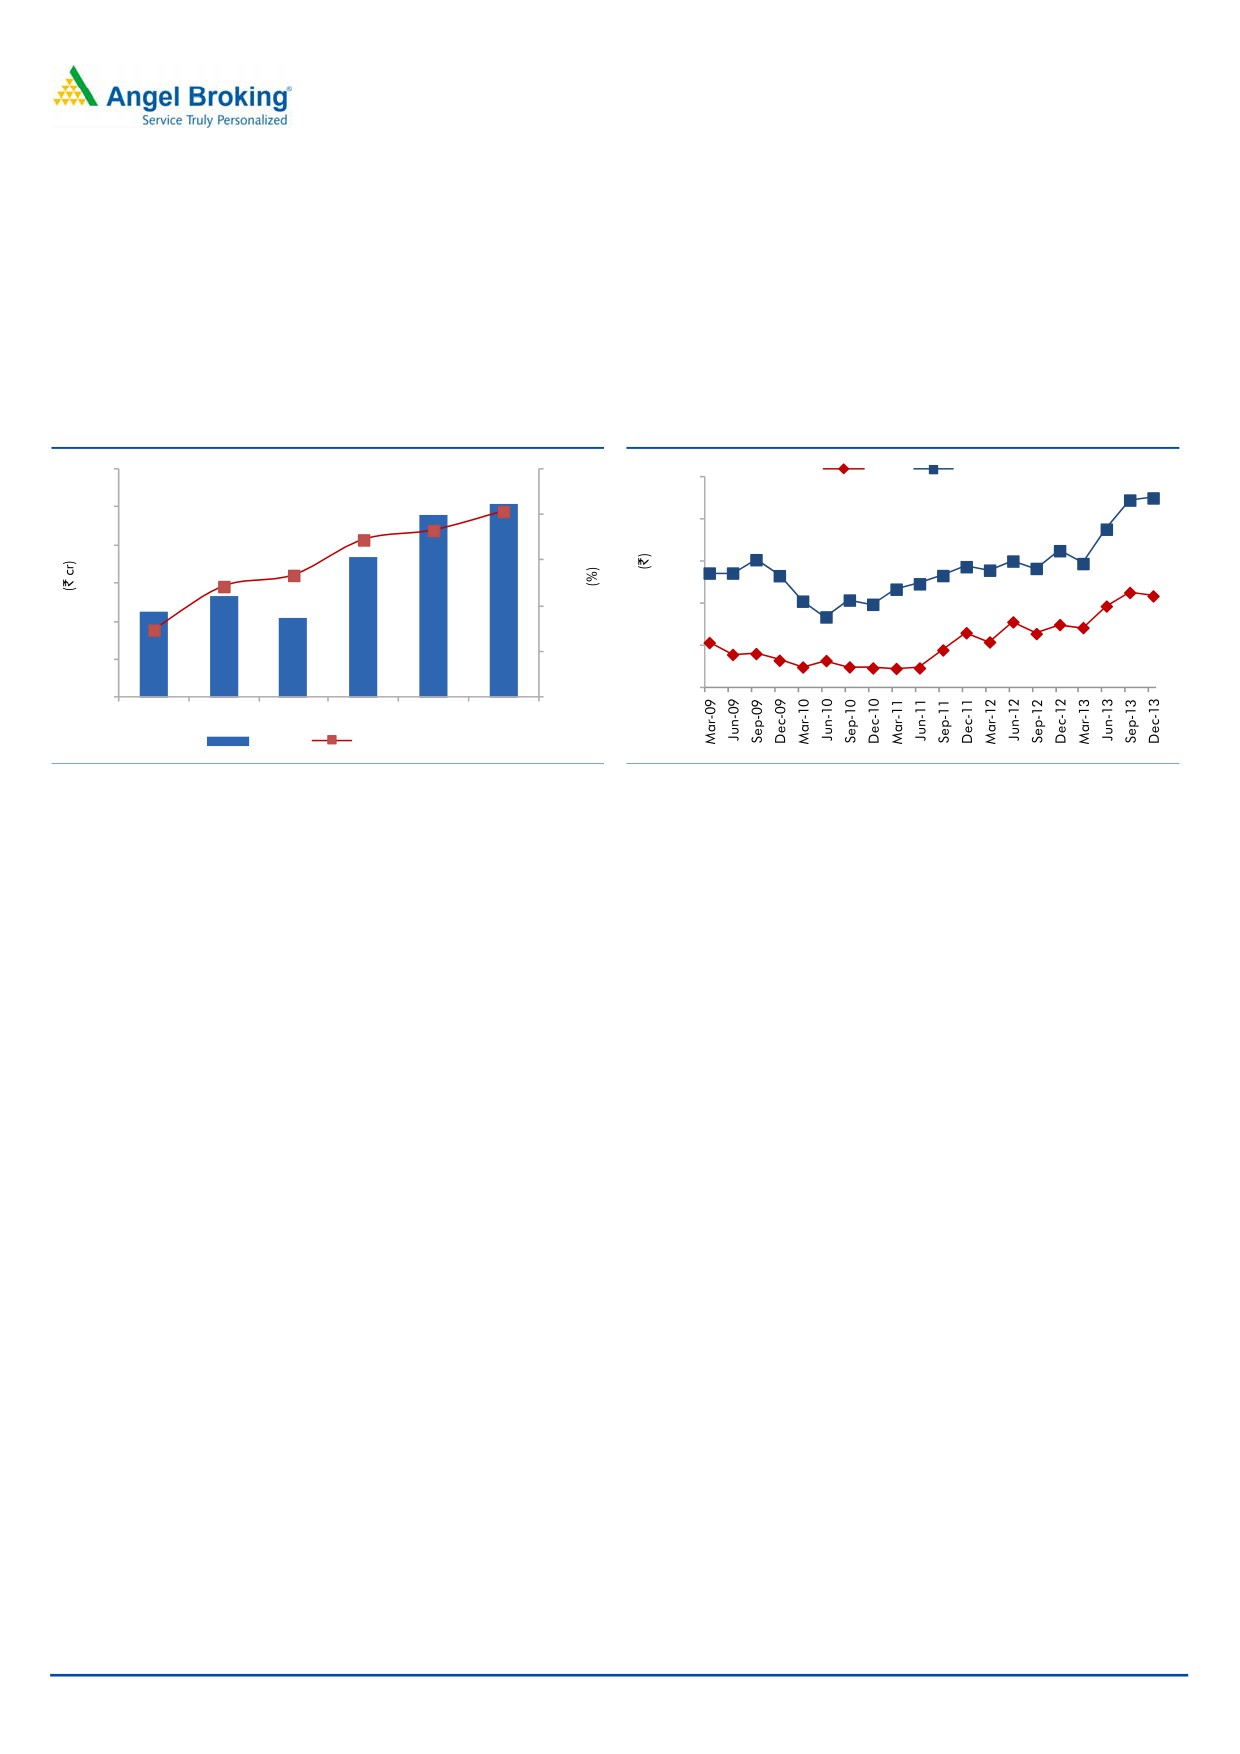
Rupee depreciation against US$ to boost company’s growth
The contribution of exports to the company’s revenue has increased from 57.4% in
FY2008 to 70.3% in FY2013. Given that USA and Europe are the major markets
to which the company exports, the depreciating rupee against the US$ and Euro is
a positive for the company. We do not expect any correction in the same in the
near term.
Exhibit 5: Increasing contribution of exports
Exhibit 6: Depreciating rupee - an advantage
300
75.0
USD
EURO
90.0
85.1
70.3
250
68.3
67.2
70.0
80.0
200
63.4
67.2
62.1
65.0
70.0
61.8
150
57.4
60.0
60.0
100
50.7
50.0
55.0
50
113
133
104
183
239
254
40.0
0
50.0
FY2008
FY2009
FY2010
FY2011
FY2012
FY2013
Export
% of total sales
Source: Company, Angel Research
Source: Company, Angel Research
Further, the appreciation of the Yuan is an additional advantage for Indian
exports. The Chinese currency, Yuan, has appreciated by 2.7% against the USD in
the past one year, however, the INR has depreciated by 12.4% in the same time
against US$ which is providing the Indian players an added advantage in the
export market.
February 18, 2014
3
M M Forgings | Initiating Coverage
Financials
Exhibit 7: Key assumptions
Y/E March
FY2014E
FY2015E
FY2016E
Global CV sales
23,886,810
25,200,585
26,586,617
yoy growth (%)
5.0
5.5
5.5
Total operating Income (` cr)
412
469
534
yoy growth (%)
14.1
13.9
13.9
Source: Company, Angel Research
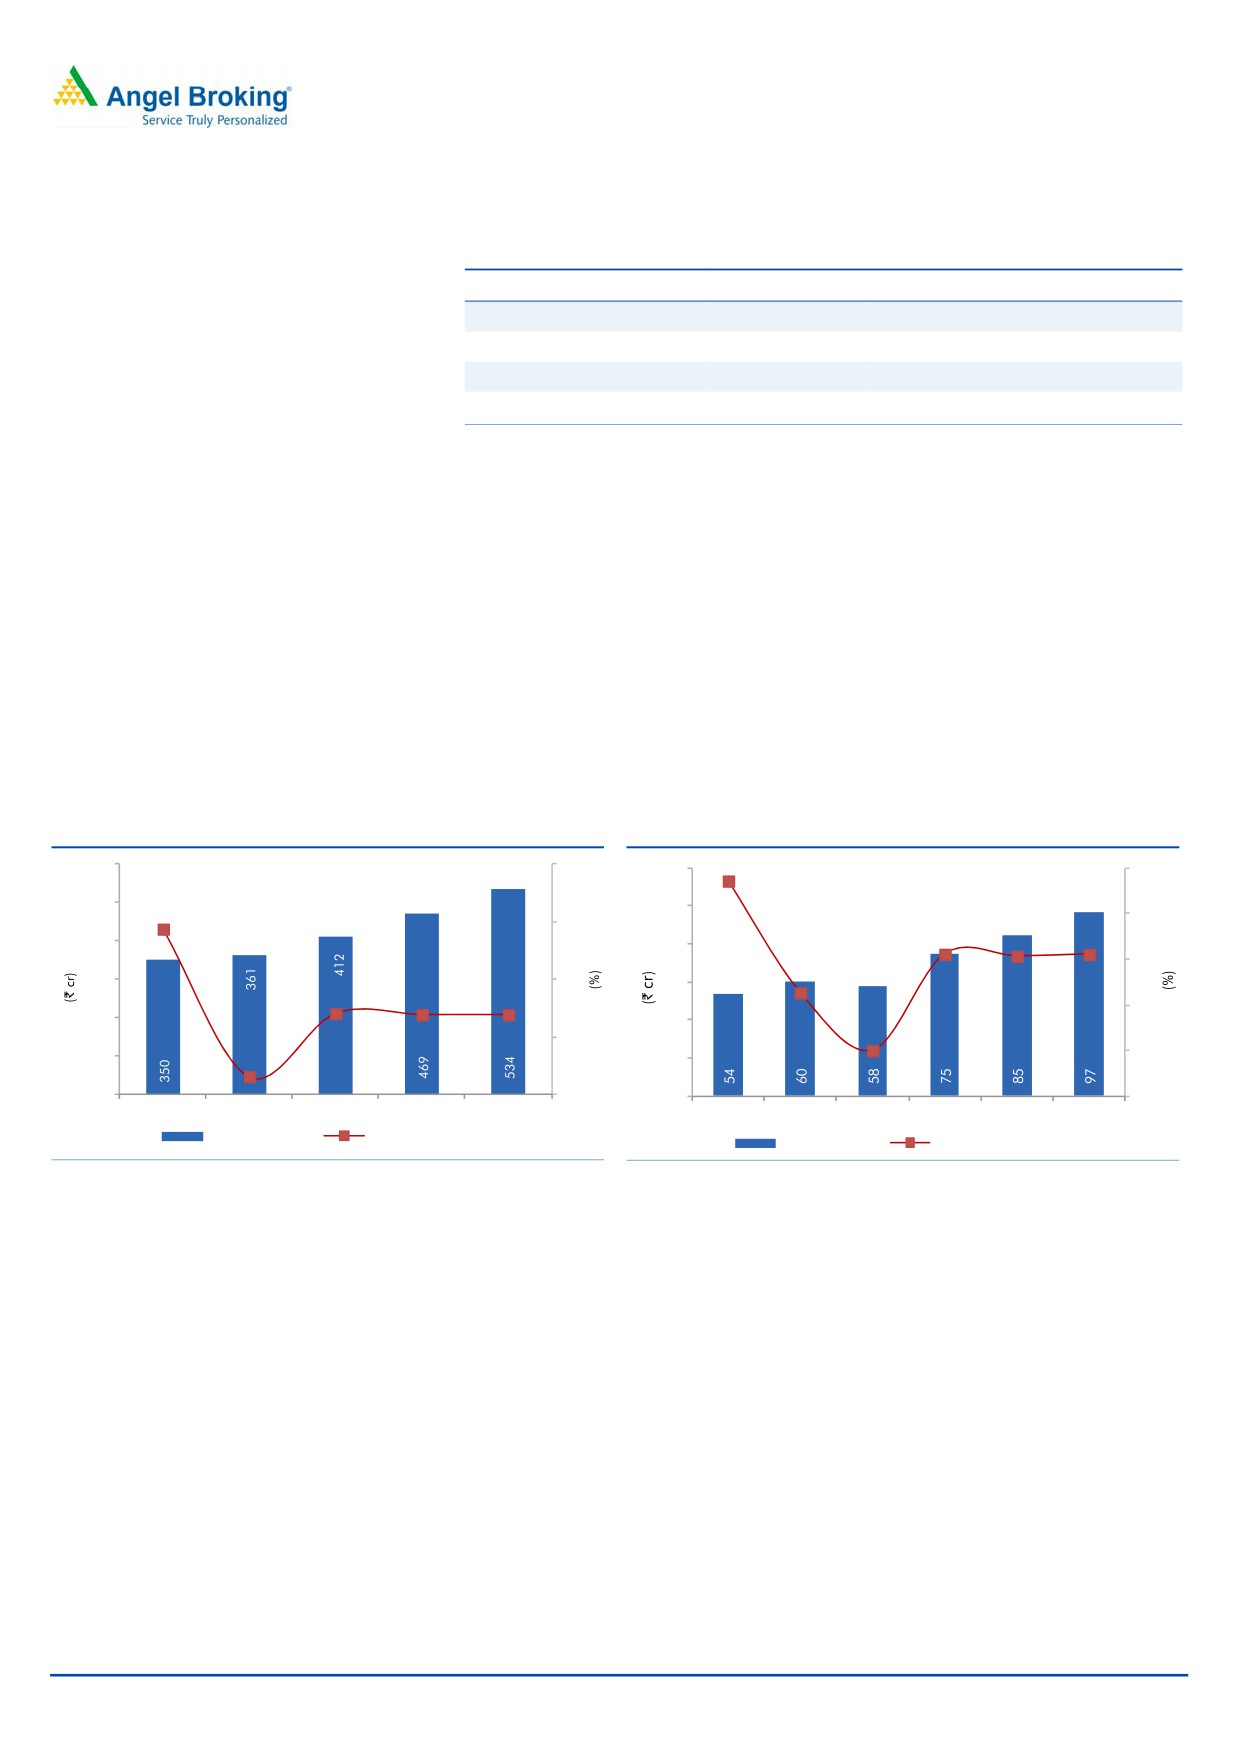
Revenue to grow on the back of global CV industry recovery
The company has witnessed a CAGR growth of 30.0% over FY2009-13 while the
global CV industry’s sales contracted by 38.8% during the same period. The
current capacity of the company is of 40,000MT and it is continuously focusing on
increasing capacity utilization level to take advantage of the production capacities
created by it. On the back of recovery trends visible in the CV industry across the
globe and the company’s strong relationship with its customers, we expect the
company to successfully ramp up capacity utilization and witness strong top-line
growth. We expect the revenue for the company to grow at a CAGR of 13.9% over
FY2013-16E to `534cr.
Exhibit 8: Improving CV sales to drive volume
Exhibit 9: Improving operational efficiencies to aid margin growth
600
40
120
19.7
20
500
28.7
100
19
30
18.1
18.1
18.1
400
80
18
17.3
300
20
60
13.9
13.9
17
200
40
16.0
10
14.1
16
100
3.1
20
0
0
0
15
FY2012
FY2013
FY2014E
FY2015E
FY2016E
FY2011
FY2012
FY2013
FY2014E FY2015E FY2016E
Revenue (LHS)
Revenue growth (RHS)
EBITDA (LHS)
EBITDA Margin (RHS)
Source: Company, Angel Research
Source: Company, Angel Research
On the back of different energy conservation methods undertaken by the
company, its power and fuel costs are expected to reduce over FY2013-16E from
12.8% to 11.0% of net sales. In addition, continuous efforts are being made on
conservation of raw material by improving design and layout of dies leading to
reduction in raw material consumption. Also, the company is able to pass on the
changes in steel prices to the customers.
We believe that with improving operational efficiencies and increasing capacity
utilization, the operating margin will improve by 210bp over FY2013-16E at
18.1%. We expect the debt of the company to be offloaded marginally leading to
a lower interest cost going forward. Consequently, we expect the profit to grow at
a CAGR of 17.4% over FY2013-16E to `40cr.
February 18, 2014
4
M M Forgings | Initiating Coverage
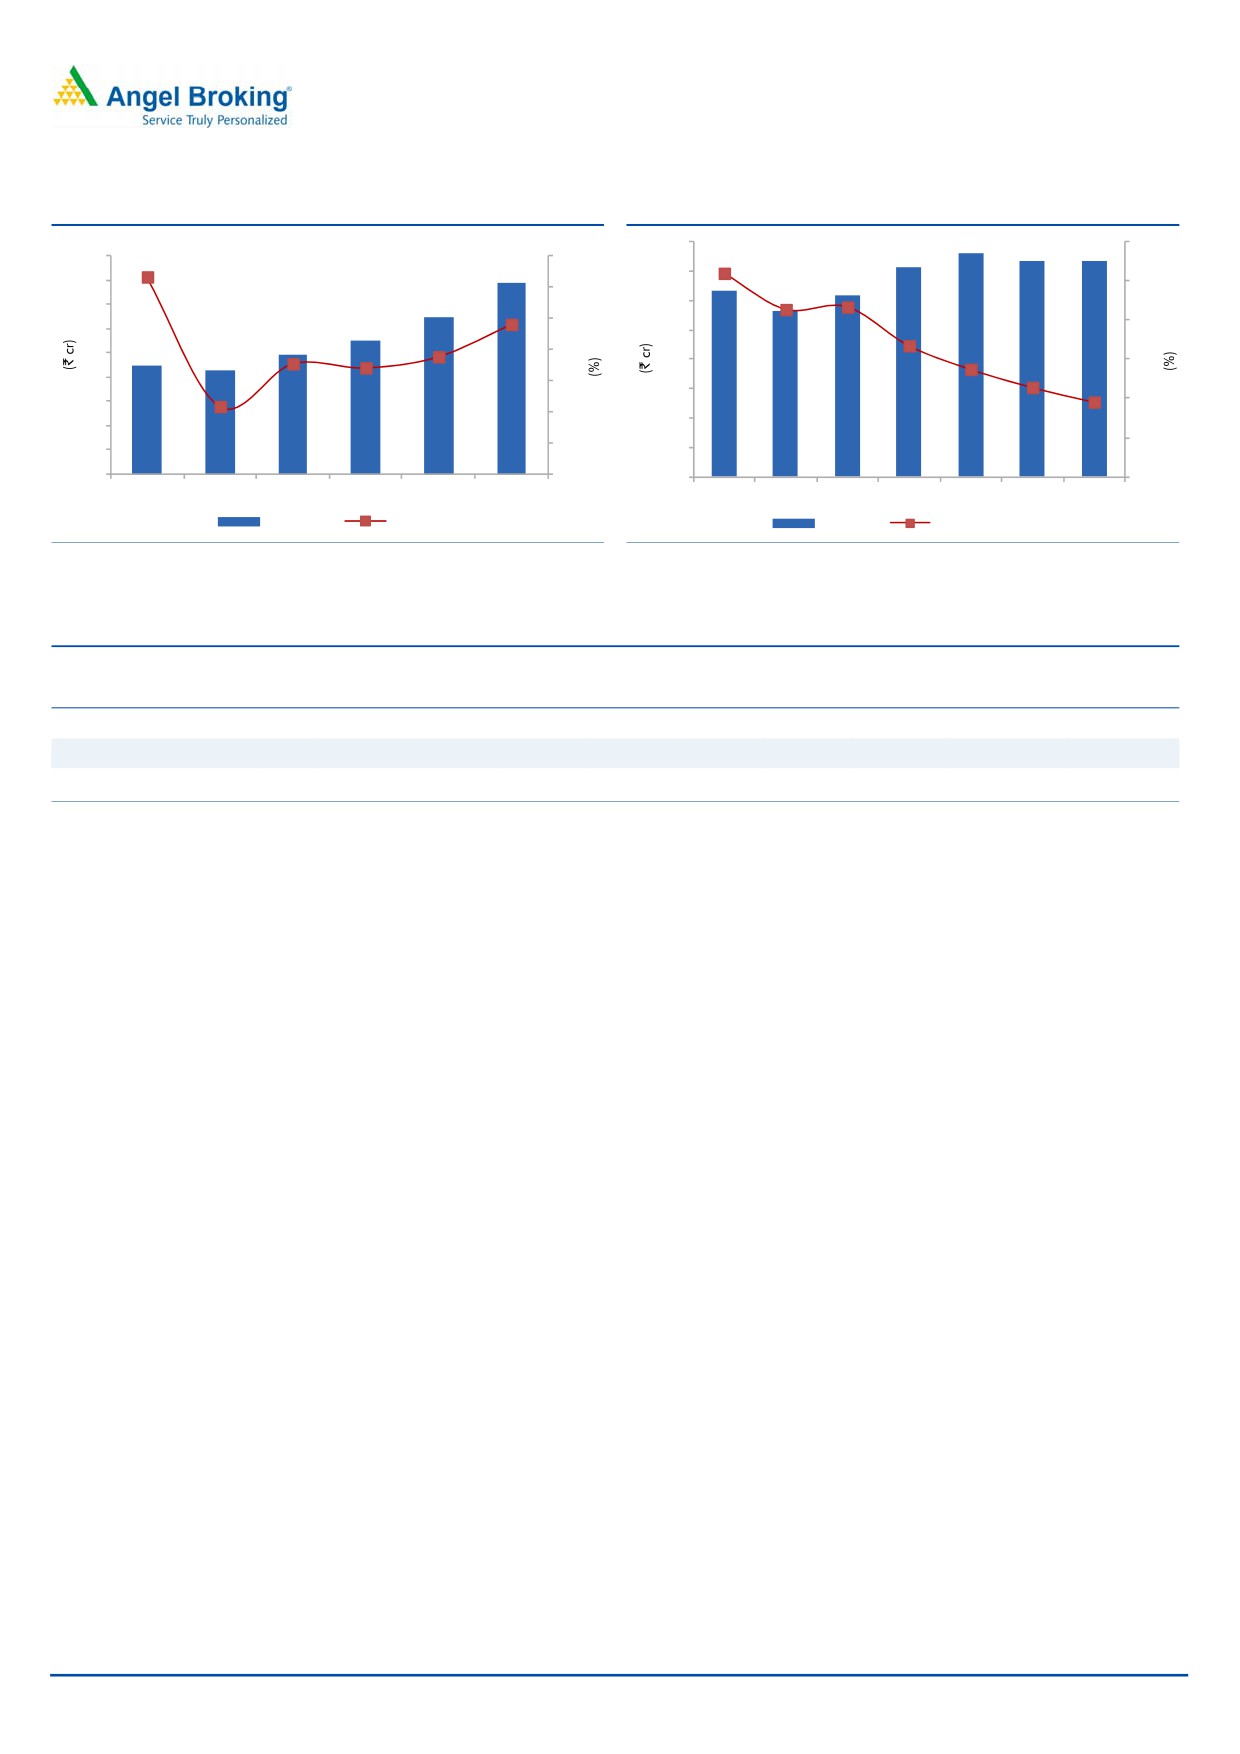
Exhibit 10: PATM to improve
Exhibit 11: Net debt to equity to decrease
8
1.2
45
8.2
8.5
7
1.0
40
1.0
8.0
35
7.4
6
0.9
0.9
7.5
0.8
30
6.9
5
6.8
0.7
25
6.7
7.0
4
0.6
0.5
20
6.1
6.5
3
0.5
15
0.4
0.4
6.0
2
10
0.2
5
5.5
1
22
21
24
28
32
40
6
6
6
7
8
7
7
0
5.0
0
0.0
FY2011
FY2012
FY2013
FY2014E FY2015E FY2016E
FY2010
FY2011
FY2012
FY2013
FY2014E FY2015E FY2016E
PAT (LHS)
PATM (RHS)
Interest
Net debt to equity
Source: Company, Angel Research
Source: Company, Angel Research
Exhibit 12: Relative valuation (Trailing twelve months)
Mcap
Sales
OPM
PAT
EPS
RoE
P/E
P/BV
EV/Sales
EV/
Company
(` cr)
(` cr)
(%)
(` cr)
(`)
(%)
(x)
(x)
(x)
EBITDA (x)
M M Forgings
287
387
18.3
28
23.5
13.7
4.2
0.6
3.1
0.6
Ramkrishna Forgings
118
364
13.3
4
1.6
3.7
69.5
0.9
13.7
1.8
Ahmednagar Forgings
398
1,607
24.6
148
40.3
11.3
2.7
0.4
5.3
1.3
Source: Company, Angel Research; * Bloomberg estimates
February 18, 2014
5
M M Forgings | Initiating Coverage
Outlook and valuation: We expect MMFL to register a revenue CAGR of 13.9%
over FY2013-16E to `534cr in FY2016E. On account of improving operational
efficiencies and increasing capacity utilization, we expect the operating margin for
the company to expand by 210bp over the same period to 18.1% for FY2016E.
Consequently the profit is expected to grow at a CAGR of 17.4% over FY2013-16E
to `40cr in FY2016E.
Given the company’s increased capacity from 35,000MT in FY2007 to 40,000MT
in FY2011 and improvement in the economy of its major export markets - America
and Europe, we are positive on the company from a long term perspective.
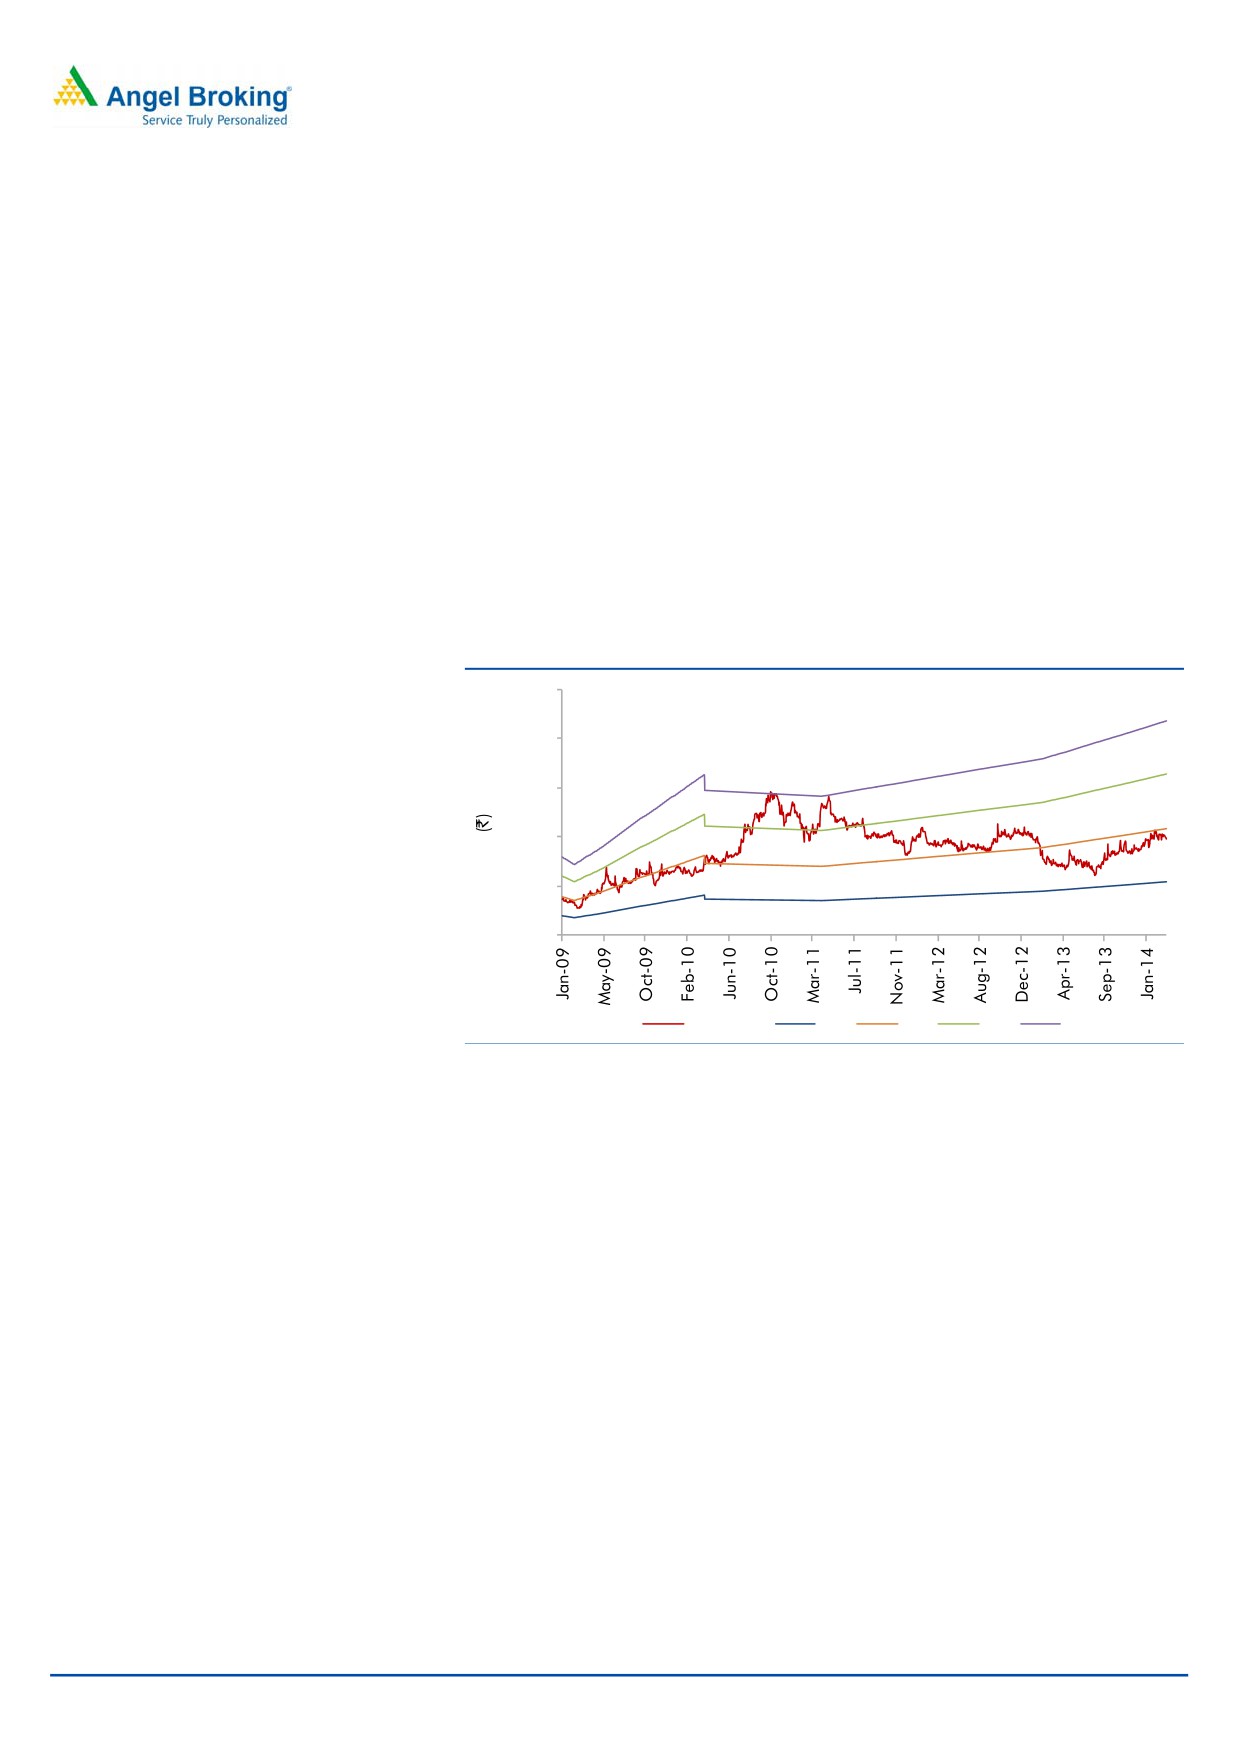
At the CMP, the company is trading at a PE of 3.0x FY2016E earnings. On account
of positive growth outlook and low valuation, we initiate coverage on the company
with a Buy recommendation with a target price of `131 at a target PE of 4.0x
FY2016E earnings.
Exhibit 13: One-year forward P/E band
250
200
150
100
50
0
Price (`)
2x
4x
6x
8x
Source: Company, Angel Research
Concerns
Continued slowdown in CV industry: The company earns its major revenue from
the CV industry, mainly in the US and Europe. Any prolonged slowdown in these
economies can adversely affect the company’s performance.
Adverse movement in currency: Rupee depreciation is an added advantage for the
company. In case of any appreciation, the revenue of the company will be
adversely affected.
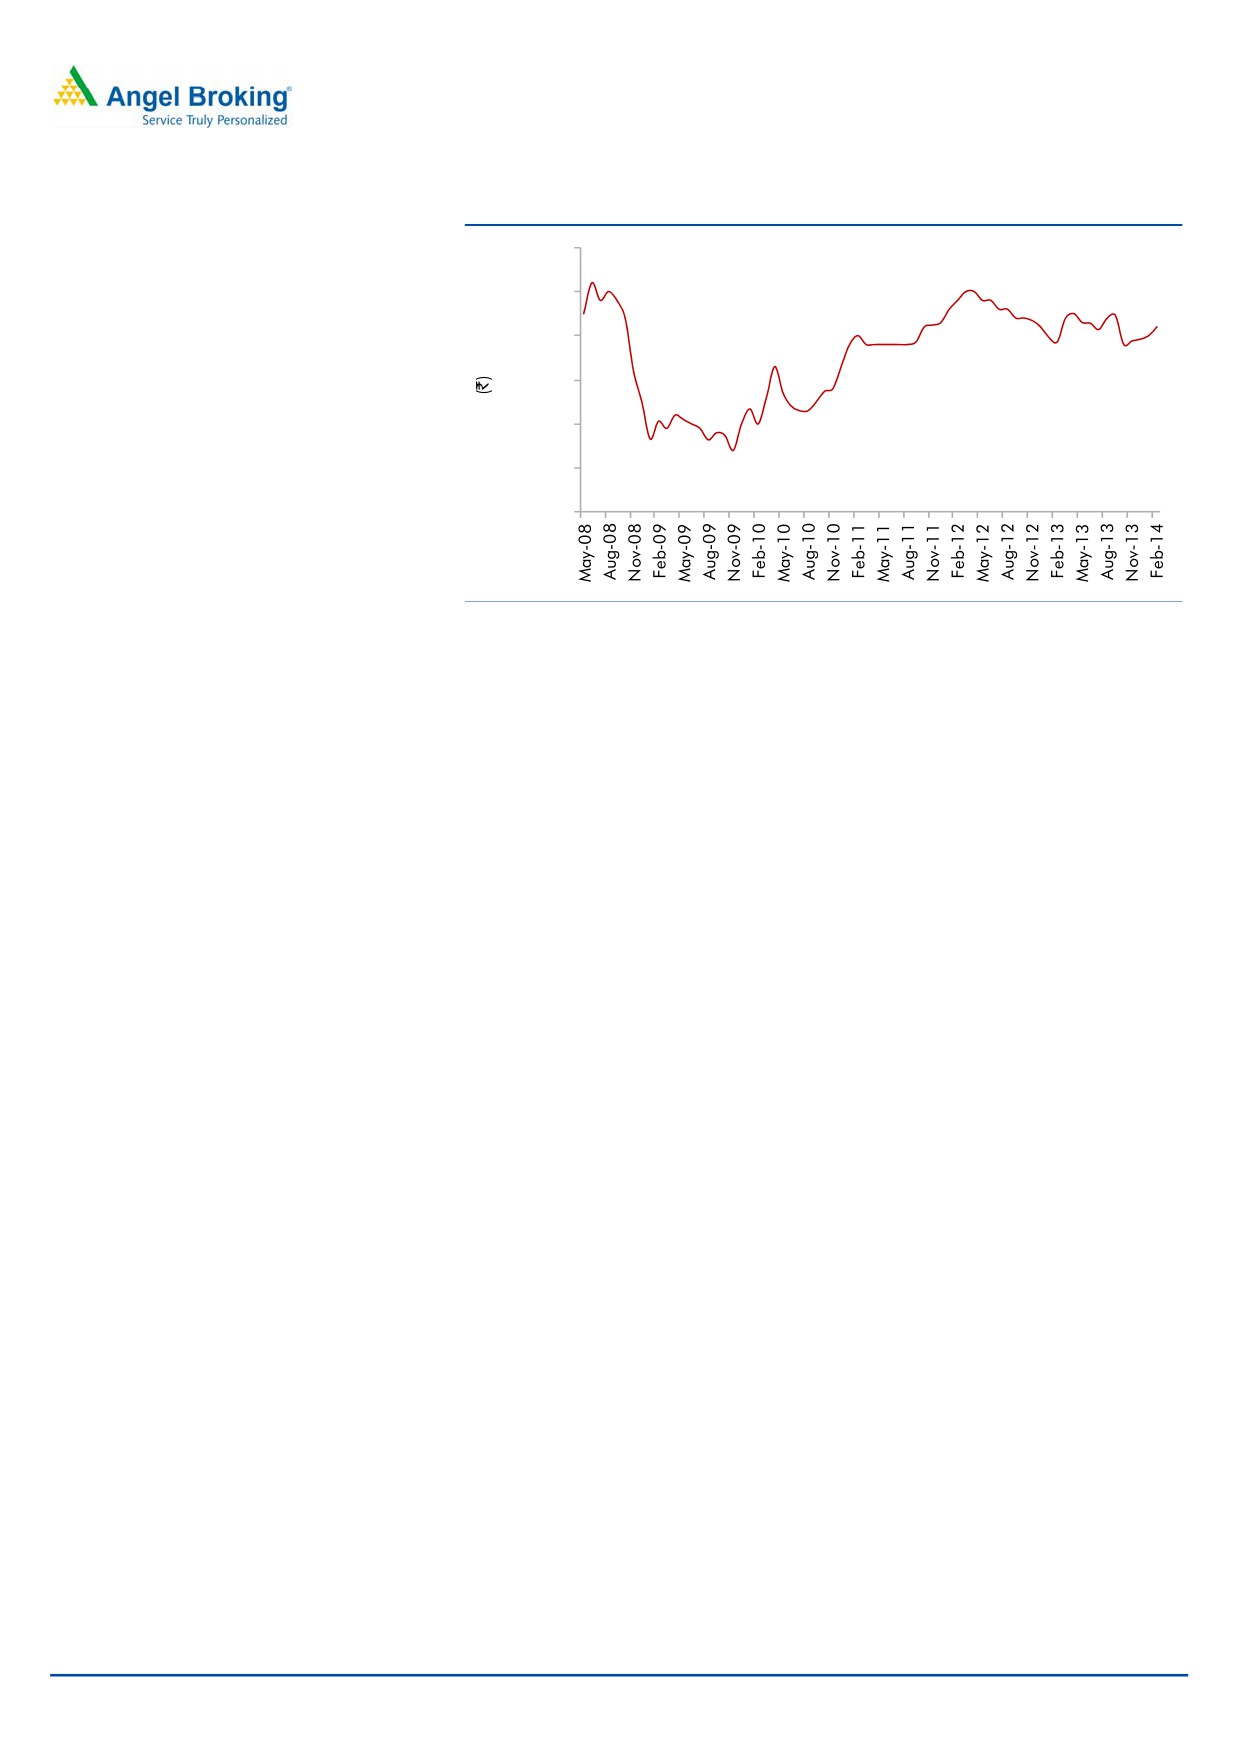
Fluctuations in Steel price: Any substantial fluctuation in the steel price can lead to
margin compression of the company.
February 18, 2014
6
M M Forgings | Initiating Coverage
Exhibit 14: Steel price
50,000
45,000
41,000
40,000
35,000
30,000
25,000
20,000
Source: Angel Research, Bloomberg
Company background
MM Forgings (MMFL) was incorporated in 1946 as Madras Motors Ltd. and was
renamed MM Forgings Ltd. in the year 1993. It is engaged in the manufacturing of
steel forgings, with a work force of 1,105 employees. It manufactures steel
forgings in raw, semi-machined and fully machined stages in various grades of
Carbon, Alloy, Micro-Alloy and Stainless Steels in the weight range of 0.20Kg to
60Kg. The Company caters to the forging requirements of almost all sections of
the industry - Automotive, Valve and Oil-filed, Engineering and Off Highway.
The company’s manufacturing plants are located at Singampunari-Pasumpon
Muthuramalingam District, Viralimalai-Pudukkottai District and Karainaithangal
Village- Kanchipuram District, all in Tamil Nadu. The company has its Wind Farm
at Panakudi Village- Tirunelveli District and at Meenakshipuram, Theni District and
the power generated is used for captive use.
Further the company earns ~70% of its sales from exports, mainly to the US and
Europe.
Industry
Global forging industry
According to a report by ResearchMoz, a New York based market research firm,
the global forging industry is expected to grow at a CAGR of 9.4% over FY2012-
16E, and the automotive industry is believed to be the major factor contributing in
this growth. It further states that the global forging industry is sourcing forged
products from countries where manufacturing costs are low.
Domestic auto component and forging industry
According to ACMA estimates, the domestic auto component industry has grown at
a CAGR of 12% over FY2008-12 and is expected to grow at a CAGR of 14% over
FY2013-21E to US$115bn in FY2021E.
February 18, 2014
7
M M Forgings | Initiating Coverage
Exhibit 15: Auto Component Industry Profile - Turnover
Exhibit 16: Auto component industry product profile (2012)
Others
115
120
7%
Electrical parts
100
9%
Engine parts
31%
80
66
Equipments
10%
60
40
42
41
40
30
27
23
Suspension &
Braking parts
20
12%
Drive
0
transmission &
FY2008 FY2009 FY2010 FY2011 FY2012 FY2013 FY2016E FY2021E
Body & chasis
steering parts
12%
19%
Source: ACMA, Angel Research
Source: ACMA, Angel Research
Also, the export of auto components is expected to grow at a CAGR of 16% over
FY2013-21E. In value terms the export is expected to grow from US$9bn to
US$30bn over the same period.
Exhibit 17: Auto Component Industry Profile - Exports
Exhibit 18: Export destination
35.0
Australia
Africa
30.0
1%
9%
30.0
South America
4%
25.0
Europe
35%
20.0
Asia
15.0
12.0
25%
9.3
8.5
10.0
5.2
3.8
4.0
3.4
5.0
0.0
North America
FY2008 FY2009 FY2010 FY2011 FY2012 FY2013 FY2016E FY2021E
26%
Source: ACMA, Angel Research
Source: ACMA, Angel Research
The Indian forging industry was valued at `25,000cr (May, 2013) and looking at
the auto component industry’s future growth forecasts, it is expected that the
production of forgings will be at ~ `37,000cr by FY2015E. The forging industry
has installed capacity of 3.8mn tonne/year with a capacity utilisation rate of 75%.
February 18, 2014
8
M M Forgings | Initiating Coverage
Profit and loss statement
Y/E Mar. (` cr)
FY2012
FY2013
FY2014E
FY2015E
FY2016E
Net Sales
350
361
412
469
534
Other operating income
-
-
-
-
-
Total operating income
350
361
412
469
534
% chg
28.7
3.1
14.1
13.9
13.9
Net Raw Materials
147
154
176
201
229
% chg
49.6
4.9
14.0
14.2
14.0
Power and Fuel
45
46
46
52
59
% chg
30.5
2.7
0.1
12.8
12.8
Personnel
28
31
39
45
51
% chg
0.7
11.8
26.7
13.9
13.9
Other
70
72
76
87
99
% chg
20.2
2.6
5.6
13.9
13.9
Total Expenditure
290
303
337
384
437
EBITDA
60
58
75
85
97
% chg
12.7
(4.4)
29.1
13.6
14.1
(% of Net Sales)
17.3
16.0
18.1
18.1
18.1
Depreciation
23
21
35
37
40
EBIT
37
37
40
48
57
% chg
10.5
(1.9)
7.9
20.3
19.7
(% of Net Sales)
10.7
10.1
9.6
10.1
10.7
Interest & other Charges
6
7
8
7
7
Other Income
7
1
4
4
5
(% of Net Sales)
2.1
0.1
0.9
0.9
0.9
Recurring PBT
31
30
32
40
49
% chg
10.7
(5.5)
7.7
26.2
23.3
PBT (reported)
39
30
35
44
54
Tax
12
6
8
12
15
(% of PBT)
30.7
18.6
22.2
27.2
27.2
PAT (reported)
27
24
28
32
40
Extraordinary Expense/(Inc.)
5
0
0
0
0
ADJ. PAT
21
24
28
32
40
% chg
(4.1)
14.7
13.0
16.9
22.4
(% of Net Sales)
6.1
6.8
6.7
6.9
7.4
Basic EPS (`)
17.7
20.3
22.9
26.8
32.8
Fully Diluted EPS (`)
17.7
20.3
22.9
26.8
32.8
% chg
(4.1)
14.7
13.0
16.9
22.4
February 18, 2014
9
M M Forgings | Initiating Coverage
Balance sheet
Y/E Mar. (` cr)
FY2012
FY2013
FY2014E
FY2015E
FY2016E
SOURCES OF FUNDS
Equity Share Capital
12
12
12
12
12
Reserves& Surplus
140
160
181
205
233
Shareholders’ Funds
152
172
193
217
246
Total Loans
133
117
111
111
111
Other Long Term Liabilities
1
1
1
1
1
Long Term Provisions
0
0
0
0
0
Deferred Tax (Net)
10
11
11
11
11
Total liabilities
296
300
315
339
368
APPLICATION OF FUNDS
Gross Block
369
398
438
464
497
Less: Acc. Depreciation
181
202
237
275
314
Net Block
188
196
201
190
182
Capital Work-in-Progress
3
4
4
5
5
Goodwill
-
-
-
-
-
Investments
0
0
0
0
0
Long Term Loans and adv.
-
-
-
-
-
Other Non-current asset
12
17
20
23
32
Current Assets
137
146
155
195
232
Cash
1
1
2
5
10
Loans & Advances
27
39
38
56
72
Inventory
85
71
82
91
101
Debtors
23
34
33
42
48
Other current assets
-
-
-
-
-
Current liabilities
44
63
65
74
84
Net Current Assets
94
83
90
121
148
Misc. Exp. not written off
-
-
-
-
-
Total Assets
296
300
315
339
368
February 18, 2014
10
M M Forgings | Initiating Coverage
Cash flow statement
Y/E Mar. (` cr)
FY2012 FY2013 FY2014E FY2015E FY2016E
Profit before tax
39
30
35
44
54
Depreciation
23
21
35
37
40
Change in Working Capital
(1)
10
(6)
(28)
(22)
Direct taxes paid
(12)
(6)
(8)
(12)
(15)
Others
(1)
2
(4)
(4)
(5)
Cash Flow from Operations
48
57
53
37
53
(Inc.)/Dec. in Fixed Assets
(66)
(30)
(40)
(27)
(33)
(Inc.)/Dec. in Investments
-
(0)
-
-
-
(Incr)/Decr In LT loans & adv.
(2)
(5)
(3)
(4)
(9)
Others
9
6
4
4
5
Cash Flow from Investing
(59)
(30)
(39)
(26)
(37)
Issue of Equity
-
-
-
-
-
Inc./(Dec.) in loans
21
(17)
(6)
-
-
Dividend Paid (Incl. Tax)
(4)
(4)
(4)
(4)
(4)
Others
(6)
(7)
(3)
(4)
(7)
Cash Flow from Financing
11
(28)
(13)
(8)
(11)
Inc./(Dec.) in Cash
0
(0)
1
2
5
Opening Cash balances
1
1
1
2
5
Closing Cash balances
1
1
2
5
10
February 18, 2014
11
M M Forgings | Initiating Coverage
Key ratios
Y/E Mar.
FY2012
FY2013
FY2014E
FY2015E
FY2016E
Valuation Ratio (x)
P/E (on FDEPS)
5.5
4.8
4.3
3.7
3.0
P/CEPS
2.7
2.6
1.9
1.7
1.5
P/BV
0.8
0.7
0.6
0.5
0.5
EV/Net sales
0.7
0.6
0.6
0.5
0.4
EV/EBITDA
4.1
4.0
3.0
2.6
2.3
EV / Total Assets
0.9
0.8
0.7
0.7
0.6
Per Share Data (`)
EPS (Basic)
17.7
20.3
22.9
26.8
32.8
EPS (fully diluted)
17.7
20.3
22.9
26.8
32.8
Cash EPS
36.8
37.8
51.9
57.5
65.7
DPS
3.0
3.0
3.0
3.0
3.0
Book Value
125.8
142.6
159.8
179.5
203.4
DuPont Analysis
EBIT margin
10.7
10.1
9.6
10.1
10.7
Tax retention ratio
0.7
0.8
0.8
0.7
0.7
Asset turnover (x)
1.3
1.3
1.4
1.5
1.6
ROIC (Post-tax)
10.0
10.5
10.6
11.3
12.6
Cost of Debt (Post Tax)
3.5
4.7
5.3
4.9
4.9
Leverage (x)
0.9
0.7
0.6
0.5
0.4
Operating ROE
15.6
14.5
13.5
14.3
15.7
Returns (%)
ROCE (Pre-tax)
14.2
12.7
13.3
15.0
16.6
Angel ROIC (Pre-tax)
14.4
13.0
13.6
15.4
17.2
ROE
15.2
15.1
15.1
15.8
17.1
Turnover ratios (x)
Asset TO (Gross Block)
1.0
0.9
1.0
1.0
1.1
Inventory / Net sales (days)
78
79
68
67
66
Receivables (days)
34
29
29
33
33
Payables (days)
50
64
70
70
70
WC cycle (ex-cash) (days)
96
88
75
79
87
Solvency ratios (x)
Net debt to equity
0.9
0.7
0.6
0.5
0.4
Net debt to EBITDA
2.2
2.0
1.5
1.3
1.0
Int. Coverage (EBIT/ Int.)
6.1
5.1
5.1
6.4
7.6
February 18, 2014
12
M M Forgings | Initiating Coverage
Research Team Tel: 022 - 39357800
DISCLAIMER
This document is solely for the personal information of the recipient, and must not be singularly used as the basis of any investment
decision. Nothing in this document should be construed as investment or financial advice. Each recipient of this document should
make such investigations as they deem necessary to arrive at an independent evaluation of an investment in the securities of the
companies referred to in this document (including the merits and risks involved), and should consult their own advisors to determine
the merits and risks of such an investment.
Angel Broking Pvt. Limited, its affiliates, directors, its proprietary trading and investment businesses may, from time to time, make
investment decisions that are inconsistent with or contradictory to the recommendations expressed herein. The views contained in this
document are those of the analyst, and the company may or may not subscribe to all the views expressed within.
Reports based on technical and derivative analysis center on studying charts of a stock's price movement, outstanding positions and
trading volume, as opposed to focusing on a company's fundamentals and, as such, may not match with a report on a company's
fundamentals.
The information in this document has been printed on the basis of publicly available information, internal data and other reliable
sources believed to be true, but we do not represent that it is accurate or complete and it should not be relied on as such, as this
document is for general guidance only. Angel Broking Pvt. Limited or any of its affiliates/ group companies shall not be in any way
responsible for any loss or damage that may arise to any person from any inadvertent error in the information contained in this report.
Angel Broking Pvt. Limited has not independently verified all the information contained within this document. Accordingly, we cannot
testify, nor make any representation or warranty, express or implied, to the accuracy, contents or data contained within this document.
While Angel Broking Pvt. Limited endeavours to update on a reasonable basis the information discussed in this material, there may be
regulatory, compliance, or other reasons that prevent us from doing so.
This document is being supplied to you solely for your information, and its contents, information or data may not be reproduced,
redistributed or passed on, directly or indirectly.
Angel Broking Pvt. Limited and its affiliates may seek to provide or have engaged in providing corporate finance, investment banking
or other advisory services in a merger or specific transaction to the companies referred to in this report, as on the date of this report or
in the past.
Neither Angel Broking Pvt. Limited, nor its directors, employees or affiliates shall be liable for any loss or damage that may arise from
or in connection with the use of this information.
Note: Please refer to the important `Stock Holding Disclosure' report on the Angel website (Research Section). Also, please refer to the
latest update on respective stocks for the disclosure status in respect of those stocks. Angel Broking Pvt. Limited and its affiliates may
have investment positions in the stocks recommended in this report.
Disclosure of Interest Statement
M M Forgings
1. Analyst ownership of the stock
No
2. Angel and its Group companies ownership of the stock
No
3. Angel and its Group companies' Directors ownership of the stock
No
4. Broking relationship with company covered
No
Note: We have not considered any Exposure below ` 1 lakh for Angel, its Group companies and Directors
Ratings (Returns):
Buy (> 15%)
Accumulate (5% to 15%)
Neutral (-5 to 5%)
Reduce (-5% to -15%)
Sell (< -15%)
February 18, 2014
13
M M Forgings | Initiating Coverage
6th Floor, Ackruti Star, Central Road, MIDC, Andheri (E), Mumbai- 400 093. Tel: (022) 39357800
Research Team
Fundamental:
Sarabjit Kour Nangra
VP-Research, Pharmaceutical
Vaibhav Agrawal
VP-Research, Banking
Bhavesh Chauhan
Sr. Analyst (Metals & Mining)
V Srinivasan
Analyst (Cement, FMCG)
Yaresh Kothari
Analyst (Automobile)
Ankita Somani
Analyst (IT, Telecom)
Bhupali Gursale
Economist
Vinay Rachh
Research Associate
Amit Patil
Research Associate
Twinkle Gosar
Research Associate
Tejashwini Kumari
Research Associate
Akshay Narang
Research Associate
Harshal Patkar
Research Associate
Nishant Sharma
Research Associate
Technicals and Derivatives:
Siddarth Bhamre
Head - Technical & Derivatives
Sameet Chavan
Technical Analyst
Nagesh Arekar
Executive
Sneha Seth
Associates (Derivatives)
Institutional Sales Team:
Mayuresh Joshi
VP - Institutional Sales
Meenakshi Chavan
Dealer
Gaurang Tisani
Dealer
Production Team:
Tejas Vahalia
Research Editor
Dilip Patel
Production Incharge
CSO & Registered Office: G-1, Ackruti Trade Centre, Road No. 7, MIDC, Andheri (E), Mumbai - 93. Tel: (022) 3083 7700. Angel Broking Pvt. Ltd: BSE Cash: INB010996539 / BSE F&O: INF010996539, CDSL Regn. No.: IN - DP - CDSL - 234 - 2004, PMS Regn. Code: PM/INP000001546, NSE Cash: INB231279838 /
NSE F&O: INF231279838 / NSE Currency: INE231279838, MCX Stock Exchange Ltd: INE261279838 / Member ID: 10500. Angel Commodities Broking (P) Ltd.: MCX Member ID: 12685 / FMC Regn. No.: MCX / TCM / CORP / 0037 NCDEX: Member ID 00220 / FMC Regn. No.: NCDEX / TCM / CORP / 0302.
February 18, 2014
14