Initiating Coverage | Auto Ancillary
August 20, 2014
L G Balakrishnan & Bros
BUY
CMP
`497
LGBL to benefit from 2W industry growth
Target Price
`605
Investment Arguments
Investment Period
12 Months
Recovery in two-wheeler industry would benefit L G Balakrishnan & Bros (LGBL):
Stock Info
During FY2014, the domestic sales of two-wheelers stood at ~14.8 million units
Sector
Auto Ancillary
(growing 7.3% yoy) and exports recorded sales of ~2.1 million units (growing
Market Cap (` cr)
780
6.3% yoy). In the FY2013, the Indian two-wheeler industry reported a subdued
Net Debt (` cr)
126
volume growth. But in FY2014, the industry showed some recovery in the
Beta
0.5
domestic (on back of strong rural demand and festive season sales) as well as
52 Week High / Low
535 / 77
export markets. During 1QFY2015, the two-wheeler industry has reported a
strong growth of 15.5% due to recovery in domestic and export markets. We
Avg. Daily Volume
7,406
expect growth momentum in the two-wheeler industry to sustain owing to an
Face Value (`)
10
anticipated recovery in the economy coupled with revival in the investment cycle.
BSE Sensex
26,421
This would be on the back of the new pro-reforms government having come at the
Nifty
7,898
centre and on an expected decline in interest rates. We expect two-wheeler sales to
Reuters Code
LGB.BO
improve going forward which would benefit auto ancillary companies like LGBL.
Bloomberg Code
LGBB@IN
Capacity expansion at key clients would drive growth for LGBL: The company’s
Shareholding Pattern (%)
automotive chains segment caters to the OEM market for two-wheelers. In the
Promoters
46.5
OEM segment (LGBL has a 70% market share in this segment), the company has
tied up with leading two wheeler players like Bajaj Auto, Hero MotoCorp (HMCL),
MF / Banks / Indian Fls
6.8
Honda Motorcycle and Scooter India (HMSI), TVS Motor, Yamaha Motor etc., all
FII / NRIs / OCBs
0.0
of which have good growth prospects. These OEMs are increasing their capacity
Indian Public / Others
46.7
and also entering newer geographies for export which would drive growth of the
industry. Hence, going forward, we believe that expansion plans at various OEM
Abs. (%)
3m 1yr
3yr
clients would trigger volume growth for LGBL.
Sensex
8.5
44.3
63.7
Outlook and Valuation: We forecast LGBL to report Net Sales CAGR of ~16%
LGBL
80.3
533.3
266.0
over FY2014-16E to ~`1,484cr and Net Profit CAGR of ~12% during the same
period to `79cr. At the current market price of `497, the stock trades at 11.7x
and 9.9x its FY2015E and FY2016E EPS of `42.6 and `50.4, respectively. Based
on 12x FY2016E EPS, we arrive at a target price of `605 for LGBL, indicating an
upside of ~22% from the current levels. Thus, we recommend a Buy on LGBL.
Key financials
Y/E March (` cr)
FY2013
FY2014
FY2015E
FY2016E
Net sales
956
1,109
1,276
1,484
% chg
4.8
15.9
15.1
16.4
Net profit
33
63
67
79
% chg
(26.0)
91.6
6.7
18.2
EBITDA margin (%)
9.3
11.4
11.5
11.5
EPS (`)
20.8
39.9
42.6
50.4
P/E (x)
23.8
12.4
11.7
9.9
P/BV (x)
3.0
2.5
2.1
1.8
RoE (%)
12.7
20.3
18.2
18.1
RoCE (%)
13.9
20.3
20.6
21.0
Amarjeet S Maurya
EV/Sales (x)
1.0
0.8
0.7
0.6
022-39357800 Ext: 6831
EV/EBITDA (x)
10.3
7.2
6.1
5.2
Source: Company, Angel Research, Note: CMP as of August 19, 2014
Please refer to important disclosures at the end of this report
1
L G Balakrishnan & Bros | Initiating Coverage
Investment Arguments
Recovery in two-wheeler industry would benefit LGBL
India has been amongst the fastest growing two-wheeler markets in the world in
the last five years. For FY2014, domestic sales of two-wheelers stood at ~14.8
million units (a 7.3% yoy growth) and exports recorded sales of ~2.1 million units
During 1QFY2015, the two-wheelers
(a 6.3% yoy growth). In the FY2013, the Indian two-wheeler industry reported a
industry has reported a strong growth
subdued volume growth owing to slow down in the domestic economy, higher
of 15.5% due to strong recovery in
inflation and increase in fuel prices. Further, overall two wheelers export numbers
domestic and export markets
were also subdued. However, the Indian two-wheeler industry showed some
recovery in domestic (on back of strong rural demand and festive season sales) as
well as export markets in FY2014. During 1QFY2015, the two-wheeler industry
has reported a strong growth of 15.5% due to recovery in domestic and export
markets.
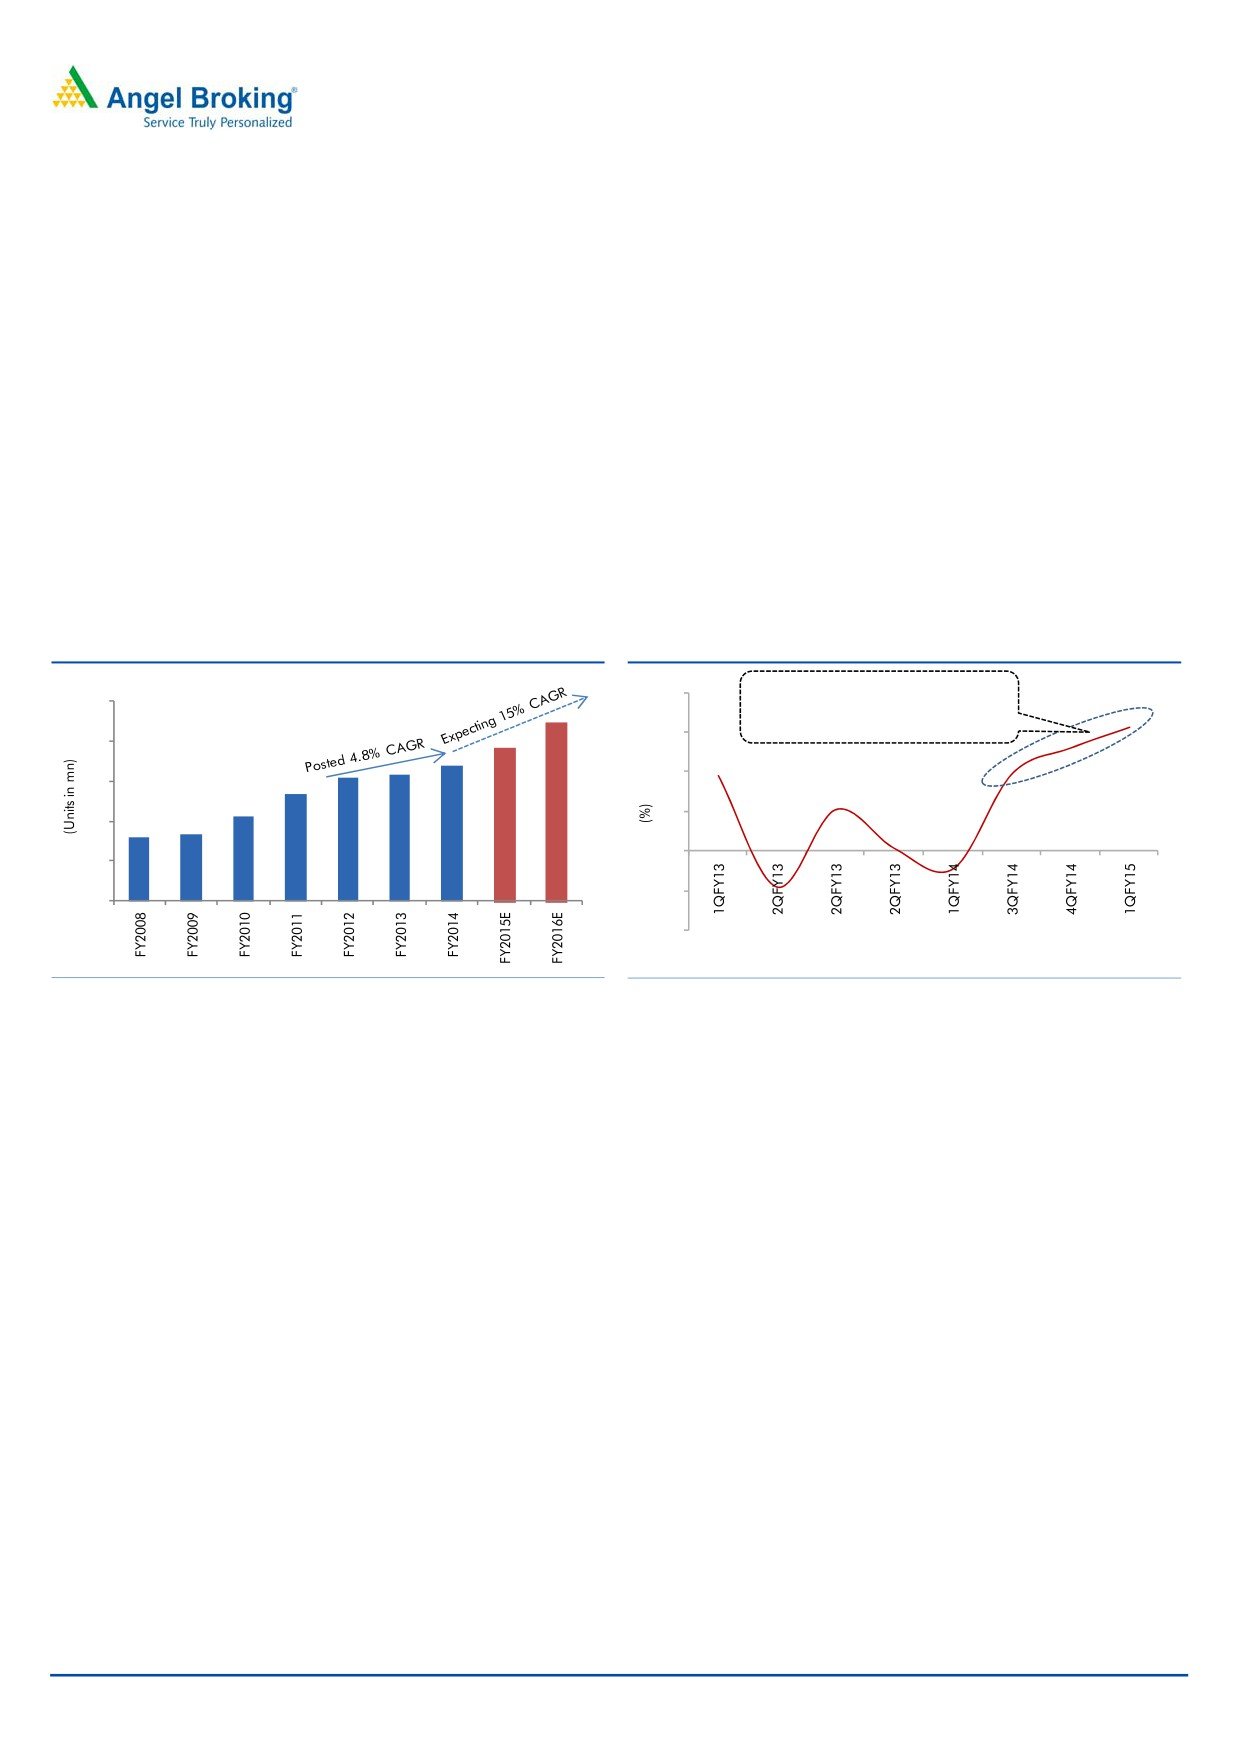
Exhibit 1: Two wheeler Industry trend
Exhibit 2: Recovery in two wheeler volume growth
20
After disappointment of 4 consecutive
25
quarters the two-wheeler industry has
shown sign of recovery
15
20
10
15
5
10
0
5
(5)
0
(10)
Source: SIAM, Angel Research
Source: SIAM, Angel Research
Considering the domestic two-wheeler industry’s growth and improvement in
demand in the domestic and export markets (Indian two-wheeler OEMs are
expanding in new geographical regions like Africa and Latin America) in the last
We expect the Indian two-wheeler
three quarters, we expect the Indian two-wheeler industry to report a healthy ~15%
industry to report a healthy
~15%
CAGR over FY2014-16E. Also, with the formation of the new government at the
CAGR over FY2014-16E
centre, we expect inflationary pressures to subside, thus leading to lower interest
rates. This coupled with anticipation of increase in personal disposable incomes
(due to recovery in the domestic economy) would create a positive sentiment for
India consumers. Further, moderate two-wheeler penetration levels in the country
compared to other emerging markets, strong urbanization and under-developed
public transport system will provide a boost to the domestic two-wheeler industry.
August 20, 2014
2
L G Balakrishnan & Bros | Initiating Coverage
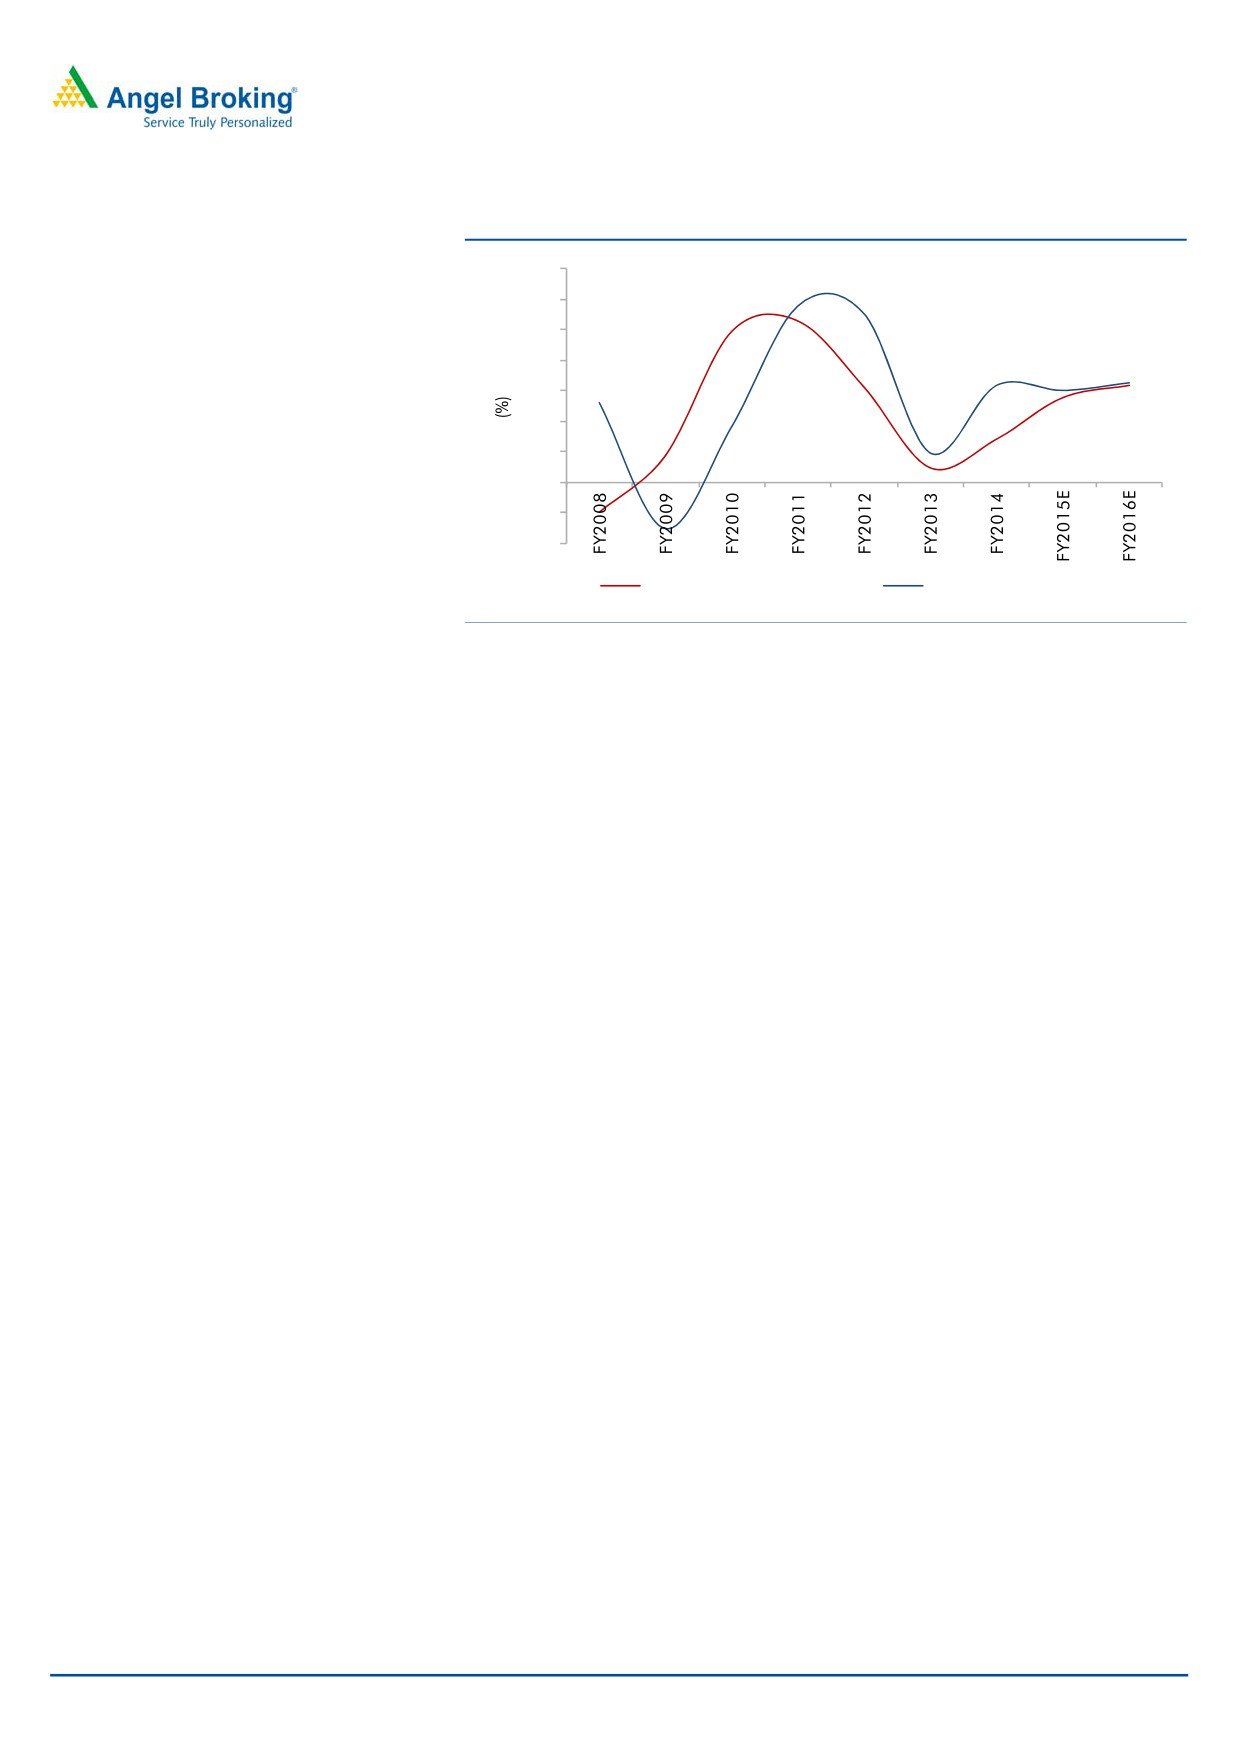
Exhibit 3: Correlation between 2W volumes and LGBL’s top-line performance
35
30
25
20
15
10
5
0
(5)
(10)
Two wheeler volume growth
LGBL sales growth
Source: Company, Angel Research
LGBL has a strong brand - ‘ROLON' in the automotive chains segment which
LGBL has ~70% market share in the
contributes by
~65% to the company’s revenue. In automotive chains, the
OEM segment
company has a ~70% market share in the OEM segment and around ~50%
market share in the replacement segment. Thus, we believe that LGBL is best
placed to take advantage of an expected recovery in the two-wheeler industry.
Moreover, over the last 7 years, we have witnessed a strong correlation between
volume growth in the two wheeler industry and sales growth of LGBL. We expect
this trend to continue going forward. Thus, in our view, LGBL would benefit from a
recovery in two-wheeler volumes going forward.
Capacity expansion at key clients would drive growth for LGBL
The company’s automotive chains segment caters to the OEM market for two-
wheelers. In the OEM segment (LGBL has a 70% market share in this segment), the
company has tied up with leading two-wheeler manufacturers like Bajaj Auto, Hero
MotoCorp (HMCL), Honda Motorcycle and Scooter India (HMSI), TVS Motor, and
Yamaha Motor among others, all of which have good growth prospects. These
The company has tied up with leading
major two-wheeler OEMs are increasing their capacity and also entering into new
two-wheeler OEMs like Bajaj Auto,
geographies, which would drive the industry’s growth going forward. On a similar
Hero MotoCorp (HMCL), Honda
account, the replacement market is also doing well.
Motorcycle and Scooter India (HMSI),
HMCL is expected to start construction of its proposed fifth plant at Halol in
TVS motor, Yamaha Motor etc
Gujarat soon, where the company will invest up to `1,100cr. The plant is expected
to go on stream in FY2016 with an annual capacity of 1.8 million units of two-
wheelers. Going forward, the expansion plan of HMCL will lead to an increase in
its production capacity from 7.7 million units currently to 9.5 million units once the
plant becomes operational.
In the last three years, HMSI has grown from one plant to three plants, and now
the company has plans to increase its production capacity in India from 4.6 million
units to
5.8 million units. The company’s fourth plant will come up near
Ahmedabad, which will have an annual capacity of 1.2 million units; the plant is
expected to go running by FY2015.
August 20, 2014
3
L G Balakrishnan & Bros | Initiating Coverage
Further, Yamaha is also investing money to increase its production capacity from
1mn units currently to 2.8mn units by 2QFY2015E.
Going forward, we believe that expansion plans at various clients like HMCL,
HMSI, Yamaha, etc. would trigger volume growth for LGBL.
Exhibit 4: Upcoming expansion plans of clients
(Units)
Current Capacity
Expected Capacity
Total Capacity
Entry in newer markets
Argentina, Turkey, Afghanistan, Lebanon, Guinea,
Bajaj Auto
5.8mn
0.2mn
6.0mn
Togo, Mali, Burkina Faso and Liberia
Hero MotoCorp
7.7mn
Gujarat - 1.8mn
9.5mn
Asia, Africa and South America
Honda Motorcycle and
4.6mn
Gujarat -1.2mn
5.8mn
Latin Americans and Africa
Scooter India
Yamaha Motor
1mn
Chennai -1.8mn
2.8mn
US and Japan
Source: Company, Angel Research
Other automotive products to contribute to revenue growth
Apart from two-wheelers (automotive chains), the company also manufacturers
products for LCVs, cars/jeeps, three-wheelers, trucks and tractors. For these
vehicles, the company supplies products like timing B belts, vari speed belts,
cogged belts, poly v belts etc. Further, the company is also supplying break shoe to
LGBL also manufactures products for
automobile industry. We believe that the company has a healthy diversified
LCVs, cars/jeeps, three wheelers, trucks
product portfolio in the automobile segment. Also, LGBL is also surging ahead to
and tractors
become a metal forging company, concentrating on hot, warm & cold forging,
blanking, fine blanking & precision machined parts etc. The metal forming division
caters to clients such as Bajaj Auto, Brakes India, Hero Honda, Kalyani Brakes,
Larsen & Toubro, Bosch, and TVS Motor Company.
August 20, 2014
4
L G Balakrishnan & Bros | Initiating Coverage
Financial outlook
LGBL has reported sales CAGR of ~10% over FY2012-14. During FY2013, the
company was unable to perform well due to the overall slowdown in the two-
Going forward, we believe that LGBL
wheeler industry, which affected overall OEM sales volume of the company. Going
would register a healthy sales CAGR of
forward, we expect LGBL to register a healthy sales CAGR of ~16% over FY2014-
~16% over FY2014-16E
16E supported by healthy sales volume in the OEM segment due to strong
recovery in the two-wheeler industry. Further, the company is making efforts to
increase its distribution network to aid its replacement market sales. Moreover, the
company’s other segments are also doing well and are expected to post healthy
sales numbers. Hence, we expect LGBL’s revenue to grow by ~15% and ~16% in
FY2015E and FY2016E respectively.
We expect LGBL to report a ~12% CAGR in PAT over FY2014-16E on the back of
decent revenue growth, stable material costs (not much pressure seen on input
costs going forward) and better operational performance. Further, we expect
We expect LGBL to report a ~12%
interest costs to be stable going forward (as there is no major capex plan) and also
CAGR in PAT over FY2014-16E
expect a lower tax rate in FY2015 and FY2016 (according to the Management the
company would get tax exemption for the next two years as the company’s
manufacturing plant is in a special economic zone).
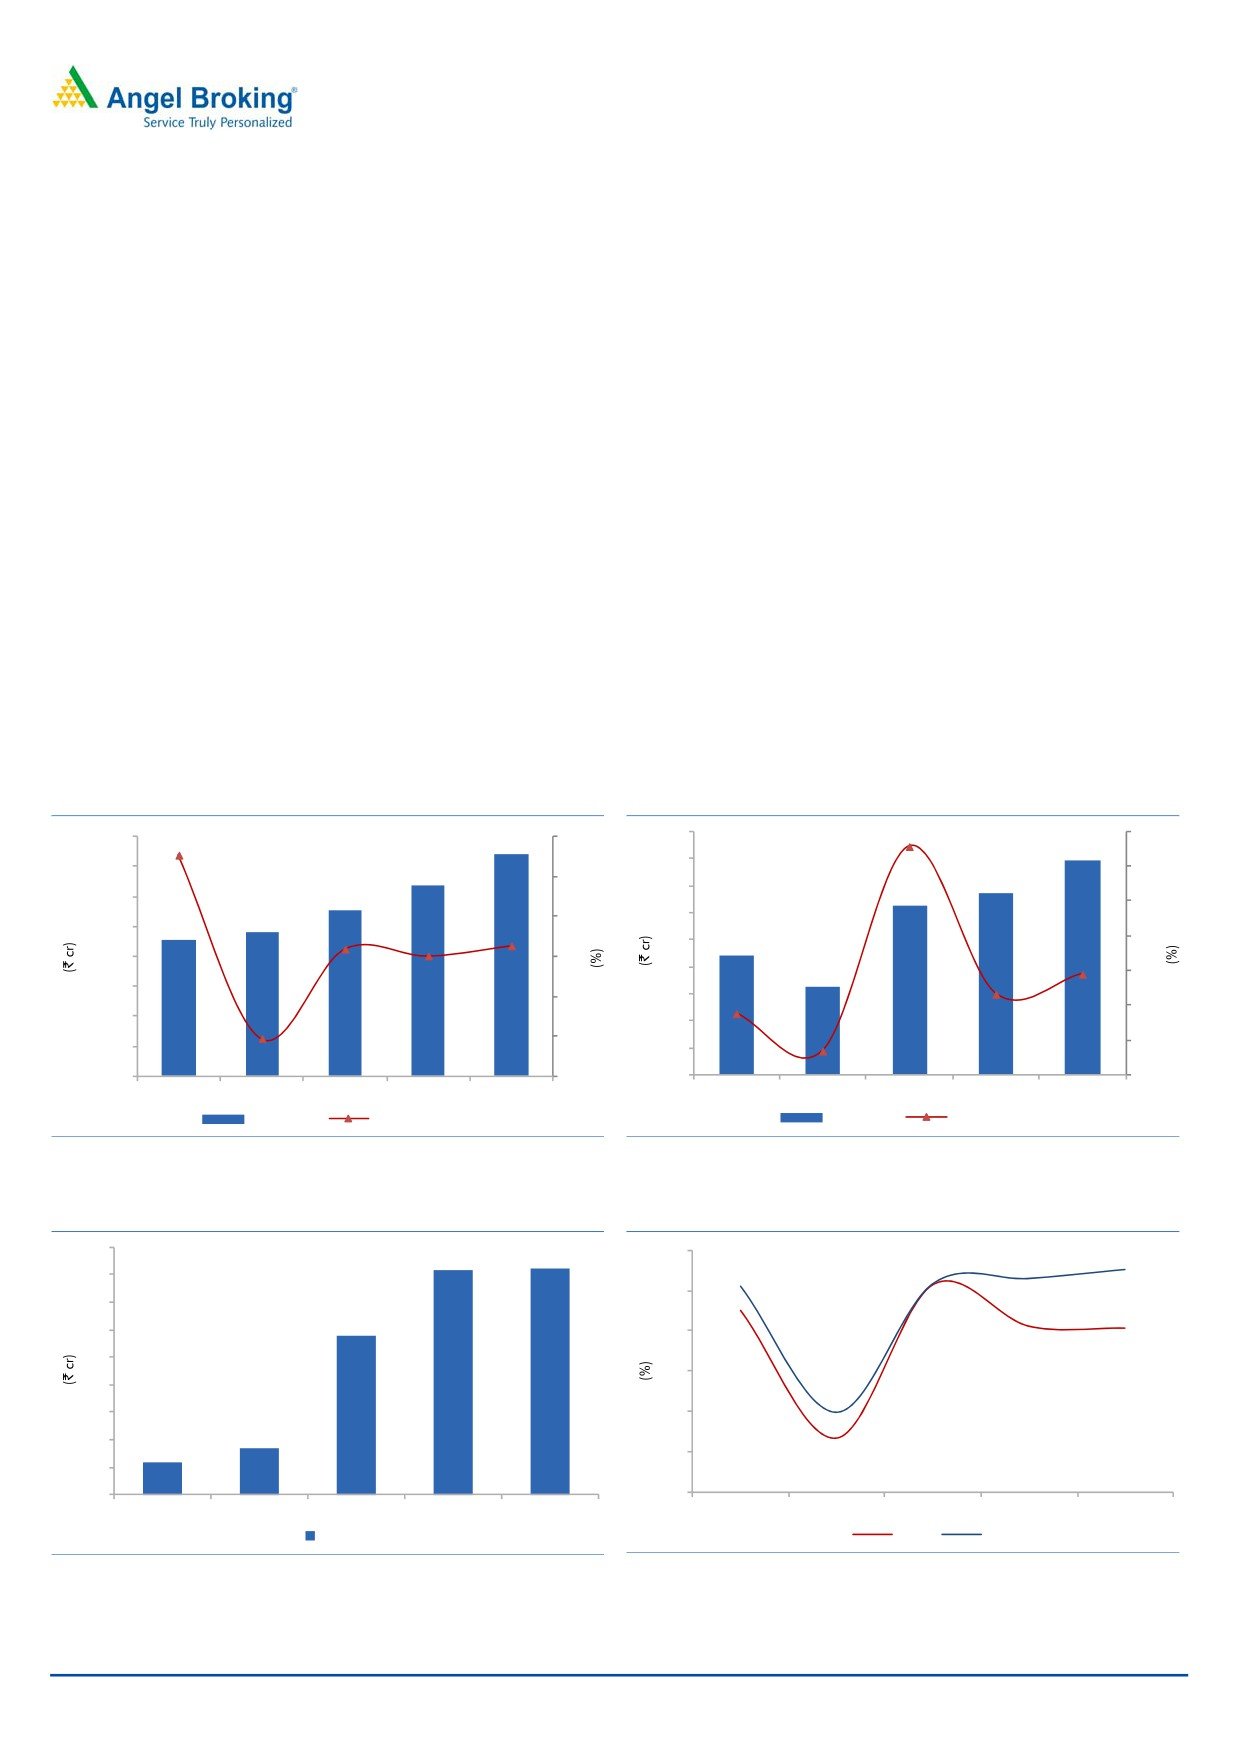
Exhibit 5: Projected Net Sales growth trend
Exhibit 6: Projected Net Profit growth trend
90
100
1,600
1,484
30
91.6
79
80
1,400
27.7
1,276
80
25
67
70
63
1,200
1,109
60
956
20
60
1,000
913
50
44
40
800
15
15.9
16.4
40
33
18.2
20
15.1
600
10
30
6.7
(4.5)
0
400
20
5
(20)
200
10
(26.0)
4.8
-
0
-
(40)
FY2012
FY2013
FY2014
FY2015E
FY2016E
FY2012
FY2013
FY2014
FY2015E
FY2016E
Net Sales
yoy growth (%)
Net Profit
yoy growth (%)
Source: Company, Angel Research
Source: Company, Angel Research
Exhibit 7: Strong free cash flow generation
Exhibit 8: ROE and ROCE trend
45
22
40
20
35
30
18
25
16
20
15
14
10
12
5
0
10
FY2012
FY2013
FY2014
FY2015E
FY2016E
FY2012
FY2013
FY2014
FY2015E
FY2016E
Free cash flow
ROE
ROCE
Source: Company, Angel Research
Source: Company, Angel Research
August 20, 2014
5
L G Balakrishnan & Bros | Initiating Coverage
Outlook and Valuation
LGBL is a market leader in two-wheeler automotive chains with ~70% market
share in the OEM segment. The two-wheeler industry is showing signs of recovery,
both in terms of domestic sales as well as exports. This will lead to recurring
business opportunity for auto ancillary companies like LGBL. Going ahead, the
company would improve its volume growth in the automotive chains segment
driven by healthy volume growth at key clients like HMCL, HMSI, Yamaha, TVS
Motor and others (owing to upcoming capacity expansion plans and new
launches).
We forecast LGBL to report Net Sales CAGR of ~16% over FY2014-16E to
~`1,484cr and Net Profit CAGR of ~12% during the same period to `79cr. At the
current market price of `497, the stock trades at 11.7x and 9.9x its FY2015E and
FY2016E EPS of `42.6 and `50.4, respectively. Based on 12x FY2016E EPS, we
arrive at a target price of `605 for LGBL, indicating an upside of ~22% from the
current levels. Thus, we recommend a Buy on LGBL.
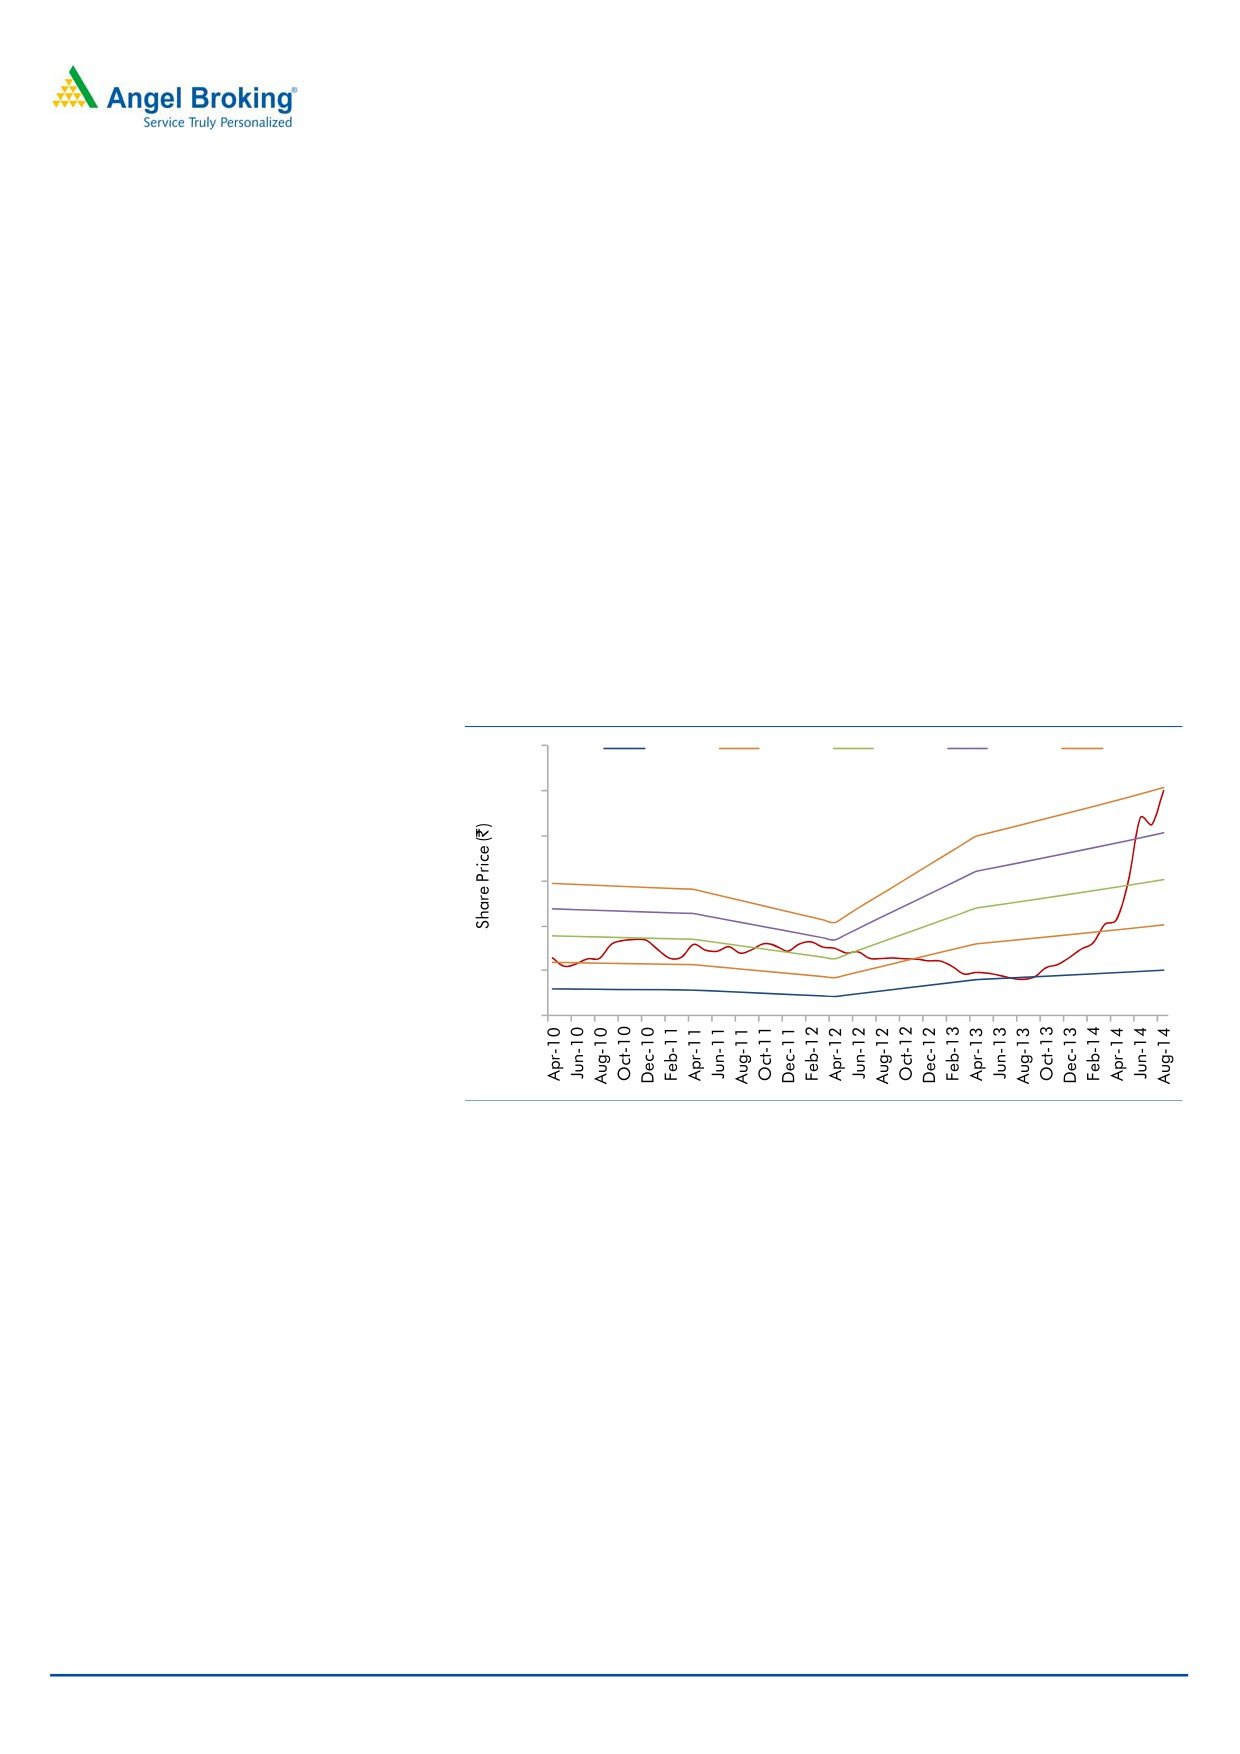
Exhibit 9: One-year forward P/E band
600
2x
4x
6x
8x
10x
500
400
300
200
100
0
Source: Company, Angel Research
The downside risks to our estimates include 1) any increase in input costs (i.e. steel,
iron, etc.) could negatively impact profitability, and 2) Downturn in the automobile
industry could affect business growth.
August 20, 2014
6
L G Balakrishnan & Bros | Initiating Coverage
Company Background
L G Balakrishnan & Bros Ltd is an India-based company engaged in
manufacturing of chains, sprockets and metal formed parts for automotive
applications. It operates in three segments: Transmission, Metal Forming and
Others. The company's Transmission products include chains, sprockets,
tensioners, belts and brake shoe. The company's Metal Forming products include
fine blanking for precision sheet metal parts, machined components and wire
drawing products for internal use as well as for other chain manufacturing plants,
spring steel suppliers, and umbrella manufacturers. The company's Others
segment includes trading goods. The company’s products are marketed under the
Rolon brand. It has manufacturing units spread across Tamil Nadu, Maharashtra,
Uttrakhand, Karnataka and Delhi.
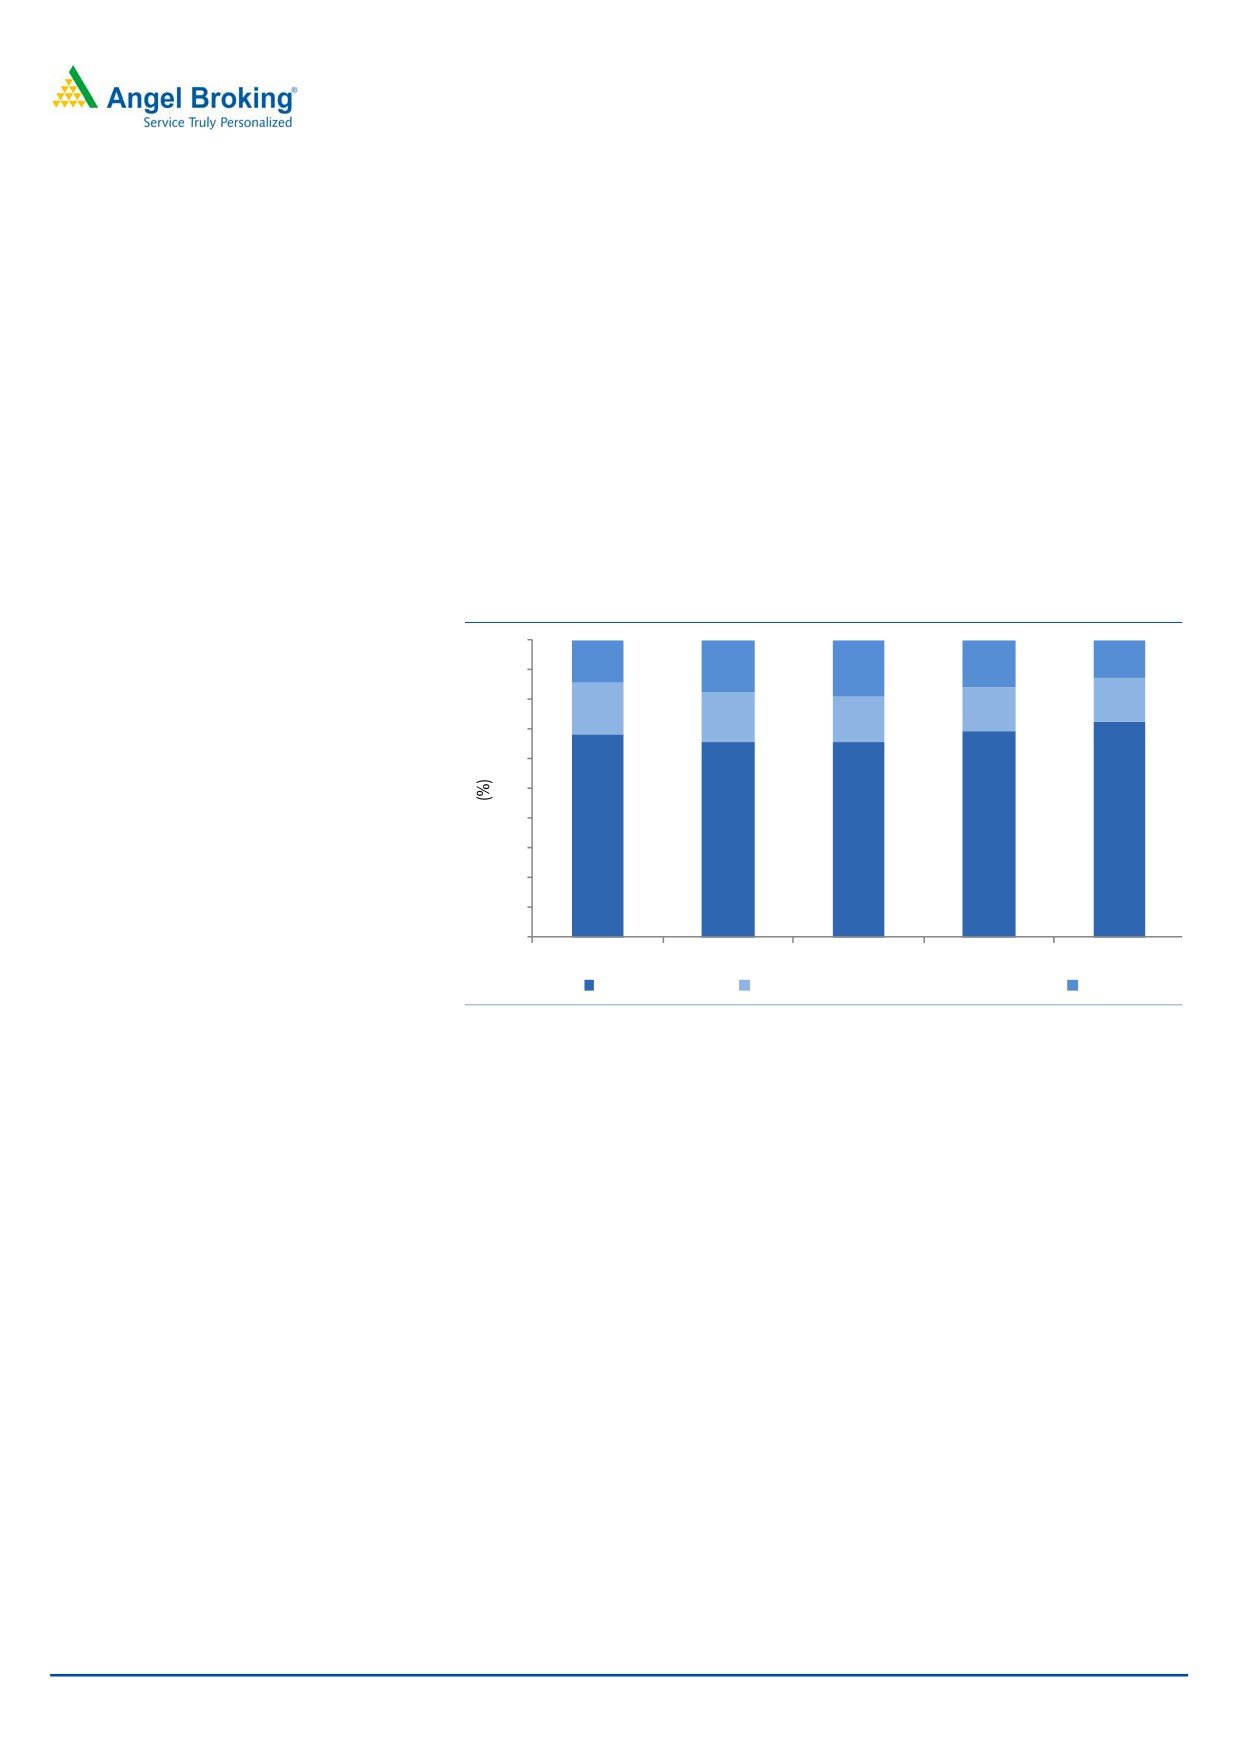
Exhibit 10: Segment wise sales break up
100
14.1
15.8
12.8
90
17.6
19.2
80
14.6
17.3
14.6
16.4
15.0
70
60
50
40
68.6
69.6
72.6
66.0
65.8
30
20
10
0
FY2012
FY2013
FY2014
FY2015E
FY2016E
Transmission
Formed Metal & Assembled Products
Others
Source: Company, Angel Research
August 20, 2014
7
L G Balakrishnan & Bros | Initiating Coverage
Profit & Loss Statement
Y/E March (`)
FY2011
FY2012
FY2013
FY2014
FY2015E
FY2016E
Total operating income
715
913
956
1,109
1,276
1,484
% chg
29.0
27.7
4.8
15.9
15.1
16.4
Total Expenditure
628
809
867
982
1,129
1,314
Cost of Materials
367
484
511
545
630
736
Personnel
66
88
100
134
158
189
Others
194
238
256
303
341
389
EBITDA
87
104
89
126
147
171
% chg
18.5
19.1
(13.8)
41.2
16.3
16.4
(% of Net Sales)
12.2
11.4
9.3
11.4
11.5
11.5
Depreciation& Amortisation
26
29
30
33
40
47
EBIT
61
75
59
93
106
123
% chg
19.0
22.3
(20.6)
57.0
14.0
15.9
(% of Net Sales)
8.6
8.2
6.2
8.4
8.3
8.3
Interest & other Charges
15
18
23
18
18
18
Other Income
2
2
4
5
5
5
(% of PBT)
4.7
2.9
9.5
5.7
5.1
4.5
Share in profit of Associates
-
-
-
-
-
-
Recurring PBT
48
59
40
80
93
110
% chg
32.6
22.5
(31.5)
98.4
16.4
18.2
Prior Period & Extr. Exp./(Inc.)
-
-
-
-
-
-
PBT (reported)
48
59
40
80
93
110
Tax
2
15
8
15
23
28
(% of PBT)
3.8
24.9
19.1
18.6
25.0
25.0
PAT (reported)
46
44
33
65
70
83
Add: Share of earnings of asso.
-
-
-
-
-
-
Less: Minority interest (MI)
-
-
(0)
2
3
4
PAT after MI (reported)
46
44
33
63
67
79
ADJ. PAT
46
44
33
63
67
79
% chg
89.8
(4.5)
(26.0)
91.6
6.7
18.2
(% of Net Sales)
6.5
4.8
3.4
5.7
5.2
5.3
Basic EPS (`)
29.5
28.2
20.8
39.9
42.6
50.4
Fully Diluted EPS (`)
29.5
28.2
20.8
39.9
42.6
50.4
% chg
89.8
(4.5)
(26.0)
91.6
6.7
18.2
August 20, 2014
8
L G Balakrishnan & Bros | Initiating Coverage
Balance Sheet
Y/E March (` cr)
FY2011
FY2012
FY2013
FY2014
FY2015E FY2016E
SOURCES OF FUNDS
Share Capital
8
8
8
8
16
16
Reserves Total
189
225
251
301
351
420
Total Shareholders Funds
197
233
258
309
367
436
Minority Interest
-
-
5
10
10
10
Total Debt
118
138
168
150
150
150
Deferred Tax Liability
19
18
18
17
17
17
Total Liabilities
334
388
450
486
544
613
APPLICATION OF FUNDS :
Gross Block
351
367
428
486
556
636
Less: Acc. Depreciation
160
171
200
231
272
319
Net Block
191
197
228
255
284
317
Capital Work in Progress
4
3
3
9
12
14
Investments
14
14
19
18
22
26
Current Assets
271
341
372
408
454
512
Inventories
154
193
196
208
227
252
Sundry Debtors
84
109
124
146
157
171
Cash and Bank
5
6
10
7
10
14
Loans and Advances
28
33
41
47
57
74
Other Assets
0
0
1
0
1
1
Current liabilities
146
166
172
204
228
257
Net Current Assets
125
175
200
204
225
256
Mis. Exp. not written off
-
-
-
-
-
-
Total Assets
334
388
450
486
544
613
August 20, 2014
9
L G Balakrishnan & Bros | Initiating Coverage
Cashflow Statement
Y/E March (` cr)
FY2011
FY2012
FY2013
FY2014
FY2015E FY2016E
Profit before tax
48
59
40
80
93
110
Depreciation
26
29
30
33
40
47
Change in Working Capital
(9)
(49)
(12)
(15)
(18)
(27)
Interest / Dividend (Net)
15
17
23
18
18
18
Direct taxes paid
3
(17)
(8)
(17)
(23)
(28)
Others
0
(1)
(3)
(3)
0
0
Cash Flow from Operations
82
38
70
96
111
121
(Inc.)/ Dec. in Fixed Assets
(67)
(30)
(58)
(61)
(73)
(82)
(Inc.)/ Dec. in Investments
(4)
-
(5)
0
(4)
(4)
Cash Flow from Investing
(72)
(30)
(63)
(60)
(77)
(86)
Issue of Equity
0
0
6
0
8
0
Inc./(Dec.) in loans
10
20
0
0
0
0
Dividend Paid (Incl. Tax)
(6)
(9)
(15)
(6)
(12)
(13)
Interest / Dividend (Net)
(15)
(18)
7
(33)
(26)
(18)
Cash Flow from Financing
(11)
(8)
(2)
(39)
(30)
(32)
Inc./(Dec.) in Cash
0
1
5
(4)
4
3
Opening Cash balances
5
5
6
10
7
10
Closing Cash balances
5
6
10
7
10
14
August 20, 2014
10
L G Balakrishnan & Bros | Initiating Coverage
Key Ratios
Y/E March
FY2011
FY2012
FY2013
FY2014 FY2015E FY2016E
Valuation Ratio (x)
P/E (on FDEPS)
16.9
17.6
23.8
12.4
11.7
9.9
P/CEPS
10.8
10.7
12.5
8.2
7.3
6.2
P/BV
4.0
3.4
3.0
2.5
2.1
1.8
Dividend yield (%)
0.7
1.0
1.1
0.8
1.2
1.7
EV/Sales
1.2
1.0
1.0
0.8
0.7
0.6
EV/EBITDA
10.1
8.7
10.3
7.2
6.1
5.2
EV / Total Assets
1.8
1.6
1.5
1.3
1.2
1.0
Per Share Data (`)
EPS (Basic)
29.5
28.2
20.8
39.9
42.6
50.4
EPS (fully diluted)
29.5
28.2
20.8
39.9
42.6
50.4
Cash EPS
45.9
46.5
39.9
60.8
68.3
80.6
DPS
3.2
5.0
5.5
3.8
6.0
8.6
Book Value
124.5
146.5
163.0
195.2
232.0
276.1
Returns (%)
ROCE
19.4
20.2
13.9
20.3
20.6
21.0
Angel ROIC (Pre-tax)
20.6
21.3
15.0
21.5
22.0
22.6
ROE
23.5
19.0
12.7
20.3
18.2
18.1
Turnover ratios (x)
Asset Turnover (Gross Block)
2.0
2.5
2.2
2.3
2.3
2.3
Inventory / Sales (days)
79
77
75
68
65
62
Receivables (days)
43
44
47
48
45
42
Payables (days)
54
45
48
49
49
49
WC cycle (ex-cash) (days)
68
76
74
67
61
55
August 20, 2014
11
L G Balakrishnan & Bros | Initiating Coverage
Research Team Tel: 022 - 39357800
DISCLAIMER
This document is solely for the personal information of the recipient, and must not be singularly used as the basis of any investment
decision. Nothing in this document should be construed as investment or financial advice. Each recipient of this document should
make such investigations as they deem necessary to arrive at an independent evaluation of an investment in the securities of the
companies referred to in this document (including the merits and risks involved), and should consult their own advisors to determine
the merits and risks of such an investment.
Angel Broking Pvt. Limited, its affiliates, directors, its proprietary trading and investment businesses may, from time to time, make
investment decisions that are inconsistent with or contradictory to the recommendations expressed herein. The views contained in this
document are those of the analyst, and the company may or may not subscribe to all the views expressed within.
Reports based on technical and derivative analysis center on studying charts of a stock's price movement, outstanding positions and
trading volume, as opposed to focusing on a company's fundamentals and, as such, may not match with a report on a company's
fundamentals.
The information in this document has been printed on the basis of publicly available information, internal data and other reliable
sources believed to be true, but we do not represent that it is accurate or complete and it should not be relied on as such, as this
document is for general guidance only. Angel Broking Pvt. Limited or any of its affiliates/ group companies shall not be in any way
responsible for any loss or damage that may arise to any person from any inadvertent error in the information contained in this report.
Angel Broking Pvt. Limited has not independently verified all the information contained within this document. Accordingly, we cannot
testify, nor make any representation or warranty, express or implied, to the accuracy, contents or data contained within this document.
While Angel Broking Pvt. Limited endeavours to update on a reasonable basis the information discussed in this material, there may be
regulatory, compliance, or other reasons that prevent us from doing so.
This document is being supplied to you solely for your information, and its contents, information or data may not be reproduced,
redistributed or passed on, directly or indirectly.
Angel Broking Pvt. Limited and its affiliates may seek to provide or have engaged in providing corporate finance, investment banking
or other advisory services in a merger or specific transaction to the companies referred to in this report, as on the date of this report or
in the past.
Neither Angel Broking Pvt. Limited, nor its directors, employees or affiliates shall be liable for any loss or damage that may arise from
or in connection with the use of this information.
Note: Please refer to the important `Stock Holding Disclosure' report on the Angel website (Research Section). Also, please refer to the
latest update on respective stocks for the disclosure status in respect of those stocks. Angel Broking Pvt. Limited and its affiliates may
have investment positions in the stocks recommended in this report.
Disclosure of Interest Statement
L G Balakrishnan & Bros
1. Analyst ownership of the stock
No
2. Angel and its Group companies ownership of the stock
No
3. Angel and its Group companies' Directors ownership of the stock
No
4. Broking relationship with company covered
No
Note: We have not considered any Exposure below ` 1 lakh for Angel, its Group companies and Directors
Ratings (Returns):
Buy (> 15%)
Accumulate (5% to 15%)
Neutral (-5 to 5%)
Reduce (-5% to -15%)
Sell (< -15%)
August 20, 2014
12
L G Balakrishnan & Bros | Initiating Coverage
6th Floor, Ackruti Star, Central Road, MIDC, Andheri (E), Mumbai- 400 093. Tel: (022) 39357800
Research Team
Fundamental:
Sarabjit Kour Nangra
VP-Research, Pharmaceutical
Vaibhav Agrawal
VP-Research, Banking
Amarjeet Maurya
Analyst
Denil Savla
Analyst
Shrenik Gujrathi
Analyst
Umesh Matkar
Analyst
Twinkle Gosar
Analyst
Tejas Vahalia
Research Editor
Technicals and Derivatives:
Siddarth Bhamre
Head - Technical & Derivatives
Sameet Chavan
Technical Analyst
Nagesh Arekar
Executive
Sneha Seth
Associate (Derivatives)
Institutional Sales Team:
Mayuresh Joshi
VP - Institutional Sales
Meenakshi Chavan
Dealer
Gaurang Tisani
Dealer
Production Team:
Dilip Patel
Production Incharge
CSO & Registered Office: G-1, Ackruti Trade Centre, Road No. 7, MIDC, Andheri (E), Mumbai - 93. Tel: (022) 3083 7700. Angel Broking Pvt. Ltd: BSE Cash: INB010996539 / BSE F&O: INF010996539, CDSL Regn. No.: IN - DP - CDSL - 234 - 2004, PMS Regn. Code: PM/INP000001546, NSE Cash: INB231279838 /
NSE F&O: INF231279838 / NSE Currency: INE231279838, MCX Stock Exchange Ltd: INE261279838 / Member ID: 10500. Angel Commodities Broking (P) Ltd.: MCX Member ID: 12685 / FMC Regn. No.: MCX / TCM / CORP / 0037 NCDEX: Member ID 00220 / FMC Regn. No.: NCDEX / TCM / CORP / 0302.
August 20, 2014
13