Advisory Desk
March 26, 2012
Jyothy Laboratories
BUY
CMP
`169
Exploring new opportunities with Henkel’s acquisition
Target Price
`248
Jyothy Laboratories Ltd. (JLL), a company having three brands, is set to transform
Investment Period
12 Months
into a multi-brand company with the acquisition of an 83.7% stake in Henkel
India (Henkel), which owns seven brands. As a result of this synergy, we expect
JLL’s consolidated revenue to post a CAGR of 35% to `1,627cr and profit to post
Stock Info
Sector
FMCG
a CAGR of 36% to `166cr over FY2011-14E. We initiate coverage on JLL with a
Market Cap (` cr)
1,360
Buy recommendation and a target price of `248, based on SOTP valuation.
Beta
0.4
Investment rationale
52 Week High / Low
322 / 125
Avg. Daily Volume
27,818
Turnaround of Henkel - A bright future for JLL
Face Value (`)
1
JLL acquired an 83.7% stake in Henkel in August 2011. Management is now
BSE Sensex
17,362
Nifty
5,278
planning various turnaround strategies for Henkel, such as a new management,
Reuters Code
JYOI.BO
revamping of all its brands and shifting its manufacturing to JLL’s units. We expect
Bloomberg Code
SRTY IN
Henkel’s turnaround to result in profit of `19cr in FY2014E.
Jyothy Fabricare Services Ltd. (JFSL) - A long-term growth driver
Shareholding Pattern (%)
We expect JFSL, JLL’s subsidiary engaged in the laundry business, to post a
Promoters
65.2
102.4% CAGR in its revenue to `193cr over FY2012E-14E with an operating
MF / Banks / Indian Fls
17.5
margin of 26.1% in FY2014E. Further, JFSL is expected to reach its breakeven
FII / NRIs / OCBs
12.8
and start yielding profit from FY2013E, registering a profit of `30cr in FY2014E.
Indian Public / Others
4.6
Outlook and valuation
We expect JLL’s consolidated revenue to post a CAGR of 35% to `1,627cr and
Abs.(%)
3m 1yr
3yr
profit to post a CAGR of 36% to `166cr over FY2011-14E. We initiate coverage
Sensex
8.7
(4.4)
82.5
on JLL with a Buy rating view and an SOTP target price of `248.
JLL
7.5
(16.4)
185.2
SOTP valuation
Expected Mcap
Method
Remarks
`/share
(` cr)
JLL
P/E
15.0x FY2014E earnings
1,643
204
Henkel P/E
13.4x FY2014E earning, (for 83.7% stake)
210
26
JFSL
Stake sell
Discounted at 50%, for 75% stake
150
19
Total
248
Source: Company, Angel Research
Key financials (Consolidated)
Y/E March (` cr)
FY2010 FY2011 FY2012E#
FY2013E
FY2014E
Net Sales
640
667
955
1,359
1,627
% chg
66.1
4.3
43.2
42.3
19.7
Adj. Net Profit
74
66
85
112
166
% chg
93.9
(11.6)
28.9
32.3
48.1
OPM (%)
14.4
10.9
8.3
10.3
12.9
EPS (`)
10.3
8.2
10.5
13.9
20.6
P/E (x)
18.3
20.7
16.0
12.1
8.2
P/BV (x)
3.5
2.2
4.8
4.0
2.9
RoE (%)
20.3
12.9
18.5
35.8
41.3
RoCE (%)
0.2
0.1
0.1
0.1
0.2
Tejashwini Kumari
EV/Sales (x)
2.0
1.6
2.1
1.4
1.1
022-39357800 Ext: 6856
EV/EBITDA (x)
13.7
15.1
24.9
13.9
8.7
Source: Company, Angel Research, #FY2012E includes Henkel numbers post August 22, 2011
Please refer to important disclosures at the end of this report
1
Advisory Desk
Jyothy Laboratories | Initiating Coverage
Table of contents
Investment arguments
3
Henkel’s acquisition to expand JLL’s portfolio
3
Combined distribution network to increase penetration level
3
Turnaround of Henkel - A bright future for JLL
3
JFSL - A long-term growth driver
5
Henkel’s acquisition - A perfect synergy
6
Quarterly performance
7
JLL’s performance
7
Henkel’s performance
8
Financials
9
JLL (Standalone)
9
Henkel
11
JFSL
12
Outlook and valuation
13
Peer comparison on various parameters
14
Risk factors
15
Company background
16
JLL
16
Henkel
17
JLL and Henkel - Combined product portfolio
17
Fabric care
17
Dishwashing
18
Mosquito repellent
19
Personal care
19
FMCG industry in India
21
March 26, 2012
2
Advisory Desk
Jyothy Laboratories | Initiating Coverage
Investment arguments
Henkel’s acquisition to expand JLL’s portfolio
The acquisition of Henkel is a major corporate transformation for JLL, which is set
to be positioned as a multi-brand company, owning 10 brands in total - three
brands of its own and seven brands of Henkel. This would provide JLL with
immense opportunities to explore in terms of achieving revenue and cost synergy,
which will result in substantial revenue growth, leading to higher operating margin.
Exhibit 1: Combined product portfolio
Mosquito
Dishwashing
Fabric care
Personal care
repellent
products
JLL
Ujala
Maxo
Exo
Henkel
Henko
Pril
Fa
Mr. White
Neem
Chek
Margo
Source: Company, Angel Research
The expanded product portfolio would provide JLL with a balanced presence in the
rural and urban areas, as JLL’s ratio of rural and urban presence is 75:25 and
that of Henkel is 30:70. The combined portfolio would complement both the
companies, expanding their geographic reach. Moreover, the company will be
able to cater to different income segment customers, as now the products would
span out in all economic segments. Moreover, with brands such as Fa, Neem and
Margo, the company will make a strong entry in the personal care segment.
Combined distribution network to increase penetration level
JLL’s products are available in ~2.9mn outlets in India (as of March 31, 2011).
The company has sales staff of over 1,800, servicing to ~3,500 distributors who
have a reach to ~1mn outlets. JLL has a strong presence in rural areas (according
to AC Nielsen, more than 80% of FMCG categories are growing faster in rural
India as compared to urban India). JLL’s reach, however, is limited when it comes
to the modern retail channel. Henkel, on the other hand, has a strong presence in
the urban market (70% of sales), reaching out to ~0.8mn outlets. This combined
distribution network will complement both the companies, facilitating them to enjoy
a pan-India presence at a low cost. Further, the combined sales force would lead
to increased sales volume, as the companies would be able to sell the existing
products to new customers. We expect JLL to post a consolidated revenue of
`1,627cr in FY2014E, posting a CAGR of 35% over FY2011-14E.
Turnaround of Henkel - A bright future for JLL
The acquisition of Henkel is a strategic step by JLL, which will start yielding
substantial results in the coming years. To achieve this, JLL is following a
turnaround strategy for Henkel. JLL has already shifted its outsourcing
arrangement and the purchase-supply chain of Henkel to JLL’s manufacturing
facilities in Mumbai w.e.f. August 2011. Also, the production of Henkel’s products
(except Henko Detergent Powder) has been started at JLL’s strategically placed
manufacturing plants, which would result in lower manufacturing and logistics
cost. Further, for the distribution, JLL has assigned a special task force to identify
March 26, 2012
3
Advisory Desk
Jyothy Laboratories | Initiating Coverage
the weaker areas of Henkel’s distribution channel, i.e. in the northern and western
regions, and plans to support them w.e.f. April 1, 2012, which would help
Henkel’s products to enjoy a pan-India presence.
Post production, the next big task to be done is to revamp Henkel’s brands. JLL
plans to reposition Henkel’s brands through new packaging and ad campaigns.
For instance, new ad campaigns for Margo (from the coming summer season,
April-May) and Pril (from March end) are on the cards. Also, JLL has removed most
of the freebies with Henkel’s products and plans to reinvest the saved money in
advertisements.
Further, JLL plans for a 15% price hike across all product categories of Henkel, as
management feels that Henkel’s products are currently underpriced compared to
competitors. JLL plans to take this price hike in a phased manner (50% in
4QFY2012 and remaining in 4QFY2013).
JLL also plans to sell Henkel’s Karaikal plant and other unused assets and use the
proceeds to pay off the company’s debt. However, the plan is on hold for now as,
according to the terms of the acquisition, JLL is supposed to keep 75% of Henkel’s
assets intact.
Considering all these factors, we expect Henkel’s turnaround to take place by
2014E, leading to net profit of `19cr in FY2014E.
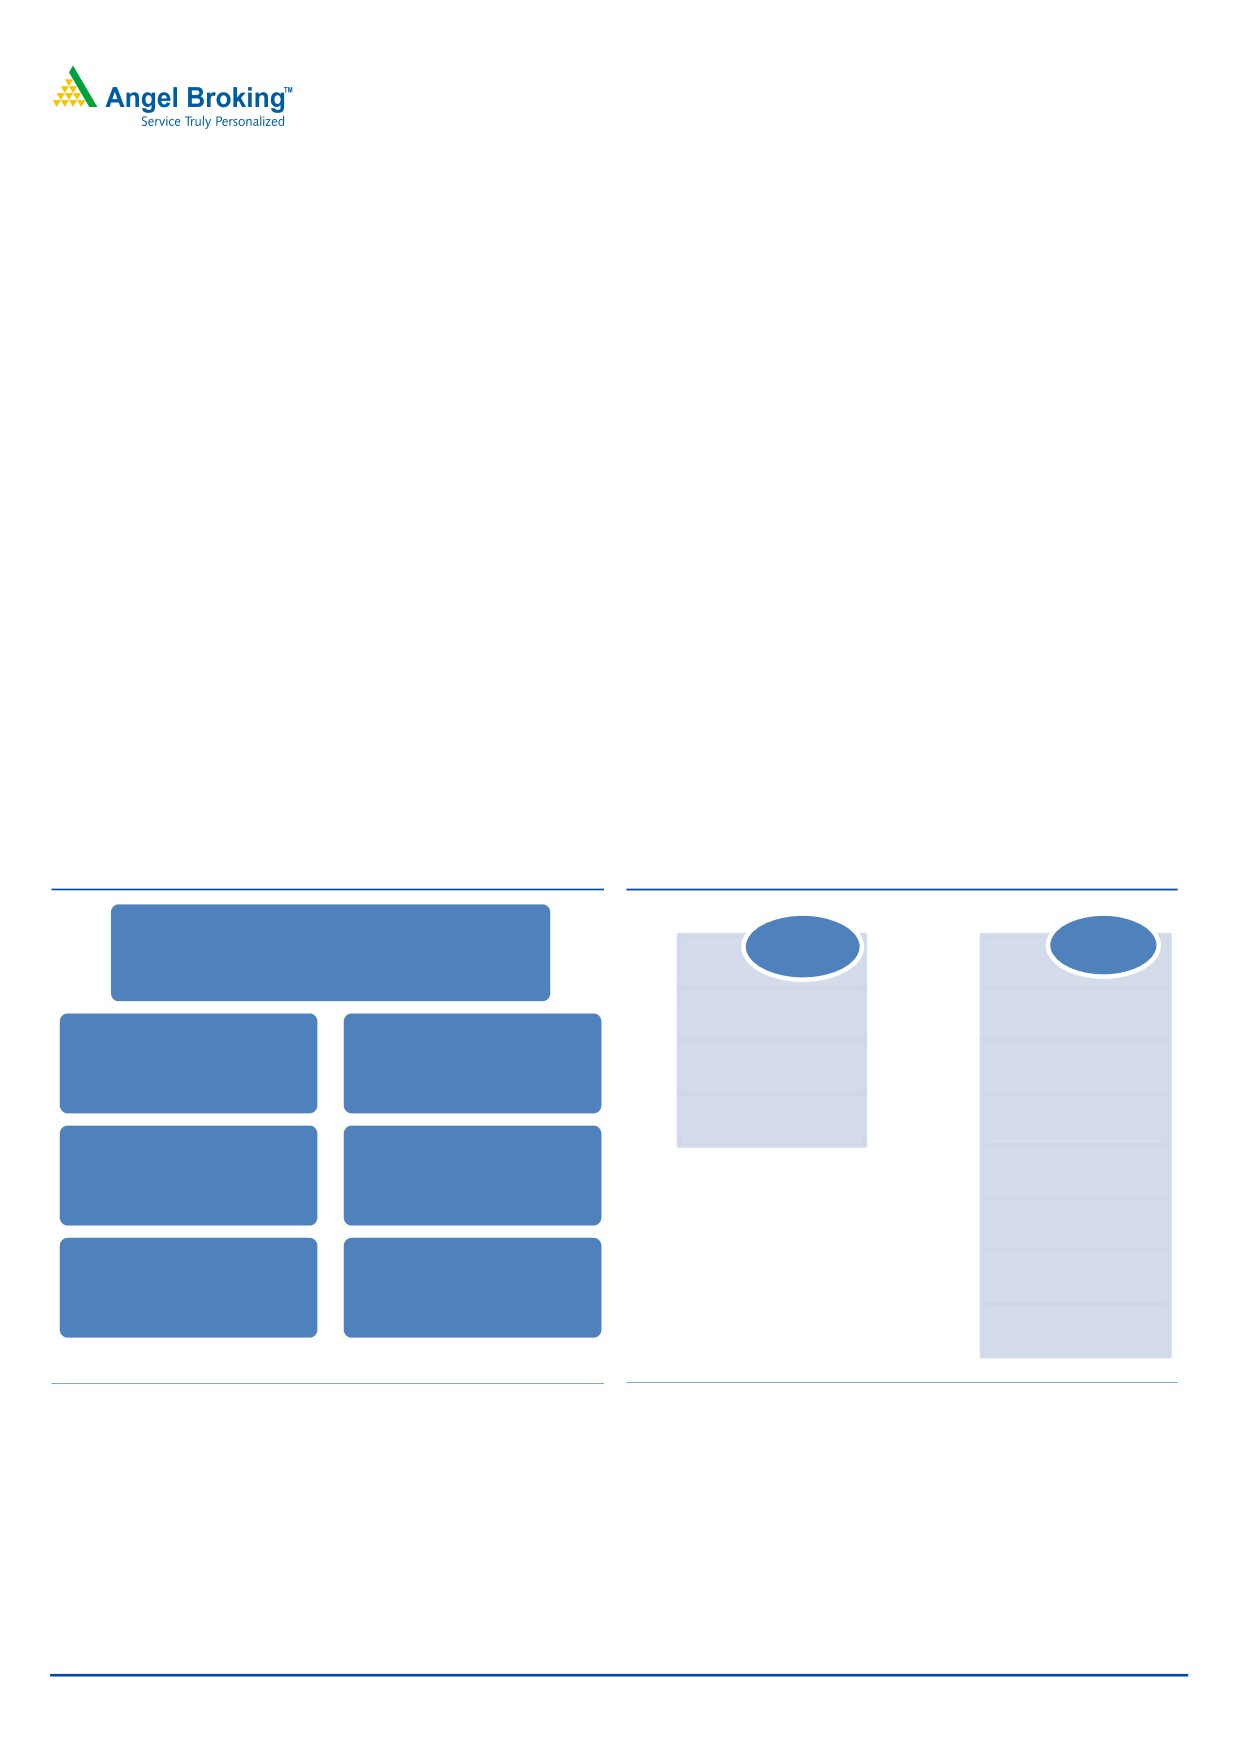
Exhibit 2: Coming together - JLL and Henkel
Exhibit 3: Expected brand size by FY2014E
Revenue: `1,633cr
Henkel
JLL
Profit: `159cr
India
10 brands, Pan India presence
Ujala-`414cr
Henko - `250cr
Revenue: `933cr
Revenue: `676cr
Exo - `219cr
Pril - `142cr
Profit: `103cr
Profit: `19cr
Maxo - `173cr
Margo - `122cr
7 brands
3 brands
Mr.White - `76cr
(Henko, Mr. White, Chek,
(Ujala, Maxo, Exo)
Pril, Fa, Margo, Neem)
Fa - `42cr
Rural : Urban presence
Rural : Urban presence
Chek - `27cr
75:25
30:70
Neem - `17cr
JLL (Standalone)
Henkel
Source: Company, Angel Research, Note: Financials are for FY2014E
Source: Company, Angel Research
March 26, 2012
4
Advisory Desk
Jyothy Laboratories | Initiating Coverage
JFSL - A long-term growth driver
JLL entered a new business of organized laundry in 2009 under the name Jyothy
Fabricare Services Ltd. (JFSL) - JLL’s 75% subsidiary. JFSL has raised `100cr
through private equity funding from IL&FS (IL&FS has already invested `50cr and
rest is to be invested post the setting up of Chennai and Hyderabad plants). As per
the deal value, the valuation of JFSL is estimated to be `400cr.
Currently, JFSL has 113 outlets across India. The company processes 21,000
pieces in the institutional category and 2,500 pieces in the retail category per day
(as of March 31, 2010). JFSL has a key client base of 116, which includes hotels,
airlines, service apartments and health clubs. The company started working with
southwestern railways in December 2009; and in FY2011, the company serviced
15 railways and earned revenue of `0.9cr. Recently, the company bagged a
BOOT (build, own, operate and transfer) contract for 10 years from Western
Railways, Ahmedabad (minimum guaranteed business worth `65cr) and a BOOT
contract for 15 years from Delhi Airport Metro Express (DAME).
Expanding geographically
As a part of the growth strategy, JFSL acquired 100% stake in Delhi-based
Diamond Fabricare (now called Wardrobe) for `16.5cr and 100% stake in
Mumbai-based Akash Cleaners for `19.4cr w.e.f. April 1, 2011.
Exhibit 4: JFSL’s laundry chain
Service Brand
Location
No. of retail outlets
Bangalore
10
Fabricspa
Mumbai
3
Chennai
2
Snoways
Bangalore
28
Wardrobe
Delhi
61
Expert dry cleaners
Bangalore
3
Akash dry cleaners
Mumbai
4
Dhulaai
Pune
2
Total
113
Source: Company, Angel Research
JFSL further plans to expand to Tier I and Tier II cities through the franchisee
channel, where company’s share will be 35% and rest will be of the franchisee.
Presently, the company’s 11% volume comes from retail customers and rest 89%
comes from institutional tie-ups; however, retail contributes to 55% of revenue and
institution contributes the remaining 45%. The company is expecting the volume
mix to change and the contribution from retail to increase considerably, which
would substantially increase its revenue. According to management’s forecast,
JFSL’s revenue is expected to reach `193cr, with operating margin of 26.1% and
profit of `30cr by FY2014E.
March 26, 2012
5
Advisory Desk
Jyothy Laboratories | Initiating Coverage
Henkel’s acquisition - A perfect synergy
JLL acquired a controlling stake of 83.7% in Henkel in August 2011. Henkel has a
strong urban presence, which complements JLL’s strong rural presence and
provides both the companies a tremendous scope for widening their market
coverage.
Exhibit 5: Acquisition details
Seller
% of shares
Value (` cr)
Tamilnadu Petroproducts (TPL )
16.7
68
Henkel AG
51.0
143
Open market
4.0
19
Open offer
12.1
58
Other transaction cost
28
Preference capital
43
Loan repayment
425
Total
83.7
783
Source: Company, Angel Research
Major highlights of the deal
Acquired the global rights for Margo, Chek and Neem
Acquired the trademark for India, Bangladesh and Sri Lanka for Henko and
Mr. White
Acquired the licence for Pril and Fa @2% royalty on net sales for technology
support
Acquired the Karaikal plant (62-acre land) and land at Ambattur and Kolkata
Carried forward loss of `400cr
For the acquisition, JLL has taken NCDs, which were renewed into term loan from
Axis Bank, effective from January 27, 2012. The interest rate will be 11.25%
floating based on RBI’s rate. The company has the advantage of pre-closing the
loan with a 30-day notice to the bank. It is a combination of the term loan with 18
months of moratorium period and repayment over a period of three-and-a-half
years thereafter.
March 26, 2012
6
Advisory Desk
Jyothy Laboratories | Initiating Coverage
Quarterly performance
JLL’s performance
JLL reported 12.0% yoy growth in its revenue and 72.1% yoy growth in its profit to
`167cr and `29cr, respectively, in 3QFY2012.
Exhibit 6: JLL’s quarterly performance of JLL (Standalone)
Y/E March (` cr)
3QFY12 2QFY12
% chg. (qoq)
3QFY11
% chg. (yoy)
9MFY12 9MFY11
% chg
Total operating income
167
155
7.5
148.72
12.0
445
451
(1.3)
Net raw material
87
90
(3.4)
78.40
10.7
240.15
226
6.4
(% of Sales)
52.1
58.0
52.7
54.0
50.1
Employee cost
22
21
6.8
18.64
18.8
62.56
56
10.9
(% of Sales)
13.3
13.4
12.5
14.1
12.5
Other Expenses
29.38
37
(20.0)
33.90
(13.3)
95.14
98
(2.8)
(% of Sales)
17.6
23.7
22.8
21.4
21.7
Total expenditure
138
147
(6.1)
131
5.6
398
380
4.7
Operating profit
28
8
266.9
18
58.9
47
71
(34)
OPM (%)
17.0
5.0
1,199bp
12.0
500
10.5
15.7
(513)bp
Interest
2
2
15.1
0.06
3,716.7
6.04
0
6,611.1
Depreciation
6
4
73.3
3.04
104.6
13.61
9
50.4
Other income
14
15
(3.6)
6.82
109.5
41.21
10
296.6
PBT
34
17
100.9
22
58.3
68
72
(4.8)
(% of Sales)
20.4
10.9
14.5
15.4
15.9
Tax
5
4.45
11.2
4.60
7.6
12.80
14
(8.2)
(% of PBT)
14.5
26.3
21.4
18.7
19.4
Reported PAT
29
12
132.8
17
72.1
56
58
(3.9)
PATM (%)
17.5
8.1
11.4
12.5
12.8
Source: Company, Angel Research
The company’s revenue growth can mainly be attributed to volume growth (10%
for Ujala and 38% for Exo). During the quarter, JLL’s other expenses declined
considerably because of lower advertisement spend. The company has taken a
price hike of 7% across all product portfolios to meet the increase in the
raw-material cost. However, the impact of the price hike was not seen in
3QFY2012 and is expected to be fully visible in the next quarter.
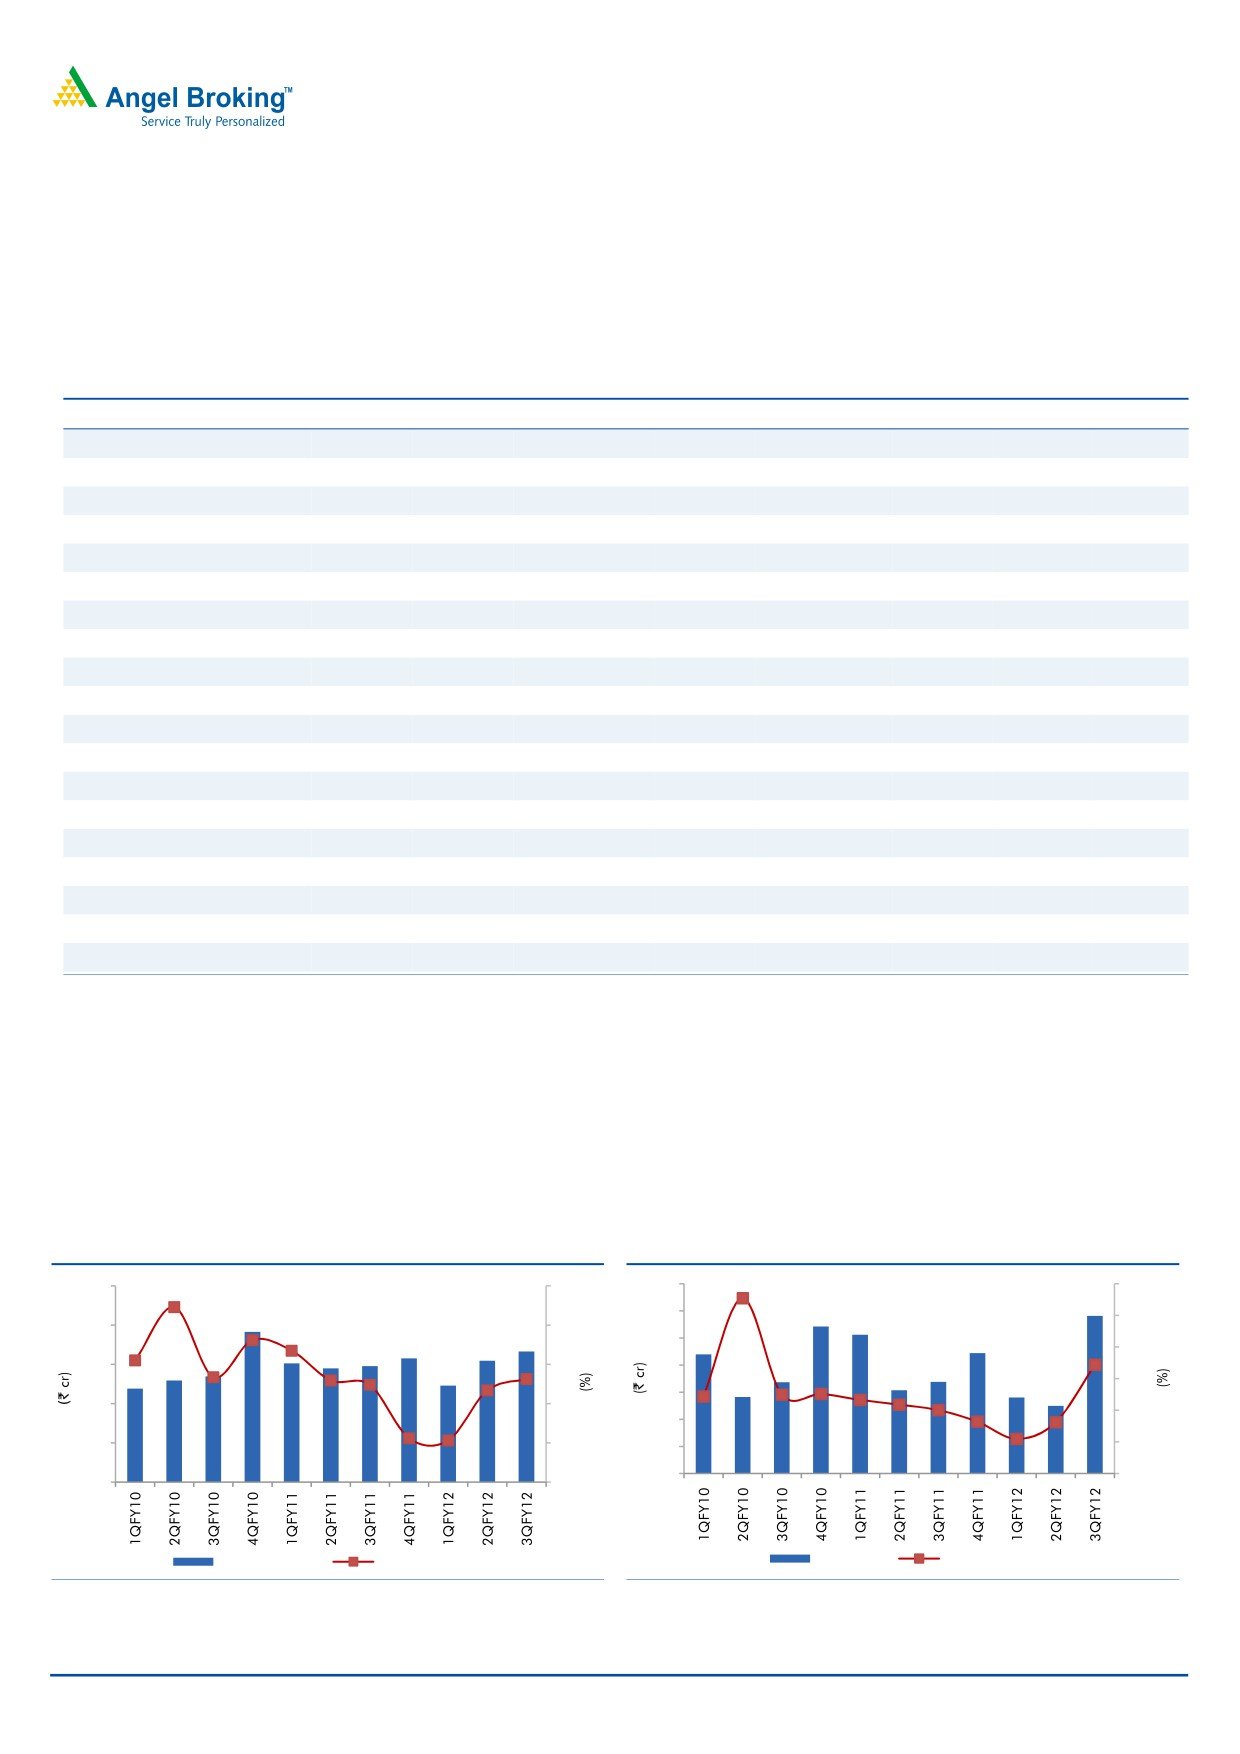
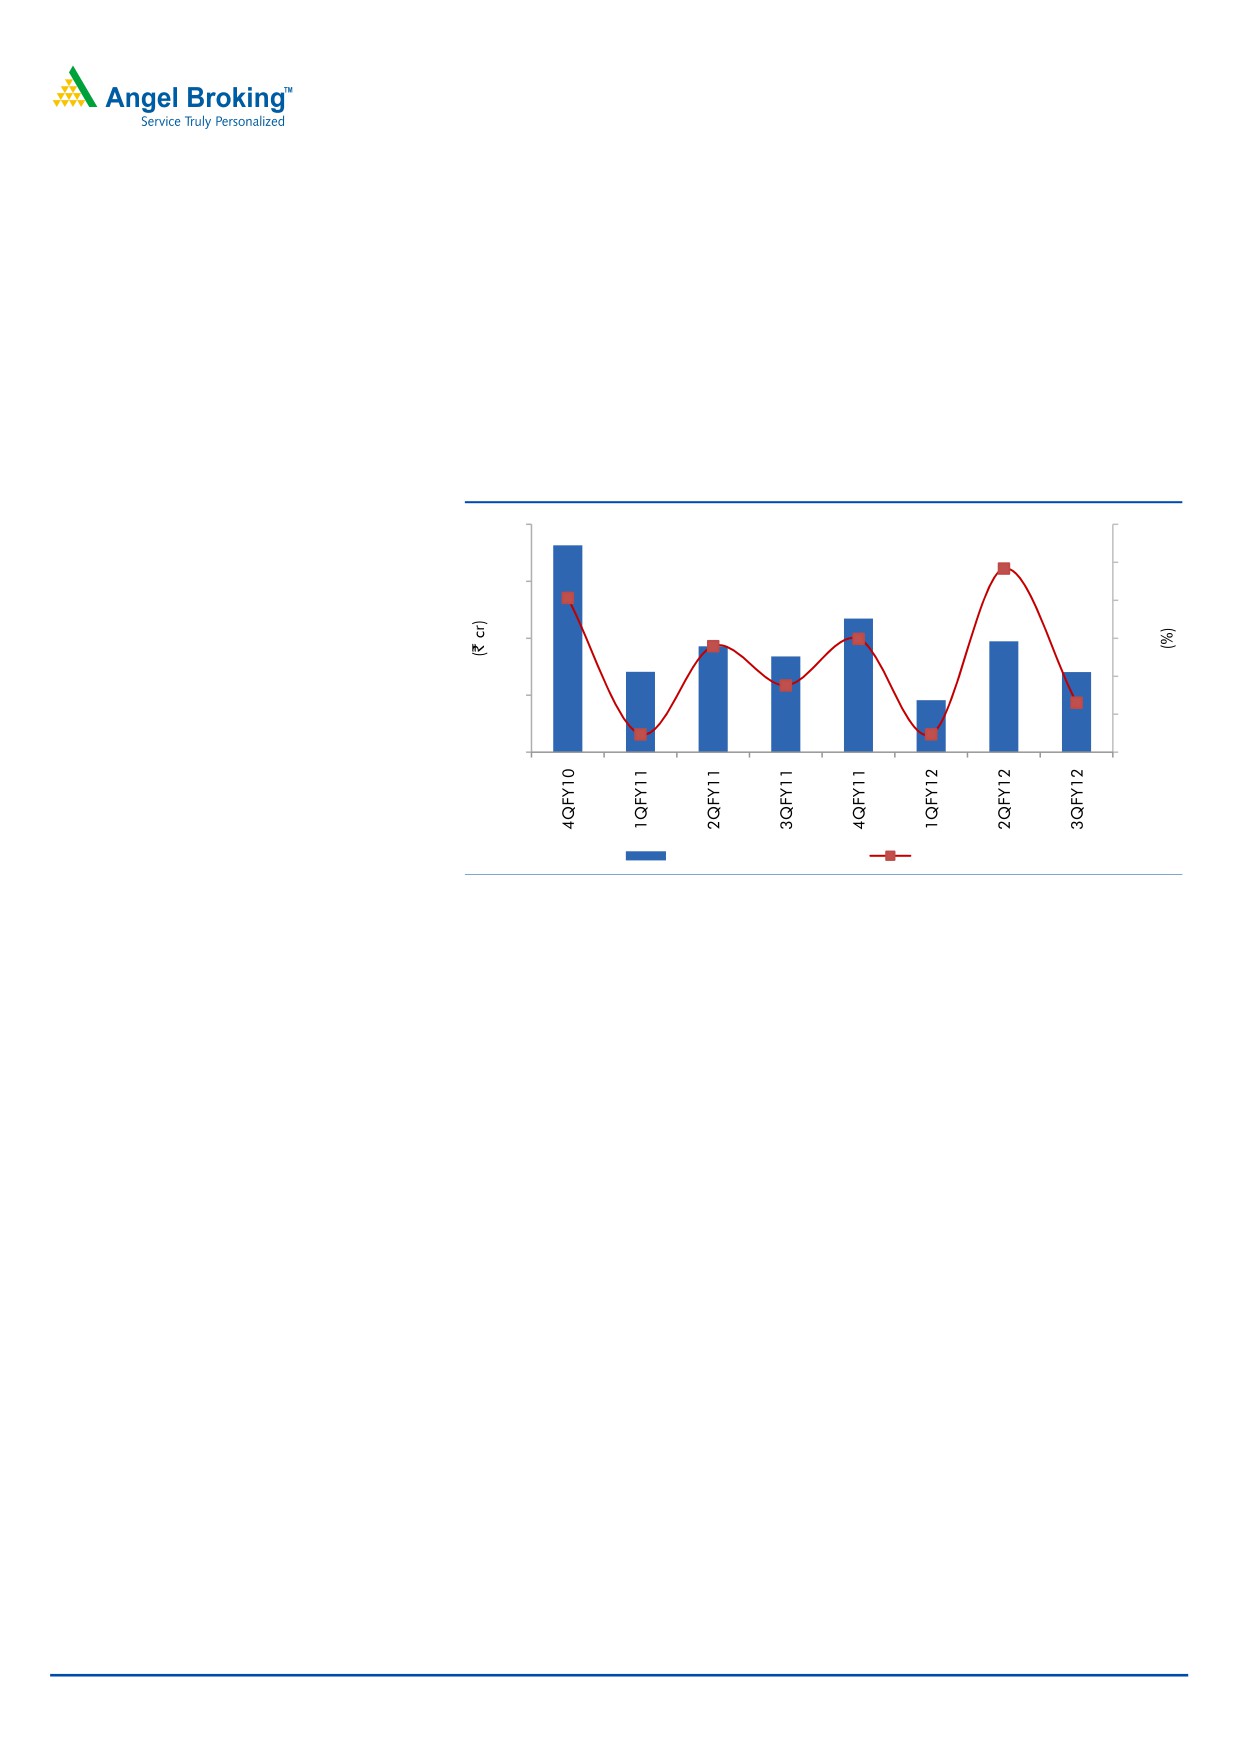
Exhibit 7: Revenue growth coming back on track
Exhibit 8: Earnings following the same trend
250
60
35
200
30
150
200
40
25
100
150
20
20
50
15
100
0
0
10
50
(20)
5
(50)
0
(100)
0
(40)
Revenue (LHS)
yoy growth (RHS)
PAT (LHS)
yoy growth (RHS)
Source: Company, Angel Research
Source: Company, Angel Research
March 26, 2012
7
Advisory Desk
Jyothy Laboratories | Initiating Coverage
Henkel’s performance
Henkel’s performance dipped sharply in 4QCY2011, majorly because of labor
unrest at its Karaikal plant. The company reported a 28.4% qoq and 32.7% yoy
decline in its revenue. This was the sharpest decline in its top line after its
acquisition by JLL. Henkel lost `27cr and `7cr in its top line and EBITDA,
respectively, due to a 62-day shutdown at Karaikal plant (September 26 to
December 26), which manufactures Henko Stain Champion. Consequently, the
company’s EBITDA margin witnessed a dip of 834bp qoq and came in at 3.1%.
The company reported loss of `11cr for the quarter.
Exhibit 9: Henkel’s quarterly performance highlights
Y/E March (` cr)
4QCY11 3QCY11
% chg. (qoq) 4QFY10
% chg. (yoy)
Total operating income
77
107
(28.4)
114
(32.7)
Operating profit
2
12
(80.5)
(6)
(138.3)
OPM (%)
3.1
11.5
(834)
(5.4)
855
Adj. PAT
(11)
(1)
671.0
(11)
(1.1)
Source: Company, Angel Research
March 26, 2012
8
Advisory Desk
Jyothy Laboratories | Initiating Coverage
Financials
JLL (Standalone) - Coming back on growth track
Top line to be driven by increased realization and volume growth
We expect JLL to report a revenue CAGR of 13% over FY2011-14E, from `646cr in
FY2011 to `926cr in FY2014E. Major drivers for the same will be the current 7%
increase in realization YTD and expected volume growth.
Assuming that rural GDP grows at 14.5% and 14.7% yoy (similar to the last
10-year CAGR) in 2013E and 2014E, respectively, we expect the company’s total
sales to post a CAGR of 12.9% over FY2011-14E, as most of the company’s sales
come from rural areas. We expect the home care segment to post a CAGR of 9.0%
to `276cr and the soaps and detergent segment to witness a CAGR of 15.0% to
`587cr over FY2011-14E. We expect volumes of manufactured products to post a
CAGR of 8.4% and 10.4% in the home care and soaps and detergent segments,
respectively, over FY2011-14E.
Exhibit 10: Sales growth
FY2009 (9M) FY2010 FY2011 FY2012E FY2013E FY2014E CAGR*
Rural GDP (at factor cost) growth (%)
16.0
16.0
17.9
14.7
14.5
14.7
14.6
Sales growth for JLL (Standalone) (%)
(5.4)
63.5
4.4
5.9
16.7
16.4
12.9
Home care (%)
5.4
54.2
(9.0)
2.6
11.7
12.9
9.0
Soaps and Detergents (%)
(12.2)
70.7
13.7
7.8
19.3
18.2
15.0
Source: Company, Angel Research, *CAGR over FY2011-14E
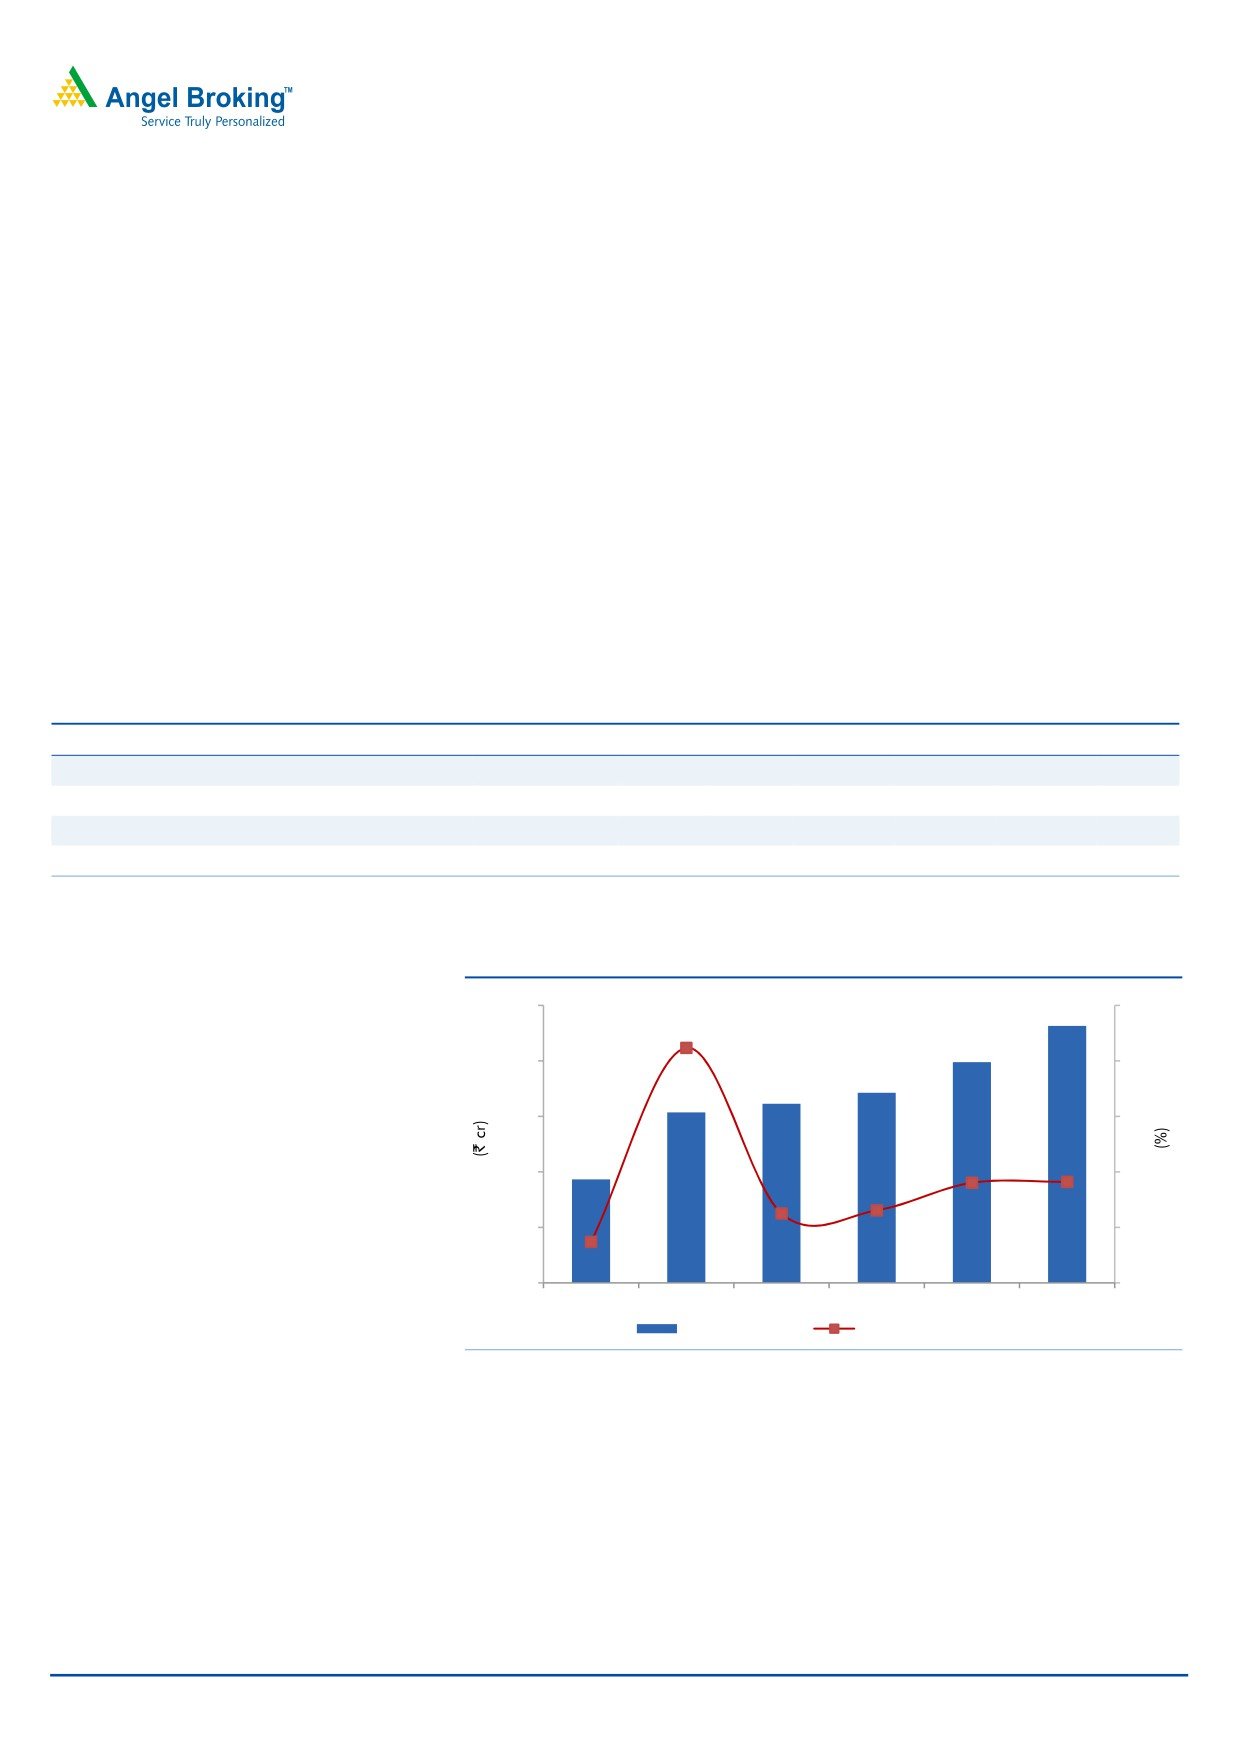
Exhibit 11: Volume growth and increase in realization to drive sales
1000
80
800
60
600
40
400
20
200
0
0
(20)
FY2009*
FY2010
FY2011
FY2012E FY2013E FY2014E
Revenue (LHS)
Revenue growth (RHS)
Source: Company, Angel Research, *FY2009 is for 9 months
Stabilizing costs will lead to margin expansion
JLL witnessed margin pressure in FY2011 due to lower top-line growth and
increased expenditure. We further expect the company’s margin to contract by
159bp to 10.7% in FY2012E, as its employee cost and advertisement cost have
increased. However, we expect the company’s margin to improve thereafter by
124bp to 15.2% over FY2011-13E, as net raw-material cost as a percentage of
net sales is expected to decline to 44.3% and other costs are likely to stabilize.
March 26, 2012
9
Advisory Desk
Jyothy Laboratories | Initiating Coverage
Exhibit 12: Decline in raw-material cost to improve operating margin…
160
18
140
16
14
120
12
100
10
80
8
60
6
40
4
20
2
0
0
FY2009*
FY2010
FY2011
FY2012E FY2013E FY2014E
EBITDA (LHS)
EBITDA Margin (RHS)
Source: Company, Angel Research, *FY2009 is for 9 months
Interest cost to be offset by other income
We expect JLL’s interest cost to rise to `50cr in FY2013E and `39cr in FY2014E, as
loans on books has increased. JLL has taken a term loan of `550cr from Axis Bank
at a rate of 11.25% w.e.f. January 27, 2012. However, JLL has given a loan of
`431cr from this amount to Henkel, for which it would receive interest income at a
rate of 11.5%. With this, there will be a rise in JLL’s other income as well, from
`28cr in FY2011 to `77cr in FY2014E. Further, we expect that JLL will be paying
off `135cr and `100cr debt in FY2013E and FY2014E respectively with the cash
generated through operations, leading to a decrease in its interest cost. Further,
the company would report higher tax from FY2014E at `49cr, as few of JLL’s fully
tax-exempted units will be losing their 100% tax benefit post FY2013E. However,
JLL plans to do the merger (JLL-Henkel) in FY2014E; if that happens, JLL will
further enjoy the tax shield due to the carried forward losses of Henkel.
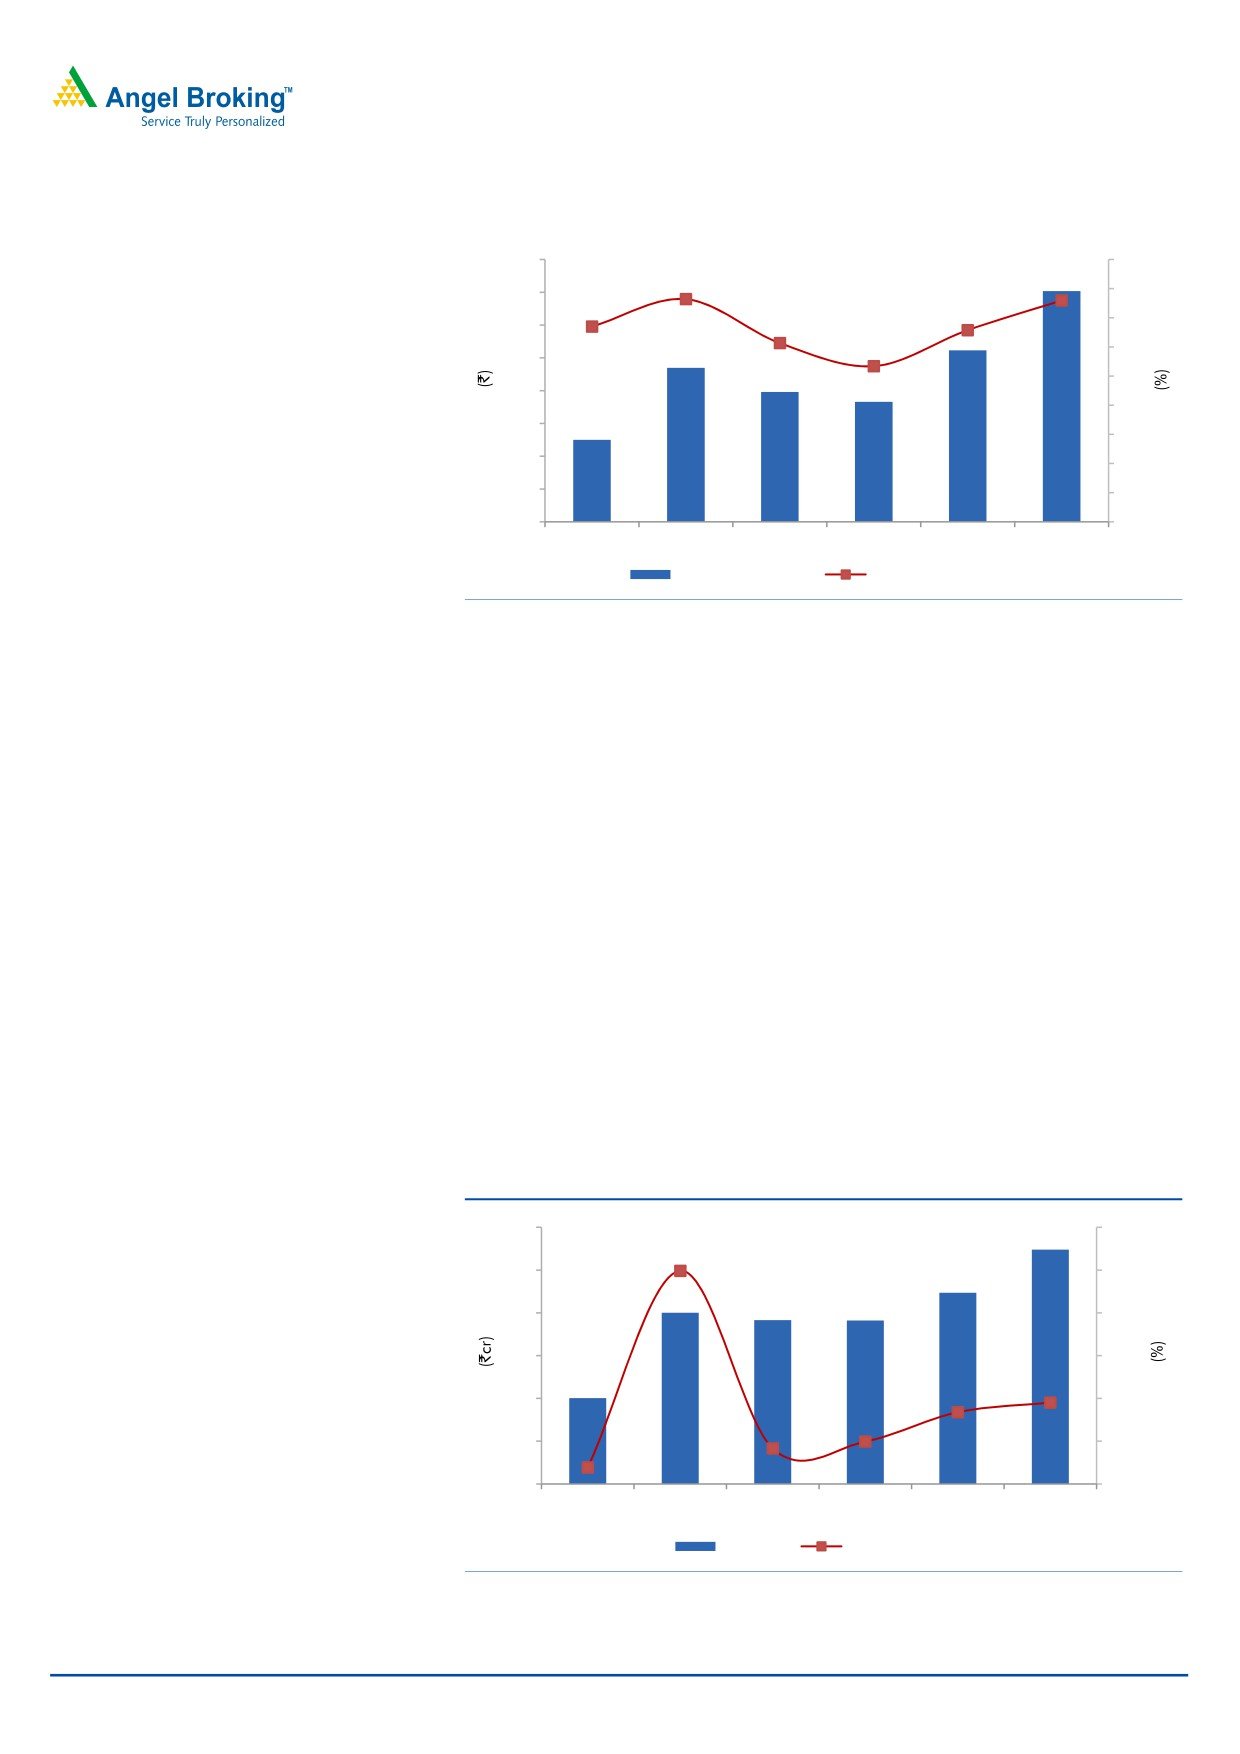
On account of increasing revenue and expanding operating margin, we expect
JLL’s profit to post a CAGR of 13% over FY2011-14E, from `76cr in FY2011 to
`110cr in FY2014E.
Exhibit 13: … leading to growth on the earnings front
120
125
100
100
80
75
60
50
40
25
20
0
0
(25)
FY2009*
FY2010
FY2011
FY2012E FY2013E FY2014E
PAT (LHS)
PAT growth (RHS)
Source: Company, Angel Research, *FY2009 is for 9 months
March 26, 2012
10
Advisory Desk
Jyothy Laboratories | Initiating Coverage
Henkel - Turnaround on cards
Henkel’s financials are set for a turnaround post the acquisition. We have assumed
that this year Henkel will be reporting financials for 15 months for FY2012E. A
hike of 15% in realization is expected across all segments of Henkel. Post the
acquisition, Henkel’s business is bound to be revamped, given the repositioning of
brands, price hike, change in distribution channel and reduction in total
expenditure as a percentage of net sales.
We expect the company’s revenue to post a CAGR of 8% by FY2014E (over
CY2010-FY2014E), majorly on the back of the expected 15% price hike supported
by volume growth, as JLL is set to rebrand and reposition Henkel’s brands.
Accordingly, we expect the company’s operating margin to expand by 1,544bp to
11.3% in FY2014E. Henkel’s interest cost is as high as `61cr on the loan of `531cr
at a rate of 11.5%. However, being a loss-making company, Henkel enjoys tax
shield. We expect the company to turnaround and register a profit of `19cr in
FY2014E.
Exhibit 14: Key financials of Henkel
Y/E March (` cr)
CY2009 CY2010 FY2012E* FY2013E FY2014E
Net sales
592
534
552
541
676
% chg
9.7
(9.9)
3.4
(2.0)
25.0
Adj. net profit
(32)
(55)
(39)
(22)
19
% chg
(50.1)
69.1
(28.7)
43.3
184.7
OPM (%)
(6.0)
(4.2)
3.1
7.7
11.3
EPS (`)
(2.8)
(4.7)
(3.3)
(1.9)
1.6
P/E (x)
(9.1)
(5.4)
(7.5)
(13.3)
15.7
P/BV (x)
(2.7)
(1.8)
(1.7)
(1.5)
(1.6)
RoE (%)
40.5
40.3
23.1
11.8
9.9
RoCE (%)
(0.2)
(0.1)
0.0
0.1
0.2
EV/Sales (x)
1.1
1.4
1.3
1.4
1.1
EV/EBITDA (x)
(19.0)
(33.5)
42.9
18.0
9.5
Source: Company, Angel Research, *FY2012 is for 15 months
March 26, 2012
11
Advisory Desk
Jyothy Laboratories | Initiating Coverage
JFSL - Breakeven in FY2013E
As per management, JFSL is expected to post a revenue CAGR of 102.4% to
`193cr over FY2012E-14E. In addition, the company’s operating margin is
expected to improve substantially by 2,048bp to 26.1% in FY2014E. Further, JFSL
is expected to reach its breakeven and start yielding profit from FY2013E,
registering profit of `30cr in FY2014E.
Exhibit 15: JFSL's growth projection
FY2012E
FY2013E
FY2014E
Service income
47
100
193
Washing expense
20
38
70
% of service income
41.6
38.1
36.3
Manpower cost
11
20
29
% of service income
23.4
19.8
15.2
Rent
5
12
16
% of service income
11.6
11.8
8.1
Other overheads
8
16
28
% of service income
17.9
16.3
14.4
Total Expenditure
44
86
142
% of service income
94.4
86.1
73.9
EBITDA
2.6
13.9
50.2
EBITDA margin
5.6
13.9
26.1
Interest and Depreciation
5
8
10
% of service income
10.3
7.6
5.2
PBT
(2)
6
40
Tax
-
-
11
% of PBT
-
-
26.7
PAT
(2)
6
30
Source: Company's corporate presentation, Angel Research
March 26, 2012
12
Advisory Desk
Jyothy Laboratories | Initiating Coverage
Outlook and valuation
The synergy of JLL and Henkel is expected to result in substantial growth in revenue
and operating margin. On a consolidated basis, we expect JLL’s revenue to post a
35% CAGR over FY2011-14E to `1,627cr. With stabilizing costs after business
consolidation, JLL’s operating margin is likely to improve by 119bp to 12.9% and
its consolidated profit is expected to post a 36% CAGR to `166cr.
We have valued JLL (consolidated) on SOTP basis. JLL (standalone) is valued at a
target PE of 15x for FY2014E at a price of `204/share; the newly acquired
subsidiary, Henkel, has been valued at PE of 13.4x for FY2014E at a price of
`26/share for 83.7% stake; and JSFL has been valued by stake sell method,
discounted at 50% for 75% stake at a price of `19/share. Currently, at `169, JLL
(standalone) is trading at PE of 12.4x for FY2014E, at a discount of 31.1% to its
three-year median.
We initiate coverage on JLL with a Buy recommendation and a target price of
`248, based on SOTP valuation.
Exhibit 16: SOTP valuation of JLL
JLL (Standalone)
Mcap (in ` cr)
1,360
Net worth (2014E) (` cr)
788
PAT (2014E) (` cr)
110
Current PE (x)
12.4
Target PE (x)
15.0
Expected value (` cr)
1,643
Outstanding shares (in cr)
8.1
Expected price/ share (`) (A)
204
Henkel (Consolidated)
Mcap (in ` cr)
293
Net worth (2014E) (` cr)
(180)
PAT (2014E) (` cr)
19
Current PE (x)
15.7
Target PE (x)
13.4
Expected value (in ` cr) (for 83.7% stake)
210
Outstanding shares (cr)
8.1
Expected price/ share (`) (B)
26
JSFL
Total EV (in ` cr) (including debt of `60cr)
400
EV (Discounting at 50%) (in `cr)
200
Value for JLL's 75% stake in JFSL (in `cr)
150
Outstanding shares (in cr)
8.1
Expected price/ share (`) (C)
19
Target price (`) (A+B+C)
248
Source: Company, Angel Research
March 26, 2012
13
Advisory Desk
Jyothy Laboratories | Initiating Coverage
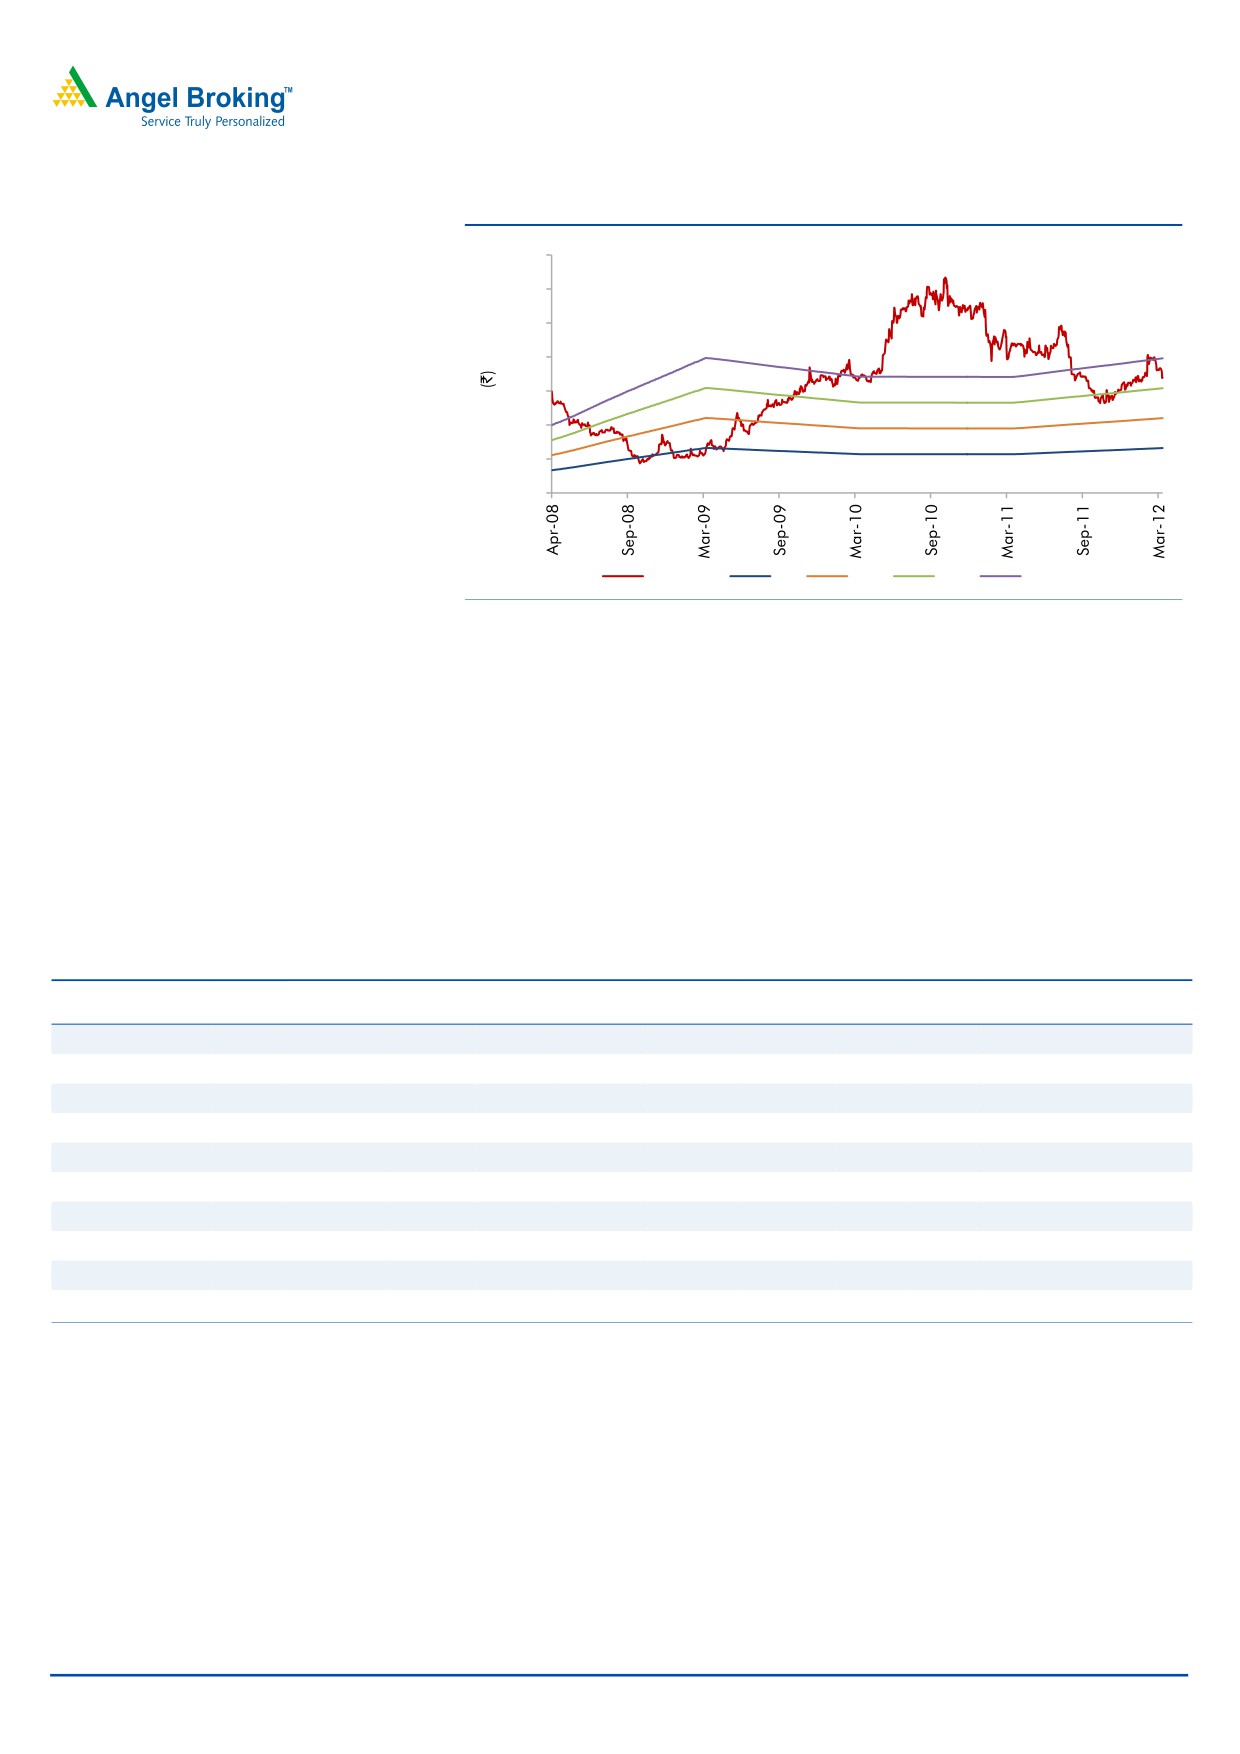
Exhibit 17: JLL's one-year forward PE band
350
300
250
200
150
100
50
0
Price (`)
6x
10x
14x
18x
Source: Company, Angel Research
Peer comparison on various parameters
On FY2013E basis, JLL (consolidated) is trading at PE of 12.1x, which looks
attractive vis-à-vis its peers. The company’s EPS stands at `13.9 for FY2013E,
which is higher than its peers - Marico and Dabur. Further, JLL’s ROE stands at
35.8%, which is higher than Marico and Emami; and we expect JLL’s ROE to
increase to 41.3% in FY2014E. The company is currently going through a
transition phase and is set for a turnaround in the coming years on a consolidated
basis.
Exhibit 18: Attractively valued as compared to peers
Mcap
Sales
OPM
PAT
EPS
RoE
P/E
P/BV
EV/Sales
EV/
Company
Year end
(` cr)
(` cr)
(%)
(` cr)
(`)
(%)
(x)
(x)
(x)
EBITDA (x)
JLL - Standalone
FY2012E
1360
685
10.7
76
9.5
11.5
17.8
2.0
2.1
19.4
FY2013E
1360
796
13.2
89
11.1
12.7
15.2
1.9
1.7
13.1
JLL - Consolidated FY2012E
1360
955
8.3
85
10.5
18.5
16.0
4.8
2.1
24.9
FY2013E
1360
1359
10.3
112
13.9
35.8
12.1
4.0
1.4
13.9
Emami*
FY2012E
5992
1500
19.5
264
17.5
34.6
22.7
7.1
4.0
20.6
FY2013E
5992
1778
19.9
315
20.8
34.4
19.0
5.8
3.4
17.1
Marico
FY2013E
10131
3779
12.7
305
5.0
25.6
33.2
8.5
2.7
21.4
FY2012E
10131
4341
13.3
390
6.3
25.9
26.0
6.7
2.3
17.2
Dabur
FY2013E
18484
5179
17.8
666
3.8
39.2
27.8
10.9
3.6
20.3
FY2012E
18484
5919
18.4
795
4.6
42.4
23.2
9.9
3.1
16.6
Source: Company, Angel Research, * Bloomberg estimates
March 26, 2012
14
Advisory Desk
Jyothy Laboratories | Initiating Coverage
Risk factors
Business integration
Going forward, the major concern for JLL is the risk associated with the integration
of Henkel. JLL and Henkel are in the process of a consolidation - the companies
are combining their manufacturing and distribution processes and JLL is set to
revive most of Henkel’s brands with proper positioning. If things go haywire, JLL’s
growth could face a serious risk.
Raw-material cost
The company’s key raw materials include HDPE, acid slurry, synthetic organic dye,
Koylene, LABSA (sulphuric acid), Sumi 1 and Transfluthrin (insecticide) and brown
sawdust.
HDPE, which constitutes the largest raw-material expenditure, is a derivative of
crude oil and is exposed to great price fluctuation. Currently, the company has
only two suppliers for HDPE. For Transfluthrin, there is only one supplier in India;
however, one Chinese player is expected to enter the market soon, providing the
raw material at a much lower price. Until then, the company is completely
dependent on the limited supplier in the market, which restricts the company’s
bargaining power. Further, JLL does not have any long-term supply contracts with
its suppliers. Hence, any further hike in raw-material cost or any disruption in
raw-material inflow may pose a risk to the company’s business.
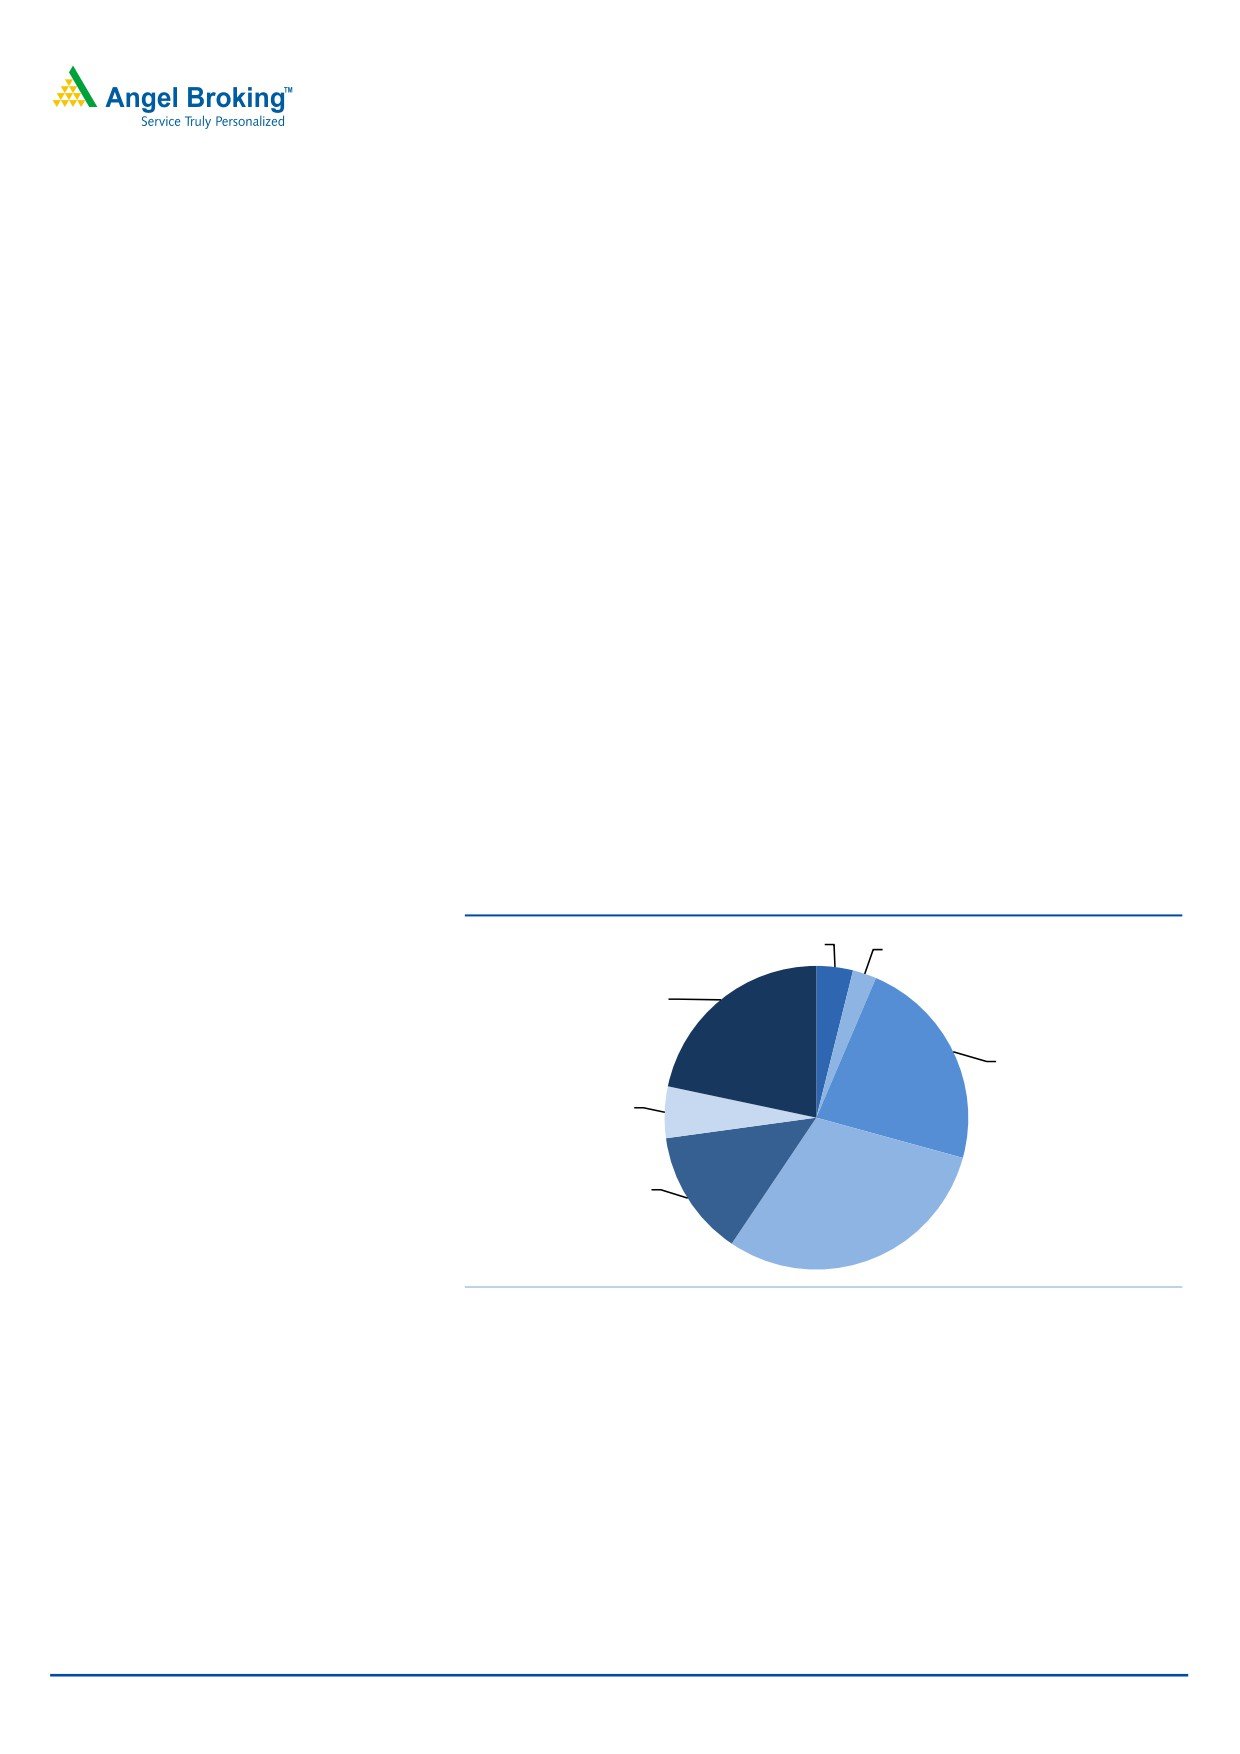
Exhibit 19: Raw material break-up
Synthetic Dye
Soap Noodles
4%
3%
Packaging
material
22%
Dyes &
Chemicals
23%
Others
5%
Plastic
Fatty Oils,
13%
Powder and
Perfumes
30%
Source: Company, Angel Research
March 26, 2012
15
Advisory Desk
Jyothy Laboratories | Initiating Coverage
Company background
JLL
JLL is an FMGC company present in the fabric care (Ujala), household insecticide
(Maxo), surface cleaning (Exo), personal care (Jeeva) and air care segments
(Maya). The company was started in 1983 as a single-brand company, with Ujala
Fabric Whitener as its flagship product. However, over time, JLL has grown by
diversifying itself, both in terms of its product portfolio and market size across
India.
JLL’s manufacturing units are strategically present across India to maintain a lower
logistics cost. The company has 28 manufacturing facilities in 16 locations across
India, of which some are tax-efficient units. JLL’s products are available in ~2.9mn
outlets in India (as of March 31, 2011). The company has sales staff of over
1,800, servicing ~3,500 distributors.
JLL also operates in the laundry business under the name of JFSL, which has
become India’s largest laundry chain with 113 retail outlets in Bangalore, Delhi,
Mumbai, Pune and Chennai. Further, JFSL’s Hyderabad outlet is expected to be
operational by March 31, 2012.
Exhibit 20: Product portfolio
Market Share
Brand
Positioning
Brand Extension
Outlook
for Dec'11 (%)
Value Volume
Ujala
Liquid fabric whitener that does
73.6
60.1 • Washing powder launched in 2003 in
Focused in Southern India only
(Launched in
not leave clothes blue or patchy
Kerala and in other southern regions in
1983)
2009
•
Ujala Stiff and Shine launched in 2005
in Kerala and nationwide in 2008
Maxo
Mosquito repellant offering
19.8
22 • Liquids/Aerosols
Advanced version of the liquid
(Launched in
’corner-to-corner‘ protection
•
DEPA products for outdoor application
to be launched in 4QFY2012
2000)
Exo
Anti-bacterial dish wash
26.3
23.8 • Dishwashing liquid - Exo Liquid /Exo Gel National rollout
(Launched in
•
Dishwashing scrubber - Exo Safai
2000)
Source: Company, Angel Research
March 26, 2012
16
Advisory Desk
Jyothy Laboratories | Initiating Coverage
Henkel
Headquartered at Chennai, Henkel was established in 1987 as a subsidiary of
Henkel AG & Co. KGaA, Germany. The company is engaged in the business of
laundry, home care, cosmetics, toiletries and hair care. The company comprises
brands such as Pril, Henko, Fa, Mr. White, Chek, Margo and Neem. In August
2011, JLL acquired an 83.7% stake in Henkel.
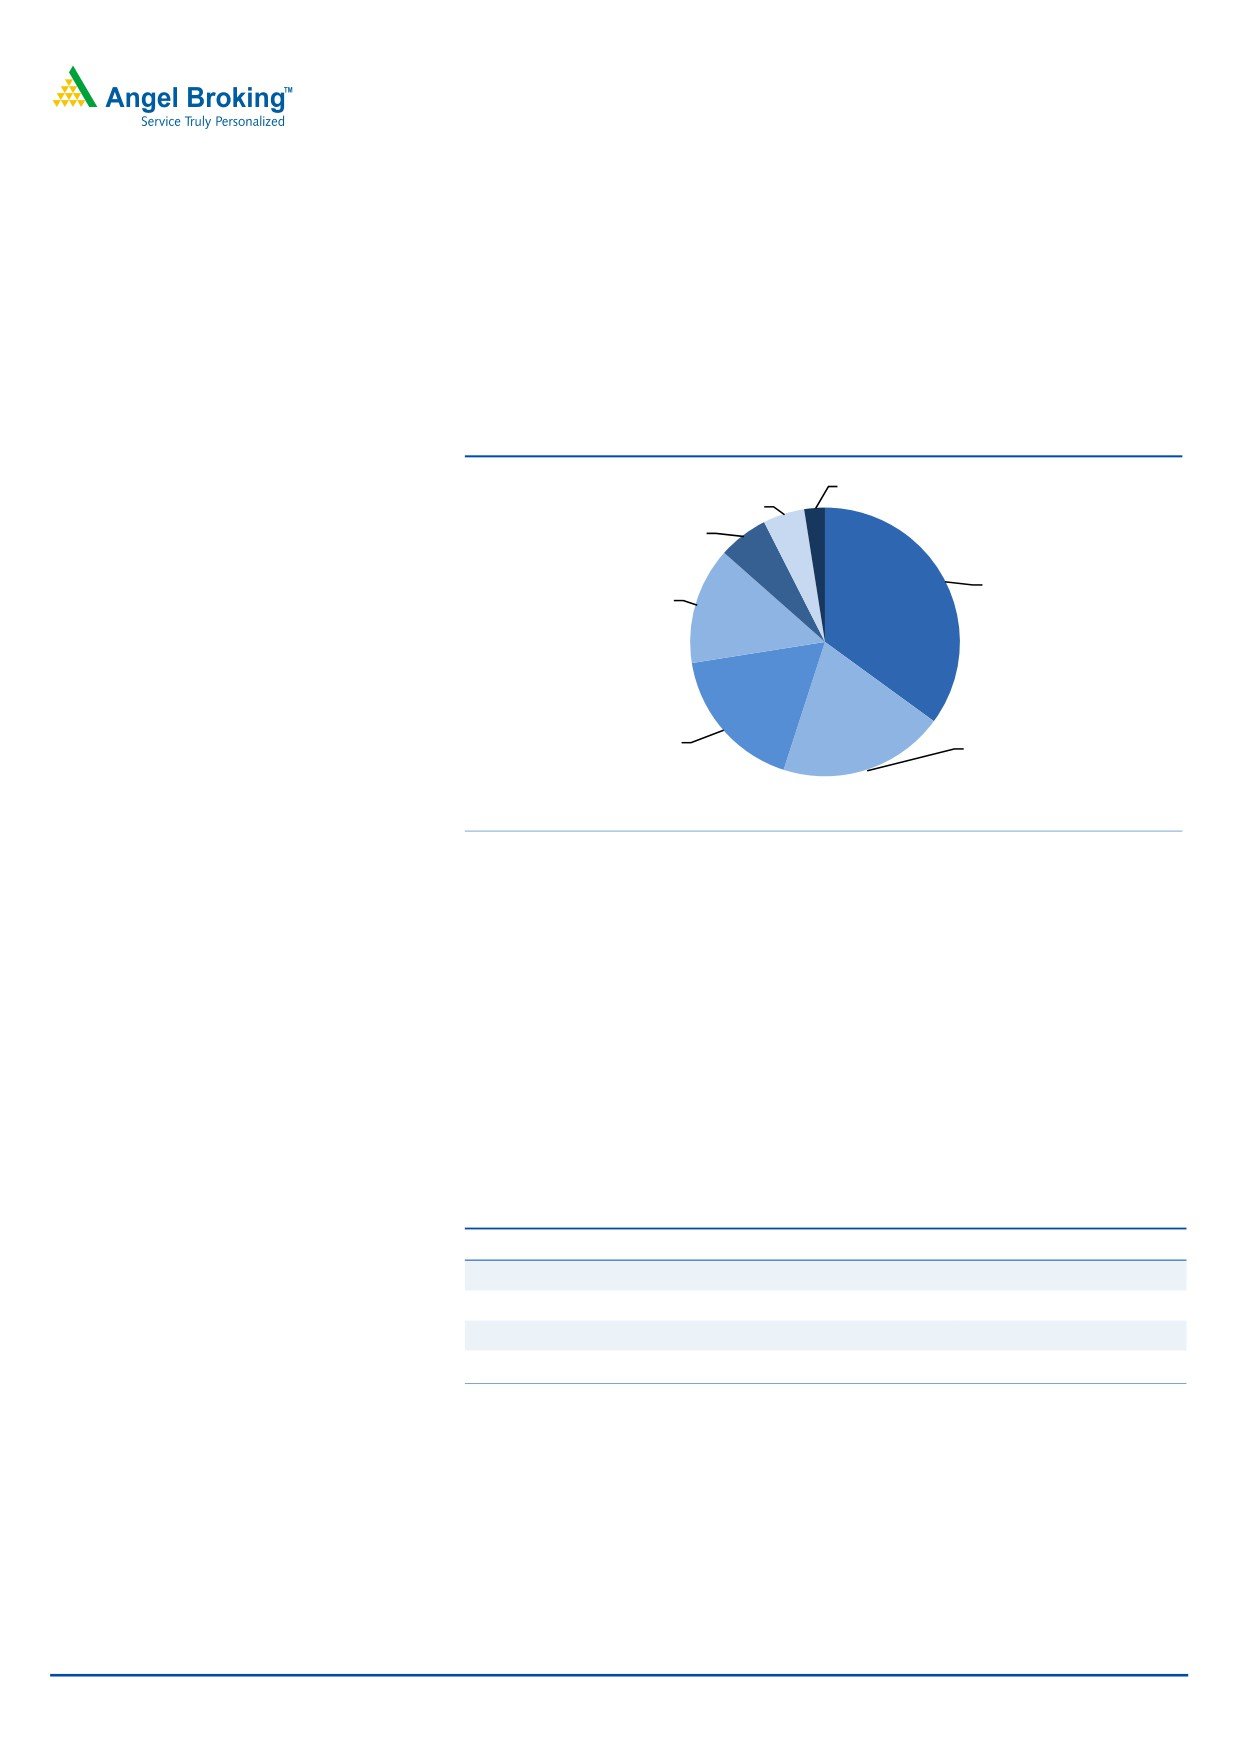
Exhibit 21: Revenue contribution - Product wise
Chek
Neem
5%
3%
Fa
6%
Henko Champion
Mr. White
35%
14%
Pril
Margo
17%
20%
Source: Company
JLL and Henkel - Combined product portfolio
Fabric care
Under the fabric care segment, JLL has Ujala Supreme, Ujala washing powder, Stiff
and Shine and Ujala Techno Bright. This segment is the core segment for JLL and
contributed 54% to its FY2011 revenue. JLL’s product range in the segment mainly
caters to the mass segment, majorly in South India. JLL plans to keep the sales of
Ujala detergent limited to southern India only and rollout and reposition Henkel
detergent in other parts of India to avoid any cannibalization. With this, the
company will be able to cater to other economic segments as well.
Exhibit 22: Combined portfolio of the fabric care segment
Segment
JLL
Henkel
Value
-
Check
Mid-premium
Ujala, Ujala Whitener
Mr. White. Mr. White bleach
Premium
Technobright
Henko Champion
Niche
Technobright Matic, Ujala Stiff & Shine
Henko Matic
Source: Company, Angel Research
March 26, 2012
17
Advisory Desk
Jyothy Laboratories | Initiating Coverage
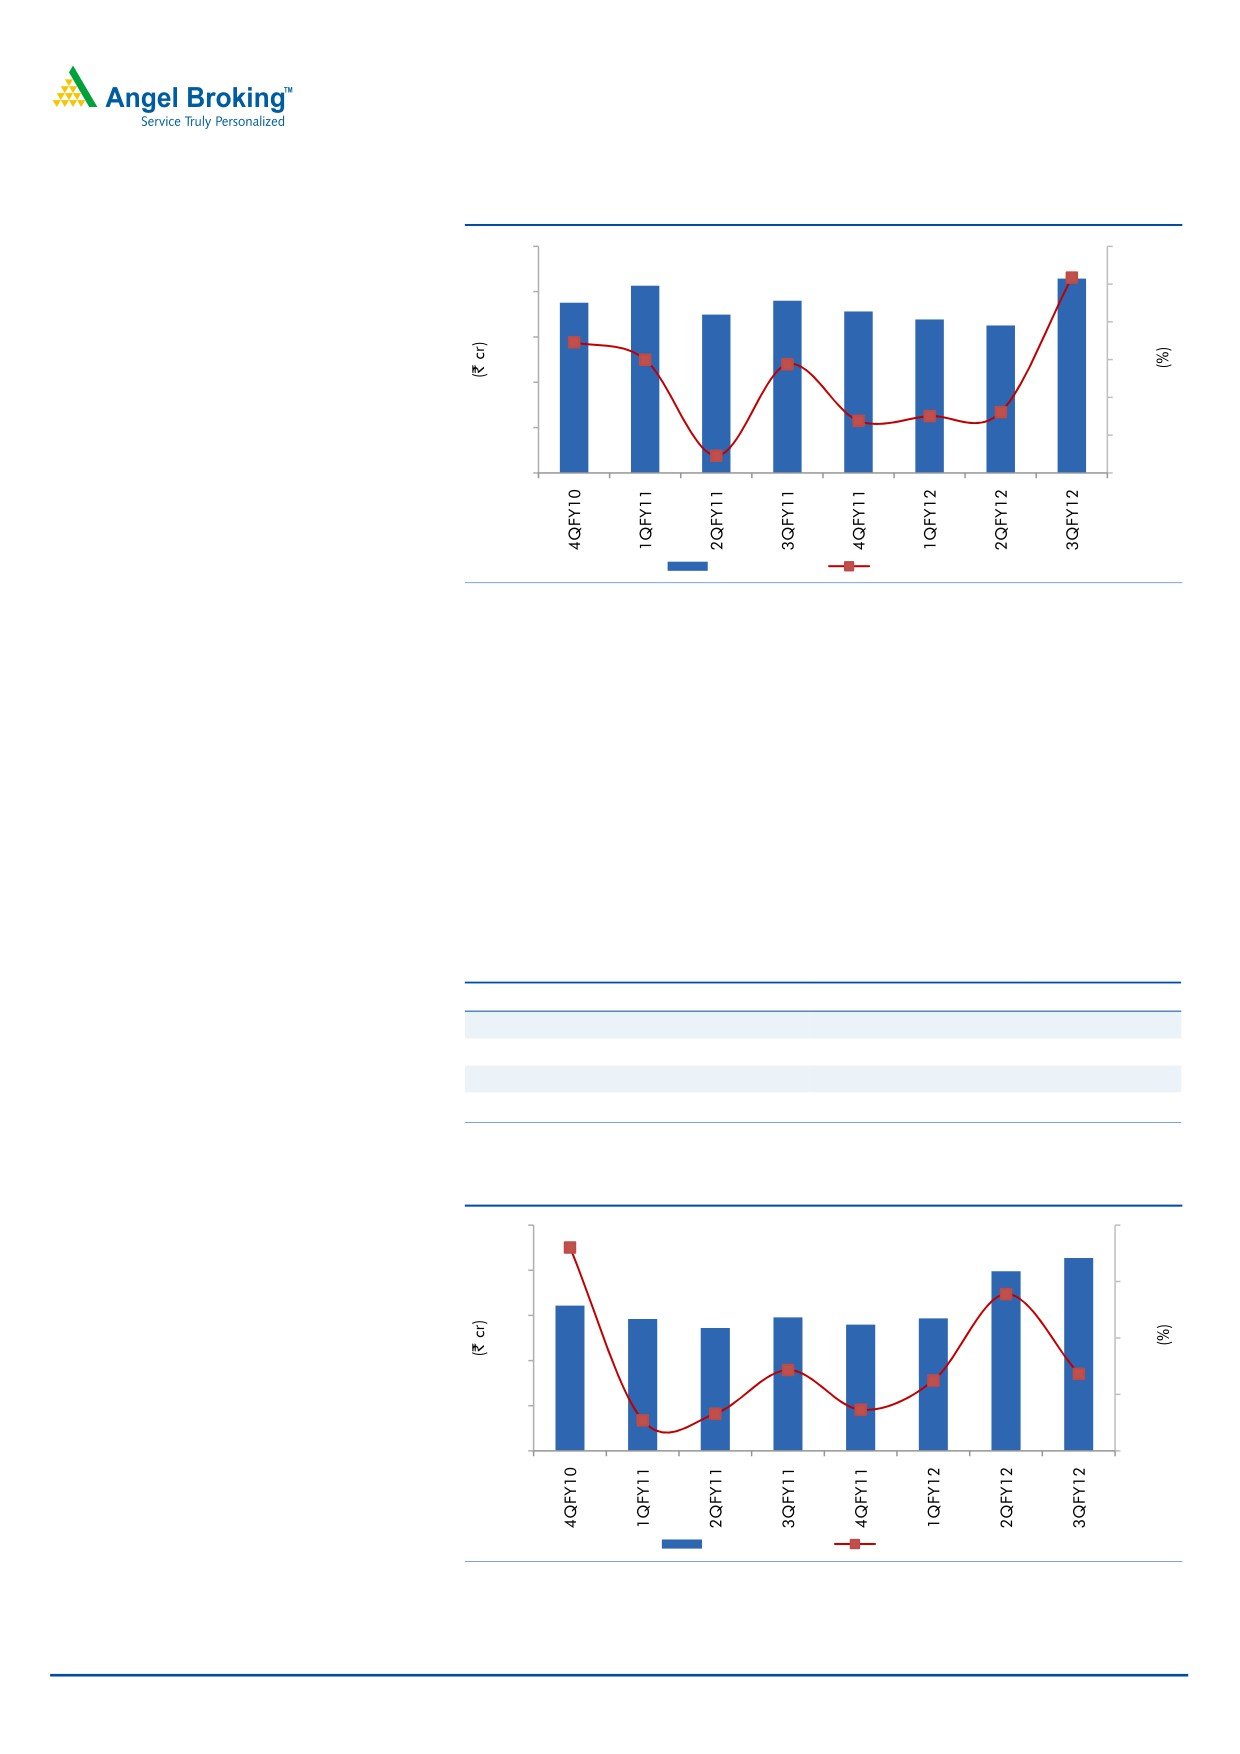
Exhibit 23: JLL’s core segment witnessing robust growth
100
40
30
80
20
60
10
40
0
20
(10)
0
(20)
Fabric care
qoq Growth (%)
Source: Company, Angel Research
Dishwashing
Under this segment, JLL has Exo dish wash bar and liquid targeting rural and
urban customers, respectively. The brand is positioned as an ‘anti-bacterial dish
wash’, as it contains Cyclozan, which works against bacterial contamination of
utensils. The products are doing well in southern India; however, it has been
recently launched in Maharashtra, Delhi, Punjab and West Bengal. National
rollout is the next step.
With the addition of Henkel’s portfolio, the segment will now be focussing on
urban Tier I and Tier II cities.
Exhibit 24: Combined portfolio for the dishwashing segment
Segment
JLL
Henkel
Value
-
-
Mid-premium
Exo bar
Pril Bar
Premium
Exo Liquid
Pril Liquid
Niche
Exo scrubber
-
Source: Company, Angel Research
Exhibit 25: JLL’s dishwashing segment witnessing decent growth
50
60
40
40
30
20
20
0
10
0
(20)
Dishwashing
qoq Growth (%)
Source: Company, Angel Research
March 26, 2012
18
Advisory Desk
Jyothy Laboratories | Initiating Coverage
Mosquito repellent
This mosquito repellent segment consists of brands such as Maxo coil, Maxo
vaporiser liquid and Maxo aerosol. Maxo is facing strong pricing pressure, as it is
present in the increasingly competitive market segment. However, the company
had chosen to maintain its profit margin even at the cost of losing its top line. The
company withdrew the trade schemes and promotions i.e., trade discount by ~7%,
which affected the demand negatively, leading to decline in its revenue as well as
market share.
Exhibit 26: Maxo's revenue witnessing a decline
80
160
120
60
80
40
40
0
20
(40)
0
(80)
Mosquito repellent
qoq Growth (%)
Source: Company, Angel Research
JLL launched Maxo Military and Maxo safe & soft in February 2011, which uses
DEPA (Di-ethyl Phenyl Acetamide) and expects these products to boost its revenue
and the profit. The launch was in-line with the agreement with Department of
Research and Development Organisation (DRDO), which gives JLL the exclusive
right to develop DEPA multi-insect repellent.
Further, the segment has lost 2% of its market share in the past one year (on TTM
basis). Now, in order to revive the segment and maintain its market share, the
company has planned for new ad campaigns, which are expected to start soon.
Personal care
The personal care segment was an unexplored segment for JLL as it has only one
brand (Jeeva) under it, which contributes the least to the company’s sales.
However, with Henkel’s products, Fa, Neem and Margo, JLL has an opportunity to
explore this segment as well.
March 26, 2012
19
Advisory Desk
Jyothy Laboratories | Initiating Coverage
Exhibit 27: Combined portfolio for the personal care segment
Segment
JLL
Henkel
Value
-
-
Mid-premium
Jeeva
Fa deo, Fa soap
Premium
Margo Neem
Niche
-
-
Source: Company, Angel Research
JLL has planned a new campaign for Margo to revive and rebrand the product,
which will help in repositioning the brand in the consumer’s mind. The campaign
is expected to be launched in the summer season (April-May 2012).
March 26, 2012
20
Advisory Desk
Jyothy Laboratories | Initiating Coverage
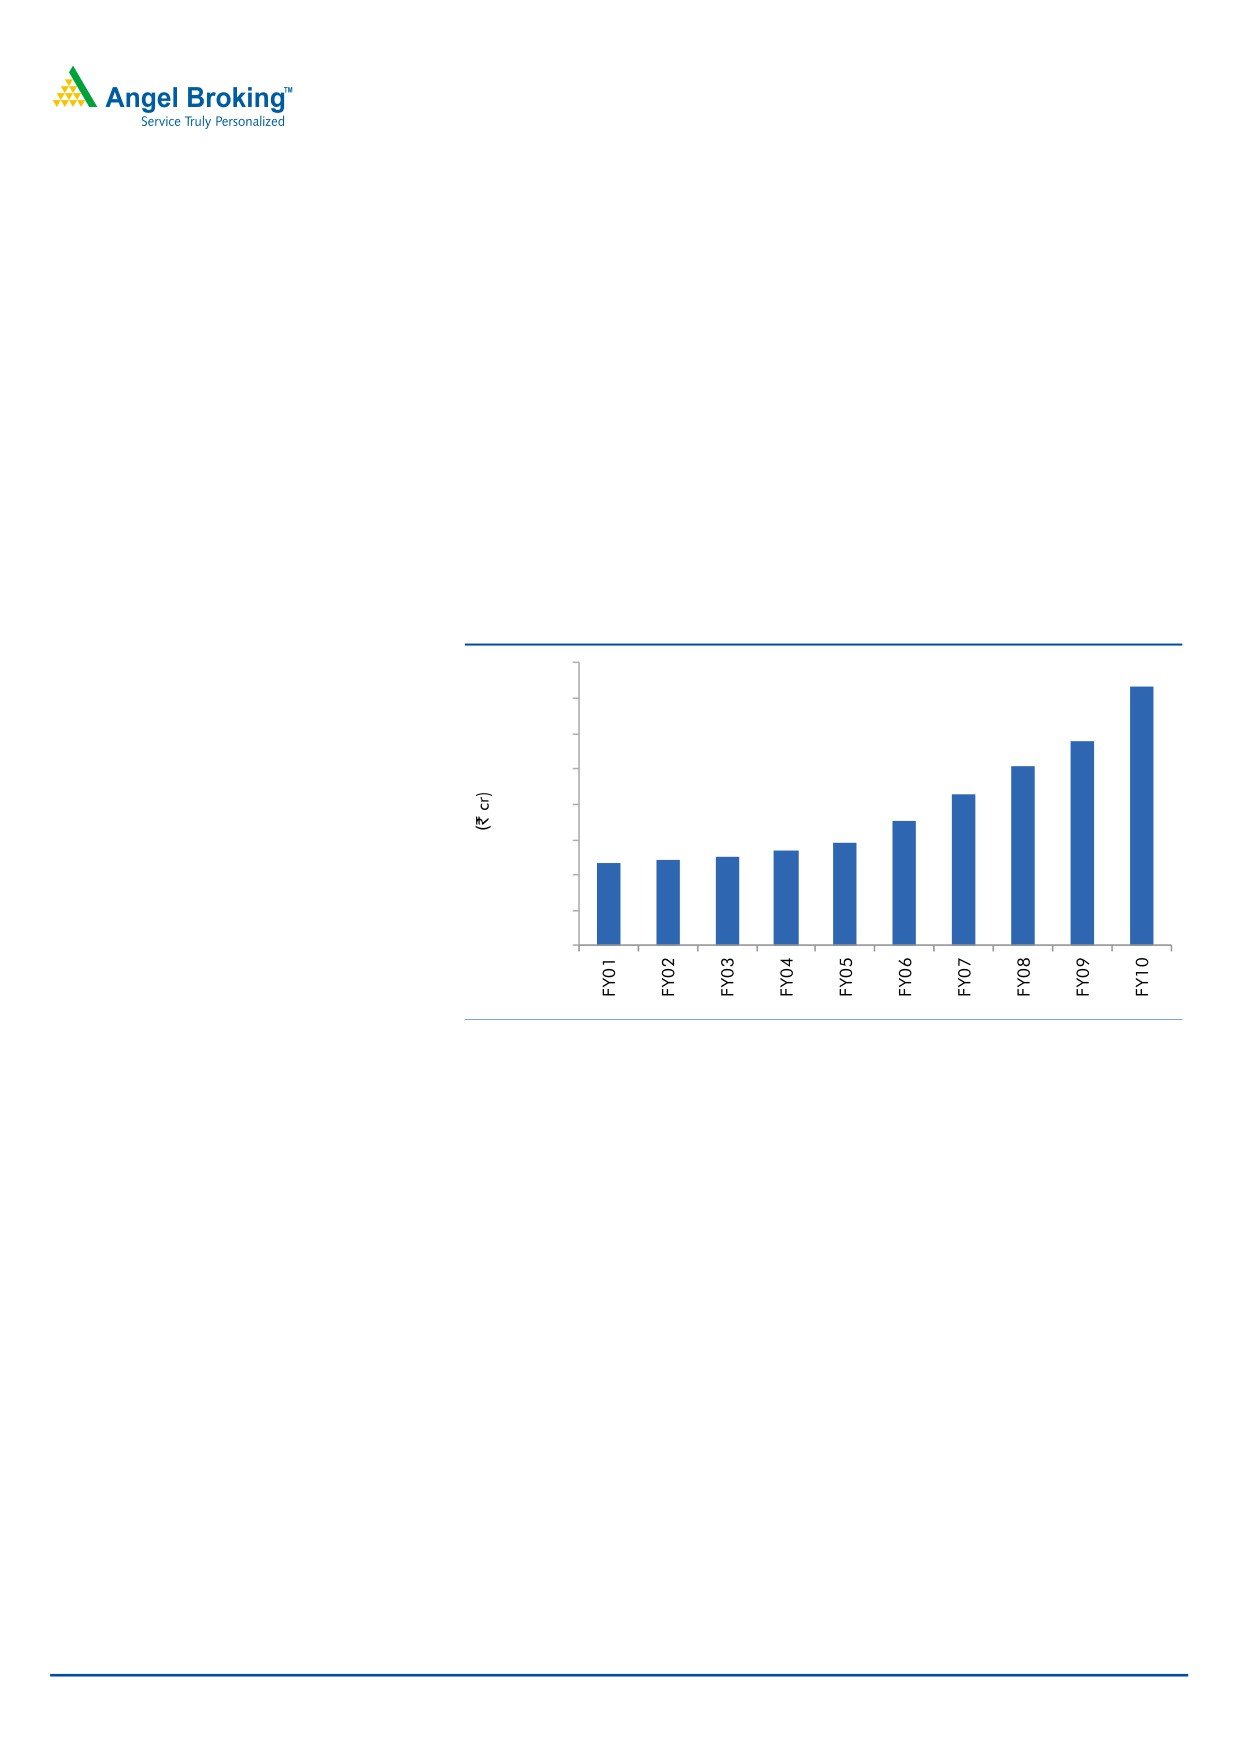
FMCG industry in India
The Indian FMCG industry has been on a fast growth track, majorly driven by
rising incomes driving domestic consumption, changing consumer behavior,
improved distribution channel and increasing marketing spends by players.
In the past five years, the annual growth rate of the sector has accelerated to 17%
compared to 11% in the last decade. As per AC Nielsen report on the FMCG
industry, March 2011, the FMCG market’s size stood at `1,46,300cr. According to
a report by Booz & Company, the industry is expected to report a 12-17% CAGR
and become a `4,00,000cr-6,20,000cr industry by 2020. Further, the industry is
set for a paradigm shift with increasing income levels (both urban and rural India)
and changing consumer behavior. However, the industry is also facing lot of
pressure on account of high inflation and rising cost of production.
Exhibit 28: FMCG market size - Growth over the past 10 years
160,000
140,000
120,000
100,000
80,000
60,000
40,000
20,000
0
Source: Industry, Angel Research
March 26, 2012
21
Advisory Desk
Jyothy Laboratories | Initiating Coverage
Profit and Loss (Standalone)
Y/E March (` cr)
FY2009*
FY2010
FY2011
FY2012E
FY2013E
FY2014E
Gross sales
384
626
665
703
820
955
Less: Excise duty
11
12
20
18
25
29
Net Sales
373
615
646
685
796
926
Other operating income
-
-
-
-
-
-
Total operating income
373
615
646
685
796
926
% chg
(5.2)
64.7
5.0
6.2
16.1
16.4
Net Raw Materials
197
311
311
335
369
411
% chg
6.6
58.1
0.1
7.5
10.1
11.3
Other Mfg costs
11
17
20
21
25
29
% chg
(7.9)
51.1
21.3
4.9
16.1
16.4
Personnel
40
61
67
89
103
120
% chg
(8.1)
51.2
11.2
32.0
16.1
16.4
Other
75
132
167
167
194
226
% chg
(16.9)
75.7
26.4
(0.2)
16.3
16.4
Total Expenditure
323
521
566
612
691
786
EBITDA
50
94
79
73
105
141
% chg
(20.5)
87.8
(15.7)
(7.6)
43.0
34.5
(% of Net Sales)
13.4
15.3
12.3
10.7
13.2
15.2
Depreciation& Amortisation
7
10
11
18
15
16
EBIT
43
83
68
56
90
125
% chg
(22.1)
93.2
(18.1)
(18.6)
61.2
39.4
(% of Net Sales)
11.6
13.6
10.6
8.1
11.3
13.5
Interest & other Charges
-
1
-
22
50
39
Other Income
8
18
28
61
73
77
(% of Net Sales)
2.1
3.0
4.3
8.9
9.2
8.4
Recurring PBT
43
83
68
34
40
86
% chg
(21.9)
93.4
(18.0)
(50.6)
18.7
116.9
PBT (reported)
51
101
96
94
113
164
Tax
10
21
15
18
24
54
(% of PBT)
20.7
20.8
16.0
19.1
21.1
33.1
PAT (reported)
40
80
80
76
89
110
Extraordinary Expense/(Inc.)
-
-
4
-
-
-
ADJ. PAT
40
80
77
76
89
110
% chg
(15.4)
99.6
(4.3)
(0.2)
16.9
22.6
(% of Net Sales)
10.7
13.0
11.9
11.2
11.2
11.8
Basic EPS (`)
5.5
11.0
9.5
9.5
11.1
13.6
Fully Diluted EPS (`)
5.5
11.0
9.5
9.5
11.1
13.6
% chg
(83.1)
99.6
(13.9)
(0.2)
16.9
22.6
Note: *FY2009 was only for 9 months
March 26, 2012
22
Advisory Desk
Jyothy Laboratories | Initiating Coverage
Balance Sheet (Standalone)
Y/E March (` cr)
FY2009*
FY2010
FY2011
FY2012E
FY2013E
FY2014E
SOURCES OF FUNDS
Equity Share Capital
7
7
8
8
8
8
Reserves& Surplus
345
392
645
674
717
779
Shareholder’s Funds
352
399
653
682
725
788
Total Loans
0
0
64
614
479
379
Deferred Tax (Net)
11
13
16
16
16
16
Total Liabilities
363
412
732
1,312
1,219
1,182
APPLICATION OF FUNDS
Gross Block
225
249
270
284
298
313
Less: Acc. Depreciation
39
49
62
80
95
111
Less: Impairment
4
5
3
3
3
3
Net Block
182
195
204
200
200
199
Capital Work-in-Progress
6
3
19
29
29
29
Lease adjustment
-
-
-
-
-
-
Goodwill
3
3
3
3
3
3
Investments
17
18
78
376
376
376
Current Assets
219
309
534
824
748
730
Cash
100
121
278
182
88
50
Loans & Advances
33
52
86
536
536
536
Inventory
43
66
66
69
80
93
Debtors
42
70
104
38
44
51
Current liabilities
64
116
107
120
136
154
Net Current Assets
155
193
427
703
612
575
Misc. Exp. not written off
-
-
-
-
-
-
Total Assets
363
412
732
1,312
1,219
1,182
Note: *FY2009 was only for 9 months
March 26, 2012
23
Advisory Desk
Jyothy Laboratories | Initiating Coverage
Cash Flow (Standalone)
Y/E March (` cr)
FY2009* FY2010 FY2011 FY2012E FY2013E FY2014E
Profit before tax
51
101
96
94
113
164
Depreciation
7
10
11
18
15
16
Change in Working Capital
(5)
(17)
(77)
(373)
(2)
(2)
Direct taxes paid
(10)
(21)
(15)
(18)
(24)
(54)
Others
(5)
(22)
(13)
(61)
(73)
(77)
Cash Flow from Operations
38
51
1
(340)
29
46
(Inc.)/Dec. in Fixed Assets
(7)
(21)
(37)
(24)
(14)
(15)
(Inc.)/Dec. in Investments
(15)
(1)
(61)
(297)
-
-
Others
7
9
9
61
73
77
Cash Flow from Investing
(16)
(12)
(89)
(260)
59
62
Issue of Equity
-
-
0.8
-
-
-
Inc./(Dec.) in loans
-
-
64
550
(135)
(100)
Dividend Paid (Incl. Tax)
(17)
(34)
(47)
(47)
(47)
(47)
Others
(0)
16
228
-
-
-
Cash Flow from Financing
(17)
(18)
245
503
(182)
(147)
Inc./(Dec.) in Cash
5
21
157
(97)
(93)
(38)
Opening Cash balances
95
100
121
278
182
88
Closing Cash balances
100
121
278
182
88
50
Note: *FY2009 was only for 9 months
March 26, 2012
24
Advisory Desk
Jyothy Laboratories | Initiating Coverage
Key Ratios (Standalone)
Y/E March
FY2009*
FY2010
FY2011
FY2012E
FY2013E
FY2014E
Valuation Ratio (x)
P/E (on FDEPS)
33.9
17.0
17.7
17.8
15.2
12.4
P/CEPS
29.0
15.0
15.6
14.5
13.0
10.9
P/BV
3.9
3.4
2.1
2.0
1.9
1.7
EV/Net sales
3.3
2.0
1.7
2.1
1.7
1.4
EV/EBITDA
24.8
13.0
13.5
19.4
13.1
9.3
EV / Total Assets
3.5
3.1
1.5
1.1
1.1
1.1
Per Share Data (`)
EPS (Basic)
5.5
11.0
9.5
9.5
11.1
13.6
EPS (fully diluted)
5.5
11.0
9.5
9.5
11.1
13.6
Cash EPS
6.5
12.5
10.8
11.7
12.9
15.5
DPS
2.0
4.0
5.0
5.0
5.0
5.0
Book Value
48.6
55.0
80.9
84.6
89.9
97.7
DuPont Analysis
EBIT margin
11.6
13.6
10.6
8.1
11.3
13.5
Tax retention ratio
0.8
0.8
0.8
0.8
0.8
0.7
Asset turnover (x)
1.7
2.4
1.9
1.0
1.1
1.3
ROIC (Post-tax)
15.2
26.1
17.0
6.4
10.0
11.8
Cost of Debt (Post Tax)
167.7
268.4
1.1
5.3
7.2
6.0
Leverage (x)
(0.3)
(0.3)
(0.4)
0.1
0.0
(0.1)
Operating ROE
65.9
110.5
9.9
6.5
10.1
11.5
Returns (%)
ROCE (Pre-tax)
0.1
0.2
0.1
0.0
0.1
0.1
Angel ROIC (Pre-tax)
19.1
32.9
20.2
7.9
12.7
-
ROE
11.8
21.3
14.6
11.5
12.7
14.5
Turnover ratios (x)
Asset TO (Gross Block)
1.7
2.6
2.5
2.5
2.7
3.0
Inventory / Net sales (days)
42
32
38
36
34
34
Receivables (days)
33
33
49
20
20
20
Payables (days)
68
63
72
72
72
72
WC cycle (ex-cash) (days)
53
43
84
278
240
207
Solvency ratios (x)
Net debt to equity
(0.3)
(0.3)
(0.4)
0.1
0.0
(0.1)
Net debt to EBITDA
(2.3)
(1.5)
(3.7)
0.8
0.1
(0.3)
Int. Coverage (EBIT/ Int.)
116.8
136.8
166.8
2.5
1.8
3.2
Note: *FY2009 was only for 9 months
March 26, 2012
25
Advisory Desk
Jyothy Laboratories | Initiating Coverage
Profit and Loss (Consolidated)
Y/E March (` cr)
FY2009*
FY2010
FY2011
FY2012E#
FY2013E
FY2014E
Gross sales
397
650
685
981
1,402
1,678
Less: Excise duty
11
10
18
26
42
51
Net Sales
385
640
667
955
1,359
1,627
Other operating income
-
-
-
-
-
-
Total operating income
385
640
667
955
1,359
1,627
% chg
66.1
4.3
43.2
42.3
19.7
Net Raw Materials
199
317
320
484
658
756
% chg
59.7
0.9
51.2
35.9
14.9
Other Mfg costs
14
24
25
32
40
47
% chg
70.7
4.7
29.3
25.8
17.7
Personnel
44
71
77
110
144
165
% chg
60.6
9.0
42.0
30.6
15.2
Other
80
136
172
250
378
448
% chg
70.9
26.7
44.8
51.4
18.5
Total Expenditure
336
548
595
876
1220
1417
EBITDA
49
92
73
80
139
210
% chg
88.3
(21.0)
9.6
75.3
50.5
(% of Net Sales)
12.7
14.4
10.9
8.3
10.3
12.9
Depreciation & Amortisation
7
12
13
23
25
26
EBIT
41
79
60
56
114
184
% chg
92.5
(25.1)
(5.7)
104.0
60.8
(% of Net Sales)
10.7
12.4
8.9
5.9
8.4
11.3
Interest & other Charges
1
2
2
22
61
50
Other Income
8
18
24
61
79
89
(% of Net Sales)
2.0
2.8
3.6
6.4
5.8
5.5
Recurring PBT
41
78
57
34
53
134
% chg
91.6
(26.2)
(40.7)
56.1
152.3
PBT (reported)
48
96
81
95
132
223
Tax
11
21
15
18
24
54
(% of PBT)
22.4
22.5
19.0
19.1
18.2
24.4
PAT (reported)
37
74
66
77
108
169
Minority interest
(1)
(0)
(3)
(6)
(4)
3
PAT after MI
38
74
69
84
112
165
Extraordinary Expense/(Inc.)
-
-
3
(1)
(1)
(1)
ADJ. PAT
38
74
66
85
112
166
% chg
93.9
(11.6)
28.9
32.3
48.1
(% of Net Sales)
10.0
11.6
9.9
8.9
8.3
10.2
Basic EPS (`)
5.3
10.3
8.2
10.5
13.9
20.6
Fully Diluted EPS (`)
5.3
10.3
8.2
10.5
13.9
20.6
% chg
93.9
(20.5)
28.9
32.3
48.1
Note: *FY2009 was only for 9 months, #FY2012E includes Henkel numbers post August 22, 2011
March 26, 2012
26
Advisory Desk
Jyothy Laboratories | Initiating Coverage
Balance Sheet (Consolidated)
Y/E March (` cr)
FY2009* FY2010 FY2011 FY2012E# FY2013E FY2014E
SOURCES OF FUNDS
Equity Share Capital
7
7
8
8
8
8
Reserves& Surplus
340
381
623
276
335
453
Shareholders’ Funds
347
388
631
284
343
462
Minority Interest
0
1
0
(29)
(32)
(29)
Total Loans
1
18
74
624
589
489
Deferred Tax (Net)
10
13
16
16
16
16
Total Liabilities
358
419
722
896
916
938
APPLICATION OF FUNDS
Gross Block
242
287
306
438
452
467
Less: Acc. Depreciation
43
55
68
138
163
189
Less: Impairment
4
5
3
3
3
3
Net Block
195
228
235
297
286
276
Capital Work-in-Progress
11
4
20
30
30
30
Lease adjustment
-
-
-
-
-
-
Goodwill
5
6
6
538
538
538
Investments
0
0
61
-
-
-
Current Assets
214
302
510
259
310
384
Cash
102
122
281
3
7
22
Loans & Advances
22
35
55
72
102
122
Inventory
47
73
69
114
129
154
Debtors
43
71
105
70
72
86
Current liabilities
68
120
110
228
249
290
Net Current Assets
146
181
401
31
61
94
Misc. Exp. not written off
-
-
-
-
-
-
Total Assets
358
419
722
896
916
938
Note: *FY2009 was only for 9 months, #FY2012E includes Henkel numbers post August 22, 2011
March 26, 2012
27
Advisory Desk
Jyothy Laboratories | Initiating Coverage
Cash Flow (Consolidated)
Y/E March (` cr)
FY2009* FY2010 FY2011 FY2012E# FY2013E FY2014E
Profit before tax
48
96
81
95
132
223
Depreciation
7
12
13
23
25
26
Change in Working Capital
(11)
(14)
(61)
93
(27)
(18)
Direct taxes paid
(11)
(21)
(15)
(18)
(24)
(54)
Others
(4)
(21)
(23)
(63)
(85)
(88)
Cash Flow from Operations
30
51
(6)
130
21
88
(Inc.)/Dec. in Fixed Assets
14
(39)
(34)
(675)
(14)
(15)
(Inc.)/Dec. in Investments
0
0
(61)
61
0
0
Others
(17)
1
(148)
(297)
79
89
Cash Flow from Investing
(2)
(37)
(243)
(911)
65
74
Issue of Equity
0
0
0.8
-
-
-
Inc./(Dec.) in loans
0
17
57
550
(35)
(100)
Dividend Paid (Incl. Tax)
(17)
(34)
(47)
(47)
(47)
(47)
Others
80
23
396
-
-
-
Cash Flow from Financing
63
7
407
503
(82)
(147)
Inc./(Dec.) in Cash
91
20
158
(277)
3
15
Opening Cash balances
11
102
122
281
3
7
Closing Cash balances
102
122
281
3
7
22
Note: *FY2009 was only for 9 months, #FY2012E includes Henkel numbers post August 22, 2011
March 26, 2012
28
Advisory Desk
Jyothy Laboratories | Initiating Coverage
Key Ratios (Consolidated)
Y/E March
FY2009*
FY2010
FY2011
FY2012E#
FY2013E
FY2014E
Valuation Ratio (x)
P/E (on FDEPS)
35.4
18.3
20.7
16.0
12.1
8.2
P/CEPS
29.7
15.7
17.3
12.6
9.9
7.1
P/BV
3.9
3.5
2.2
4.8
4.0
2.9
EV/Net sales
3.3
2.0
1.6
2.1
1.4
1.1
EV/EBITDA
25.8
13.7
15.1
24.9
13.9
8.7
EV / Total Assets
3.6
3.1
1.5
2.3
2.2
2.0
Per Share Data (`)
EPS (Basic)
5.3
10.3
8.2
10.5
13.9
20.6
EPS (fully diluted)
5.3
10.3
8.2
10.5
13.9
20.6
Cash EPS
6.3
12.0
9.8
13.4
17.0
23.8
DPS
2.0
4.0
5.0
5.0
5.0
5.0
Book Value
47.8
53.4
78.3
35.3
42.5
57.2
DuPont Analysis
EBIT margin
10.7
12.4
8.9
5.9
8.4
11.3
Tax retention ratio
0.8
0.8
0.8
0.8
0.8
0.8
Asset turnover (x)
1.7
2.3
2.0
3.1
4.2
4.9
ROIC (Post-tax)
14.0
22.5
14.3
14.7
28.9
42.0
Cost of Debt (Post Tax)
105.9
14.6
3.8
5.1
8.3
7.0
Leverage (x)
(0.3)
(0.3)
(0.4)
2.2
1.7
1.0
Operating ROE
40.9
20.4
9.8
35.8
63.9
77.4
Returns (%)
ROCE (Pre-tax)
0.1
0.2
0.1
0.1
0.1
0.2
Angel ROIC (Pre-tax)
18.0
29.1
17.6
18.2
35.3
55.6
ROE
11.1
20.3
12.9
18.5
35.8
41.3
Turnover ratios (x)
Asset TO (Gross Block)
1.6
2.4
2.3
2.6
3.1
3.5
Inventory / Net sales (days)
45
34
39
35
33
32
Receivables (days)
41
32
48
33
19
18
Payables (days)
73
63
71
70
71
69
WC cycle (ex-cash) (days)
42
34
66
10
15
16
Solvency ratios (x)
Net debt to equity
(0.3)
(0.3)
(0.4)
2.2
1.7
1.0
Net debt to EBITDA
(2.1)
(1.1)
(3.7)
7.8
4.2
2.2
Int. Coverage (EBIT/ Int.)
58.1
46.7
27.7
2.5
1.9
3.7
Note: *FY2009 was only for 9 months, #FY2012E includes Henkel numbers post August 22, 2011
March 26, 2012
29
Advisory Desk
Jyothy Laboratories | Initiating Coverage
Research Team Tel: 022 - 39357800
DISCLAIMER
This document is solely for the personal information of the recipient, and must not be singularly used as the basis of any investment
decision. Nothing in this document should be construed as investment or financial advice. Each recipient of this document should make
such investigations as they deem necessary to arrive at an independent evaluation of an investment in the securities of the companies
referred to in this document (including the merits and risks involved), and should consult their own advisors to determine the merits and
risks of such an investment.
Angel Broking Limited, its affiliates, directors, its proprietary trading and investment businesses may, from time to time, make
investment decisions that are inconsistent with or contradictory to the recommendations expressed herein. The views contained in this
document are those of the analyst, and the company may or may not subscribe to all the views expressed within.
Reports based on technical and derivative analysis center on studying charts of a stock's price movement, outstanding positions and
trading volume, as opposed to focusing on a company's fundamentals and, as such, may not match with a report on a company's
fundamentals.
The information in this document has been printed on the basis of publicly available information, internal data and other reliable
sources believed to be true, but we do not represent that it is accurate or complete and it should not be relied on as such, as this
document is for general guidance only. Angel Broking Limited or any of its affiliates/ group companies shall not be in any way
responsible for any loss or damage that may arise to any person from any inadvertent error in the information contained in this report.
Angel Broking Limited has not independently verified all the information contained within this document. Accordingly, we cannot testify,
nor make any representation or warranty, express or implied, to the accuracy, contents or data contained within this document. While
Angel Broking Limited endeavours to update on a reasonable basis the information discussed in this material, there may be regulatory,
compliance, or other reasons that prevent us from doing so.
This document is being supplied to you solely for your information, and its contents, information or data may not be reproduced,
redistributed or passed on, directly or indirectly.
Angel Broking Limited and its affiliates may seek to provide or have engaged in providing corporate finance, investment banking or
other advisory services in a merger or specific transaction to the companies referred to in this report, as on the date of this report or in
the past.
Neither Angel Broking Limited, nor its directors, employees or affiliates shall be liable for any loss or damage that may arise from or in
connection with the use of this information.
Note: Please refer to the important `Stock Holding Disclosure' report on the Angel website (Research Section). Also, please
refer to the latest update on respective stocks for the disclosure status in respect of those stocks. Angel Broking Limited and
its affiliates may have investment positions in the stocks recommended in this report.
Disclosure of Interest Statement
Jyothy Laboratories
1. Analyst ownership of the stock
No
2. Angel and its Group companies ownership of the stock
No
3. Angel and its Group companies' Directors ownership of the stock
No
4. Broking relationship with company covered
No
Note: We have not considered any Exposure below ` 1 lakh for Angel, its Group companies and Directors.
Ratings (Returns):
Buy (> 15%)
Accumulate (5% to 15%)
Neutral (-5 to 5%)
Reduce (-5% to 15%)
Sell (< -15%)
March 26, 2012
30