Advisory Desk
October 5, 2011
INEOS ABS (India)
BUY
CMP
`559
Ineos ABS India (INEOS), an 83% subsidiary of Ineos Global Group, is India's
leading manufacturer of an engineering plastic named acrylonitrile butadiene
Target Price
`702
styrene (ABS). On the back of capacity expansion and product development, the
Investment Period
12 Months
top line of the company is expected to grow at a CAGR of 19% during
CY2010-12E. The business of the company is to be transferred to ‘Styrolution’, a
50/50 JV between BASF and INEOS and as specified in the company release on
BSE, ‘an indirect change in control of INEOS ABS India Limited is expected’, which
may trigger an ‘Open Offer’ in the next one year, in our view. The stock is
attractive at 12.7x PE and 0.9x EV/Sales for CY2012E. We recommend Buy on
INEOS ABS India with a target price of `702, based on a target P/E of 16x and
implied EV/Sales of 1.1x for CY2012E.
Investment rationale
Transfer of business to ‘Styrolution’ to act as a key trigger
Ineos Group and BASF have agreed to form a 50/50 joint venture, which is to
include INEOS ABS, INEOS NOVA (sister concern) and Styrene, ABS, polystyrene
businesses of BASF to form a new company as ‘Styrolution’. The deal is expected
to be completed by 4QCY2011. As announced in the company release on BSE
that “an indirect change in control of INEOS ABS India Limited is expected”, which
we believe may trigger an ‘Open Offer’ in the next one year. Since Ineos group
holds 83% stake in INEOS ABS Ltd, a successful open offer may lead to delisting
of the company.
Capacity expansion to help tap the unfulfilled demand
As there is a gap between supply and demand of ABS, CRISIL Research estimates
supply would grow at a 17% CAGR to meet the demand of a 10% CAGR during
CY2010-15E. Assuming the market share of INEOS to remain constant at 60%,
volumes for INEOS ABS resin is likely to grow by 17% over the same period.
Considering the slowdown in the economy we have assumed that the volumes will
grow at 9% yoy and 10% yoy in CY2011E and CY2012E, for which the company
has already expanded its capacity by ~ 33% to 80,000 TPA in 2011.
Outlook and valuation
Net sales of the company is expected to grow at 19% CAGR during CY2010-12E.
The company’s EBITDA margin is expected to fall to 11.2% due to high raw-
material prices in CY2011E and CY2012E. We expect Net Profit to dip in
CY2011E by 3% yoy but rise by 14% yoy in CY2012E to `77cr. At the CMP of
`559, the stock is trading at PE of 12.7x and EV/Sales of 0.9x of CY2012E. We
recommend Buy on INEOS ABS India with a target price of `702, offering an
upside of 25% from current levels.
Key financials
Net
OPM PAT EPS ROE P/E P/BV
EV/
EV/
INEOS
sales (` cr)
(%)
(` cr)
(`)
(%)
(x)
(x)
EBITDA (x) Sales (x)
CY2010
742
15.2
70
40
21
14.0
2.9
7.3
1.1
CY2011E
896
11.3
68
39
17
14.5
2.5
8.5
1.0
Twinkle Gosar
Tel: 022- 3935 7800 Ext: 6848
CY2012E
1,049
11.2
77
44
17
12.7
2.1
7.7
0.9
Source: Company, Angel Research
Please refer to important disclosures at the end of this report
1
Advisory Desk
INEOS ABS India
Table of contents
Investment rationale
1
Transfer of business to ‘Styrolution’ to act as a key trigger
1
Capacity expansion to help tap the unfulfilled demand
1
Outlook and valuation
1
Investment arguments
3
Transfer of business to ‘Styrolution’ to act as a key trigger
3
Capacity expansion to help tap the unfulfilled demand
3
Financials
4
Risks
6
Competition
9
Petrochemicals - Polymers industry
10
End-user industry and uses of ABS
10
INEOS Group
12
Company background
12
Windmill Farm
12
Debt-free and cash-rich position
12
Customised/tailor-made products as per market/consumer demand
12
Products
13
ABSOLAC
13
ABSOLAN
14
October 5, 2011
2
Advisory Desk
INEOS ABS India
Investment arguments
Transfer of business to ‘Styrolution’ to act as a key trigger
Ineos Group and BASF have agreed to form a 50/50 joint venture, which is to
include INEOS ABS, INEOS NOVA (sister concern) and Styrene, ABS, polystyrene
businesses of BASF to form a new company as ‘Styrolution’. Since, as announced
in the news release on BSE that “an indirect change in control of INEOS ABS India
Limited is expected”, we believe that this may trigger an ‘Open Offer’ in the next
one year. As Ineos group holds 83% stake in INEOS ABS Ltd, a successful open
offer may lead to delisting of the company. The new entity ‘Styrolution’ is
forecasted to have annual sales of more than €5bn. The JV will be launched on a
global scale and will be a globally competitive producer of Styrene, ABS and
polystyrene, with a leading position in North America, Asia and Europe.
There have been quite a few merger and acquisition activities carried on in the
company in the past, as listed in the following exhibit:
Exhibit 2: History of M&A activities
1973 Incorporated as ABS Plastics Ltd.
1992 Name changed to ABS Industries Ltd.
1997 Bayer acquired 51% stake, name changed to Bayer ABS Ltd.
2004 Styrenic-based polymer business became part of Lanxess, name changed to
Lanxess ABS
2008
83.3% acquired by INEOS ABS Ltd., open offer at `201, name changed to
INEOS ABS India Ltd.
2011 Talks to transfer INEOS ABS to Styrolution, 50/50 JV of INEOS Group and BASF.
Source: Company
Capacity expansion to help tap the unfulfilled demand
Considering the industry demand for ABS vis-a-vis the supply, the gap has
persisted for long and continues to exist. The unfulfilled demand is being met by
the imports of ABS. Moreover, even domestic players have started expansion of the
capacity in order to tap the unfulfilled demand.
Exhibit 3: ABS Volumes in India
Particulars (TPA)
2007
2008
2009
2010
2011E
2012E
ABS production
72,403
77,350
69,581
82,162
91,090
107,607
ABS import
12,383
13,365
21,073
30,368
34,928
39,000
ABS export
1,687
1,307
1,539
60
4,753
11,000
ABS demand
85,000
95,000
88,859
106,329
116,983
128,705
INEOS capacity
50,000
60,000
60,000
60,000
80,000
110,000
INEOS production
49,427
48,053
50,515
54,904
65,053
76,849
INEOS volume
49,194
47,336
51,495
55,068
65,053
76,849
Source: CRISIL Research, Company, Department of Commerce
CRISIL Research estimates that the supply of ABS would grow at 17% CAGR to
meet the demand of a 10% CAGR during CY2010-15E. Assuming the market
share of INEOS to remain constant at 60%, volumes for ABS are likely to grow by
17% over this period. Company has already made capacity expansion from
60,000 TPA to 80,000 TPA in 2011 and also has plans to further augment the
October 5, 2011
3
Advisory Desk
INEOS ABS India
capacity to 110,000 TPA by the end of CY2012. Since SAN is an intermediate
product in the production of ABS, to assist and support increased ABS resins
production, the company has also started capacity expansion for SAN from the
existing 60,000 TPA to 100,000 TPA.
Financials
Key assumptions
CRISIL Research has estimated the supply of ABS to grow at a 17% CAGR during
CY2010-15E. However, considering the slowdown in the economy, we have
assumed volume to grow at 9% yoy and 10% yoy in CY2011E and CY2012E,
respectively. On the back of increased feedstock prices, raw-material prices are
assumed to grow at weighted average of 20% yoy and 9% yoy in CY2011E and
CY2012E, respectively. Increased raw-material prices will raise the price of ABS by
13% yoy in CY2011E and 2% yoy in CY2012E, resulting in realization growth of
24% yoy in CY2011E and 14% yoy in CY2012E.
Exhibit 4: Key assumptions
CY2011E
CY2012E
Total volume growth (ABS+SAN) (%)
9
10
Total realization growth (%)
24
14
Change in weighted raw material prices (%)
20
9
Source: Angel Research
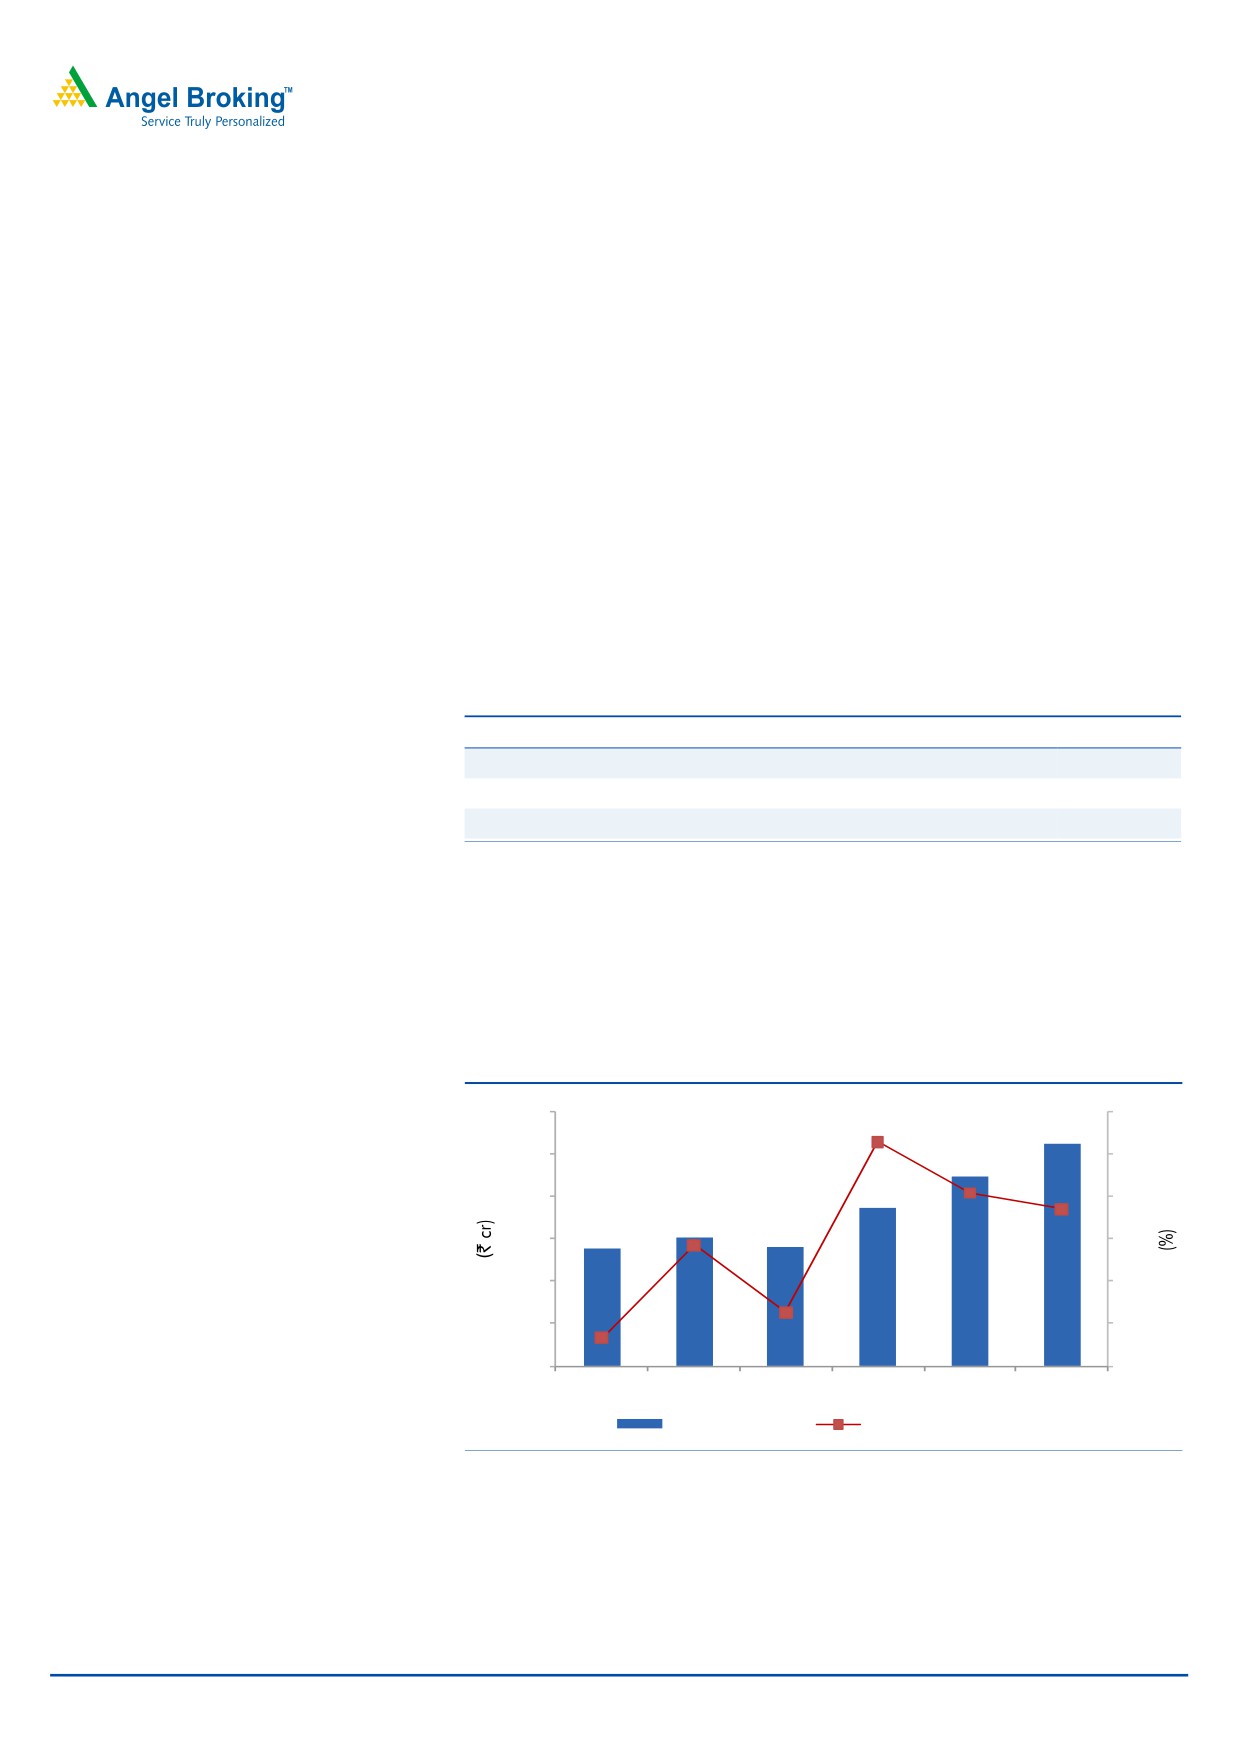
Net sales to grow at a 19% CAGR for CY2010-12E
Considering the capacity expansion and revived demand for ABS from the
automobile and home appliances sector, the company’s net sales are expected to
grow at a CAGR of 19% over CY2010-12E to `1,049cr.
Exhibit 5: Net sales & net sales growth
1200
40
1000
30
800
20
600
10
400
0
200
(10)
0
(20)
CY2007
CY2008
CY2009
CY2010
CY2011E CY2012E
Net Sales (LHS)
Net Sales growth (RHS)
Source: Company, Angel Research
October 5, 2011
4
Advisory Desk
INEOS ABS India
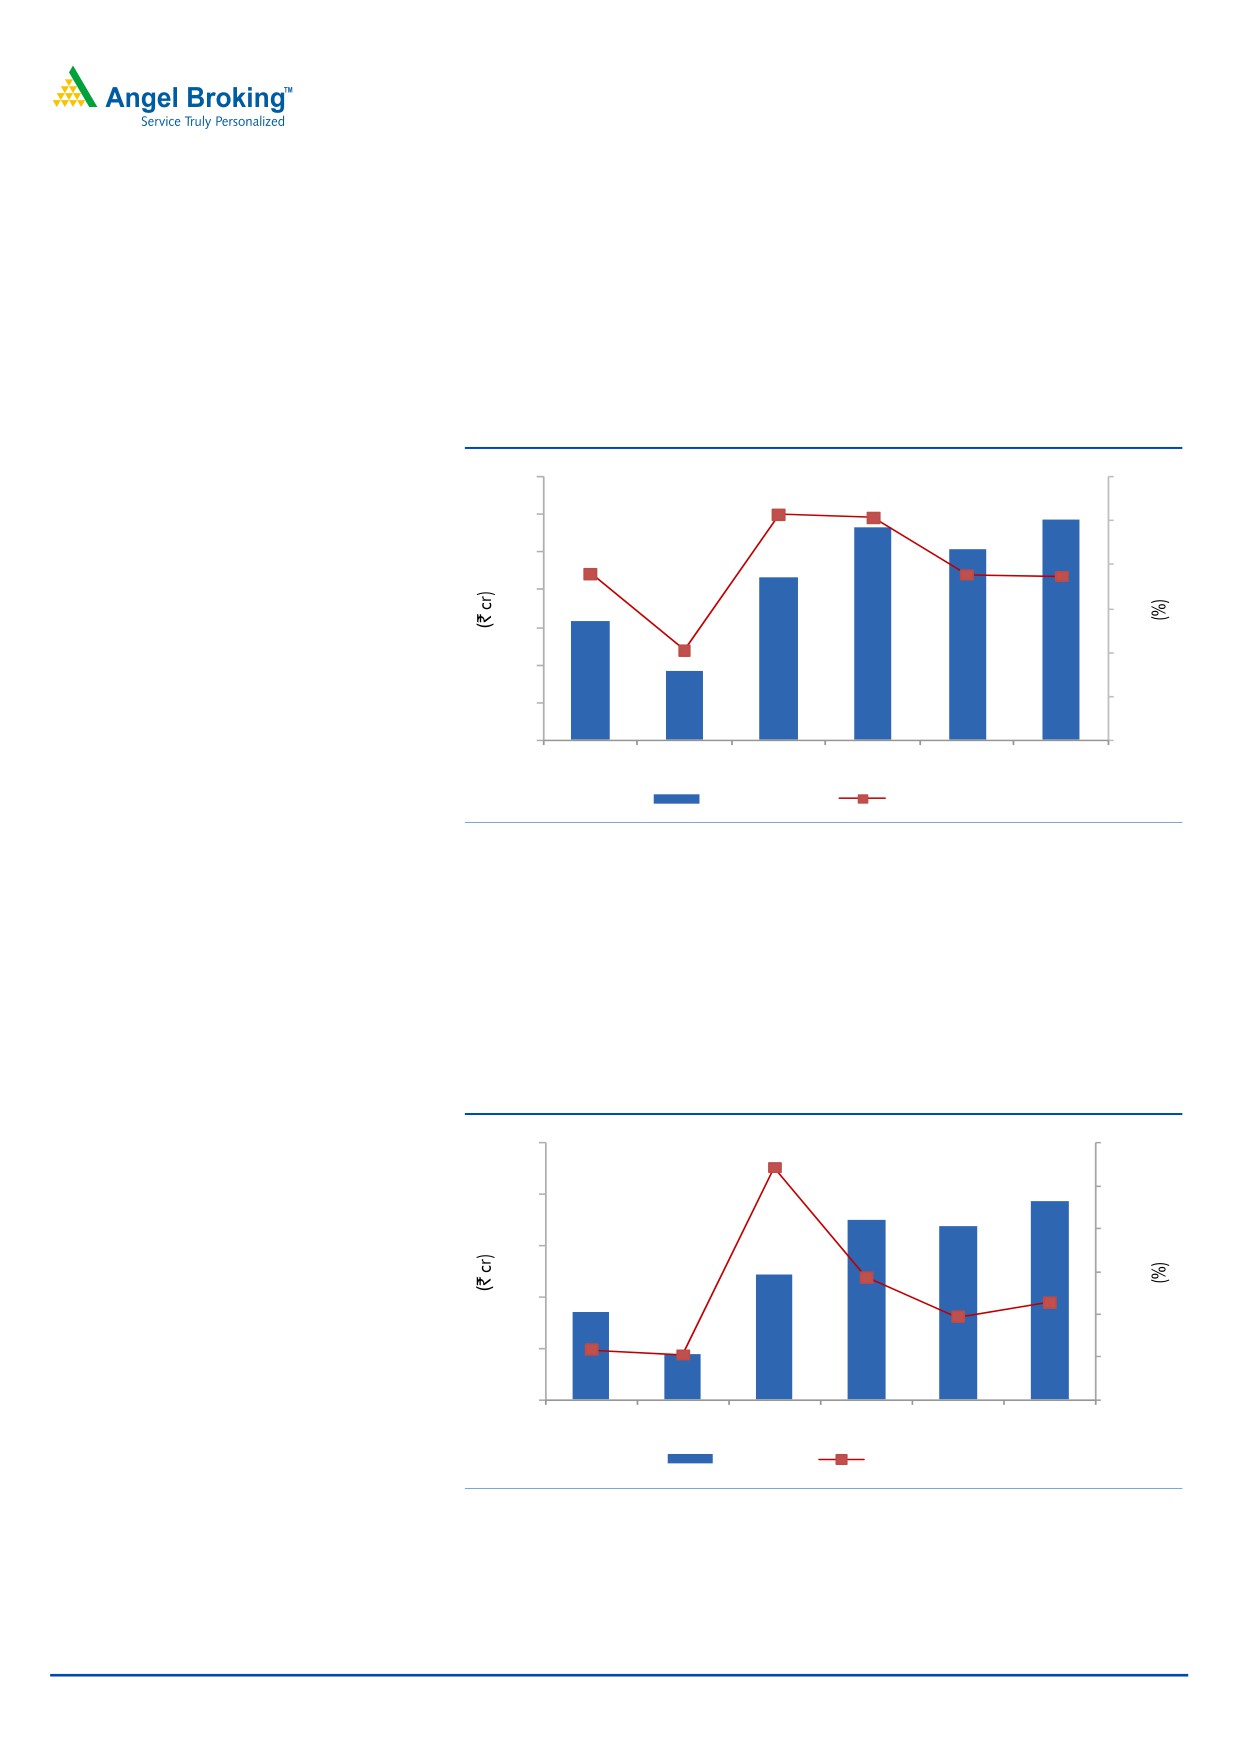
EBITDA margin to fall to 11.2% during CY2010-12E
Despite increased sales, improved operational efficiency through process
development and power generation through wind mills, on the back of high
growth in raw-material prices, the company’s EBITDA margin is expected to fall
from 15.2% in CY2010 to 11.2% in CY2011E and CY2012E. The company’s
EBITDA is expected to be around `117cr in CY2012E.
Exhibit 6: EBITDA & EBITDA margin
140
18
120
15
100
12
80
9
60
6
40
3
20
0
0
CY2007
CY2008
CY2009
CY2010
CY2011E CY2012E
EBITDA (LHS)
EBITDA margin (RHS)
Source: Company, Angel Research
With capacity expansion, the gross block is expected to grow by 15% yoy and 25%
yoy in CY2011E and CY2012E, respectively, with a subsequent increase in the
depreciation from `14cr in CY2010 to `23cr in CY2012E. With zero debt and
cash surplus, the company’s other income is expected to rise from `5cr in CY2010
to `16cr in CY2012E. We expect Net Profit to dip in CY2011E by 3% yoy but rise
by 14% yoy in CY2012E to `77cr.
Exhibit 7: PAT & PAT growth
100
200
150
80
100
60
50
40
0
20
(50)
0
(100)
CY2007
CY2008
CY2009
CY2010
CY2011E CY2012E
PAT (LHS)
PAT growth (RHS)
Source: Company, Angel Research
October 5, 2011
5
Advisory Desk
INEOS ABS India
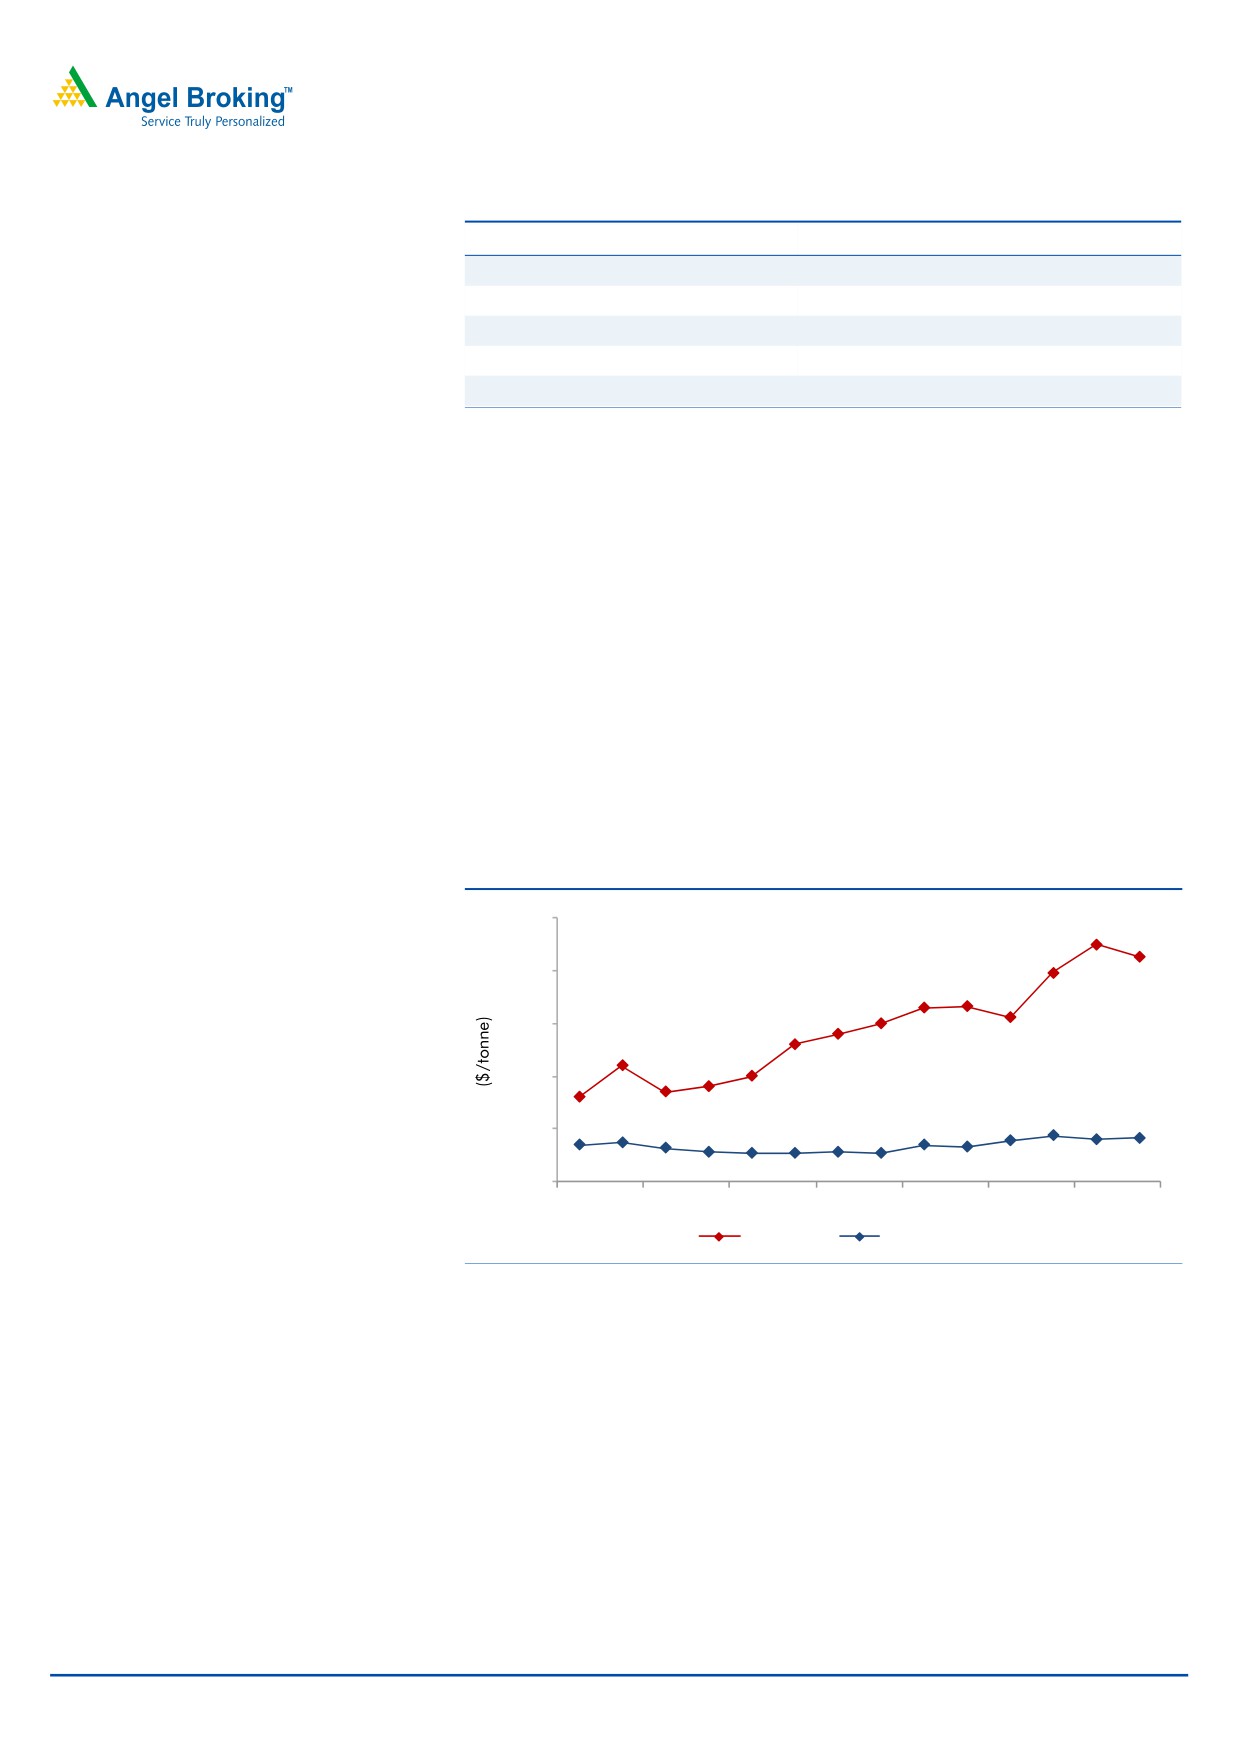
Risks
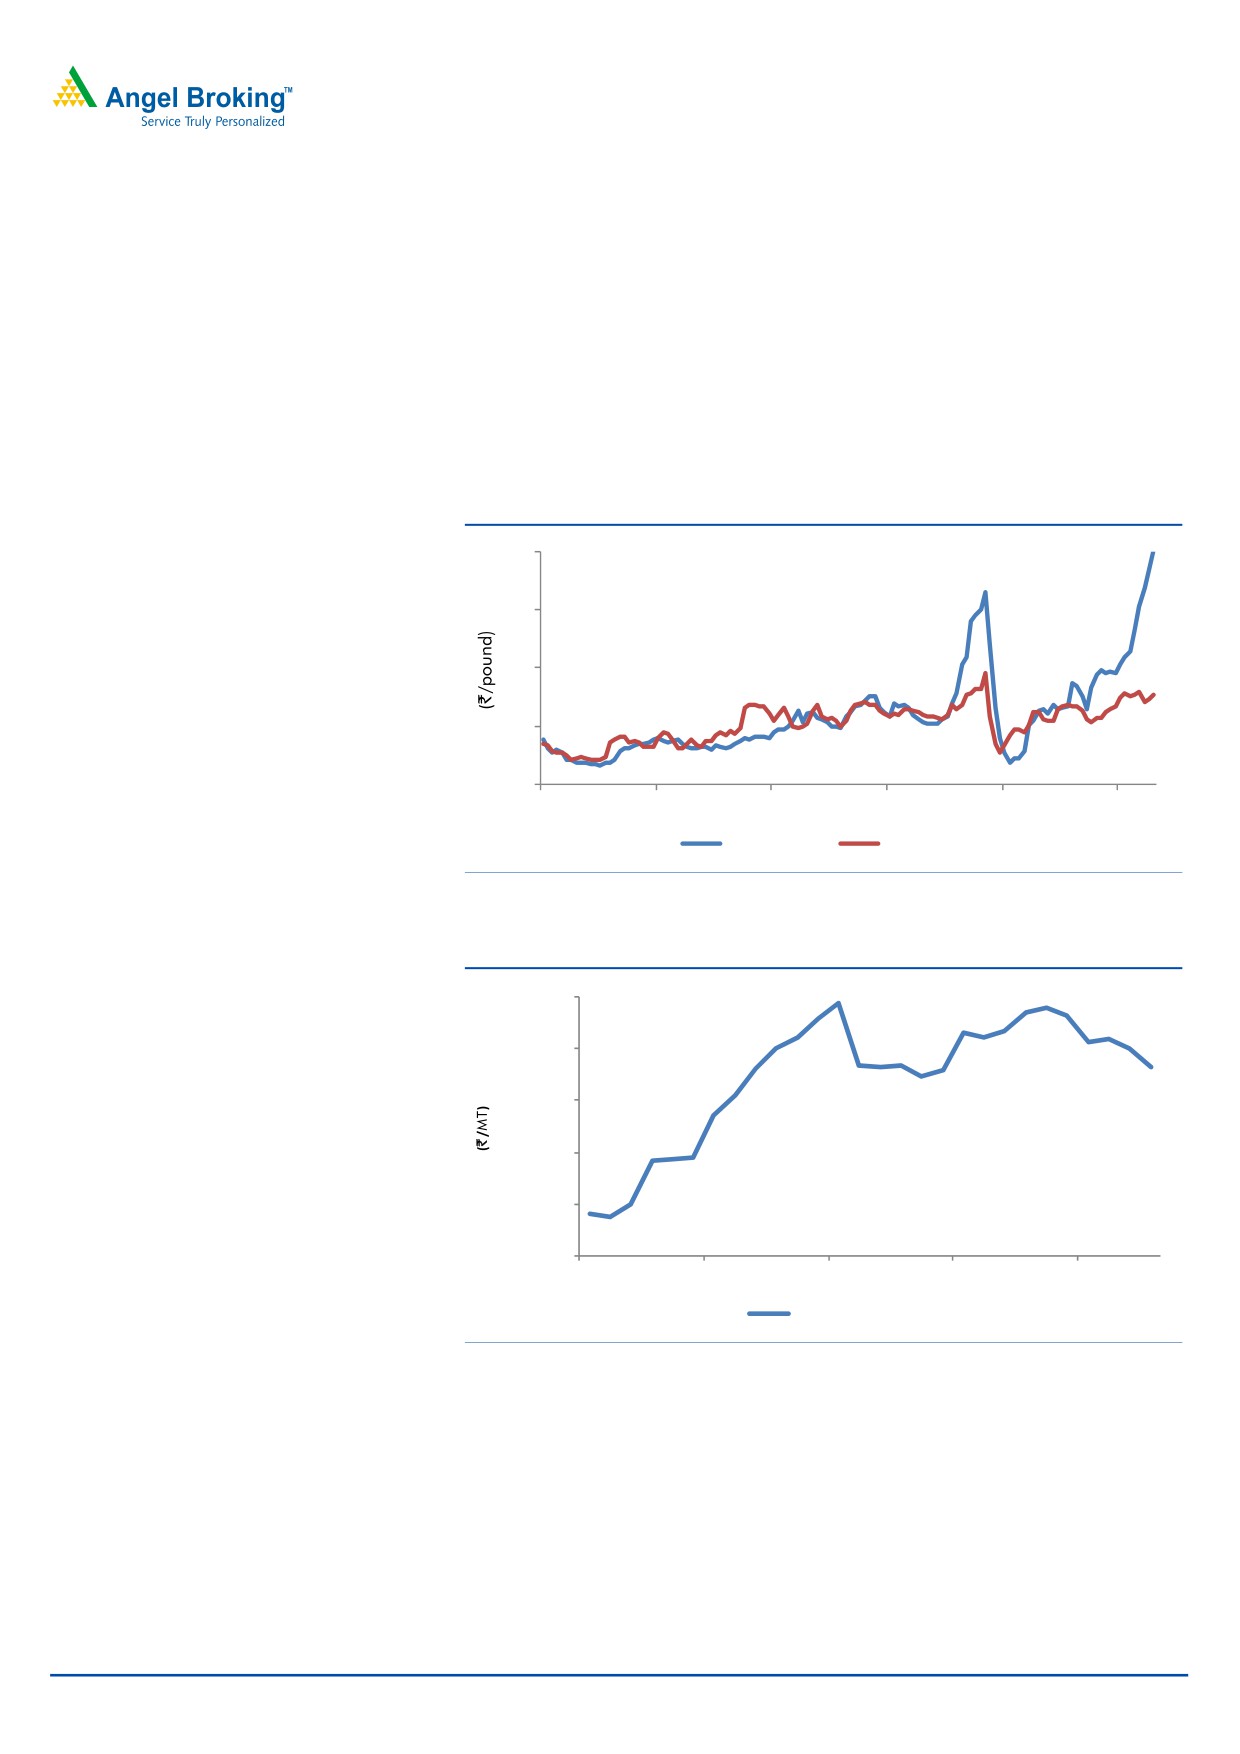
Raw-material supply and price volatility
Acrylonitrile, butadiene and styrene are the key raw materials for production of
ABS and SAN. About 81% of the total raw material used for the production is
imported. Supply of these raw materials is quite tight and inflexible. Moreover,
their prices have been fluctuating in a wide range, which in turn is likely to
negatively affect the company’s margins. On the back of high feedstock prices,
prices for ABS are also expected to rise.
Exhibit 8: Butadiene and Styrene price trend
80
60
40
20
0
Jan-01
Jan-03
Jan-05
Jan-07
Jan-09
Jan-11
Butadiene
Styrene
Source: Bloomberg
Exhibit 9: Acrylonitrile price trend
150,000
130,000
110,000
90,000
70,000
50,000
May-09
Nov-09
May-10
Nov-10
May-11
Acrylonitrile
Source: Bloomberg
October 5, 2011
6
Advisory Desk
INEOS ABS India
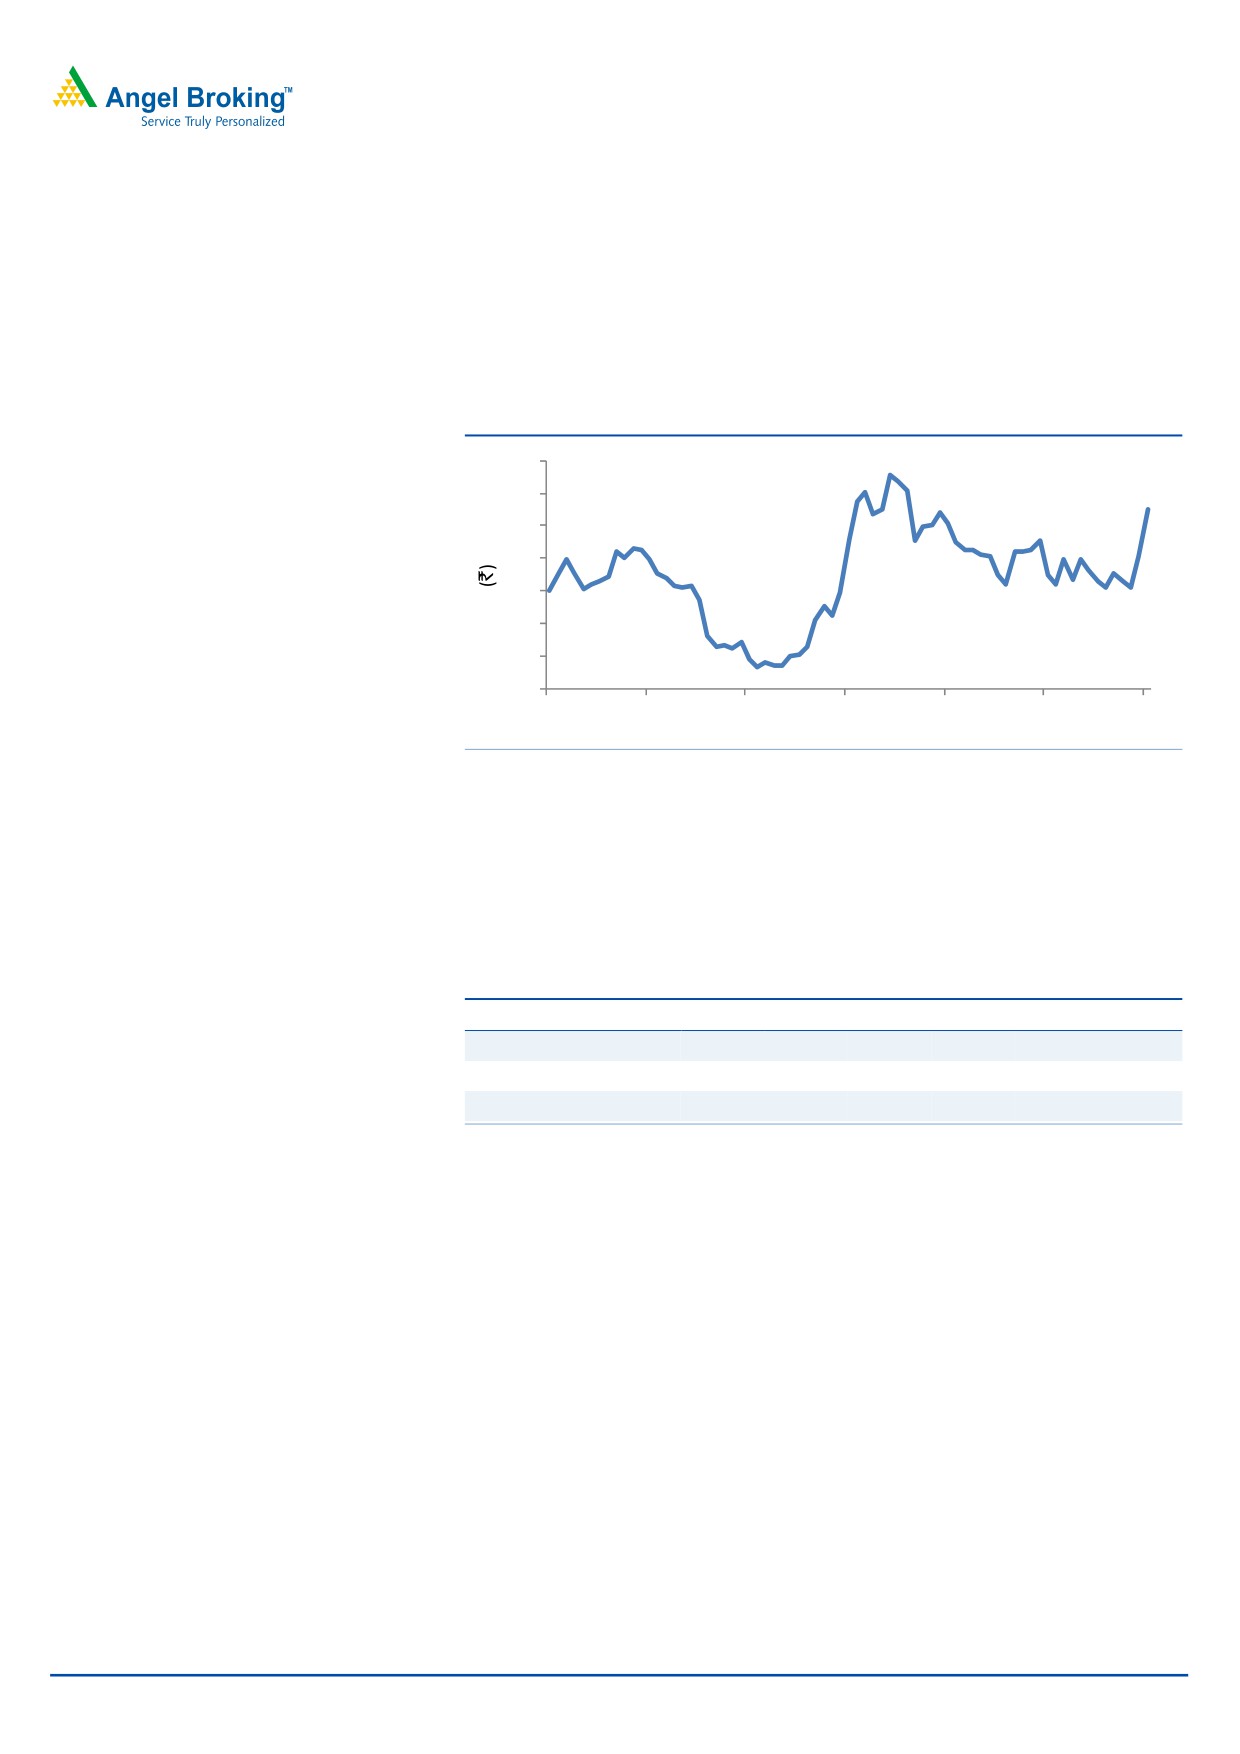
Exchange rate fluctuations
Raw materials form nearly 80% of the total operating cost, of which 81% is
imported. The exchange rate fluctuation can have an adverse effect on cost and,
thereby, the margins, so is a risk factor.
Exhibit 10: INR/USD Exchange Rate
52
50
48
46
44
42
40
38
Sep-05
Sep-06
Sep-07
Sep-08
Sep-09
Sep-10
Sep-11
Source: Bloomberg
Imports cheap as compared to domestic ABS
Imported ABS is available at a cheaper rate as compared to domestically available
ABS. Though the percentage price difference between international and domestic
ABS has narrowed, there is still a gap of around 18%.
Exhibit 11: International and domestic price variation of ABS
Particulars
2006
2007
2008
2009
2010
2011
International ABS price (`)
80,745
83,596
83,820
92,905
84,773
107,686
INEOS ABS price (`)
96,838
104,262
108,822
122,879
101,097
127,226
Price difference (%)
20
25
30
32
19
18
Source: Company, Department of Commerce
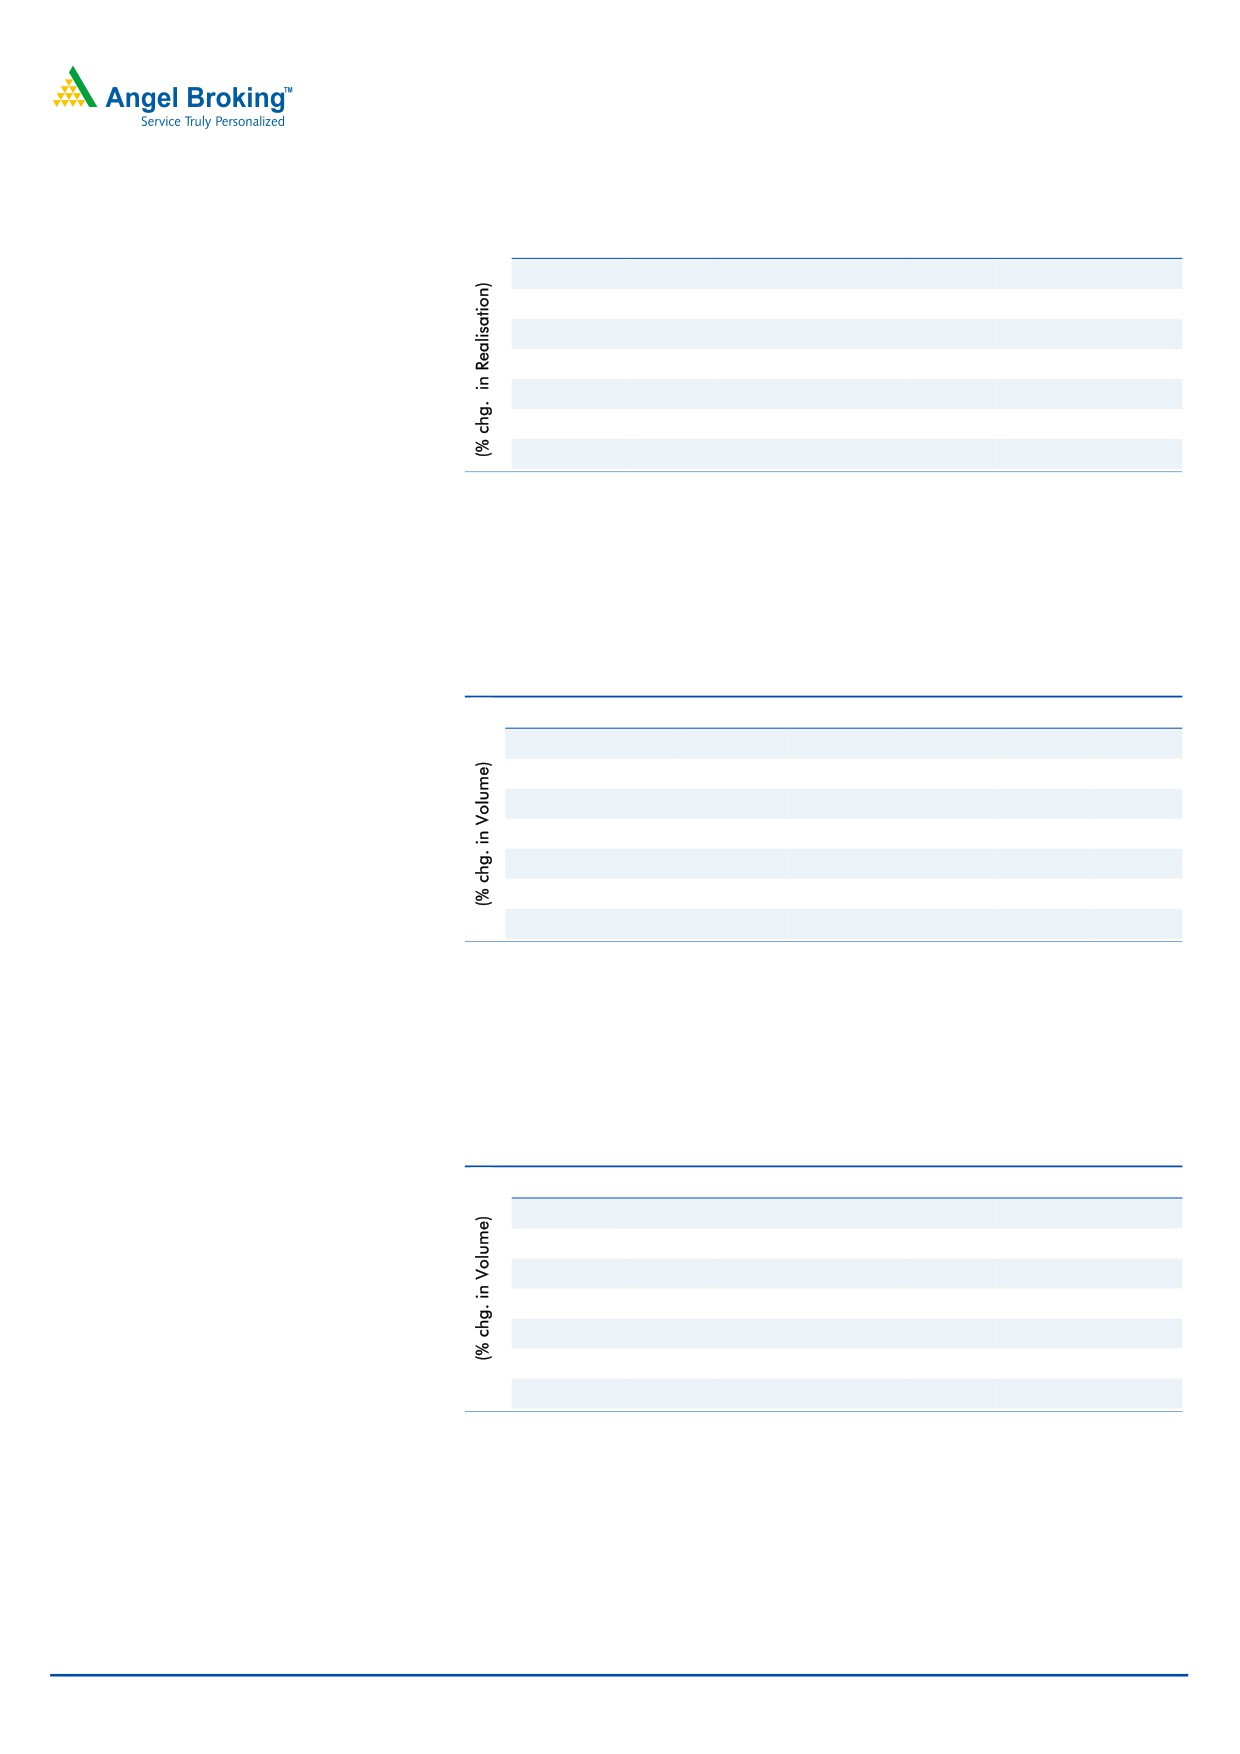
Sensitivity analysis of EPS
a) Realisation & Butadiene prices
The sensitivity analysis reflects the changes in EPS with respect to the
percentage change in realisation and butadiene prices. We have assumed
realisation to grow at 14.4% yoy in CY2012E and butadiene prices to grow at
10% yoy in CY2012E which will lead to EPS of `44.
October 5, 2011
7
Advisory Desk
INEOS ABS India
Exhibit 12: Impact on EPS w.r.t. % chg. in realisation & butadiene prices
(% chg. in Butadiene prices)
(10)%
0%
10%
20%
30%
50%
(10)%
(23.2)
(28.7)
(34.1)
(39.6)
(45.0)
(56.0)
0%
8.8
3.3
(2.1)
(7.6)
(13.0)
(24.0)
10%
40.8
35.4
29.9
24.4
19.0
8.0
14.4%
54.9
49.4
44.0
38.5
33.1
22.1
20%
72.8
67.4
61.9
56.4
51.0
40.1
25%
88.8
83.4
77.9
72.4
67.0
56.1
Source: Angel Research
b) Volume & Butadiene prices
A 10% yoy growth in CY2012E in volume and 10% yoy growth in butadiene
prices in CY2012E would deliver EPS of `44.
Exhibit 13: Impact on EPS w.r.t. % chg. in volume & butadiene prices
(% chg. in Butadiene prices)
(10)%
0%
10%
20%
30%
(10)%
105.5
101.1
96.6
92.1
87.7
0%
80.2
75.2
70.2
65.3
60.3
5%
67.5
62.3
57.0
51.8
46.6
10%
54.8
49.3
43.9
38.4
32.9
15%
42.1
36.4
30.7
25.0
19.3
20%
29.4
23.5
17.5
11.5
5.6
Source: Angel Research
c) Volume & Realisation
A growth of 10% yoy in CY2012E in volume and 14.4% yoy in CY2012E in
realisation would raise the EPS to `44.
Exhibit 14: Impact on EPS w.r.t. % chg. in volume & realisation
(% chg. in Realisation)
(10)%
0%
10%
14.4%
20%
25%
(10)%
18.6
50.6
82.6
96.7
114.6
130.6
0%
(7.8)
24.3
56.3
70.3
88.3
104.3
5%
(20.9)
11.1
43.1
57.2
75.1
91.1
10%
(34.1)
(2.1)
29.9
44.0
61.9
77.9
15%
(47.3)
(15.3)
16.7
30.8
48.7
64.7
20%
(60.5)
(28.5)
3.5
17.6
35.5
51.5
Source: Angel Research
October 5, 2011
8
Advisory Desk
INEOS ABS India
Competition
In the domestic market, INEOS ABS Ltd. holds 60% market share in ABS resins
segment and 68% in SAN resins segment while the remaining 40% in ABS resins
and 32% in SAN resins is held by Bhansali Engg. Ltd. As per CRISIL Research, total
demand for ABS is expected to grow by 10% CAGR during CY2010-15E to
~177,400 TPA. Assuming the market share of existing players to remain constant,
sales volume of INEOS is expected to almost double from 55,068 TPA in CY2010
to 106,440 TPA in CY2015E.
Exhibit 15: ABS volume growth
ABS trend
2008-09
2009-10
2014-15E
CAGR %
Volume
Market Volume Market Volume Market
2010-
(TPA) share (%) (TPA) share (%) (TPA) share (%)
2015E
INEOS ABS Ltd.
51,495
63
55,068
60
106,440
60
17
Bhansali Engg. Ltd.
30,667
37
36,022
40
70,960
40
17
Source: CRISIL Research, Angel Research
On the valuation front, the company is trading at attractive PE of 13.6x and P/BV
of 2.7x on TTM basis. Even on the ROE front, INEOS has delivered better returns of
around 20% compared to peer average of 16%.
Exhibit 16: Relative valuation
Net
EV/
Y/E June 2011
OPM
PAT EPS ROE P/E P/BV
EV/
Sales
Sales
(TTM)
(%)
(` cr)
(`)
(%)
(x)
(x) EBITDA (x)
(` cr)
(x)
INEOS ABS
804
14.1
72
40
20
13.6
2.7
7.4
1.0
Bhansali Engg.
450
12.3
38
2
17
10.9
1.9
8.2
1.0
BASF India
3,056
7.1
134
31
14
19.3
2.7
12.4
0.9
Clariant Chemicals
1,003
14.9
114
43
18
16.6
3.1
12.9
1.9
Source: Capital Line
October 5, 2011
9
Advisory Desk
INEOS ABS India
Petrochemicals - Polymers industry
According to CRISIL Research, global demand for polymers is expected to grow
by 4-4.5% CAGR during CY2010-15E, while domestic demand is expected to
increase at a CAGR of 10% during the same period.
ABS is an engineering or performance plastic product with applications in home
appliances, electronics and automobiles. According to CRISIL Research, the
domestic ABS industry is expected to grow by 17% yoy to 127,000 TPA in CY2011
due to healthy demand from the automobiles and home appliances segments.
The domestic ABS market is duopolistic in nature. INEOS ABS and Bhansali
Engineering are the major players in the ABS segment.
Exhibit 17: Capacity structure of ABS (TPA)
Company
Location
2009-10
2010-11
2011-12E
INEOS ABS India
Baroda, Gujarat
60,000
80,000
110,000
Bhansali Engg.
Aburoad, MP
50,000
51,000
75,000
Source: Industry, CRISIL Research
End-user industry and uses of ABS
ABS resins are composed of 50% styrene and varying amounts of butadiene and
acrylonitrile. Styrene provides rigidity and ease of processing, acrylonitrile offers
chemical resistance and heat stability and butadiene gives toughness and impact
strength. ABS applications are based on its properties such as lightweight, ability to
comprise various colors, good product finish and strength in withstanding
vibrations.
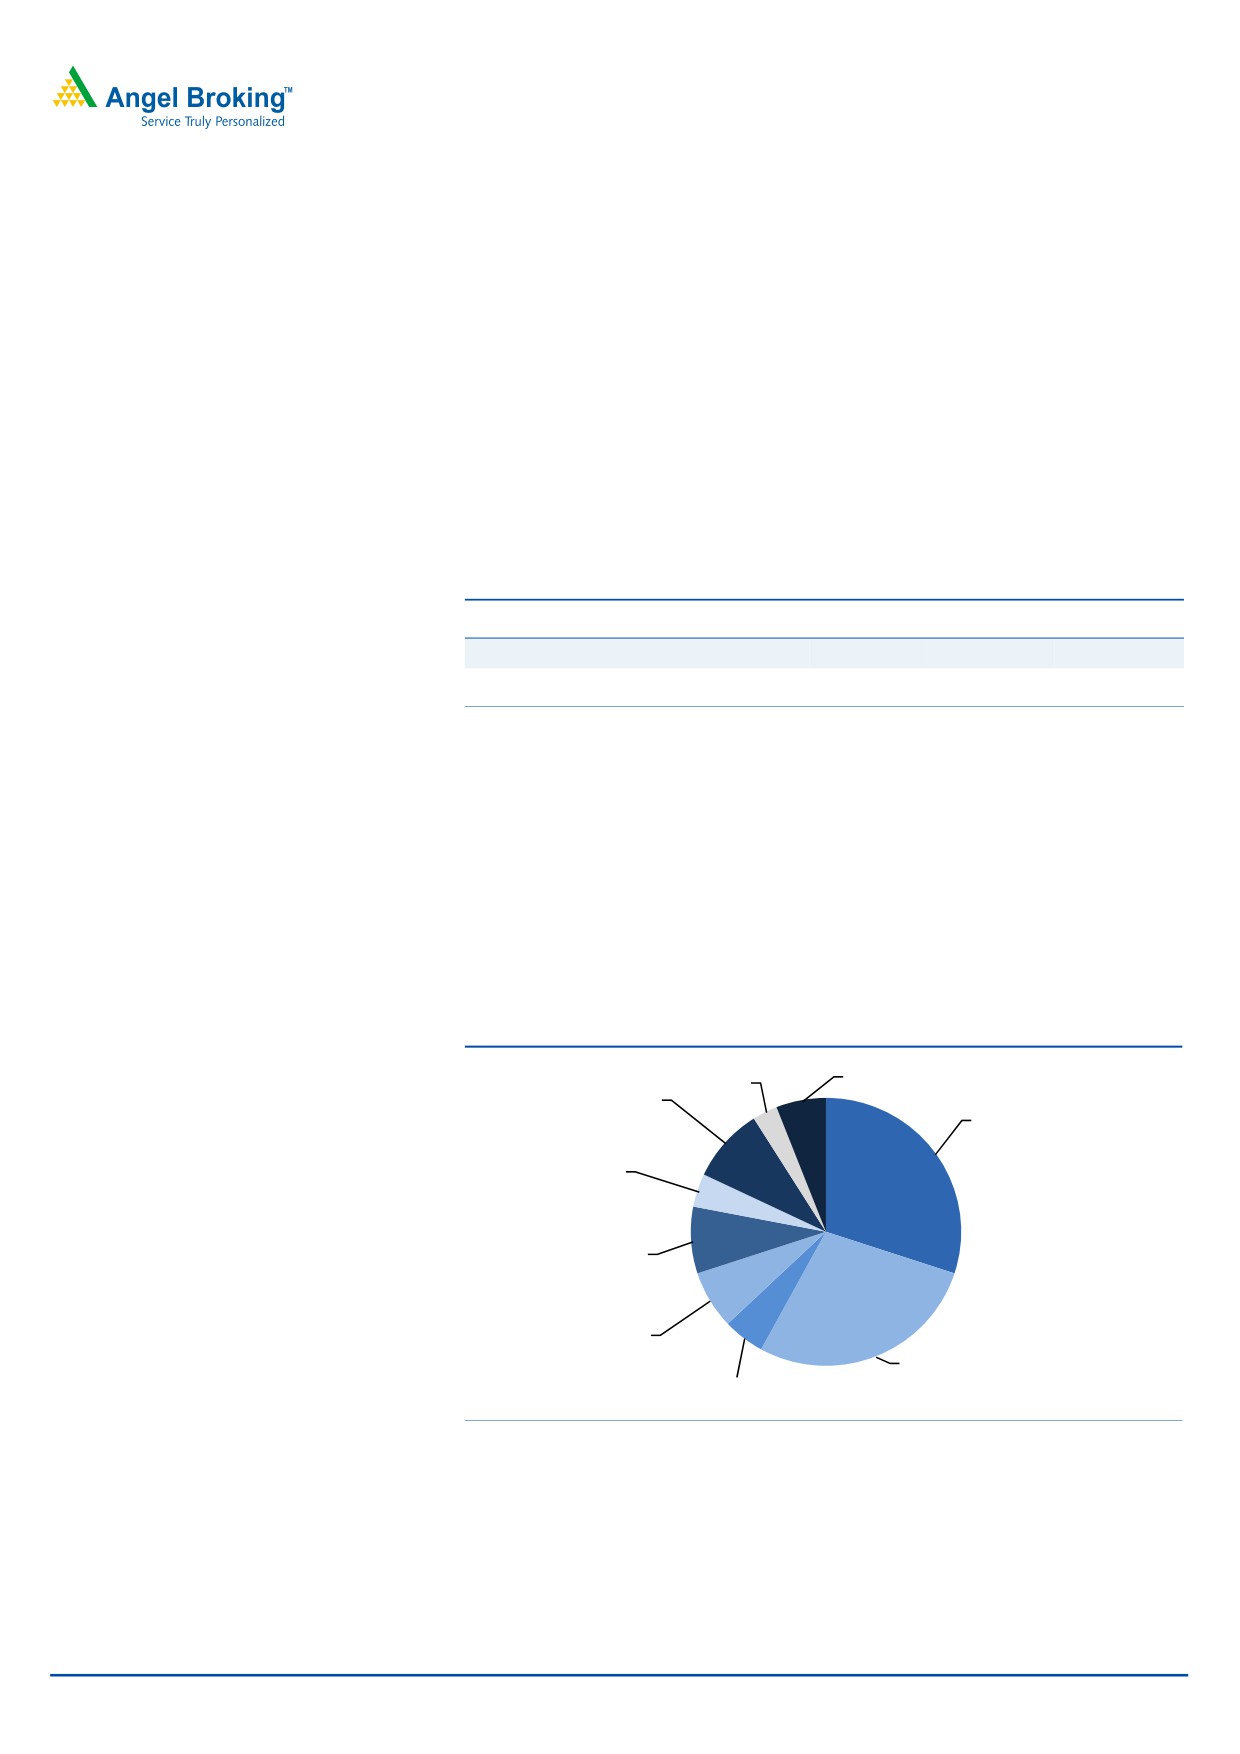
Exhibit 18: Use of ABS in various sectors in India
Others
Textiles
6%
Stationary/
3%
helmet
Home Appliances
9%
30%
Luggage & bus
body
4%
Business machine
office automation
8%
Electrical &
electronics
Automobiles
7%
Telecom
28%
5%
Source: Industry, CRISIL Research
Growth will continue to come from home appliances (including refrigerators,
washing machines and air conditioners), automobiles and business machines and
office automation segments. These three segments alone account for around 70%
of total demand in CY2010-11.
October 5, 2011
10
Advisory Desk
INEOS ABS India
Exhibit 19: ABS - End-use market trend
2010-11E
2010-11E
2015-16 E
2015-16 E
End-use market
(TPA)
(% share)
(TPA)
(% share)
Automobiles
41,224
32.5
70,723
30.8
Home appliances
37,424
29.5
77,254
33.7
Telecom
5,226
4.1
8,417
3.7
Electrical and electronics
8,330
6.6
16,304
7.1
Business machine office automation
11,254
8.9
18,792
8.2
Luggage and bus body
3,625
2.9
5,838
2.5
Stationary/helmet
9,652
7.6
16,264
7.1
Textiles
3,333
2.6
4,661
2
Others
6,893
5.4
11,101
4.8
Source: Industry, CRISIL Research
October 5, 2011
11
Advisory Desk
INEOS ABS India
INEOS Group
INEOS Group, the holding company of INEOS ABS India Ltd., is a leading and
global manufacturer of petrochemicals, specialty chemicals and oil products. The
company has a turnover of around US$28.4bn and comprises 15 businesses (all
these businesses have a major chemical heritage). Leading market positions allow
INEOS Group to be the supplier of choice for many of the largest customers in our
markets. The company’s production network spans 61 manufacturing facilities in
13 countries throughout the world; the group produces more than 40mn TPA of
petrochemicals and 20mn TPA of crude oil refined products (fuels) each year.
Company background
Incorporated in 1973 as ABS Plastics Ltd., the company is now known as INEOS
ABS India Ltd. Ineos Group holds an 83% share in the company. INEOS is a
leading manufacturer of an engineering plastic named ABS.
The company has three manufacturing plants in Gujarat at Nandesari, Katol and
Moxi. The Nandesari plant manufactures ABSOLAC (ABS polymer), while the Katol
plant produces ABSOLAN (SAN polymer). The Moxi plant blends the resins
manufactured at the above two plants in the required proportion to get the desired
grade of output. At Moxi, the company has a research and application
development cell to meet R&D requirements of global LANXESS activities in areas
of a) process and product development b) polymer characterisation c) tailor-made
grades and special color development.
Windmill Farm
The company has installed wind turbine generators (WTG) at Lamba, Dhank and
Pransala in Gujarat. Wind farms have been an important source of energy
generation, which in turn has reduced the power consumption worth 8 mio units.
Power generated by the windmills has enabled the company to rationalise its
power cost, which constitutes around 4% of the total operating cost.
Debt-free and cash-rich position
The company has zero debt with a cash surplus (including investments) of around
`147cr in June 2011, which will enable the company to finance the extended
capacity through internal accruals.
Tailor-made products as per market & consumer demand
ABS can be easily used in specific applications by co-polymerising i.e., changing
polymer composition and blending. Thus, taking advantage of its flexibility of
composition and structure, allowing its use in diverse applications, the company
has launched various tailor-made products.
October 5, 2011
12
Advisory Desk
INEOS ABS India
Exhibit 20: Product development
Product development
End-use products
Blend of ABS/PMMA
LCD TV market
Low gloss ABS
Bus roof and automotive body interior
Nylon/ABS blend
Indian automotive markets
ESCR grade extrusion grade ABS
Refrigerator application
Glass filled ABS
AC blower application
Source: Company
Products
The company manufactures two products ABSOLAC (ABS) and ABSOLYN (SAN).
ABS constitutes nearly 86% of the company’s total revenue, while SAN constitutes
14% of revenue.
ABSOLAC
ABS (acrylonitrile butadiene styrene) polymer is a versatile engineering plastic
accepted as a substitute for conventional materials. The mechanical and thermal
properties of ABS are comparable to metals. It is a high performance plastic, used
predominantly in automobiles and consumer durables. ABS also has its application
in refrigerator liners, telecommunications, consumer electronics, computer cabinets
and cameras.
Exhibit 21:International prices & margins of ABS
2500
2000
1500
1000
500
0
1999
2001
2003
2005
2007
2009
2011E
ABS Prices
Margins
Source: CRISIL Research
Considering the industry volume growth of ABS to reach ~177,400 TPA in
CY2014-15E and assuming the market share to remain constant, ABS sales
volume for INEOS is expected to grow at a CAGR of 17% during CY2010-15E.
October 5, 2011
13
Advisory Desk
INEOS ABS India
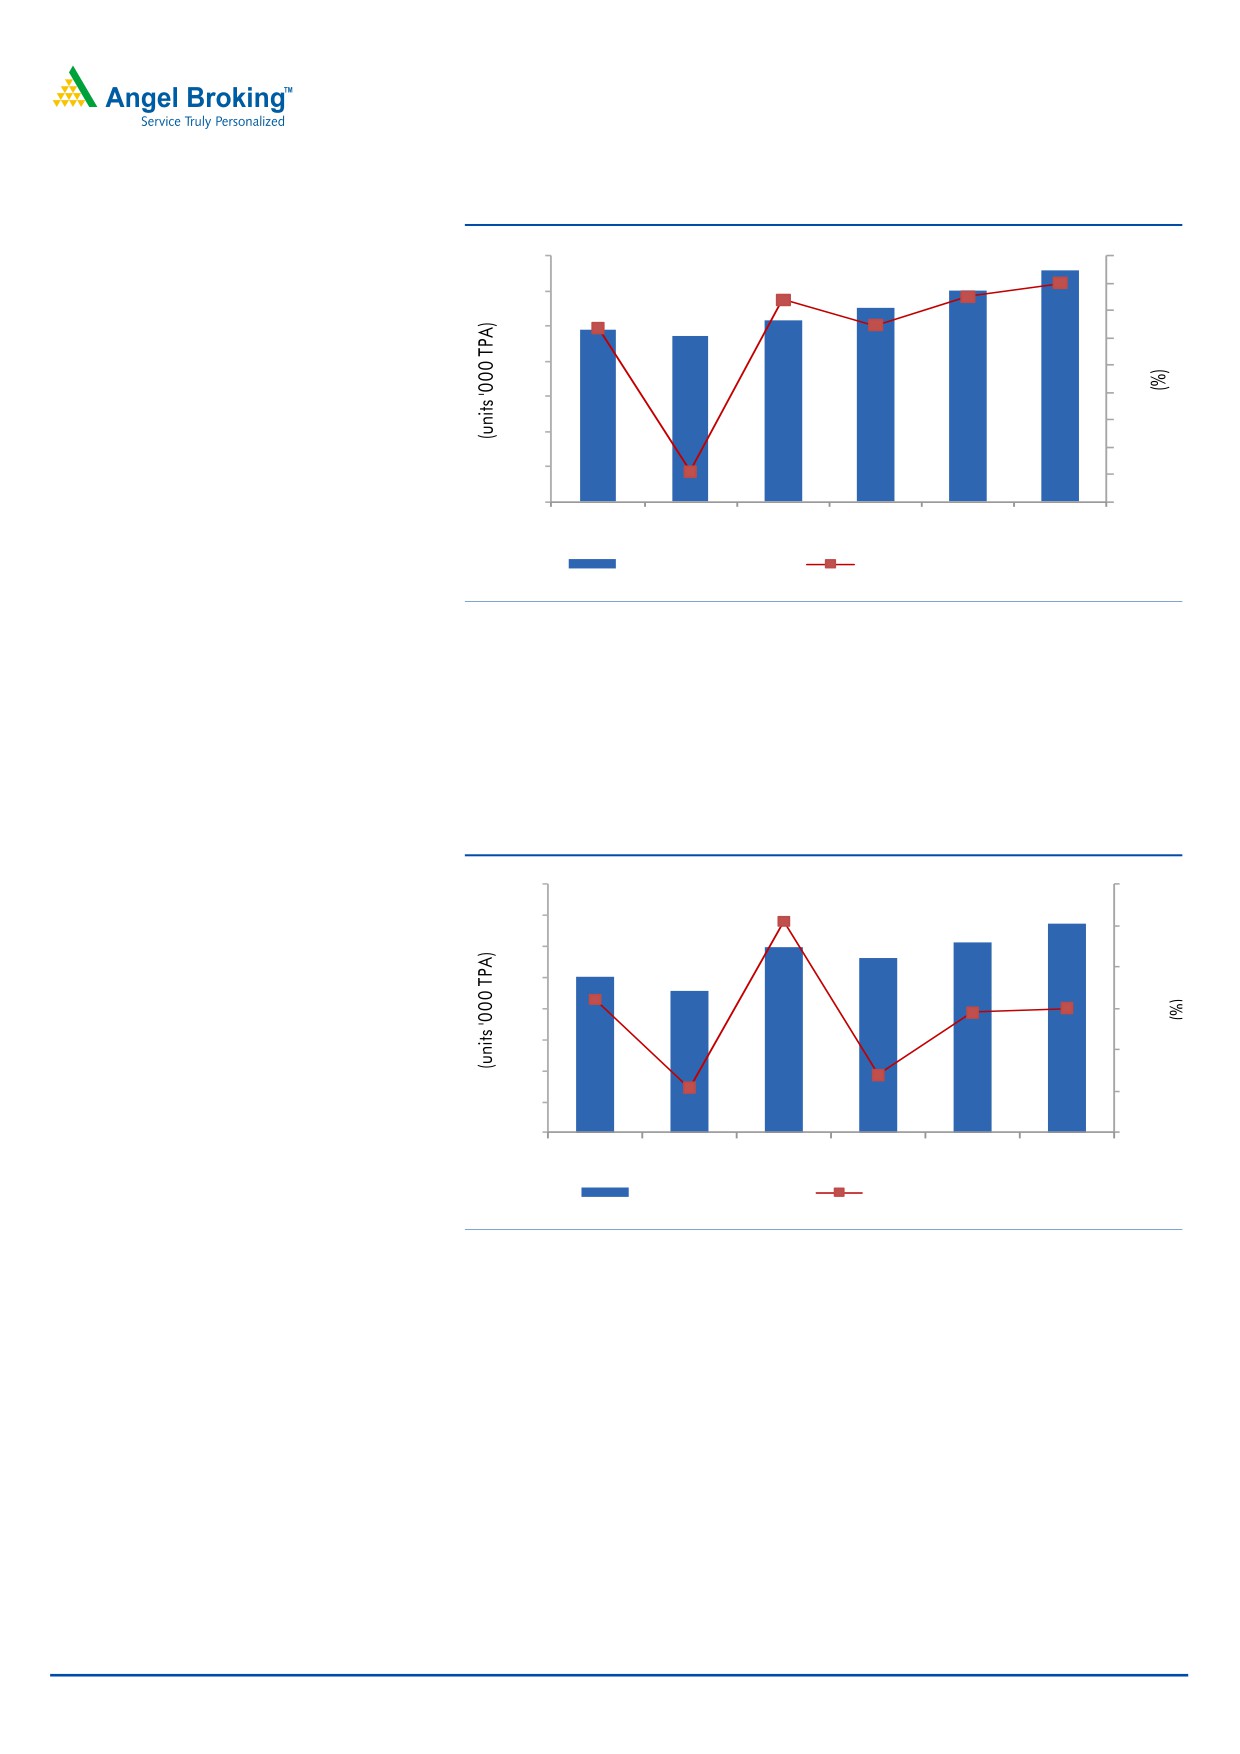
Exhibit 22: ABS volume & value growth
12
70
10
60
8
50
6
40
4
30
2
0
20
(2)
10
(4)
0
(6)
CY2007
CY2008
CY2009
CY2010 CY2011E CY2012E
ABS Resins (LHS)
ABS volume growth (RHS)
Source: Company, Angel Research
ABSOLAN
SAN (styrene acrylonitrile) is a polymerised plastic resin giving 95% transparent
finish. It has its applications in lightings, stationeries and novelties, refrigerators
and cosmetic packing.
Exhibit 23: SAN volume & value growth
16
40
14
30
12
20
10
8
10
6
0
4
(10)
2
0
(20)
CY2007
CY2008
CY2009
CY2010
CY2011E CY2012E
SAN Resins (LHS)
SAN volume growth (RHS)
Source: Company, Angel Research
ABS segment has capacity of 60,000 TPA and the utilisation rate is 91.5%, while
the SAN segment is equipped with 60,000 TPA capacity utilised at
82.4%.
Additional capacity of 20,000 TPA for ABS is operational since early 2011, while
the company has plans to further augment the capacity to 110,000 TPA. To
support the additions in ABS production, SAN capacity is also planned to be
extended to 100,000 TPA.
October 5, 2011
14
Advisory Desk
INEOS ABS India
Standalone profit & loss account
Y/E December (` cr)
CY2007
CY2008
CY2009
CY2010
CY2011E
CY2012E
Gross sales
644
689
606
816
1008
1153
Less: Excise duty
87
85
47
74
112
104
Net Sales
557
604
559
742
896
1049
Other operating income
-
-
-
-
-
-
Total operating income
557
604
559
742
896
1049
% chg
-
8
(7)
33
21
17
Net Raw Materials
410
467
360
522
663
787
% chg
-
14
(23)
45
27
19
Other Mfg costs
29
33
34
36
44
49
% chg
-
12
6
6
21
12
Personnel
14
17
18
20
26
26
% chg
-
15
6
16
28
1
Other
41
51
61
51
62
69
% chg
-
25
19
(16)
21
12
Total Expenditure
494
495
496
497
498
499
EBITDA
63
37
86
113
101
117
% chg
-
(42)
133
31
(10)
16
(% of Net Sales)
11
6
15
15
11
11
Depreciation& Amortisation
14
15
14
14
16
23
EBIT
50
22
72
99
85
94
% chg
-
(55)
222
38
(14)
11
(% of Net Sales)
9
4
13
13
10
9
Interest & other charges
1
2
1
2
0
0
Other Income
6
7
4
5
12
16
(% of Net Sales)
1
1
1
1
1
2
Extraordinary Expense/(Inc.)
1
-
-
-
-
-
PBT (reported)
54
27
75
103
97
110
Tax
19
9
26
33
29
33
(% of PBT)
35
34
35
32
30
30
PAT (reported)
34
18
49
70
68
77
PAT after MI (reported)
34
18
49
70
68
77
ADJ. PAT
34
18
49
70
68
77
% chg
0
(48)
171
43
(3)
14
(% of Net Sales)
6
3
9
9
8
7
Basic EPS (`)
20
10
28
40
39
44
Fully Diluted EPS (`)
20
10
28
40
39
44
% chg
0
(48)
171
43
(3)
14
Dividend
5
4
6
7
8
10
Retained Earning
29
14
43
63
59
67
October 5, 2011
15
Advisory Desk
INEOS ABS India
Standalone balance sheet
Y/E December (` cr)
CY2007
CY2008
CY2009
CY2010
CY2011E
CY2012E
SOURCES OF FUNDS
Equity Share Capital
18
18
18
18
18
18
Preference Capital
-
-
-
-
-
-
Reserves& Surplus
200
213
255
317
376
443
Shareholders’ Funds
218
231
272
334
394
461
Minority Interest
-
-
-
-
-
-
Total Loans
-
-
-
-
-
-
Deferred Tax Liability
30
29
27
25
25
25
Total Liabilities
247
259
300
360
419
486
APPLICATION OF FUNDS
Gross Block
280
307
310
318
365
457
Less: Acc. Depreciation
140
154
168
181
198
220
Net Block
140
153
142
136
168
236
Capital Work-in-Progress
24
8
11
12
13
14
Lease adjustment
-
-
-
-
-
-
Goodwill
-
-
-
-
-
-
Investments
24
45
71
93
93
93
Current Assets
213
179
199
281
358
391
Cash
40
32
37
60
27
(15)
Loans & Advances
15
18
19
41
108
147
Inventory
69
56
57
71
89
102
Debtors
89
74
85
109
134
157
Current liabilities
155
127
128
166
212
249
Net Current Assets
58
52
71
115
145
143
Misc. Exp. not written off
-
-
-
-
-
-
Total Assets
247
259
300
360
419
486
October 5, 2011
16
Advisory Desk
INEOS ABS India
Key ratios
Y/E December
CY2007
CY2008
CY2009
CY2010
CY2011E
CY2012E
Valuation Ratio (x)
P/E (on FDEPS)
28.5
54.4
20.1
14.0
14.5
12.7
P/CEPS
20.5
30.0
15.5
11.7
11.7
9.8
P/BV
4.5
4.3
3.6
2.9
2.5
2.1
Dividend yield (%)
0.5
0.4
0.6
0.7
0.9
1.0
EV/Net sales
1.6
1.5
1.6
1.1
1.0
0.9
EV/EBITDA
14.5
24.5
10.1
7.3
8.5
7.7
EV / Total Assets
3.7
3.5
2.9
2.3
2.1
1.9
Per Share Data (`)
EPS (Basic)
19.6
10.3
27.9
39.8
38.5
43.9
EPS (fully diluted)
19.6
10.3
27.9
39.8
38.5
43.9
Cash EPS
27.3
18.6
36.1
47.8
47.7
56.8
DPS
3.0
2.5
3.5
4.0
4.8
5.8
Book Value
123.9
131.2
154.9
190.1
223.8
261.9
DuPont Analysis
EBIT margin
8.9
3.7
12.8
13.3
9.5
9.0
Tax retention ratio
0.6
0.7
0.7
0.7
0.7
0.7
Asset turnover (x)
3.5
3.5
3.1
3.8
3.1
2.7
ROIC (Post-tax)
20.2
8.5
26.1
34.6
20.8
16.8
Cost of Debt (Post Tax)
-
-
-
-
-
-
Leverage (x)
(0.3)
(0.3)
(0.4)
(0.5)
(0.3)
(0.2)
Operating ROE
14.3
5.7
15.7
18.8
14.5
14.0
Returns (%)
ROCE (Pre-tax)
20.1
8.6
24.0
27.5
20.3
19.4
Angel ROIC (Pre-tax)
31.3
12.8
39.9
50.7
29.7
24.0
ROE
15.8
7.8
18.0
21.0
17.2
16.7
Turnover ratios (x)
Asset TO (Gross Block)
2.0
2.0
1.8
2.3
2.5
2.3
Inventory / Net sales (days)
45
34
38
35
36
36
Receivables (days)
58
44
56
54
55
55
Payables (days)
114
81
99
96
97
97
WC cycle (ex-cash) (days)
12
12
22
27
48
55
Solvency ratios (x)
Net debt to Equity
(0.3)
(0.3)
(0.4)
(0.5)
(0.3)
(0.2)
Net debt to EBITDA
(1.0)
(2.1)
(1.3)
(1.3)
(1.2)
(0.7)
Int. Coverage (EBIT/ Int.)
42.6
11.6
55.6
55.0
-
-
October 5, 2011
17
Advisory Desk
INEOS ABS India
Advisory Team Tel: (91) (022) 39500777
DISCLAIMER
This document is solely for the personal information of the recipient, and must not be singularly used as the basis of any investment
decision. Nothing in this document should be construed as investment or financial advice. Each recipient of this document should make
such investigations as they deem necessary to arrive at an independent evaluation of an investment in the securities of the companies
referred to in this document (including the merits and risks involved), and should consult their own advisors to determine the merits and
risks of such an investment.
Angel Broking Limited, its affiliates, directors, its proprietary trading and investment businesses may, from time to time, make
investment decisions that are inconsistent with or contradictory to the recommendations expressed herein. The views contained in this
document are those of the analyst, and the company may or may not subscribe to all the views expressed within.
Reports based on technical and derivative analysis center on studying charts of a stock's price movement, outstanding positions and
trading volume, as opposed to focusing on a company's fundamentals and, as such, may not match with a report on a company's
fundamentals.
The information in this document has been printed on the basis of publicly available information, internal data and other reliable
sources believed to be true, but we do not represent that it is accurate or complete and it should not be relied on as such, as this
document is for general guidance only. Angel Broking Limited or any of its affiliates/ group companies shall not be in any way
responsible for any loss or damage that may arise to any person from any inadvertent error in the information contained in this report.
Angel Broking Limited has not independently verified all the information contained within this document. Accordingly, we cannot testify,
nor make any representation or warranty, express or implied, to the accuracy, contents or data contained within this document. While
Angel Broking Limited endeavors to update on a reasonable basis the information discussed in this material, there may be regulatory,
compliance, or other reasons that prevent us from doing so.
This document is being supplied to you solely for your information, and its contents, information or data may not be reproduced,
redistributed or passed on, directly or indirectly.
Angel Broking Limited and its affiliates may seek to provide or have engaged in providing corporate finance, investment banking or
other advisory services in a merger or specific transaction to the companies referred to in this report, as on the date of this report or in
the past.
Neither Angel Broking Limited, nor its directors, employees or affiliates shall be liable for any loss or damage that may arise from or in
connection with the use of this information.
Note: Please refer to the important `Stock Holding Disclosure' report on the Angel website (Research Section). Also, please refer to the
latest update on respective stocks for the disclosure status in respect of those stocks. Angel Broking Limited and its affiliates may have
investment positions in the stocks recommended in this report.
Disclosure of Interest Statement
INEOS ABS (India) Ltd
1. Analyst ownership of the stock
No
2. Angel and its Group companies ownership of the stock
No
3. Angel and its Group companies' Directors ownership of the stock
No
4. Broking relationship with company covered
No
Note: We have not considered any Exposure below ` 1 lakh for Angel, its Group companies and Directors
Ratings (Returns):
Buy (> 15%)
Accumulate (5% to 15%)
Neutral (-5 to 5%)
Reduce (-5% to 15%)
Sell (< -15%)
October 5, 2011
18