Initiating Coverage | FMCG
March 31, 2014
Heritage Foods
BUY
CMP
`200
Bottom-line growth to sustain despite retail losses
Target Price
`275
Investment Period
12 Months
Heritage Foods (India) Ltd. (HFL), based in Hyderabad, is among the leading
corporates in the dairy industry. HFL has ~77% of its revenue coming in from the
dairy business. The dairy industry, as per industry reports, is expected to grow at a
Stock Info
CAGR of 13-15% till FY2020. The expected robust growth would be on the back
Sector
FMCG
of the urbanization trend, leading to changing consumption patterns backed by
Market Cap (` cr)
464
increasing disposable incomes. Being one of the leading players in south India
Net Debt (` cr)
72
with established brands, we expect the boom in the dairy industry to drive growth
Beta
1.1
for HFL. However, we believe the company’s retail segment, which has been
52 Week High / Low
272/169
incurring losses since inception, will continue to be a drag on its profitability. A
Avg. Daily Volume
7,443
strong growth in the dairy industry, increasing contribution of value added dairy
Face Value (`)
10
products (VADP), and widening geographical reach for dairy products are strong
BSE Sensex
22,214
growth drivers for HFL going forward. We initiate coverage on HFL and
Nifty
6,642
recommend Buy with a target price of `275.
Reuters Code
HTFL.BO
Bloomberg Code
HTFL IN
Investment Rationale
Robust growth in dairy industry to be key driver: India, the largest producer and
Shareholding Pattern (%)
consumer of milk, considers milk as an inevitable part of the diet. Moreover
Promoters
40.0
increasing health consciousness and rising urbanization backed by rising
MF / Banks / Indian Fls
0.8
disposable incomes have led to growth opportunities in the dairy industry. HFL,
FII / NRIs / OCBs
24.7
which is a leading brand in the dairy industry, with established brands and strong
Indian Public / Others
34.4
foothold in south India, is expected to benefit from this boom. Also, changing
consumption pattern has led to increasing demand of VADP, which have lucrative
margins. HFL has been gradually increasing its share in VADP, which is expected
Abs.(%)
3m
1yr
3yr
to boost its EBIT margins eventually.
Sensex
5.4
18.8
18.1
Bottom-line to grow despite Retail losses: The company’s retail segment, which
HTFL
(3.8)
(1.9)
129.2
constitutes 20% of HFL’s total revenue, has been incurring losses of ~5% at the
EBIT level, thereby dragging the overall performance of the company. We expect
the segment to continue to post losses going forward. However, we expect the
bottom-line to post a CAGR of 14.3% over FY2013-16E on the back of robust
dairy industry performance.
Outlook and Valuation: Considering the growth opportunities in the dairy industry,
we expect the company’s top-line and EBITDA to grow at a CAGR of 10.7% and
10.0% respectively over FY2013-16E. We expect PAT CAGR growth to be at
14.3%. Initiating the coverage on HFL, we value the company on SOTP basis. We
have assigned zero value to the retail segment and a PE of 6x FY2016E earnings
to the dairy business which is trading at 4.4x currently; and recommend Buy on the
company with a target price of `275.
Key financials
Heritage
Net sales OPM
PAT
EPS ROIC
P/E
P/BV EV/ EBITDA
Foods Ltd
(` cr)
(%)
(` cr)
(`)
(%)
(x)
(x)
(x)
FY2014E
1,709
5.9
52
22.3
27.7
9.7
2.7
5.7
FY2015E
1,912
6.1
62
26.8
27.5
8.1
2.0
4.9
Twinkle Gosar
Tel: 022- 3935 7800 Ext: 6848
FY2016E
2,171
6.2
76
32.7
28.6
6.6
1.6
4.0
Source: Company, Angel Research; Note: CMP as of March 31, 2014
Please refer to important disclosures at the end of this report
1
Heritage Foods | Initiating Coverage
Investment arguments
Burgeoning dairy consumption- key driver
India is the world’s largest consumer of dairy product, consuming almost 100% of
its milk produce (17% of world’s production). In the last few years, the growth in
production of milk has been ~4% while consumption growth has been at ~11%.
Going forward, according to industry reports, the current market size of US$10bn
of the Indian dairy industry is expected to grow at a CAGR of 13-15% till FY2020.
The expected robust growth would be on the back of various reasons- a) Milk
considered an inevitable part of Indian diet b) Rising health consciousness
c) Heightened consumer interest in protein diets; all coupled with d) Rising
disposable incomes.
According to the Indian Dairy Association (IDA), the organised sector
(co-operatives, producer companies and private players) handles 30% of the
marketable milk surplus. However in interest of both, producer and consumer, it is
necessary to increase the share of the organised sector. Hence, the National Dairy
Plan (NDP) has set a target to increase this share to 65% till 2030. Consequently,
efforts towards increasing the organised sector’s share are expected to benefit and
drive future growth for HFL.
Losses to continue in retail segment
Of the total revenue of the company, dairy contributes a major portion of 77%,
while contribution from the retail segment is ~20% (23% of capital employed).
However, on the EBIT front, the retail segment has been consistently registering
losses since inception, thereby dragging the overall performance of the company.
We believe, going forward, the segment will continue to report losses until it is
hived off or expanded up to the profitable trading space of 3.50 lakhs sq.ft.
Expansion seems to be remotely far, since it would require capex of `108cr as
compared to the existing capital employed of `65cr. Hence, considering the lack
of direction of the decision as of now, we have excluded the segment while valuing
the company.
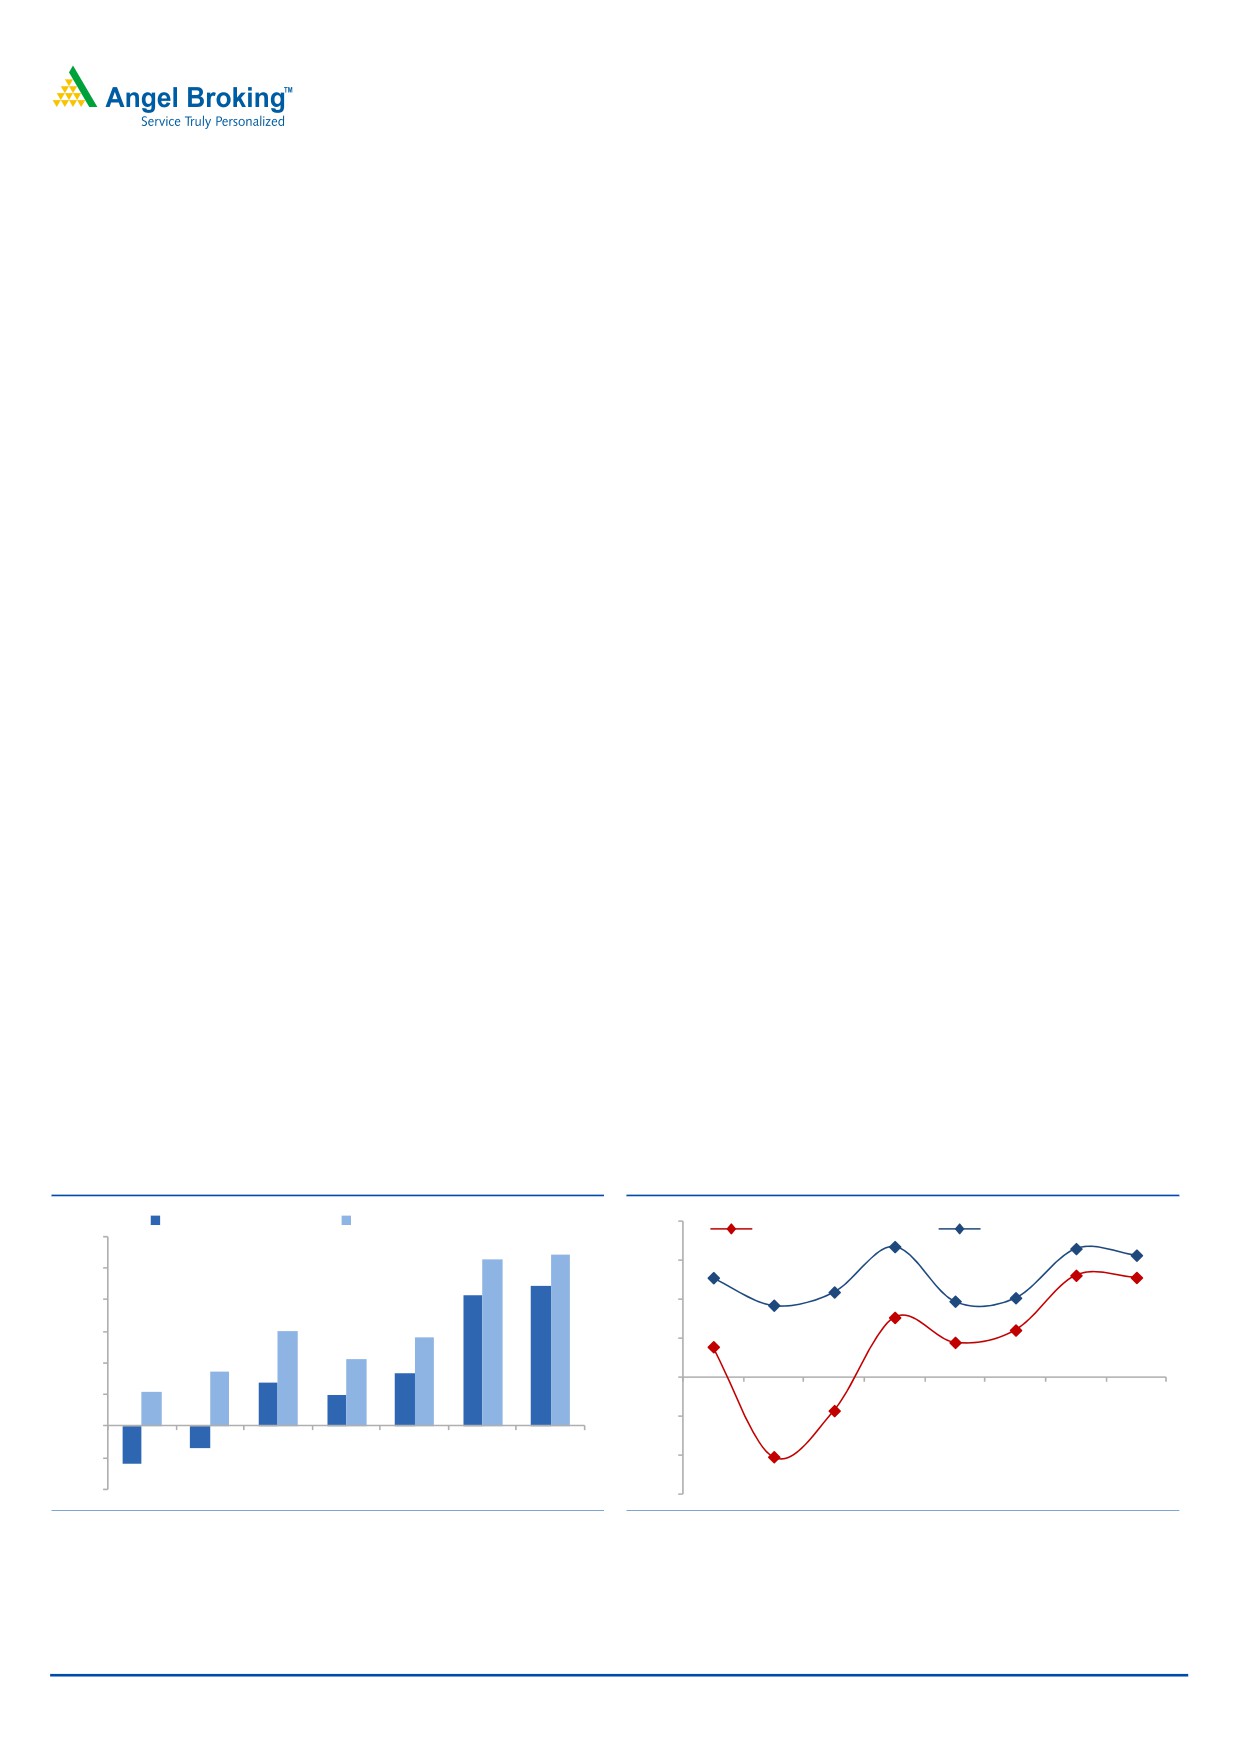
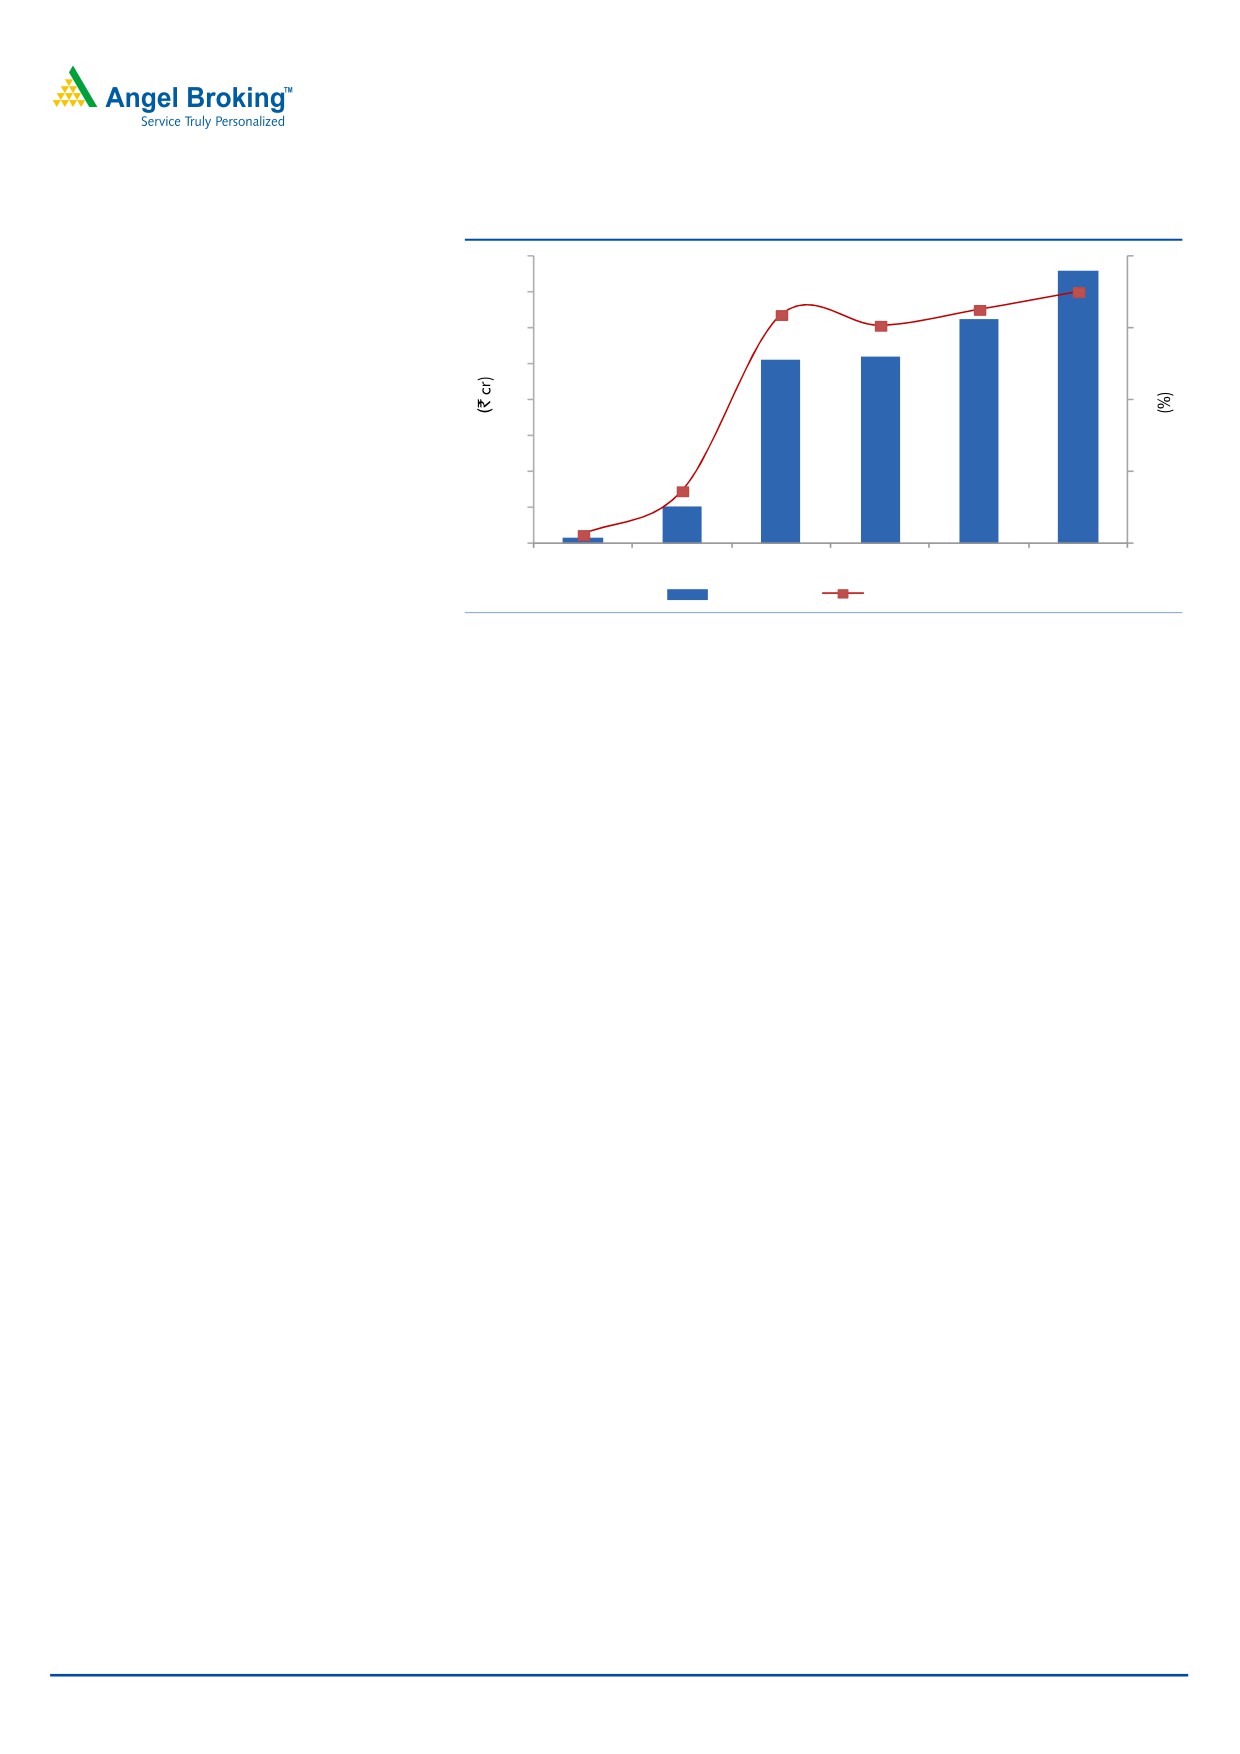
Exhibit 1: Total EBIT trend for the company
Exhibit 2: Total EBIT Margin trend
EBIT with retail segment
EBIT without retail segment
8.0
Margin with retail segment
Margin without retail segment
120
6.0
100
80
4.0
60
2.0
40
-
20
FY2007
FY2008
FY2009
FY2010
FY2011
FY2012
FY2013 FY2014E
(2.0)
-
FY2008
FY2009
FY2010
FY2011
FY2012
FY2013
FY2014E
(20)
(4.0)
(40)
(6.0)
Source: Company, Angel Research
Source: Company, Angel Research
March 31, 2014
2
Heritage Foods | Initiating Coverage
Increased contribution from VADP to boost margins
Of the total milk distributed jointly by organised and unorganized sector, about
46% is consumed in fluid form while the rest (54%) is streamed towards production
of value added dairy products (VADP) like yogurt, butter, milk powder etc. Besides,
with rising urbanization, introduction of pro-biotic and other fortified products,
growth in the VADP industry is expected to be at 20-25%. Also, the margins in the
liquid milk business are at 4-5% while in VADP segment it elevates to ~10-11%.
HFL is gradually increasing its contribution from VADP; we expect it to increase the
contribution from 15.3% of total dairy sales in FY2013 to 23.2% in FY2016E.
Increasing contribution is expected to lead to expansion in the overall margins of
the company, gradually.
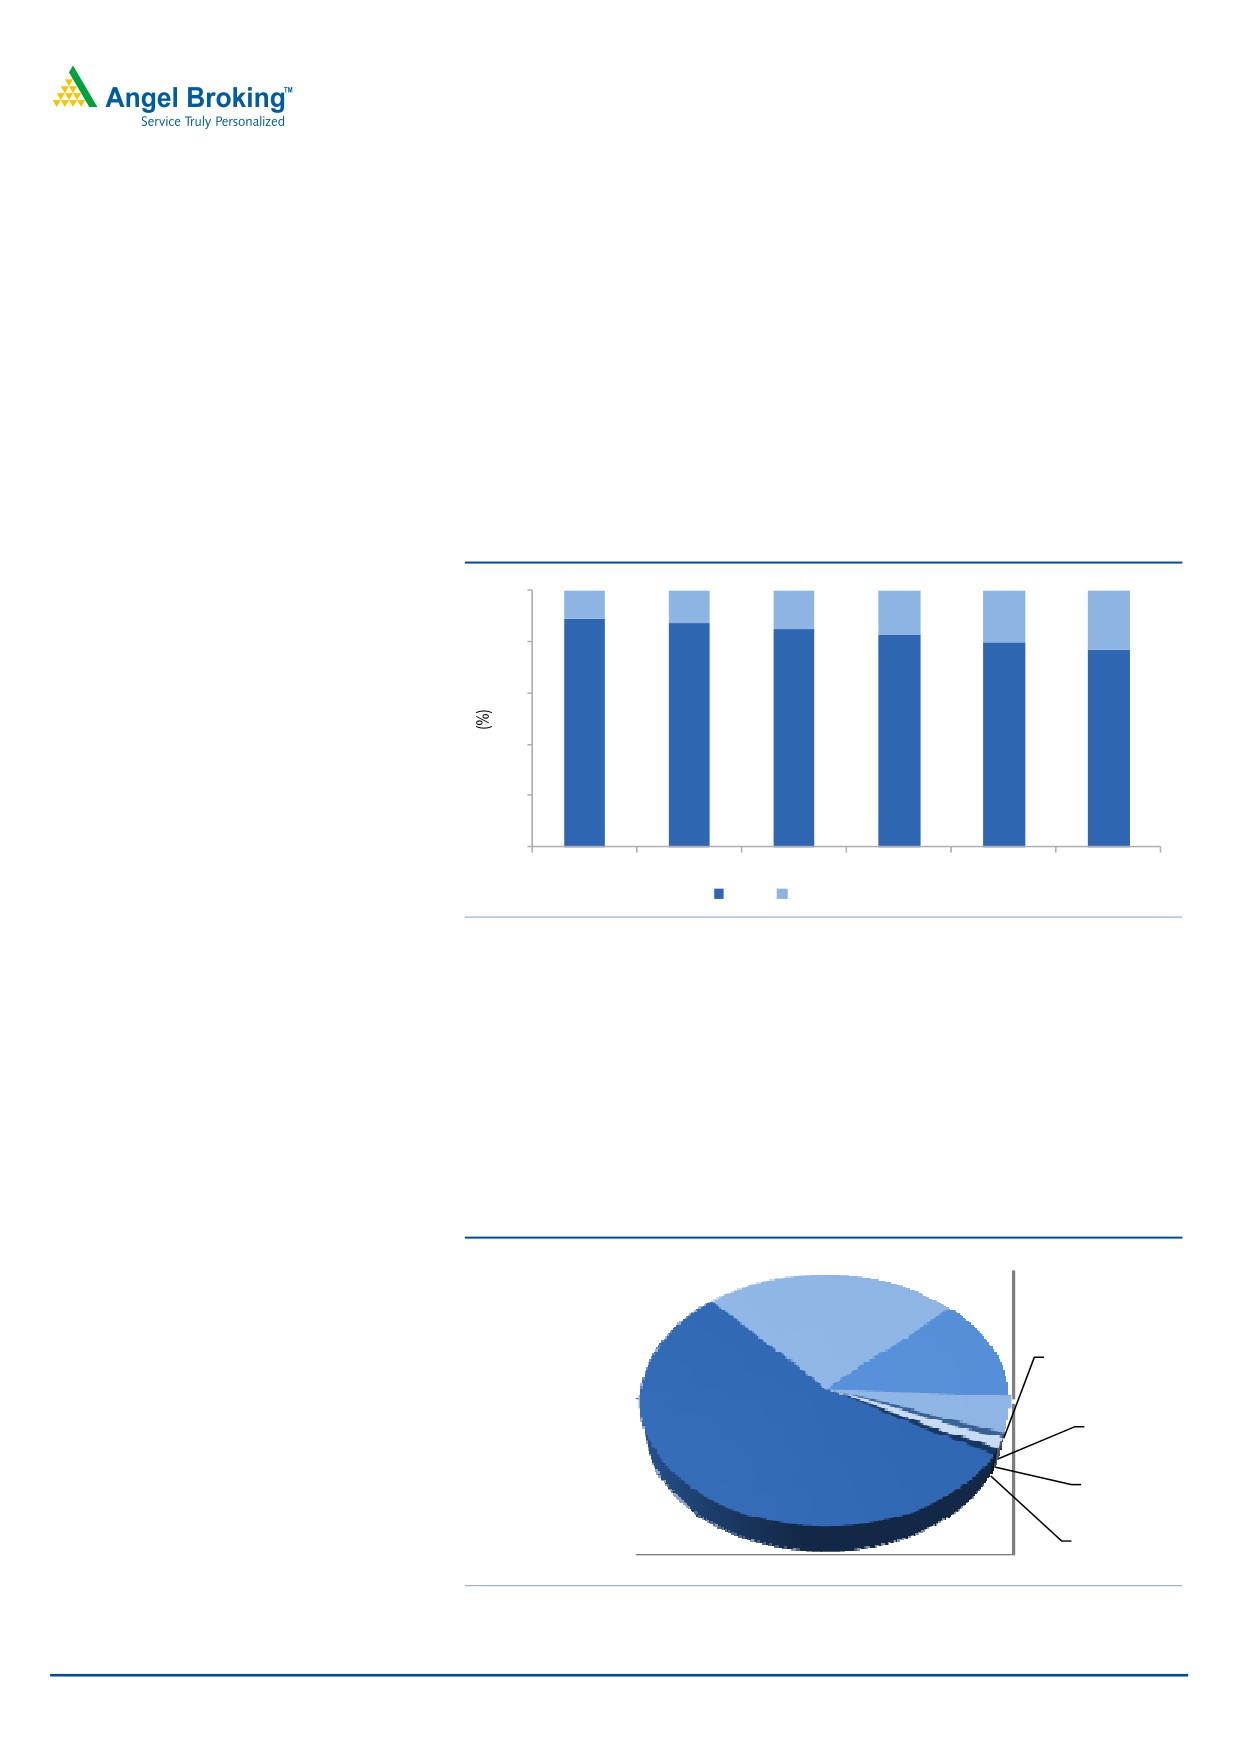
Exhibit 3: Dairy's segmental contribution
100
11.1
13.0
15.3
17.2
20.4
23.2
80
60
88.9
87.0
40
84.7
82.8
79.6
76.8
20
0
FY2011
FY2012
FY2013
FY2014E
FY2015E
FY2016E
Milk
Value Added Products
Source: Company, Angel Research
Expanding boundaries to aid growth
HFL, which is an established brand with strong foothold in south India, has ~77%
of its revenue streamed in from its dairy division. It receives around 92.5% of its
revenue from three states- Andhra Pradesh, Tamil Nadu and Karnataka. HFL has
4.4% revenue sourced from Maharashtra and 0.7% from Delhi, and hence is
making efforts to increase its contribution from these geographies and further gain
from the boom in the dairy industry.
Exhibit 4: Regional contribution for Liquid Milk Revenue
TamilNadu,
24.4
Karnataka, 13.0
Maharastra, 4.4
Andhra Pradesh,
Delhi, 0.7
55.2
Kerala, 1.4
Orissa, 0.8
Source: Company
March 31, 2014
3
Heritage Foods | Initiating Coverage
Financials
Exhibit 5: Key Assumptions
Particulars- Growth (%)
FY2013
FY2014E FY2015E FY2016E
Total Revenue
15.0
6.7
11.8
13.6
Liquid milk volume
5.1
1.1
3.7
5.9
Milk Prices
12.6
0.0
5.0
5.0
VADP
28.2
25.0
28.0
28.0
Retail
-
5.0
6.0
6.0
Source: Company, Angel Research
Despite current concentration of revenue from the aforementioned three states,
which have optimum level of milk supply, on-going efforts of the company to
expand boundaries is expected to lead to growth in liquid milk volumes at 3.7%
and 5.9% for FY2015E and FY2016E respectively; while milk prices are expected
to grow at 5.0% during each of these years. VADP are expected to post strong
growth of 28.0%. The retail segment, however, has no expansion plans as of now,
and is believed to post growth of 6.0% for FY2015E and FY2016E.
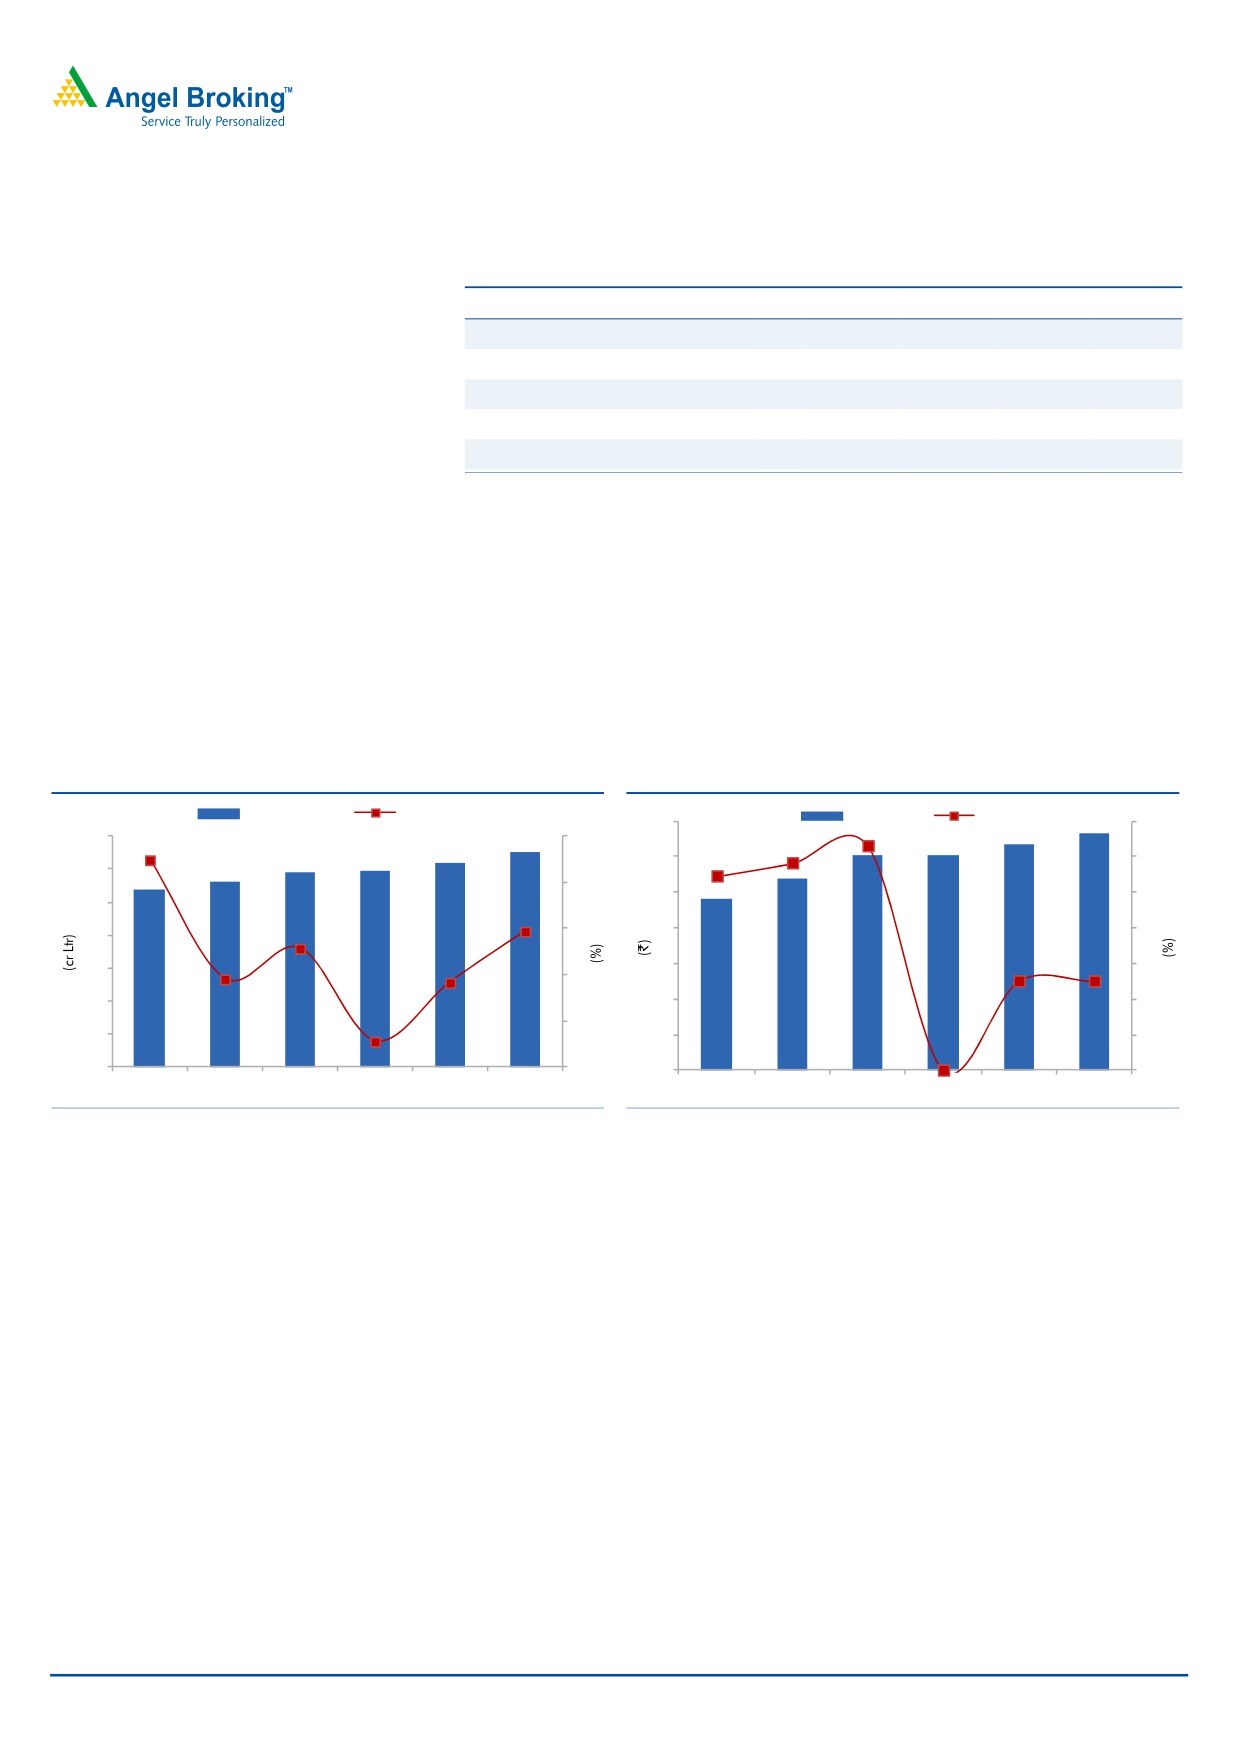
Exhibit 6: Volume Growth- Dairy segment
Exhibit 7: Milk Prices trend
Dairy Volume
% change
Milk prices
% change
35
14
35
32.7
10
9.0
30.9
11.6
12.6
29.4
29.8
30
10.9
33.3
12
30
28.0
31.7
30.2
30.2
8
25
10
25
27.0
26.8
5.9
24.0
6
20
8
20
3.8
5.1
3.7
5.0
5.0
15
15
6
4
10
10
4
1.1
2
5
5
2
0.0
0
0
0
0
2011
2012
2013
2014E
2015E
2016E
2011
2012
2013
2014E
2015E
2016E
Source: Company, Angel Research
Source: Company, Angel Research
Top-line to post CAGR of 10.7% over FY2013-16E
Considering the expected robust growth in the Indian dairy industry of 13-15%,
coupled with geographical expansion plans of the company, we expect HFL to
register a top-line CAGR of 10.7% over FY2013-16E to `2,171cr in FY2016E. We
expect the contribution from the overall dairy segment to rise from ~76% to 79%
and contribution from VADP (in total revenue) to rise from 11.5% in FY2013 to
17.4% in FY2016E, subsequently reducing the share of liquid milk sales.
March 31, 2014
4
Heritage Foods | Initiating Coverage
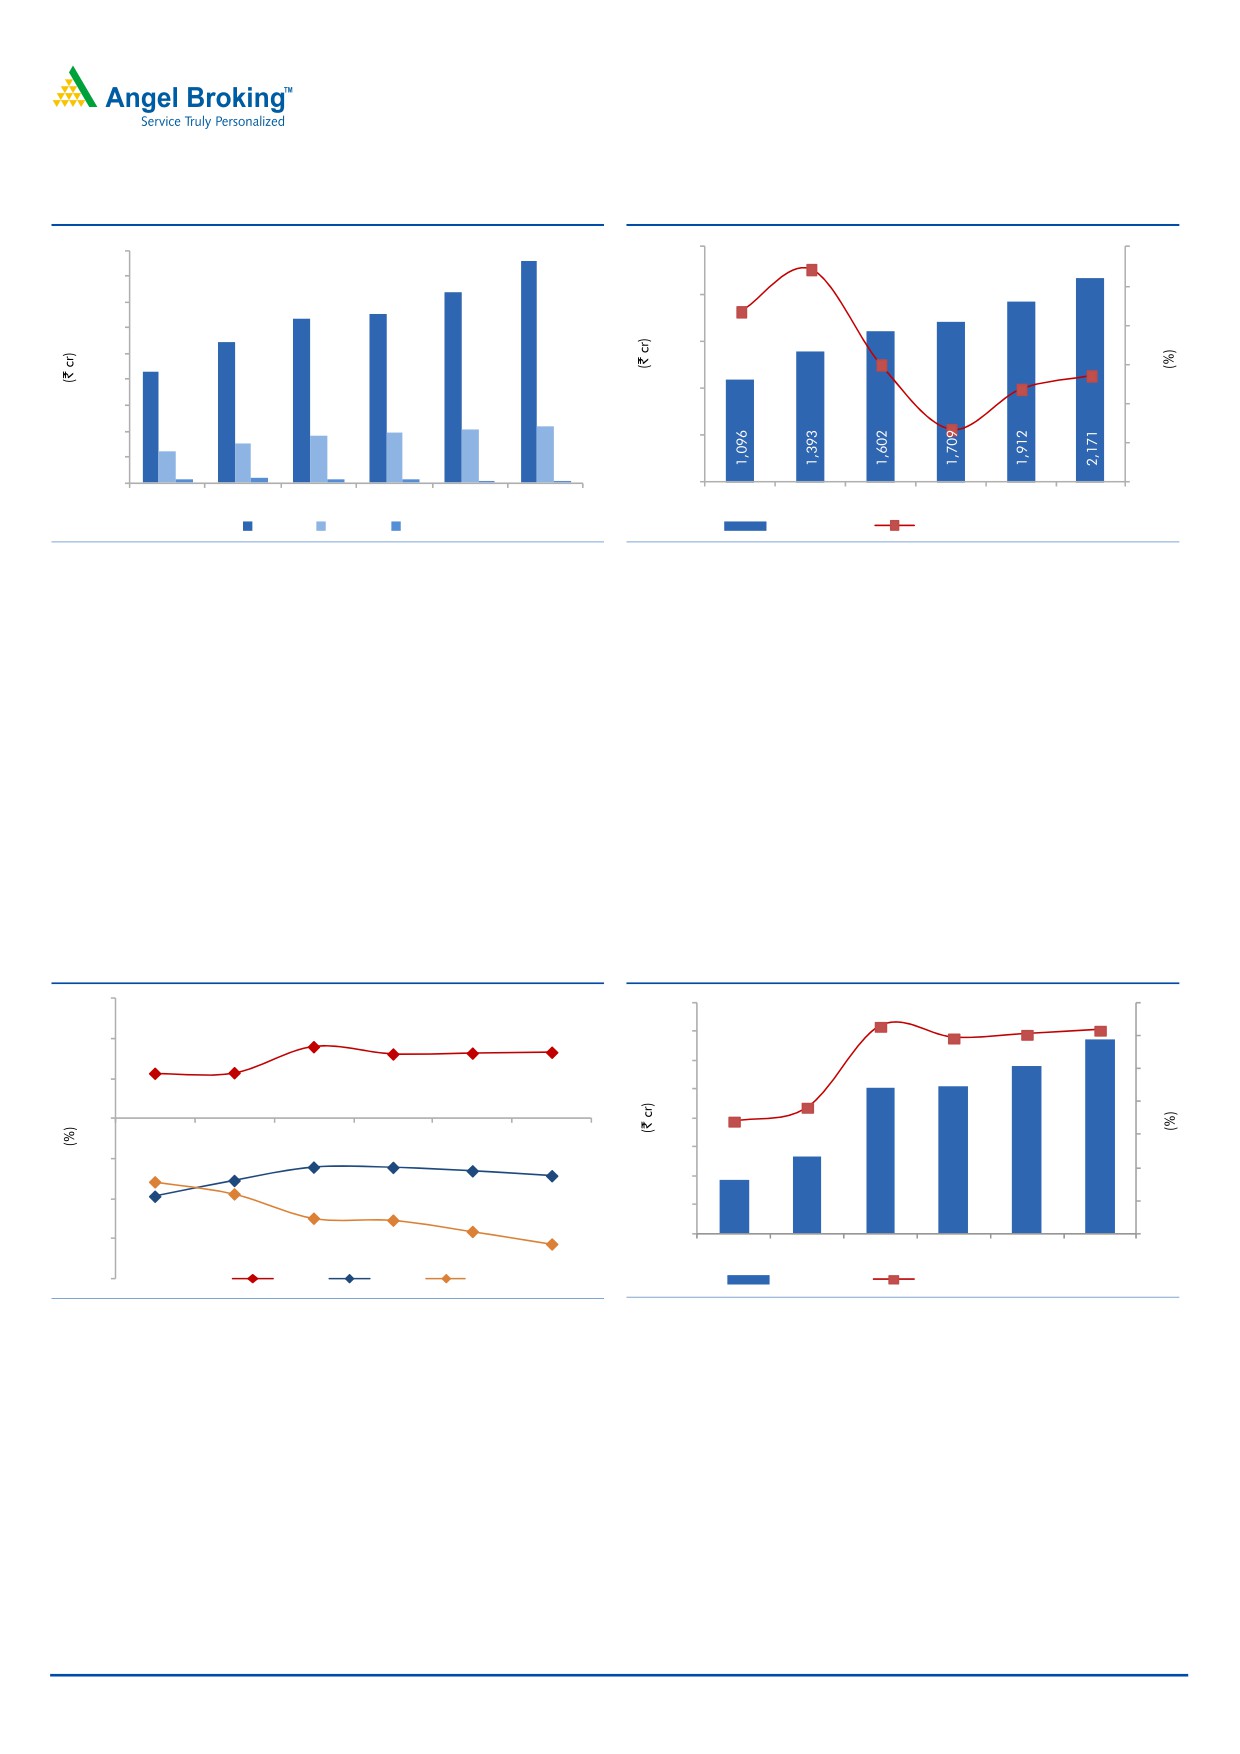
Exhibit 8: Segmental Contribution
Exhibit 9: Net sales to move upwards gradually
1,800
1,713
2,500
30
13.6
1,600
1,480
11.8
25
1,301
2,000
27.1
6.7
1,400
1,269
15.0
1,200
1,094
20
1,500
21.7
1,000
861
15
800
1,000
600
437
10
363
384
410
400
299
239
500
5
200
-
-
0
FY2011
FY2012
FY2013
FY2014E FY2015E FY2016E
FY2011
FY2012
FY2013
FY2014E FY2015E FY2016E
Dairy
Retail
Agri
Net sales (LHS)
Net sales growth (RHS)
Source: Company, Angel Research
Source: Company, Angel Research
EBITDA to grow at a CAGR of 10.0% over FY2013-16E
On the back of a robust estimated top-line growth of 10.7% (CAGR), the
company’s EBITDA is expected to grow at a CAGR of 10.0% over FY2013-16E,
from
`101cr in FY2013 to
`134cr in FY2016E. Besides, with increasing
contribution of VADP in the dairy segment, the overall EBITDA margin is expected
to maintain its 6.2% level in FY2016E.
Regardless of retail segment reporting losses at the EBIT level, the EBIT margin
expansion in the dairy segment is expected to offset the impact of the same.
Overall, the EBIT is expected to grow at a CAGR of 10.7% over FY2013-16E.
Exhibit 10: VADP’s rising contribution elevates Dairy’s margin
Exhibit 11: EBITDA Margin to bounce back to current levels
15.0
160
6.3
5.9
6.2
7
6.1
140
6
10.0
120
9.0
5
5.0
8.1
8.2
8.3
100
3.8
5.7
5.7
4
3.4
-
80
FY2011
FY2012
FY2013
FY2014E FY2015E FY2016E
3
60
(5.0)
2
40
(6.0)
(6.1)
(6.5)
(10.0)
(7.7)
(7.1)
20
1
(9.7)
38
54
101
102
116
134
0
0
(15.0)
FY2011
FY2012
FY2013
FY2014E FY2015E FY2016E
(20.0)
Dairy
Retail
Agri
EBITDA (LHS)
EBITDA margin (RHS)
Source: Company, Angel Research
Source: Company, Angel Research
Net profit to grow at a CAGR of 14.3% over FY2013-16E
With robust top-line growth coupled with efficient EBITDA level performance, HFL’s
PAT is expected to grow at a CAGR of 14.3% to `76cr in FY2016E. Moreover, we
expect the total debt of the company to reduce from `126cr in FY2013 to `96cr in
FY2016E, thereby reducing the interest cost and hence directly adding up to the
bottom-line. As a result, PAT margins are expected to rise from 3.2% in FY2013 to
3.5% in FY2016E.
March 31, 2014
5
Heritage Foods | Initiating Coverage
Exhibit 12: PAT margins gradually trending higher
80
3.5
4
3.3
70
3.2
3.0
60
3
50
40
2
30
0.7
20
1
10
0.1
1
10
51
52
62
76
0
0
FY2011
FY2012
FY2013
FY2014E FY2015E FY2016E
PAT (LHS)
PAT margin (RHS)
Source: Company, Angel Research
March 31, 2014
6
Heritage Foods | Initiating Coverage
Risks
Geographical concentration: HFL has its major milk sales concentrated in
three states- Andhra Pradesh, Tamilnadu and Karnataka, contributing 93% of the
revenue. Also, the unrest owing to separation of Telangana as an independent
state can hinder the inter-state milk supply (a perishable commodity) and thereby
affect the company’s sales.
Margins under pressure: It has become inevitable for HFL to expand the
boundaries owing to the milk surplus in the state of Andhra Pradesh, which is the
third largest milk producing state in India, accounting for 10% of the total Indian
milk production. Not expanding boundaries might have an impact on the margins
of the company in the long run.
Retail segment failure to continue to dent performance- Delay in the retail
sale plan owing to unavailability of a suitable opportunity will continue to dent the
overall performance of the company.
March 31, 2014
7
Heritage Foods | Initiating Coverage
Outlook and Valuation: Considering the growth opportunities in the dairy
industry, we expect the top-line for the company to grow at a CAGR of 10.7% over
FY2013-16E to `2,171cr in FY2016E. We expect the EBITDA to grow at a CAGR of
10.0% for the same period on the back of stabilizing raw-material costs and
increasing VADP contribution. We expect margins to sustain at 6.2% in FY2016E.
We estimate a PAT CAGR of 14.3% for the same period.
Exhibit 13: SOTP Valuation
Particulars
FY2016E
Retail division
Capital employed
65
Target EV/Invested capital
0.0
Targeted MCAP (A)
0.0
Dairy division
EBIT
142
PAT
107
Current PE
4.4
Target PE
6.0
Targeted MCAP (B)
639
Targeted Total MCAP (A+B)
639
Current MCAP
464
Target Price
275
Upside
37.8%
Source: Angel Research, Company
Assuming robust growth in the dairy industry, which will thereby drive HFL’s
growth, we initiate coverage on HFL and value the company on a SOTP basis. We
have assigned zero value to the retail segment and PE of 6x FY2016E earnings to
the dairy business which is trading at 4.4x currently; and recommend a Buy on the
company with a target price of `275.
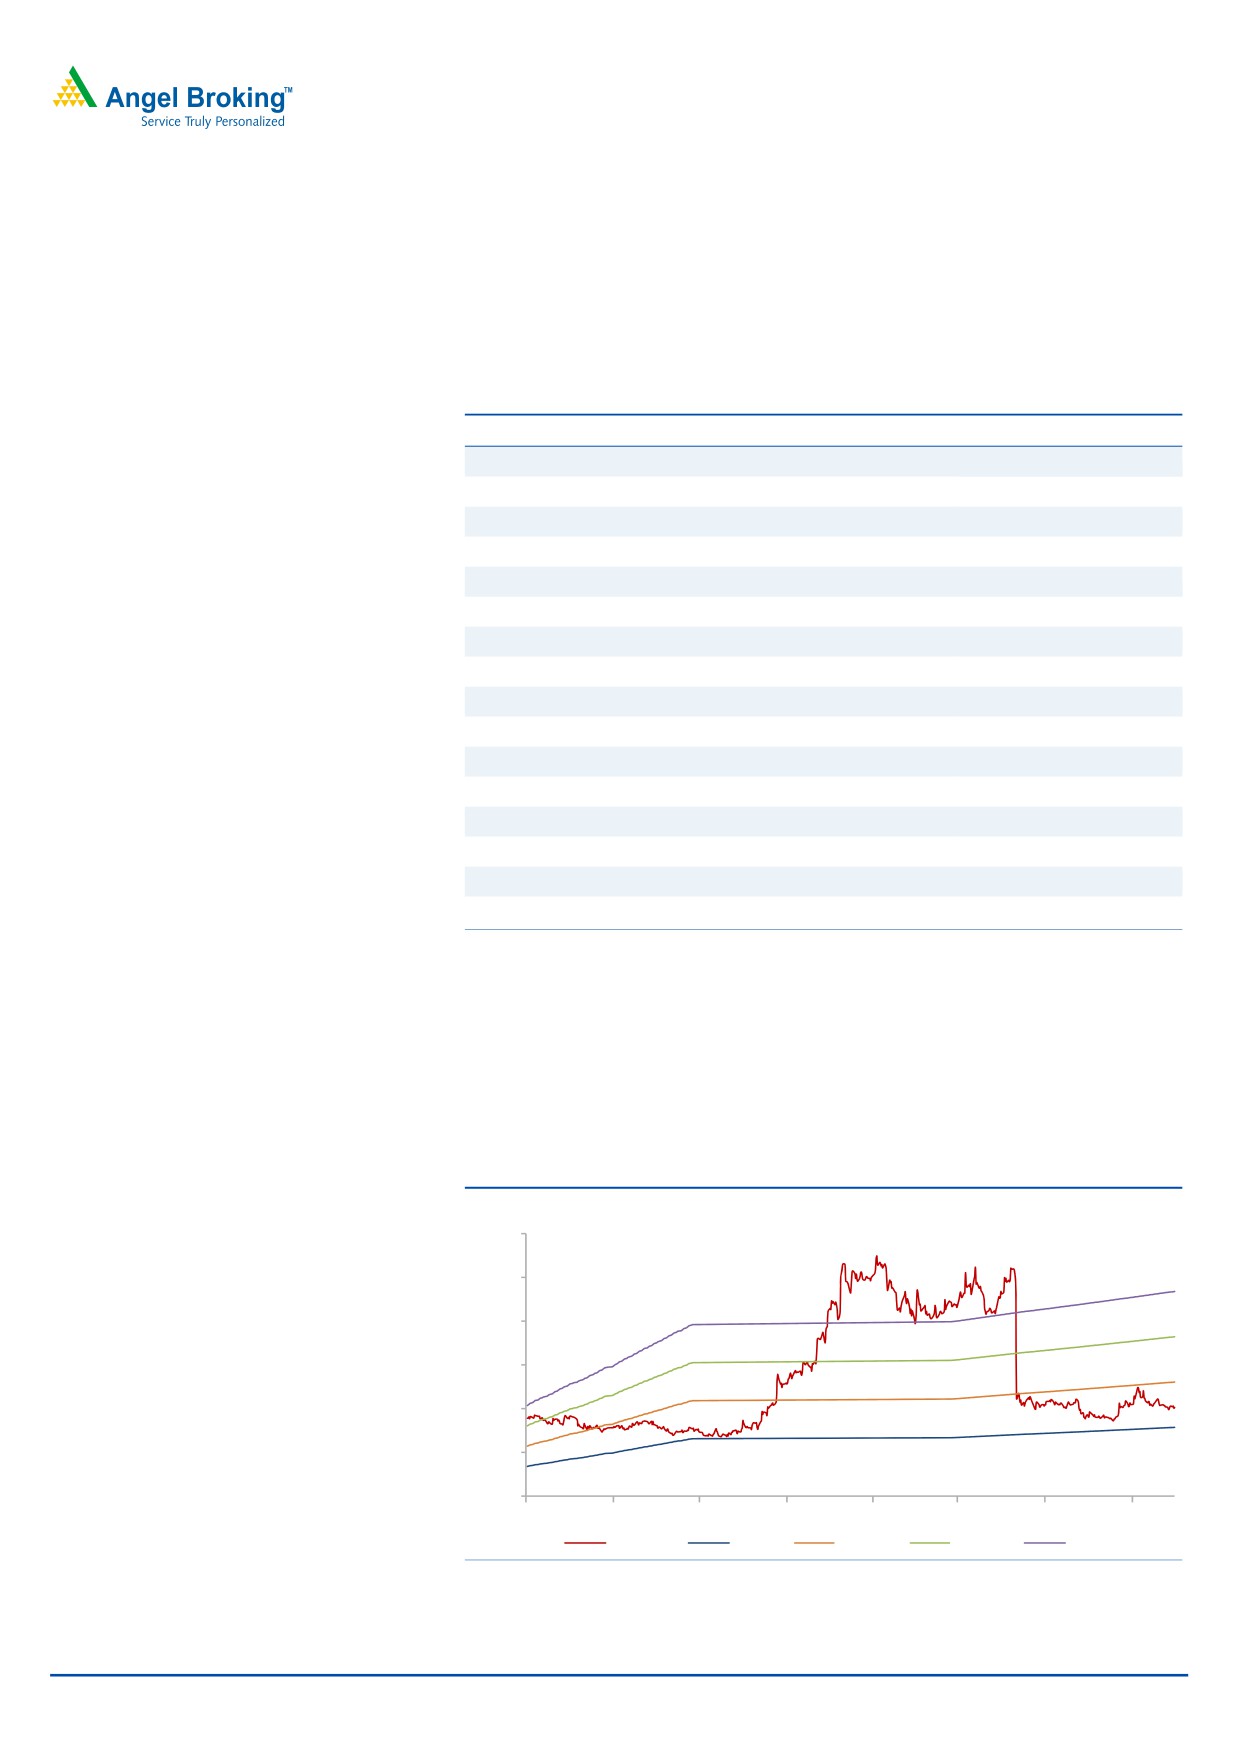
Exhibit 14: One-year forward PE
(`)
600
500
400
300
200
100
0
Sep-11
Jan-12
May-12
Sep-12
Jan-13
May-13
Sep-13
Jan-14
Price
6x
10x
14x
18x
Source: Company, Angel Research
March 31, 2014
8
Heritage Foods | Initiating Coverage
About Heritage Foods
Heritage Foods, based in Hyderabad, is a leading corporate in the food and retail
business. The company operates mainly through three divisions- a) dairy b) retail
and c) agri. During FY2013, the company has commissioned 21 units (includes
bulk coolers, chilling units and franchise units) in the dairy segment to increase
milk procurement, which has resulted in current capacity of 72,000 liters per day
(LPD). Heritage Foods, being based in the highest milk producing state (Andhra
Pradesh) of the country, has 55% of its milk consumed in Andhra Pradesh and
~92% cumulatively from Andhra Pradesh, Tamilnadu and Karnataka.
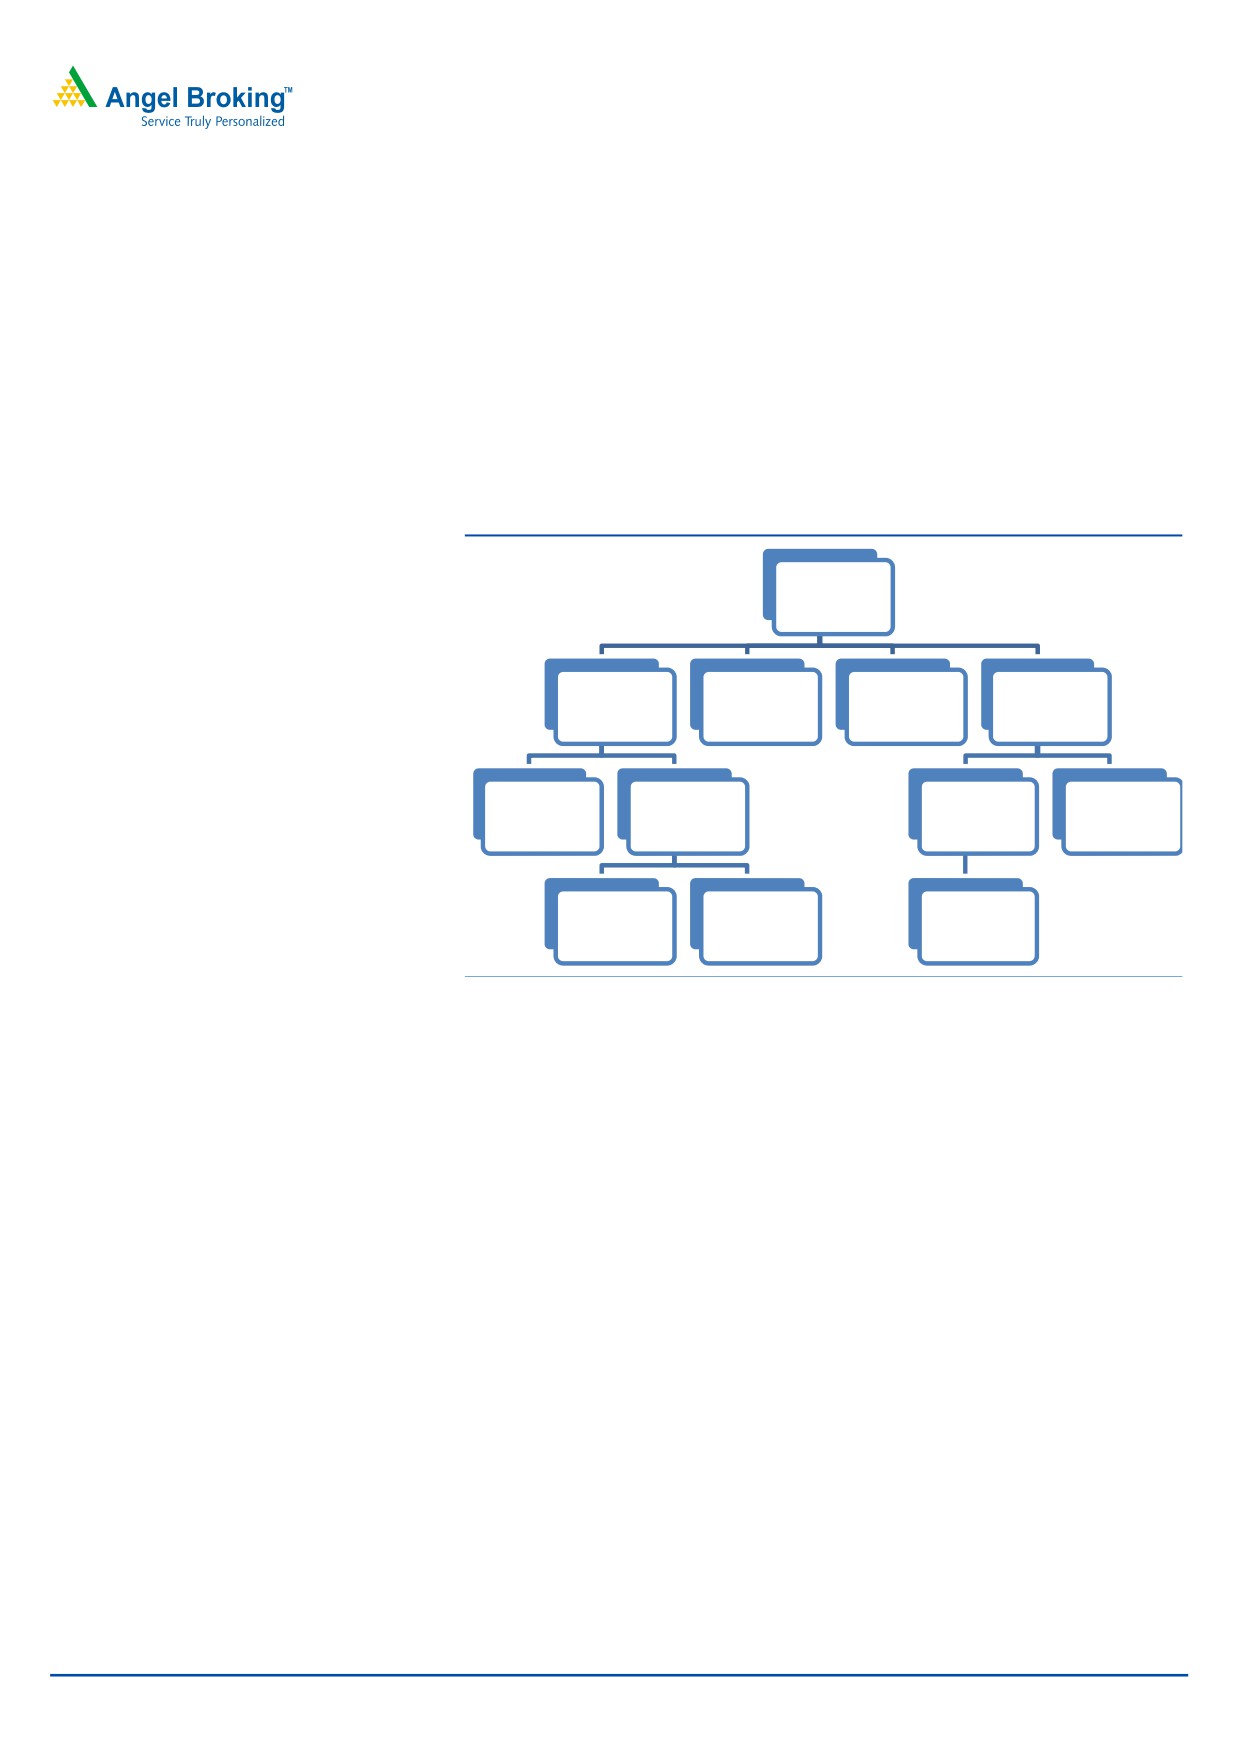
Exhibit 15: Segmental Contribution
Heritage Foods Ltd
Dairy (77%)
Agri (2.4%)
Bakery (0.2%)
Retail (20%)
Milk
Milk Products
Food items
Non Food Items
Ice-Cream,
Plain & Flavored
Food Grains,
Paneer, Cheese,
Curd & Butter milk
Other Items
Flavored milk
Source: Company
Caters to nearly 15 lakh customers daily.
Packaging partner of curd for Nestle in South India.
1,176 Heritage Parlours (selling HFL products)- owned and managed by
franchisees.
67 Heritage fresh stores- multi-brand retail formats.
Daily milk procurement of ~9 lakh liters per day (LLPD).
Chilling capacity of 14 LLPD across 123 chilling plants and 13 packing plants
with capacity of 12.50 LLPD.
Basket of 22 products in dairy segment.
1,000 vehicles (trucks, tankers, puff vehicles) servicing every day.
March 31, 2014
9
Heritage Foods | Initiating Coverage
Profit and loss statement (Standalone)
Y/E March (` cr)
FY2012
FY2013
FY2014E
FY2015E
FY2016E
Total operating income
1,393
1,602
1,709
1,912
2,171
% chg
27.1
15.0
6.7
11.8
13.6
Net Raw Material
1,082
1,194
1,318
1,472
1,669
% chg
29.0
10.4
10.4
11.7
13.4
Other Manufacturing cost
90
106
85
96
109
% chg
18.4
17.5
(19.6)
11.8
13.6
Personnel
69
87
105
118
133
% chg
16.1
26.0
20.6
11.8
13.6
Other
98
114
99
111
126
% chg
16.9
15.4
(12.7)
11.8
13.6
Total Expenditure
1,340
1,501
1,608
1,796
2,036
EBITDA
54
101
102
116
134
% chg
42.8
88.3
0.7
14.0
15.9
(% of Net Sales)
3.8
6.3
5.9
6.1
6.2
Depreciation & Amortization
21
22
24
25
27
EBIT
32
79
78
90
107
% chg
84.1
143.5
(1.4)
16.3
18.3
(% of Net Sales)
2.3
4.9
4.5
4.7
4.9
Interest & other charges
22
19
13
13
12
Other Income
3
4
5
5
6
(% of Net Sales)
0.2
0.3
0.3
0.3
0.3
PBT (reported)
14
64
69
82
100
Tax
4
14
17
20
24
(% of PBT)
31.2
21.5
23.0
23.0
23.0
PAT (reported)
9
50
52
62
76
Extraordinary Expense/(Inc.)
(1)
(1)
-
-
-
ADJ. PAT
10
51
52
62
76
% chg
675.6
401.1
1.7
20.0
22.2
(% of Net Sales)
0.7
3.2
3.0
3.3
3.5
Basic EPS (`)
4.4
21.9
22.3
26.8
32.7
Fully Diluted EPS (`)
4.4
21.9
22.3
26.8
32.7
% chg
675.6
401.1
1.7
20.0
22.2
March 31, 2014
10
Heritage Foods | Initiating Coverage
Balance sheet (Standalone)
Y/E March (` cr)
FY2012
FY2013
FY2014E
FY2015E
FY2016E
SOURCES OF FUNDS
Equity Share Capital
12
12
12
12
12
Reserves& Surplus
82
130
178
236
308
Shareholders’ Funds
93
142
190
248
320
Total Loans
174
126
106
106
96
Other long term liabilities
7
8
8
8
8
Net Deferred Tax Liability
18
20
20
20
20
Total Liabilities
293
296
324
382
444
APPLICATION OF FUNDS
Gross Block
346
363
393
418
448
Less: Acc. Depreciation
116
127
151
176
203
Net Block
230
237
243
243
245
Capital Work-in-Progress
9
8
8
8
8
Lease adjustment
-
-
-
-
-
Goodwill
-
-
-
-
-
Investments
1
1
1
1
1
Other non-current assets
19
18
24
38
54
Current Assets
150
147
153
200
248
Cash
30
56
33
44
60
Loans & Advances
15
17
34
57
65
Inventory
93
59
71
83
105
Debtor
11
15
14
16
18
Current liabilities
117
115
105
109
113
Net Current Assets
33
32
47
92
135
Misc. Exp. not written off
-
-
-
-
-
Total Assets
293
296
324
382
444
March 31, 2014
11
Heritage Foods | Initiating Coverage
Cash flow statement (Standalone)
Y/E March (` cr)
FY2012 FY2013 FY2014E FY2015E FY2016E
Profit Before Tax
14
64
69
82
100
Depreciation
21
22
24
25
27
Other Income
(3)
(4)
(5)
(5)
(6)
Change in WC
12
26
(38)
(33)
(27)
Direct taxes paid
(4)
(14)
(17)
(20)
(24)
Cash Flow from Operations
39
94
33
49
71
(Inc.)/ Dec. in Fixed Assets
(28)
(16)
(36)
(39)
(46)
(Inc.)/Dec. In Investments
(0)
0
0
0
0
Other Income
3
4
5
5
6
Cash Flow from Investing
(25)
(11)
(32)
(34)
(41)
Issue of Equity/Preference
0
0
0
0
0
Inc./(Dec.) in Debt
(10)
(45)
(20)
0
(10)
Dividend Paid (Incl. Tax)
(2)
(3)
(4)
(4)
(4)
Others
(1.8)
(7.8)
-
-
-
Cash Flow from Financing
(14)
(57)
(24)
(4)
(14)
Inc./(Dec.) In Cash
1
26
(22)
11
16
Opening Cash balance
29
30
56
33
44
Closing cash balance
30
56
33
44
60
March 31, 2014
12
Heritage Foods | Initiating Coverage
Key Ratios
Y/E March
FY2012
FY2013
FY2014E
FY2015E
FY2016E
Valuation Ratio (x)
P/E (on FDEPS)
49.5
9.9
9.7
8.1
6.6
P/CEPS
16.1
6.9
6.7
5.8
4.9
P/BV
5.4
3.5
2.7
2.0
1.6
Dividend yield (%)
0.5
0.7
0.7
0.7
0.7
EV/Net sales
0.5
0.4
0.3
0.3
0.2
EV/EBITDA
12.1
5.7
5.7
4.9
4.0
EV / Total Assets
2.2
1.9
1.8
1.5
1.2
Per Share Data (`)
EPS (Basic)
4.4
21.9
22.3
26.8
32.7
EPS (fully diluted)
4.4
21.9
22.3
26.8
32.7
Cash EPS
13.5
31.4
32.6
37.7
44.4
DPS
0.4
0.6
0.6
0.6
0.6
Book Value
40.1
61.2
81.7
106.8
137.8
DuPont Analysis
EBIT margin
2.3
4.9
4.5
4.7
4.9
Tax retention ratio
0.7
0.8
0.8
0.8
0.8
Asset turnover (x)
5.5
6.9
6.1
5.8
5.8
ROIC (Post-tax)
8.8
26.8
21.3
21.2
22.0
Cost of Debt (Post Tax)
8.7
12.1
9.6
9.6
9.7
Leverage (x)
1.5
0.5
0.4
0.2
0.1
Operating ROE
9.0
34.0
25.7
24.1
23.4
Returns (%)
ROCE (Pre-tax)
11.1
26.6
24.0
23.7
24.1
Angel ROIC (Pre-tax)
12.8
34.2
27.7
27.5
28.6
ROE
10.9
35.9
27.3
25.1
23.8
Turnover ratios (x)
Asset TO (Gross Block)
4.0
4.4
4.3
4.6
4.8
Inventory / Net sales (days)
21
17
14
15
16
Receivables (days)
3
3
3
3
3
Payables (days)
31
30
31
30
31
WC cycle (ex-cash) (days)
9
(5)
3
9
12
Solvency ratios (x)
Net debt to Equity
1.5
0.5
0.4
0.2
0.1
Net debt to EBITDA
2.7
0.7
0.7
0.5
0.3
Int. Coverage (EBIT/ Int.)
1.5
4.1
5.9
6.8
8.9
March 31, 2014
13
Heritage Foods | Initiating Coverage
Advisory Team Tel: (91) (022) 39500777
DISCLAIMER
This document is solely for the personal information of the recipient, and must not be singularly used as the basis of any investment
decision. Nothing in this document should be construed as investment or financial advice. Each recipient of this document should make
such investigations as they deem necessary to arrive at an independent evaluation of an investment in the securities of the companies
referred to in this document (including the merits and risks involved), and should consult their own advisors to determine the merits and
risks of such an investment.
Angel Broking Limited, its affiliates, directors, its proprietary trading and investment businesses may, from time to time, make
investment decisions that are inconsistent with or contradictory to the recommendations expressed herein. The views contained in this
document are those of the analyst, and the company may or may not subscribe to all the views expressed within.
Reports based on technical and derivative analysis center on studying charts of a stock's price movement, outstanding positions and
trading volume, as opposed to focusing on a company's fundamentals and, as such, may not match with a report on a company's
fundamentals.
The information in this document has been printed on the basis of publicly available information, internal data and other reliable
sources believed to be true, but we do not represent that it is accurate or complete and it should not be relied on as such, as this
document is for general guidance only. Angel Broking Limited or any of its affiliates/ group companies shall not be in any way
responsible for any loss or damage that may arise to any person from any inadvertent error in the information contained in this report.
Angel Broking Limited has not independently verified all the information contained within this document. Accordingly, we cannot testify,
nor make any representation or warranty, express or implied, to the accuracy, contents or data contained within this document. While
Angel Broking Limited endeavors to update on a reasonable basis the information discussed in this material, there may be regulatory,
compliance, or other reasons that prevent us from doing so.
This document is being supplied to you solely for your information, and its contents, information or data may not be reproduced,
redistributed or passed on, directly or indirectly.
Angel Broking Limited and its affiliates may seek to provide or have engaged in providing corporate finance, investment banking or
other advisory services in a merger or specific transaction to the companies referred to in this report, as on the date of this report or in
the past.
Neither Angel Broking Limited, nor its directors, employees or affiliates shall be liable for any loss or damage that may arise from or in
connection with the use of this information.
Note: Please refer to the important `Stock Holding Disclosure' report on the Angel website (Research Section). Also, please refer to the
latest update on respective stocks for the disclosure status in respect of those stocks. Angel Broking Limited and its affiliates may have
investment positions in the stocks recommended in this report.
Disclosure of Interest Statement
Heritage Foods
1. Analyst ownership of the stock
No
2. Angel and its Group companies ownership of the stock
No
3. Angel and its Group companies' Directors ownership of the stock
No
4. Broking relationship with company covered
No
Note: We have not considered any Exposure below ` 1 lakh for Angel, its Group companies and Directors
Ratings (Returns):
Buy (> 15%)
Accumulate (5% to 15%)
Neutral (-5 to 5%)
Reduce (-5% to -15%)
Sell (< -15%)
March 31, 2014
14
Heritage Foods | Initiating Coverage
6th Floor, Ackruti Star, Central Road, MIDC, Andheri (E), Mumbai- 400 093. Tel: (022) 39357800
Research Team
Fundamental:
Sarabjit Kour Nangra
VP-Research, Pharmaceutical
Vaibhav Agrawal
VP-Research, Banking
Bhavesh Chauhan
Sr. Analyst (Metals & Mining)
V Srinivasan
Analyst (Cement, FMCG)
Yaresh Kothari
Analyst (Automobile)
Ankita Somani
Analyst (IT, Telecom)
Bhupali Gursale
Economist
Vinay Rachh
Research Associate
Amit Patil
Research Associate
Twinkle Gosar
Research Associate
Tejashwini Kumari
Research Associate
Harshal Patkar
Research Associate
Nishant Sharma
Research Associate
Technicals and Derivatives:
Siddarth Bhamre
Head - Technical & Derivatives
Sameet Chavan
Technical Analyst
Nagesh Arekar
Executive
Sneha Seth
Associates (Derivatives)
Institutional Sales Team:
Mayuresh Joshi
VP - Institutional Sales
Meenakshi Chavan
Dealer
Gaurang Tisani
Dealer
Production Team:
Tejas Vahalia
Research Editor
Dilip Patel
Production Incharge
CSO & Registered Office: G-1, Ackruti Trade Centre, Road No. 7, MIDC, Andheri (E), Mumbai - 93. Tel: (022) 3083 7700. Angel Broking Pvt. Ltd: BSE Cash: INB010996539 / BSE F&O: INF010996539, CDSL Regn. No.: IN - DP - CDSL - 234 - 2004, PMS Regn. Code: PM/INP000001546, NSE Cash: INB231279838 /
NSE F&O: INF231279838 / NSE Currency: INE231279838, MCX Stock Exchange Ltd: INE261279838 / Member ID: 10500. Angel Commodities Broking (P) Ltd.: MCX Member ID: 12685 / FMC Regn. No.: MCX / TCM / CORP / 0037 NCDEX: Member ID 00220 / FMC Regn. No.: NCDEX / TCM / CORP / 0302.
March 31, 2014
15