FPO Note | Infrastructure
February 5, 2014
Engineers India
SUBSCRIBE
Issue Open: February 06, 2014
Attractively priced
Issue Close: February 10, 2014
Engineers India Ltd (EIL) is one of the leading design and engineering organizations
Issue Details
in South Asia. The company provides engineering consultancy and EPC services,
Face Value: `5
and is principally focused on the oil & gas and petrochemical industries.
Present Eq. Paid-up Capital: `169cr
Leadership position in project implementation in hydrocarbon business: EIL
Offer Size: 3.37cr Shares
has developed indigenous technology and expertise for offshore platforms,
oil & gas processing, oil refining, petrochemicals and pipeline projects over the
Post Eq. Paid-up Capital: `169cr
last 48 years enabling it to provide a gamut of management services from project
Issue size (amount): `489-506cr
conception to commissioning in hydrocarbon business. EIL’s leadership in project
implementation and long-term relationships with its clients gives it a competitive
Price Band: `145-150
advantage over its peers.
Discount to retail inv./employees: `6
Diversified operations across sectors and geographies: Over the years, the
Promoters holding Pre-Issue: 80.4%
company has diversified across various segments such as LNG, fertilizer, power,
Promoters holding Post-Issue: 70.4%
mining and metallurgy and infrastructure to encash the untapped infra
opportunity not only in Indian but globally (presence in Middle East, Africa, Asia
and South-east Asia) as well and has an excellent track record of achieving the
same. This will help the company to benefit from any recovery in the capex cycle
Post Issue Shareholding Pattern
both domestically and internationally.
Promoters Group
70.4
Healthy order inflows over past couple of quarters: The company has secured
MF/Banks/Indian
FIs/FIIs/Public &
orders worth `1,800cr (up 39.5 % yoy) in 9MFY2014, taking the order backlog to
Others
29.6
`3,820cr, implying an order backlog to sales ratio of 2.1x on a trailing basis. This
includes a major order worth US$139mn bagged from Dangote Group in
Nigeria for project management consultancy and EPC management.
Outlook and valuation: Although the company has reported weak revenues in
9MFY2014, the improvement in order inflows indicates recovery in revenue going
forward. At the lower and upper limit of the price-band of `145 and `150, the
stock is currently trading at valuations of 8.4x and 8.7x FY2015E Bloomberg EPS
respectively which is lower than its 3-year average PE of 14.8x. Considering EIL’s
dominance in the hydrocarbon business and attractive valuations, we recommend
Subscribe on the stock.
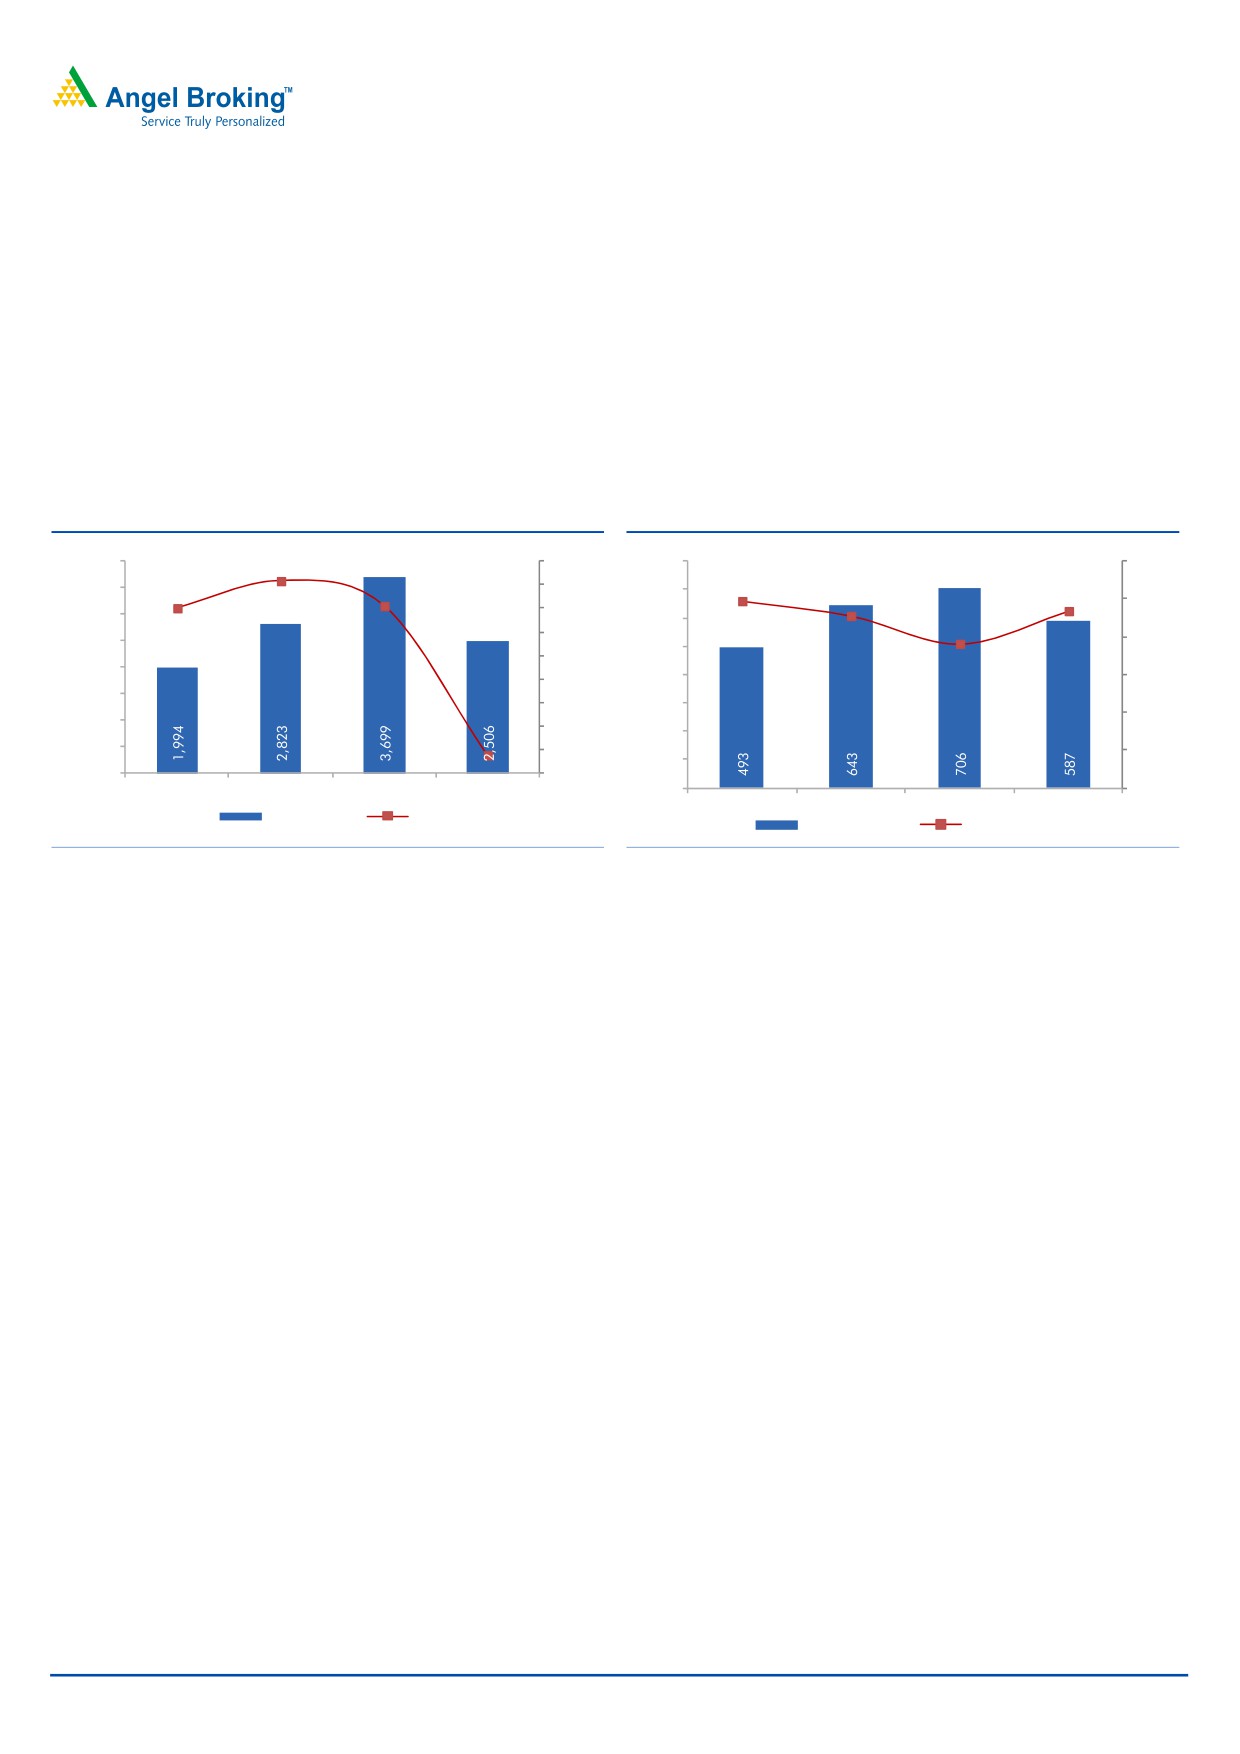
Key financials (Standalone)
Y/E March (` cr)
FY2010
FY2011
FY2012
FY2013
Net sales
1,994
2,823
3,699
2,506
% chg
30.1
41.6
31.0
(32.2)
Net profit (Adj.)
425
522
610
598
% chg
23.4
22.8
16.8
(1.9)
EBITDA margin (%)
24.7
22.8
19.1
23.4
EPS (`)
12.6
15.5
18.1
17.8
Viral Shah
P/E (x)
11.9
9.7
8.3
8.4
022-39357800 Ext: 6842
P/BV (x)
4.5
3.5
2.7
2.3
RoE (%)
34.2
40.8
37.1
29.3
RoCE (%)
38.6
48.7
41.2
27.9
Amit Patil
EV/Sales (x)
1.6
1.2
0.9
1.3
022-39357800 Ext: 6839
EV/EBITDA (x)
6.6
5.2
4.8
5.5
Source: Company, Angel Research
Please refer to important disclosures at the end of this report
1
Engineers India | FPO Note
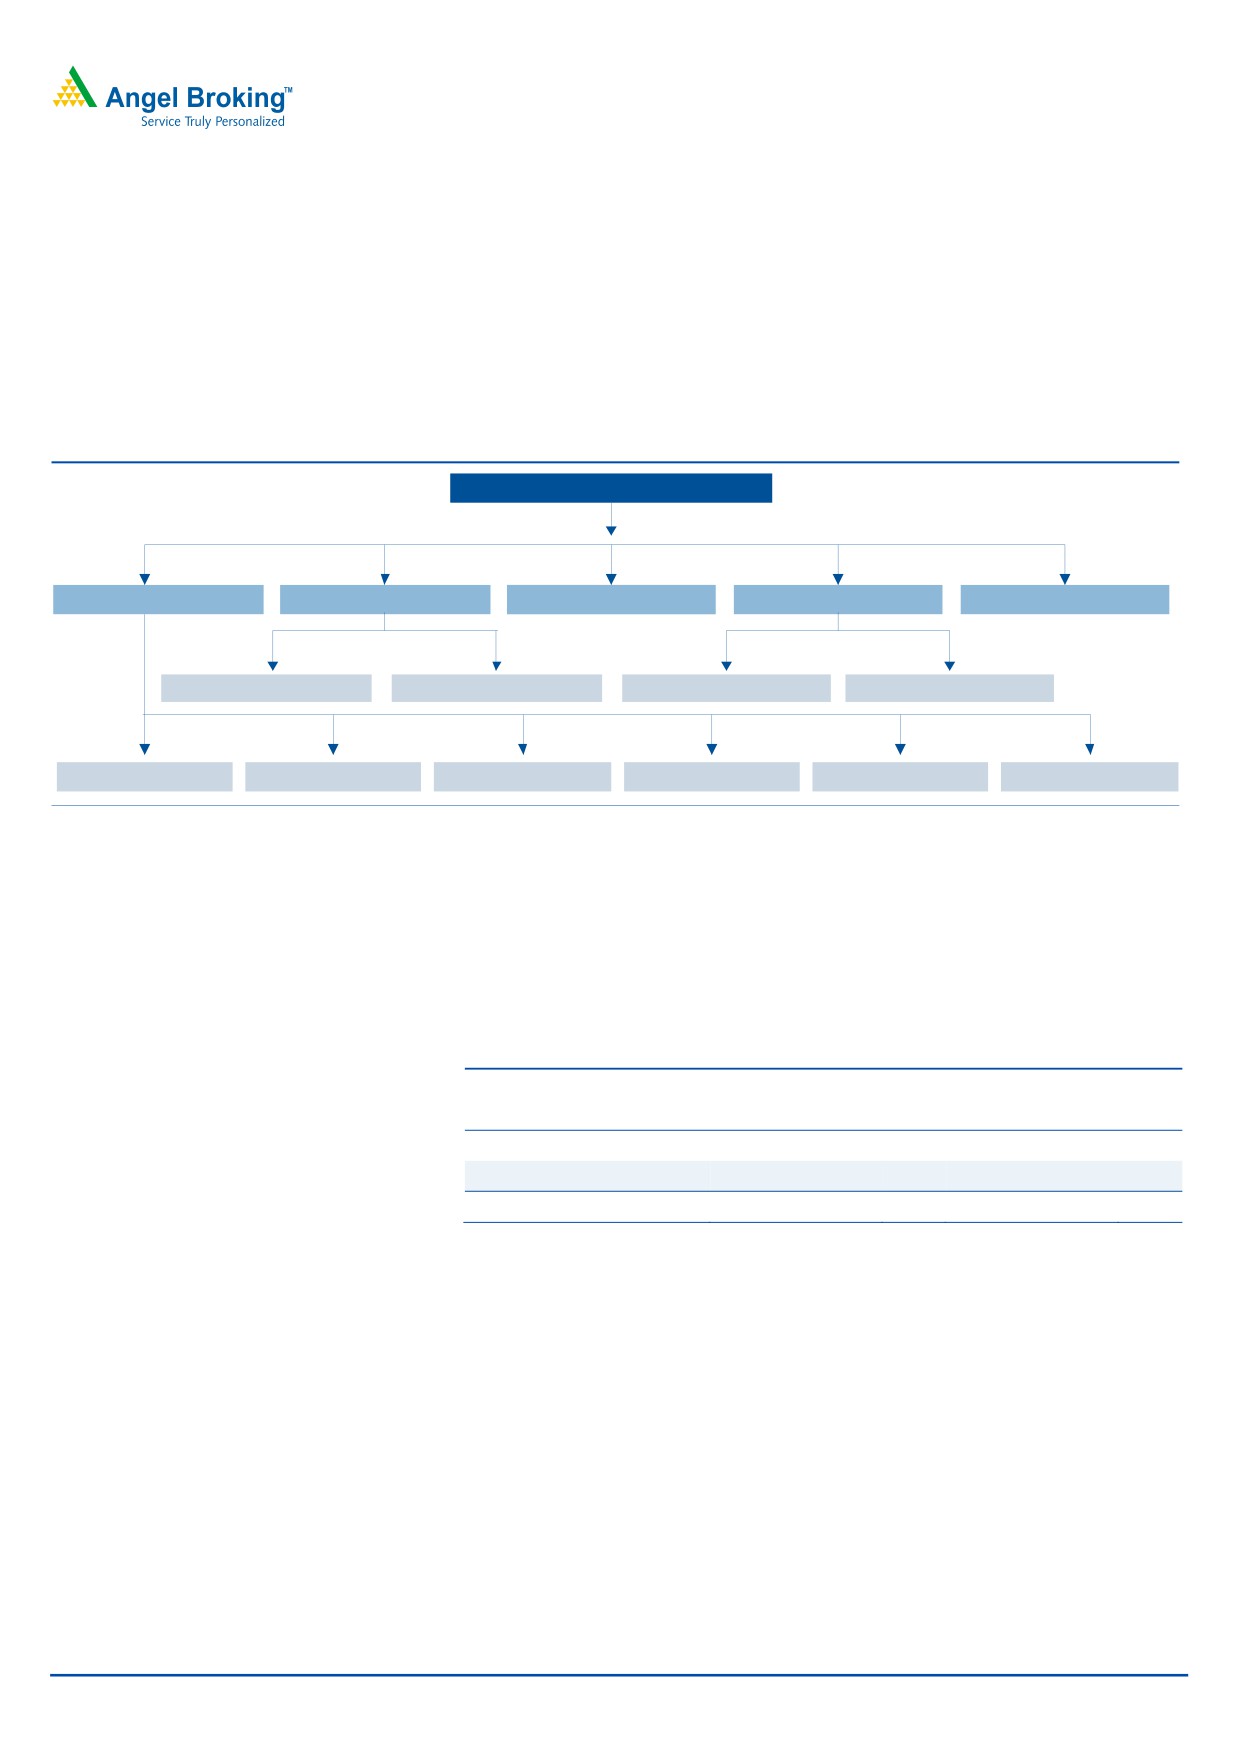
Company background
EIL is an engineering consultancy company which provides a gamut of
management services from project conception to commissioning which includes
design, engineering, procurement, construction and integrated project
management services. It also provides specialist services such as heat and mass
transfer equipment design, environmental engineering, specialist materials and
maintenance and plant operations and safety services.
Exhibit 1: Company various business sagments
ENGINEERS INDIA LTD
Hydrocarbon
Chemicals & Fertilizers
Mining & Metallurgy
Infrastructure
Power
Petrochemicals
Fertilizers
Infrastructure
Water & Waste Management
Petroleum Refining Onshore Oil & Gas Offshore Oil & Gas
Pipelines
Ports & Terminals
Strategic Storages
Source: Company, Angel Research
Issue details
The issue comprises an offer for sale of 3.37cr equity shares of face value of
`5 each. There is no fresh issue of equity. EIL has fixed the price band of the issue
at `145 to `150 and assigned a discount of `6/share on the issue price to the
retail investors and employees of the company.
Exhibit 2: Shareholding Pattern
Pre-Issue
Post-Issue
Particulars
No. of shares
(%)
No. of shares
(%)
Promoter and promoter group
270,900,540
80.4
237,206,880
70.4
Total public holding
66,036,060
19.6
99,729,720
29.6
Total
336,936,600
100.0
336,936,600
100.0
Source: Source: DRHP, Angel Research
February 5, 2014
2
Engineers India | FPO Note
Investment arguments
Leadership position in project implementation in hydrocarbon
business
EIL has developed indigenous technology and expertise for offshore platforms, oil
& gas processing, oil refining, petrochemicals and pipeline projects over the last
48 years, enabling it to provide a gamut of management services from project
conception to commissioning in hydrocarbon business. EIL’s leadership in project
implementation and long-term relationships with its clients gives it a competitive
advantage over its peers.
Exhibit 3: Revenue trend
Exhibit 4: EBITDA and EBITDAM
4,000
41.6
50.0
800
30.0
30.1
24.7
3,500
40.0
700
23.4
22.8
25.0
31.0
30.0
3,000
600
19.1
20.0
2,500
20.0
500
10.0
2,000
0.0
400
15.0
1,500
(10.0)
300
10.0
1,000
(20.0)
200
500
(32
.2)(30.0)
5.0
100
0
(40.0)
FY2010
FY2011
FY2012
FY2013
0
0.0
FY2010
FY2011
FY2012
FY2013
Sales (` cr)
% yoy chg
EBITDA (` cr)
EBITDAM (%)
Source: Company, Angel Research
Source: Company, Angel Research
Diversified operations across sectors and geographies
Over the years, the company has diversified across various segments such as LNG,
fertilizer, power, mining and metallurgy and infrastructure to encash the untapped
infra opportunity not only in Indian but globally (presence in Middle East, Africa,
Asia and South-east Asia) as well and has an excellent track record of achieving
the same. This will help the company to benefit from any recovery in the capex
cycle both domestically and internationally.
Healthy order inflows over past few quarters
The company has secured orders worth `1,800cr (up 39.5 % yoy) in 9MFY2014,
taking the order backlog to `3,820cr implying an order backlog to sales ratio of
2.1x on trailing basis. This includes a major order worth US$139mn bagged from
Dangote Group in Nigeria for project management consultancy and EPC
management.
February 5, 2014
3
Engineers India | FPO Note
Exhibit 5: Health order inflow of `1800cr in 9MFY14
Exhibit 6: Order backlog trend
8,000
4.6
5.0
3.1
4.5
7,000
2.2
LSTK, 29
4.0
6,000
3.5
5,000
1.2
3.0
4,000
1.3
2.5
3,000
2.0
1.5
2,000
Consultancy,
1.0
57
1,000
0.5
0
0.0
FY2009
FY2010
FY2011
FY2012
FY2013
Order book (` cr)
Order book/sales
Source: Company, Angel Research
Source: Company, Angel Research
Outlook and valuation
Although the company has reported weak revenues in 9MFY2014, the
improvement in order inflows indicates recovery in revenue going forward. At the
lower and upper limit of the price-band of `145 and `150, the stock is currently
trading at valuations of 8.4x and 8.7x FY2015E Bloomberg EPS respectively which
is lower than its 3-year average PE of 14.8x. Considering EIL’s dominance in the
hydrocarbon business and attractive valuations, we recommend Subscribe on the
stock.
Exhibit 7: 1-year forward P/E trend
600
500
400
300
200
100
0
Share Price (`)
6x
12x
18x
24x
Source: Angel Research, Bloomberg
Key concern
High dependence on government contracts
EIL bags a major portion of its order book from government entities funded by
government itself or multi-lateral development finance institutions. Hence, it is
remains susceptible to risks such as high regulatory scrutiny and delay in receipt of
collectibles.
February 5, 2014
4
Engineers India | FPO Note
Profit & Loss Statement (Standalone)
Y/E March (` cr)
FY2010
FY2011
FY2012
FY2013
Operating income
1,994
2,823
3,699
2,506
% chg
30.1
41.6
31.0
(32.2)
Total Expenditure
1,501
2,180
2,993
1,919
EBITDA
493
643
706
587
(% of Net Sales)
24.7
22.8
19.1
23.4
Depreciation& Amortization
13
15
19
11
EBIT
480
628
686
576
Interest & other Charges
3
4
4
1
Other Income
184
160
232
316
PBT
660
784
915
891
Tax
250
296
317
284
Deferred tax
(25)
(34)
(39)
(22)
PAT
435
523
636
629
Extraordinary items
10.3
0.4
26.5
30.2
Adjusted PAT
425
522
610
598
% chg
23.4
22.8
16.8
(1.9)
Basic EPS (`)
12.6
15.5
18.1
17.8
Balance Sheet (Standalone)
Y/E March (` cr)
FY2010
FY2011
FY2012
FY2013
SOURCES OF FUNDS
Equity Share Capital
56
168
168
168
Preference Capital
-
-
-
-
Reserves & Surplus
1,059
1,274
1,676
2,069
Shareholders’ Funds
1,115
1,442
1,844
2,238
Total Loans
-
-
-
-
Other liabilities
-
21
25
25
Total Liabilities
1,115
1,463
1,869
2,262
APPLICATION OF FUNDS
Net Block
60
60
53
50
Capital Work-in-Progress
12
13
52
136
Investments
101
512
635
653
Deferred Tax Asset
142
176
214
236
Current Assets
2,519
2,597
2,734
2,722
Cash
1,764
1,728
1,643
1,848
Loans & Advances
395
560
782
541
Inventories
43
1
1
1
Debtors
317
308
307
332
Current liabilities & Provisions
1,719
2,006
1,875
1,582
Net Current Assets
801
591
859
1,140
Other Assets
-
111
57
47
Total Assets
1,115
1,463
1,869
2,262
February 5, 2014
5
Engineers India | FPO Note
Cash Flow Statement (Standalone)
Y/E March (` cr)
FY2010
FY2011
FY2012
FY2013
Profit before tax
660
784
915
895
Depreciation
13
15
19
11
(Inc)/Dec in Working Capital
89
86
(299)
(45)
Others
(174)
(126)
(212)
(180)
Direct taxes paid
(233)
(266)
(317)
(240)
Cash Flow from Operations
355
493
107
441
(Inc.)/Dec.in Fixed Assets
(22)
(25)
(40)
(17)
(Inc.)/Dec. in Investments
228
(317)
108
(21)
Other income
-
-
-
-
Cash Flow from Investing
207
(342)
69
(38)
Issue of Equity
-
-
-
-
Inc./(Dec.) in loans
-
-
-
-
Dividend Paid (Incl. Tax)
(692)
(134)
(234)
(220)
Others
-
-
-
-
Cash Flow from Financing
(692)
(134)
(234)
(220)
Inc./(Dec.) in Cash
(131)
17
(59)
183
Opening Cash balances
1,894
1,764
1,728
1,643
Adjustments
(53)
(27)
22
Closing Cash balances
1,764
1,728
1,643
1,848
Key Ratios
Y/E March
FY2010
FY2011
FY2012
FY2013
Valuation Ratio (x)
P/E (on FDEPS)
11.9
9.7
8.3
8.4
P/CEPS
11.3
9.4
7.7
7.9
P/BV
4.5
3.5
2.7
2.3
EV/Sales
1.6
1.2
0.9
1.3
EV/EBITDA
6.6
5.2
4.8
5.5
Per Share Data (Rs)
EPS (Basic)
12.6
15.5
18.1
17.8
Cash EPS
13.3
15.9
19.5
19.0
Book Value
33.1
42.8
54.7
66.4
Returns (%)
RoCE (Pre-tax)
38.6
48.7
41.2
27.9
RoE
34.2
40.8
37.1
29.3
Solvency ratios (x)
Net debt to Equity
(1.6)
(1.2)
(0.9)
(0.8)
Net debt to EBITDA
(3.7)
(2.7)
(2.3)
(3.2)
February 5, 2014
6
Engineers India | FPO Note
Research Team Tel: 022 - 39357800
DISCLAIMER
This document is solely for the personal information of the recipient, and must not be singularly used as the basis of any investment
decision. Nothing in this document should be construed as investment or financial advice. Each recipient of this document should make
such investigations as they deem necessary to arrive at an independent evaluation of an investment in the securities of the companies
referred to in this document (including the merits and risks involved), and should consult their own advisors to determine the merits and
risks of such an investment.
Angel Broking Limited, its affiliates, directors, its proprietary trading and investment businesses may, from time to time, make
investment decisions that are inconsistent with or contradictory to the recommendations expressed herein. The views contained in this
document are those of the analyst, and the company may or may not subscribe to all the views expressed within.
Reports based on technical and derivative analysis center on studying charts of a stock's price movement, outstanding positions and
trading volume, as opposed to focusing on a company's fundamentals and, as such, may not match with a report on a company's
fundamentals.
The information in this document has been printed on the basis of publicly available information, internal data and other reliable
sources believed to be true, but we do not represent that it is accurate or complete and it should not be relied on as such, as this
document is for general guidance only. Angel Broking Limited or any of its affiliates/ group companies shall not be in any way
responsible for any loss or damage that may arise to any person from any inadvertent error in the information contained in this report.
Angel Broking Limited has not independently verified all the information contained within this document. Accordingly, we cannot testify,
nor make any representation or warranty, express or implied, to the accuracy, contents or data contained within this document. While
Angel Broking Limited endeavours to update on a reasonable basis the information discussed in this material, there may be regulatory,
compliance, or other reasons that prevent us from doing so.
This document is being supplied to you solely for your information, and its contents, information or data may not be reproduced,
redistributed or passed on, directly or indirectly.
Angel Broking Limited and its affiliates may seek to provide or have engaged in providing corporate finance, investment banking or
other advisory services in a merger or specific transaction to the companies referred to in this report, as on the date of this report or in
the past.
Neither Angel Broking Limited, nor its directors, employees or affiliates shall be liable for any loss or damage that may arise from or in
connection with the use of this information.
Note: Please refer to the important `Stock Holding Disclosure' report on the Angel website (Research Section). Also, please refer to the
latest update on respective stocks for the disclosure status in respect of those stocks. Angel Broking Limited and its affiliates may have
investment positions in the stocks recommended in this report.
February 5, 2014
7
Engineers India | FPO Note
6th Floor, Ackruti Star, Central Road, MIDC, Andheri (E), Mumbai- 400 093. Tel: (022) 39357800
Research Team
Fundamental:
Sarabjit Kour Nangra
VP-Research, Pharmaceutical
Vaibhav Agrawal
VP-Research, Banking
Bhavesh Chauhan
Sr. Analyst (Metals & Mining)
Viral Shah
Sr. Analyst (Infrastructure)
V Srinivasan
Analyst (Cement, FMCG)
Yaresh Kothari
Analyst (Automobile)
Ankita Somani
Analyst (IT, Telecom)
Sourabh Taparia
Analyst (Banking)
Bhupali Gursale
Economist
Vinay Rachh
Research Associate
Amit Patil
Research Associate
Twinkle Gosar
Research Associate
Tejashwini Kumari
Research Associate
Akshay Narang
Research Associate
Harshal Patkar
Research Associate
Nishant Sharma
Research Associate
Technicals:
Sameet Chavan
Technical Analyst
Derivatives:
Siddarth Bhamre
Head - Derivatives
Institutional Sales Team:
Mayuresh Joshi
VP - Institutional Sales
Meenakshi Chavan
Dealer
Gaurang Tisani
Dealer
Production Team:
Tejas Vahalia
Research Editor
Dilip Patel
Production
Angel Broking Ltd: BSE Sebi Regn No : INB 010996539 / CDSL Regn No: IN - DP - CDSL - 234 - 2004 / PMS Regn Code: PM/INP000001546 Angel Securities Ltd:BSE: INB010994639/INF010994639 NSE: INB230994635/INF230994635 Membership numbers: BSE 028/NSE:09946
Angel Capital & Debt Market Ltd: INB 231279838 / NSE FNO: INF 231279838 / NSE Member code -12798 Angel Commodities Broking (P) Ltd: MCX Member ID: 12685 / FMC Regn No: MCX / TCM / CORP / 0037 NCDEX : Member ID 00220 / FMC Regn No: NCDEX / TCM / CORP / 0302
February 5, 2014
8